module 6 energy accounting & audit_rdg matrl
TRANSCRIPT

7/28/2019 Module 6 Energy Accounting & Audit_Rdg Matrl
http://slidepdf.com/reader/full/module-6-energy-accounting-auditrdg-matrl 1/12
Distribution Efficiency and Demand-Side Management (DSM)Distribution Reform, Upgrades and Management (DRUM) Training Program
122
ENERGY AUDIT TO ASSESS LOSSES
CONCEPT OF ENERGY AUDIT
The power generated at various Thermal and Hydro Power Stations is stepped upto
EHV (132, 220 or 400 KV) and transmitted to load centres. It is further stepped downto 33 KV for sub-transmission and to 11 KV or LT for primary and secondarydistribution. Loss of energy is inevitable at each level of transformation and alsoduring transmission of power to load centres as each element in the system offersresistance. These losses are termed as "Technical Losses". Further, Commerciallosses occur due to meters stuck up or burnt, meters not read, meters sluggish,unmetered services, erroneous readings and of course pilferage. The total of "Technical" and 'Commercial" losses are termed as T&D losses in the system.
With each State Electricity Board now handling very large sums of energy to the tuneof several tens of thousands of MU per year, even 1 % of the losses amount to
several hundreds of Crores of Rupees. A concept of 'Comprehensive Energy Audit',to account for the units generated right down to units sold and the losses at eachlevel of transmission, sub-transmission, primary distribution and to finally draw up an'Energy Balance Sheet' has come into being in the State Electricity Board.
OBJECTIVE OF ENERGY AUDIT
Identification of areas of High Technical Losses and to take steps to reducethe same.
Arrive at system improvements necessary Obtain guidance for system planning. Identification of areas where commercial losses are very high and to take
remedial steps. Pinpointing areas where theft of energy by direct tapping is rampant and take
steps to plug up the leakages.
TECHNICAL LOSSES
The percentage losses as existing and the corresponding achievable figures areindicated in the table below:
SI.No.
System Element ExistingLevel%
%TargetLevel
Max.Tolerancelevel %
% of Col.3 toCol. 4
% of col.3 toCol. 5
1 2 3 4 5 6 7
1 Transmission System 4.50 2.00 4.00 225% 112%
2 Sub-Transmission System 4.00 2.25 4.50 178% 89%
3 Primary (HV) Distribution 7.00 3.00 5.00 233% 140%
4 Secondary (LV) Distribution 7.50 1.00 2.00 750% 375%
5 Total 23.00 8.25 15.50 279% 147%
National Productivity Council CORE International, Inc. DEVELOPMENT T HROUGH I NTERNATIONAL P ARTNERSHIPS
7/28/2019 Module 6 Energy Accounting & Audit_Rdg Matrl
http://slidepdf.com/reader/full/module-6-energy-accounting-auditrdg-matrl 2/12
Distribution Efficiency and Demand-Side Management (DSM)Distribution Reform, Upgrades and Management (DRUM) Training Program
123
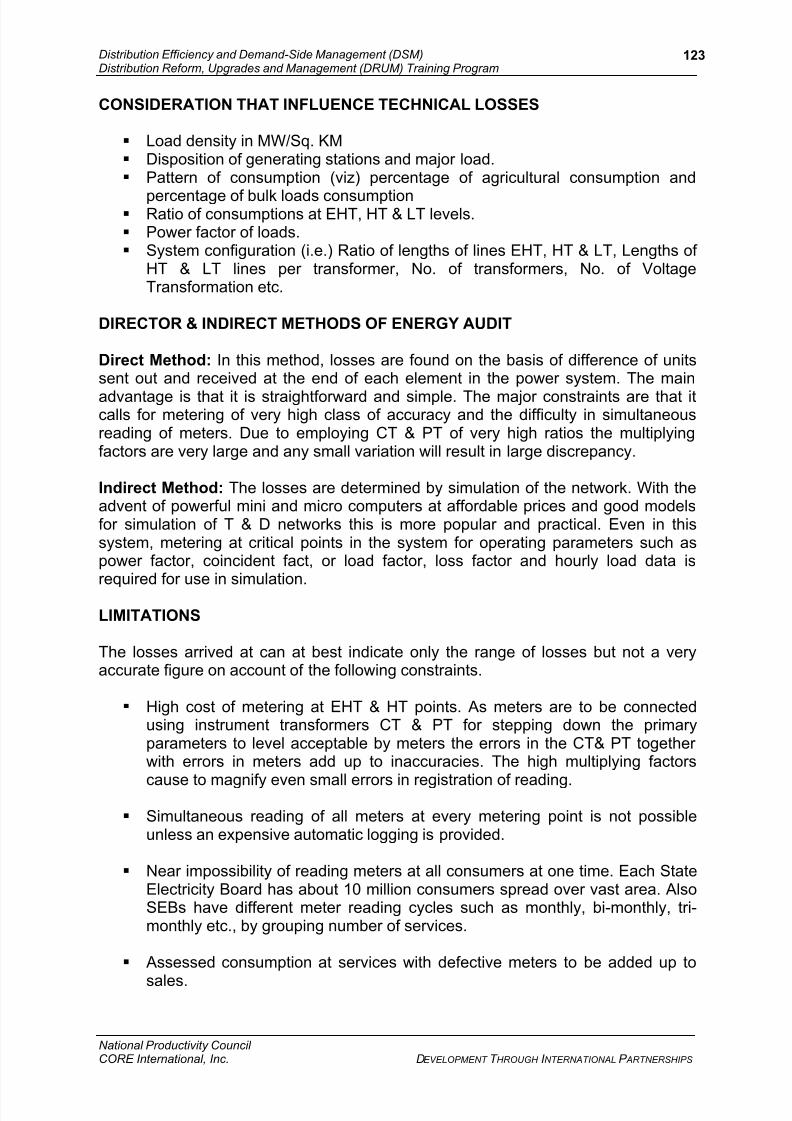
CONSIDERATION THAT INFLUENCE TECHNICAL LOSSES
Load density in MW/Sq. KM Disposition of generating stations and major load. Pattern of consumption (viz) percentage of agricultural consumption and
percentage of bulk loads consumption Ratio of consumptions at EHT, HT & LT levels. Power factor of loads. System configuration (i.e.) Ratio of lengths of lines EHT, HT & LT, Lengths of
HT & LT lines per transformer, No. of transformers, No. of VoltageTransformation etc.
DIRECTOR & INDIRECT METHODS OF ENERGY AUDIT
Direct Method: In this method, losses are found on the basis of difference of unitssent out and received at the end of each element in the power system. The main
advantage is that it is straightforward and simple. The major constraints are that itcalls for metering of very high class of accuracy and the difficulty in simultaneousreading of meters. Due to employing CT & PT of very high ratios the multiplyingfactors are very large and any small variation will result in large discrepancy.
Indirect Method: The losses are determined by simulation of the network. With theadvent of powerful mini and micro computers at affordable prices and good modelsfor simulation of T & D networks this is more popular and practical. Even in thissystem, metering at critical points in the system for operating parameters such aspower factor, coincident fact, or load factor, loss factor and hourly load data isrequired for use in simulation.
LIMITATIONS
The losses arrived at can at best indicate only the range of losses but not a veryaccurate figure on account of the following constraints.
High cost of metering at EHT & HT points. As meters are to be connectedusing instrument transformers CT & PT for stepping down the primaryparameters to level acceptable by meters the errors in the CT& PT together with errors in meters add up to inaccuracies. The high multiplying factors
cause to magnify even small errors in registration of reading.
Simultaneous reading of all meters at every metering point is not possibleunless an expensive automatic logging is provided.
Near impossibility of reading meters at all consumers at one time. Each StateElectricity Board has about 10 million consumers spread over vast area. AlsoSEBs have different meter reading cycles such as monthly, bi-monthly, tri-monthly etc., by grouping number of services.
Assessed consumption at services with defective meters to be added up to
sales.
National Productivity Council CORE International, Inc. DEVELOPMENT T HROUGH I NTERNATIONAL P ARTNERSHIPS

7/28/2019 Module 6 Energy Accounting & Audit_Rdg Matrl
http://slidepdf.com/reader/full/module-6-energy-accounting-auditrdg-matrl 3/12
Distribution Efficiency and Demand-Side Management (DSM)Distribution Reform, Upgrades and Management (DRUM) Training Program
124
Assessed consumption of unmetered services such as agriculture, have largebearing an arriving at the T&D losses.
ACTION TAKEN FOR ENERGY AUDIT
INTRODUCTION
Four different actions are taken to start with:
District Wise Energy Audit: Provides the losses in each District networkconsisting of 132 KV, 33 KV, 11 KV, and LT systems. The losses camp riseTechnical and Commercial losses.
220 KV, 132 KV and 33 KV Lines Energy Audit: Provides the losses in each220 KV, 132 KV, and 33 KV lines. These losses can be taken as Technicallosses and, as theft of power is very remote at these voltage levels.
11 KV Energy Audit: Provides the losses an each 11 KV feeder, consists of technical and commercial losses.
Distribution Transformer Energy Audit: Provides the losses in the LT networkunder each distribution transformer. The losses comprise Technical andCommercial Losses.
The status and action plan far performing each type of energy audit are discussed insucceeding Paras.
GAUGING OF AGRICULTURAL CONSUMPTION
Assessment made an agricultural consumption is often disputed as it is based on theestimates and also as it varies widely with cropping pattern, depth of ground water,acreage, season etc.
Hence, an attempt is made to estimate agricultural consumption by fixing meters at10 agricultural services per Mandal and selecting the wells with different cropping,acreage, water depths etc.
It would be necessary to increase the sampling to atleast 5% of total agriculturalservices to get meaningful results. Perhaps, a mare realistic approach may be toidentify distribution transformers feeding exclusively agricultural services and providemetering to arrive at the consumption in agricultural sector district wise. Toaccomplish this we need to provide metering an about 5000 distributiontransformers. The cast of such metering is Rs. 5 crores at the rate of Rs.10,000/- per transformer.
Estimation of agricultural consumption based an sample metering at ten pilotservices in each Mandal has revealed that the energy consumed in this sector is of the order of 7835 MU far 1996-97.
National Productivity Council CORE International, Inc. DEVELOPMENT T HROUGH I NTERNATIONAL P ARTNERSHIPS

7/28/2019 Module 6 Energy Accounting & Audit_Rdg Matrl
http://slidepdf.com/reader/full/module-6-energy-accounting-auditrdg-matrl 4/12
Distribution Efficiency and Demand-Side Management (DSM)Distribution Reform, Upgrades and Management (DRUM) Training Program
125
CALCULATION OF SYSTEM LOSSES
District wise import/export points are identified and energy meters are provided ateach point and energy input to the system is arrived at. Monthly figures of totalenergy sold under each category in the district are collected and the agricultural
consumption is assessed as indicated in above para. The energy losses in a districtare calculated. A return should be sent to Board by Superintending Engineer (Operation) every month as part of MIS.
CALCULATION OF ENERGY LOSSES IN THE VARIOUS ELEMENTS OF POWERSYSTEM
The following procedure may be adopted for calculation of energy losses in thevarious elements of power system in the District.
a) LOSSES IN EHT FEEDERS AND CONNECTED EQUIPMENT
The energy exported from send end and received at the receiving and are comparedevery month and energy losses arrived at :
Energy meters should be provided at all the identified points. The meter readings at the both ends should be taken on the same day every
month at precisely at a fixed time. The net energy sent out on 33 KV feeders emanating from each EHT sub
station are to be arrived at. Also arrive the energy exported to other sub stations and areas normally fed
by other areas. Arrive at the total energy sent out from all the EHT sub-stations. Obtain total energy handled by the identified EHT and H.T. feeders from the
various generating stations/switch stations/sub-stations. Arrive the EHT line and connected equipment losses (6-5)
b) 33 KV FEEDER WISE AND CONNECTED EQUIPMENT LOSSES
Meters shall be provided for all 33 KV feeders emanating from EHT substation(i.e.) 220 KV substation or 132 KV substation.
A feeder may be feeding one or more 33/11 KV sub station enroute. No
metering need be provided on the incoming and outgoing 33 K. V. feeders of enroute substations in the first instance, if the same is not available. Provide a meter on LV side of each power transformer immediately to assess
the demand and energy handled by substation. Provide metering for individual 11 KV feeders emanating from all substations. The line losses for the complete 33 KV feeder may be evaluated as shown
below.
National Productivity Council CORE International, Inc. DEVELOPMENT T HROUGH I NTERNATIONAL P ARTNERSHIPS

7/28/2019 Module 6 Energy Accounting & Audit_Rdg Matrl
http://slidepdf.com/reader/full/module-6-energy-accounting-auditrdg-matrl 5/12
Distribution Efficiency and Demand-Side Management (DSM)Distribution Reform, Upgrades and Management (DRUM) Training Program
126
Let a 33 KV feeder from EHT SS feed three substations A1, A2, A3 with the followingdetails:
SI. No.Name of the Sub-
stationTransformer
Capacity
Units sent out from 33/11KV S.S i.e. sum of units
sent out on all 11 KVfeeders from the 33/11 KV
SS or sum of unitsrecorded on LV side of
power transformers
1 A1 2 x 1.5 E1
2 A2 2 x 3.15 E2
3 A3 2 x 5.0 E3
If there are any 33 KV H.T. consumers on the feeder let the consumption of the H.T.consumers be E-4.
Let the units sent out on 33 KV feeder at EHT SS be X, the line losses on 33 KVfeeder and the 33/11 KV transformers are = X - (E1 + E2 + E3 + E4).
The transformer losses can be estimated from the data given below:
Power transformersCapacity
No load losses Kilowatts/hour
Full load losses kilowatts/hour
0.5 MVA 3.2 6.4
1.6 MVA 3.0 16.0
3.15 MVA 4.5 23.05.0 MVA 6.5 34.0
8.0 MVA 8.5 50.0
Transformer losses if each transformer = No load loss x no. of hours the transformer is in service during the month.+ Full load copper loss x no. of hours the transformer is in service during the month xloss factor. Loss factor = 0.8 x (LF) + 0.2 x LF
Where LF is the load factor Load Factor may be calculated as follows
Total units sent out of the SS in the monthL.F. = ------------------------------------------------------------------------------------
(No. of Hrs. the ss) x (maximum demand of ss) was in service
A monthly return for 33 KV feeder losses should be sent to Board by SuperintendingEngineer (Operation)
National Productivity Council CORE International, Inc. DEVELOPMENT T HROUGH I NTERNATIONAL P ARTNERSHIPS
7/28/2019 Module 6 Energy Accounting & Audit_Rdg Matrl
http://slidepdf.com/reader/full/module-6-energy-accounting-auditrdg-matrl 6/12
Distribution Efficiency and Demand-Side Management (DSM)Distribution Reform, Upgrades and Management (DRUM) Training Program
127
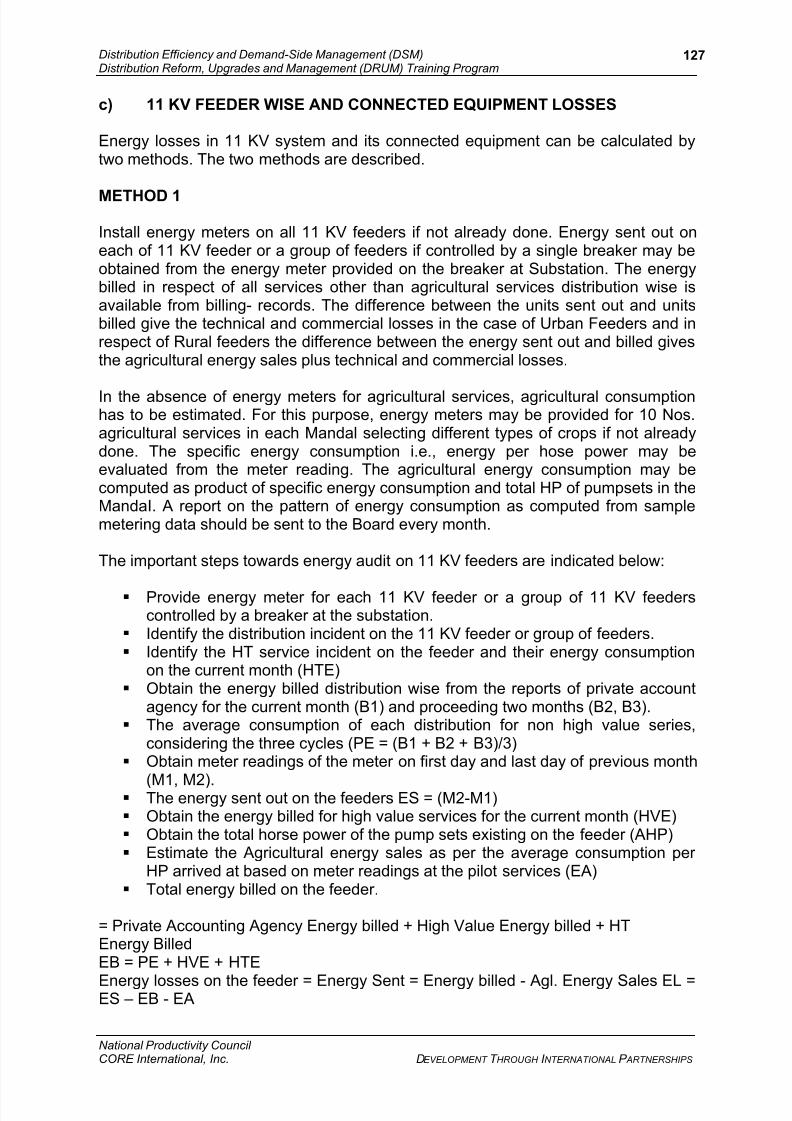
c) 11 KV FEEDER WISE AND CONNECTED EQUIPMENT LOSSES
Energy losses in 11 KV system and its connected equipment can be calculated bytwo methods. The two methods are described.
METHOD 1
Install energy meters on all 11 KV feeders if not already done. Energy sent out oneach of 11 KV feeder or a group of feeders if controlled by a single breaker may beobtained from the energy meter provided on the breaker at Substation. The energybilled in respect of all services other than agricultural services distribution wise isavailable from billing- records. The difference between the units sent out and unitsbilled give the technical and commercial losses in the case of Urban Feeders and inrespect of Rural feeders the difference between the energy sent out and billed givesthe agricultural energy sales plus technical and commercial losses.
In the absence of energy meters for agricultural services, agricultural consumptionhas to be estimated. For this purpose, energy meters may be provided for 10 Nos.agricultural services in each Mandal selecting different types of crops if not alreadydone. The specific energy consumption i.e., energy per hose power may beevaluated from the meter reading. The agricultural energy consumption may becomputed as product of specific energy consumption and total HP of pumpsets in theMandaI. A report on the pattern of energy consumption as computed from samplemetering data should be sent to the Board every month.
The important steps towards energy audit on 11 KV feeders are indicated below:
Provide energy meter for each 11 KV feeder or a group of 11 KV feederscontrolled by a breaker at the substation.
Identify the distribution incident on the 11 KV feeder or group of feeders. Identify the HT service incident on the feeder and their energy consumption
on the current month (HTE) Obtain the energy billed distribution wise from the reports of private account
agency for the current month (B1) and proceeding two months (B2, B3). The average consumption of each distribution for non high value series,
considering the three cycles (PE = (B1 + B2 + B3)/3) Obtain meter readings of the meter on first day and last day of previous month
(M1, M2). The energy sent out on the feeders ES = (M2-M1) Obtain the energy billed for high value services for the current month (HVE) Obtain the total horse power of the pump sets existing on the feeder (AHP) Estimate the Agricultural energy sales as per the average consumption per
HP arrived at based on meter readings at the pilot services (EA) Total energy billed on the feeder.
= Private Accounting Agency Energy billed + High Value Energy billed + HTEnergy BilledEB = PE + HVE + HTE
Energy losses on the feeder = Energy Sent = Energy billed - Agl. Energy Sales EL =ES – EB - EA
National Productivity Council CORE International, Inc. DEVELOPMENT T HROUGH I NTERNATIONAL P ARTNERSHIPS

7/28/2019 Module 6 Energy Accounting & Audit_Rdg Matrl
http://slidepdf.com/reader/full/module-6-energy-accounting-auditrdg-matrl 7/12
Distribution Efficiency and Demand-Side Management (DSM)Distribution Reform, Upgrades and Management (DRUM) Training Program
128
METHOD 2
Install energy meters on all distribution transformers incident on the feeder. Theenergy sent out from each distribution transformer for the current month may be
computed from the meter readings. The difference between the energy sent out onthe feeder and sum of the energy sent out on the distribution transformers incidenton the feeder gives technical and commercial losses of the feeder. This is a rigorousmethod but very expensive. It may be performed on one urban feeder and one ruralfeeder in each district. This method helps in analysis of low voltage network lossesalso as meters are provided on the LV side of the distribution transformer. Aquarterly return on line losses of 11 KV feeders shall be sent to Board bySuperintending Engineer (Operation).
d) LOW VOLTAGE NETWORK LOSSES
In this case also energy losses can be calculated by two methods. In the firstmethod, energy sent out from distribution transformer is measured by providing anenergy meter. In the second method, it is estimated. The two methods are described.
METHOD 1
Meters are to be provided on LV side of distribution transformer to obtain energysent out. Energy billed for different class of customers incident on the distributiontransformer is computed from billing records. The energy sales on each distributiontransformer can be automatically computed if the customer-billing database is linkedupto with distribution location database. First of all the distribution transformers willhave to be given a location code No. and the procedure for coding the distributiontransformer is described below:
Then the consumers incident on each distribution transformer have to be identified.For this purpose an additional field 'Transformer location code' is added in theconsumer database. Then the energy billed for each-distribution transformer iscomputed automatically. The private accounting agencies have to be advised tofurnish every month energy sales distribution transformer wise, The differencebetween the energy sent out and energy billed gives the technical and commerciallosses of the LV network.
METHOD 2
In this method, energy meter is not installed and the energy sent is estimated bytaking readings of current and voltage at peak load with tong tester. The energy sentout is 3 x Current in Amps. X Voltage (Phase - Phase) x Load Factor x Power Factor.The load factor and power factor are estimated by taking sample readings andconsidering load characteristics. Rest of the procedure is same as Method 1. Thismethod does not require any additional investment and can be performed as a partof maintenance of transformer. Alternatively, the specific energy consumption for KVA of transformer capacity or KVA of maximum demand incident on transformer is
calculated and compared with the estimates obtained for distribution transformer of similar characteristics in the area.
National Productivity Council CORE International, Inc. DEVELOPMENT T HROUGH I NTERNATIONAL P ARTNERSHIPS
7/28/2019 Module 6 Energy Accounting & Audit_Rdg Matrl
http://slidepdf.com/reader/full/module-6-energy-accounting-auditrdg-matrl 8/12
Distribution Efficiency and Demand-Side Management (DSM)Distribution Reform, Upgrades and Management (DRUM) Training Program
129
Specific energy Consumption =
Energy billed----------------------------------------------------------------------------------------------
(Tong tester amps x 3 x voltage on LV side of DTR) or DTR capacity
National Productivity Council CORE International, Inc. DEVELOPMENT T HROUGH I NTERNATIONAL P ARTNERSHIPS

7/28/2019 Module 6 Energy Accounting & Audit_Rdg Matrl
http://slidepdf.com/reader/full/module-6-energy-accounting-auditrdg-matrl 9/12
Distribution Efficiency and Demand-Side Management (DSM)Distribution Reform, Upgrades and Management (DRUM) Training Program
130
MEASURES FOR LOSS REDUCTION
TECHNICAL LOSS REDUCTION
Objective :
Energy losses takes place in the Electricity Delivery Chain due to various reasons.The objective loss reduction is to reduce the losses taking place at various levels of this chain. The losses primarily takes place due to the following: -
a) Transformation Losses (at various transformation levels)b) High I
2R losses
Reduction of technical losses can takes place through following measures: -
i) Optimum feeder utilization
ii) Proper conductor sizingiii) Proper sizing of distribution transformers
a. Avoid using very lightly loading transformer b. Use of HVDS
iv) Reactive power managementv) Reducing the drawl of electrical energy at lower voltage to the extent
possiblevi) Reduction in number of transformersvii) Use of low loss equipmentsviii) Voltage regulation, avoiding under voltage supply and over loading of
transformers and linesix) Reducing the breakdown – every breakdown coupled with line faults
means loss of energy
APPROACH TOWARDS TECHNICAL LOSS REDUCTION
In India, the Distribution System is primarily a radial system. With proper planningand renovation of the existing network, the losses can be reduced ideally. The lossesin the distribution should be less than 10%.
COMMERCIAL LOSS REDUCTION
Objective
Commercial losses are those losses which can be captured and re supplied asremunerative energy supply. Commercial losses have two components, one isunauthorized use of electricity and second is due to the billing non-compliance.Unauthorized use can be reduced with proper identification of areas where lossesare taking place and due accountability supported by technical interventions likeHVDS, smart energy meters, etc. Particularly, the commercial losses can be reducedby using following measures: -
i) Accurate and efficient meteringii) Regular consumer survey
National Productivity Council CORE International, Inc. DEVELOPMENT T HROUGH I NTERNATIONAL P ARTNERSHIPS

7/28/2019 Module 6 Energy Accounting & Audit_Rdg Matrl
http://slidepdf.com/reader/full/module-6-energy-accounting-auditrdg-matrl 10/12
Distribution Efficiency and Demand-Side Management (DSM)Distribution Reform, Upgrades and Management (DRUM) Training Program
131
iii) Metering and energy accounting at various levels of supply chain i.e.feeder metering, DT metering and consumer metering
iv) Supply of electricity at high voltages to the nearest point of consumption toavoid unauthorized use through hooking etc.
v) Prompt reading, bill preparation and its delivery supported by consumer
friendly bill payment mechanism, consumer should have several options of paying their monthly bills like through banks, credit cards, internet, chequedrop boxes, etc.
vi) Prompt release of new connectionsvii) Reducing the billing cycle and concerted effort to liquidate arrears
ADMINISTRATIVE
CASH LOSS REDUCTION
Primarily the cash loss is the gap between income and expenditure of a distribution
entity where income comprises the earnings from various streams of revenue, theexpenditure has primarily two major heads
i) Energy purchase costii) Energy Management/handling cost
The gap between income and expenditure can be reduced either through increasingincome or reducing the expenditure or both. All the commercial and technical lossreduction measures will increase the income of a DISCOM. In addition followingadditional measures can be exercised to increase the income.
a) Reducing the non re-enumerative energyb) Increasing the sale of re-enumerative energyc) Judicious use of fixed and current assets .
On expenditure front, the technical loss reduction measures will form the main areaof improvement in addition to the following: -
i) By reducing the recurring O&M expensesii) By reducing the breakdown maintenance expensesiii) By reducing the establishment expenses
iv) By reducing the interest outgov) Proper management of equity and depreciationvi) By reducing the energy purchase cost (Buy electricity from the grid at the
optimum cost and appropriate time and in appropriate quantity.
BEST PRACTICES
Many of the SEBs/DISCOMs have adopted measures to improve the viability of thedistribution system. The experiences from these measures have remained limited tocertain pockets. In order to bring in wide spread awareness of the initiatives and theresults achieved thereof a committee for documenting the best practices has been
constituted which would provide a forum for exchange of information. Theproceedings of the deliberations would be distributed to all SEBs/DISCOMs so that
National Productivity Council CORE International, Inc. DEVELOPMENT T HROUGH I NTERNATIONAL P ARTNERSHIPS

7/28/2019 Module 6 Energy Accounting & Audit_Rdg Matrl
http://slidepdf.com/reader/full/module-6-energy-accounting-auditrdg-matrl 11/12
Distribution Efficiency and Demand-Side Management (DSM)Distribution Reform, Upgrades and Management (DRUM) Training Program
132
they can avail of the experience of others. Some of the major area of thrust whichhave been proposed thro' intervention by AcCs are in the field of 'IT' enabling (GISbased mapping, Customer indexing, asset coding, computerized billing and revenuemanagement system, Computerised sub-station data acquisition system etc), HighVoltage distribution system (HVDS or Less LT system), Energy audit with the help of
Feeder and DT metering, identification of feeder managers, execution of works onTurnkey concept for better time and quality management etc.
Consequent to implementation of APDRP work activity for development of modelcircles in the country, it has been noticed that many of the SEBs/DISCOMs haveadopted innovative technical and administrative measures which have been stated tohave improved the commercial and technical performance in that particular state.
The efforts and initiatives of the committee constituted by MOP to facilitate sharing of 'first hand experience' of practicing states and involvement of larger segment of states under APDRP ambit have shown encouraging results. There has been
progressive increase in adoption of these practices by more and more SEBs.The area of these practices and the names of some of the new entrant utilities aregiven below:
1. High Voltage Distribution System (HVDS)
Based on the feedback received from Andhra Pradesh and Greater Noida whereHVDS schemes have been operational in urban and rural applications MadhyaPradesh have taken up a pilot project of HVDS at Bhopal. The investment onconversion from conventional system to HVDS is recovered by way of loss reductionwithin a period of 3 to 5 years in most cases.
2. Supervisory Control and Data Acquisition (SCADA) System
Andhra Pradesh, Mumbai, Coochbehar (WB) Rajasthan and Tamil Nadu SEB havefully operational and functional SCADA system for control, monitoring andmanagement of distribution system in. This system has given improved operationalefficiency of distribution system, better load management, scheduling of preventivemaintenance, reduced outages and early restoration of feeders/ transformers andbetter customer satisfaction. Bihar, Karnataka, Goa, UP and Haryana have alsodecided to implement SCADA systems.
3. GIS Based Mapping, Customer indexing and asset coding
Dakshin Haryana Bijli Vitaran Nigam Ltd. (DHBVNL) has initiated action for fieldsurvey and customer indexing of consumers in 5 Circles under APDRP. Chattisgarhand Uttaranchal and Uttar Haryana Bijli Vitaran Nigam Ltd. (UHBVNL) are alsofollowing this practice and are preparing for carrying out this work. This would enablethe respective Utilities to increase their customer coverage, regularization of un-registered/un-authorised connections, auditing at feeder level by comparison of 'Energy sent out' on a 11 kV feeder with total energy meter reading of all HT/LTcustomers in that particular feeder. This is a positive step towards better energy
management envisaged for model APDRP Circles.
National Productivity Council CORE International, Inc. DEVELOPMENT T HROUGH I NTERNATIONAL P ARTNERSHIPS

7/28/2019 Module 6 Energy Accounting & Audit_Rdg Matrl
http://slidepdf.com/reader/full/module-6-energy-accounting-auditrdg-matrl 12/12
Distribution Efficiency and Demand-Side Management (DSM)Distribution Reform, Upgrades and Management (DRUM) Training Program
National Productivity Council CORE International, Inc. DEVELOPMENT T HROUGH I NTERNATIONAL P ARTNERSHIPS
133
4. Meter reading & spot Billing
Kerala SEB has initiated a project for reduction of time taken for meter reading, billprinting, and distribution to consumer in 82 sections of their distribution areas. This isproposed to be done by way of Computerised billing system using Hand Held Unit
(HHU) to be carried by Meter readers. The concept is already adopted by AndhraPradesh and is generally acknowledged as innovative and appreciated by customersin urban areas.
5. Pre Paid Metering
Uttaranchal has invited expression of interest for pre paid metering and is goingahead with implementation of pilot 3 areas. Chattisgarh is also working towards prepaid metering.
Continuous endeavors are being made for sharing the information of these utilities.
Such sessions would be conducted periodically to bring in greater awareness.