module 3.6 intermediate hydrologic modeling€¦ · ok for piped system with direct discharge to a...
TRANSCRIPT

1

2
INSTRUCTORS
REBECCA DUGOPOLSKI, PE
KRISTEN MATSUMURA
Staff Engineer
Key project experience: Stormwater monitoring, design,
and hydrologic modeling
Senior Engineer
Key project experience: Stormwater monitoring, design, hydrologic modeling and NPDES Permit compliance

3
PROGRAM OVERVIEW
• 2012: Public and private partners engage state legislature to fund program
• June 2012: LID Training Steering Committee convened
• 2012‐2013: Washington State LID Training Plan developed: www.wastormwatercenter.org/statewide‐lid‐training‐program‐plan
• 2014: Training program built from state LID Training Plan

4
PROGRAM OVERVIEW
• Implement second phase of trainings (September 2014 through May 2015)
• 49 trainings offered in western and eastern WA first year
• 45 trainings scheduled for western and eastern WA in current phase (through June 2016)
• Three levels: Introductory, Intermediate, and Advanced
• Statewide LID Certificate now available

5
PROJECT LEAD
ADDITIONAL TRAINING SUPPORT
OVERVIEW OF PROGRAM
CORE TEAM

6
Introduction to LID for Inspection & Maintenance Staff
INTRODUCTORY INTERMEDIATE ADVANCED
Intermediate LID Design: Rainwater Collection Systems & Vegetated Roofs
Intermediate LID Topics: NPDES Phase I & II Requirements
Intermediate LID Design: Permeable Pavement
Intermediate LID Design: Hydrologic Modeling
Advanced Topics in LID Design:Bioretention
Advanced Topics in LID Design:Permeable Pavement
Advanced Topics in LID Design:Hydrologic Modeling
Advanced Topics in LID Design: Site Assessment, Planning & Layout
Advanced Topics in LID Design: Rainwater Collection Systems & Vegetated Roofs
Advanced Topics in LID Design: Bioretention Media and Compost Amended Soils
OVERVIEW OF PROGRAM
Advanced Topics for Long‐term LID Operations: Bioretention
Intermediate LID Design: Bioretention
Advanced Topics for Long‐term LID Operations: Permeable Pavement
Intermediate LID Design: Site Assessment, Planning & Layout
Introduction toLID for Inspection & Maintenance Staff
Introduction toLID for Developers & Contractors: Make Money be Green

7
Introduction to LID for Inspection & Maintenance Staff
INTRODUCTORY INTERMEDIATE ADVANCED
Intermediate LID Design: Rainwater Collection Systems & Vegetated Roofs
Intermediate LID Topics: NPDES Phase I & II Requirements
Intermediate LID Design: Permeable Pavement
Intermediate LID Design: Hydrologic Modeling
Advanced Topics in LID Design:Bioretention
Advanced Topics in LID Design:Permeable Pavement
Advanced Topics in LID Design:Hydrologic Modeling
Advanced Topics in LID Design: Site Assessment, Planning & Layout
Advanced Topics in LID Design: Rainwater Collection Systems & Vegetated Roofs
Advanced Topics in LID Design: BioretentionMedia and Compost Amended Soils
OVERVIEW OF PROGRAM
Advanced Topics for Long‐term LID Operations: Bioretention
Intermediate LID Design: Bioretention
Advanced Topics for Long‐term LID Operations: Permeable Pavement
Intermediate LID Design: Site Assessment, Planning & Layout
Introduction toLID for Inspection & Maintenance Staff
Introduction toLID for Developers & Contractors: Make Money be Green

8
LOGISTICS
SCHEDULE
• 4‐hour classroom training with one break
OTHER LOGISTICS
• Restroom location
• Food
• Turn off cell phones
• Sign in and sign out

9
INTERMEDIATE LID DESIGN HYDROLOGIC MODELING
Training ProgramStatewide LID

10
introduction
hydrologic modeling basics
performance standards
BMP modeling specifics
wrap up
AGENDA

11
introduction
2345
12
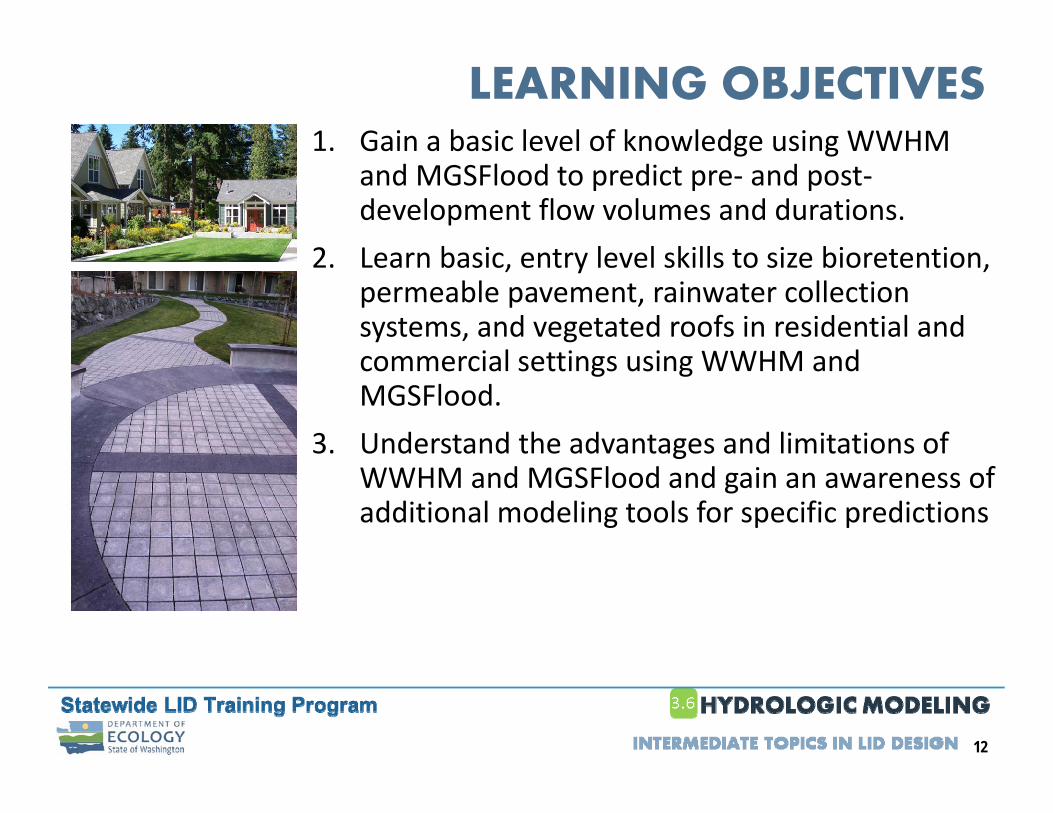
LEARNING OBJECTIVES1. Gain a basic level of knowledge using WWHM
and MGSFlood to predict pre‐ and post‐development flow volumes and durations.
2. Learn basic, entry level skills to size bioretention, permeable pavement, rainwater collection systems, and vegetated roofs in residential and commercial settings using WWHM and MGSFlood.
3. Understand the advantages and limitations of WWHM and MGSFlood and gain an awareness of additional modeling tools for specific predictions

13
LID PRINCIPLES: Pre‐developed forestINTRODUCTION
2012 LID Technical Guidance Manual for Puget Sound

14
LID PRINCIPLES: Developed conditionINTRODUCTION
2012 LID Technical Guidance Manual for Puget Sound

15
LID PRINCIPLES: Stormwater ImpactsINTRODUCTION
=?
HOW DO WE GET THERE?• Quantify the effects of development• Size and evaluate the performance of stormwater management practices

16
TRADITIONALLY…• Primarily detention and large scale infiltration
• Detention pond/vault/pipe or infiltration pond/gallery
REGIONAL MANAGEMENTINTRODUCTION

17
• Detention hydrograph (single event)
• Match peak flows, increased duration: OK for piped system with direct discharge to a lake or ocean? OK for discharge to a creek? OK for discharge to a wetland?
Runo
ff (cfs)
Runo
ff (cfs)
Rainfall (in
)Rainfall (in
)
Rainfall (in)
Pre‐developed Runoff (cfs)
Post‐developed Runoff (cfs)
Managed Runoff (cfs)
Rainfall (in)
Pre‐developed Runoff (cfs)
Post‐developed Runoff (cfs)
Managed Runoff (cfs)
Time (hrs)Time (hrs)
Runo
ff (cfs)
Rainfall (in
)
Rainfall (in)
Pre‐developed Runoff (cfs)
Post‐developed Runoff (cfs)
Managed Runoff (cfs)
Time (hrs)
REGIONAL MANAGEMENTINTRODUCTION

18
May limit erosive flows in stream but we have not mimicked hydrologic cycle (no evaporation, no groundwater recharge, different hydrograph)
+ Detention≠
INTRODUCTION
REGIONAL MANAGEMENT

19
Detention (continuous simulation) Match peaks and durations
Durations percent of time a particular flow occurs
0
0.1
0.2
0.3
0.4
0.5
0.6
0.7
0.8
0.000001 0.00001 0.0001 0.001 0.01 0.1 1.0
Exceedance Probability
Flow
(cfs
)
Predeveloped Postdeveloped
INTRODUCTION
FLOW DURATIONS

20
INFILTRATION VS DETENTIONInfiltrating Facilities Detention Facilities
If not detention, then what?
INTRODUCTION
FLOW DURATIONS

21
LOW IMPACT DEVELOPMENT (LID): Stormwater Management Strategy
INTRODUCTION
• Site design & planning techniques emphasizing conservation
• Use of small‐scale & distributed engineered controls to closely mimic pre‐development hydrologic processes
• Minimizing the concentration of stormwater
• Careful assessment of site soils and strategic site planning to best use those soils for stormwater management

22
LID Principles: Site Design And PlanningINTRODUCTION
• Minimize disturbance
• Reduce impervious surface
• Protect and restore native soils and vegetation
• Manage stormwater close to the source in a system of distributed practices
• Disconnect impervious surfaces
Traditional LID

23
LID BMPs: Small‐Scale Engineering ControlsINTRODUCTION
• Infiltration
• Filtration
• Storage
• Evaporation
• Transpiration
Synonyms for LID BMPs:
Green Stormwater Infrastructure (GSI), Integrated Management Practices (IMPs), and On-Site Stormwater Management BMPs
Conserve or regain pre‐developed hydrologic
functions

24
1
345
hydrologic modeling basics
25
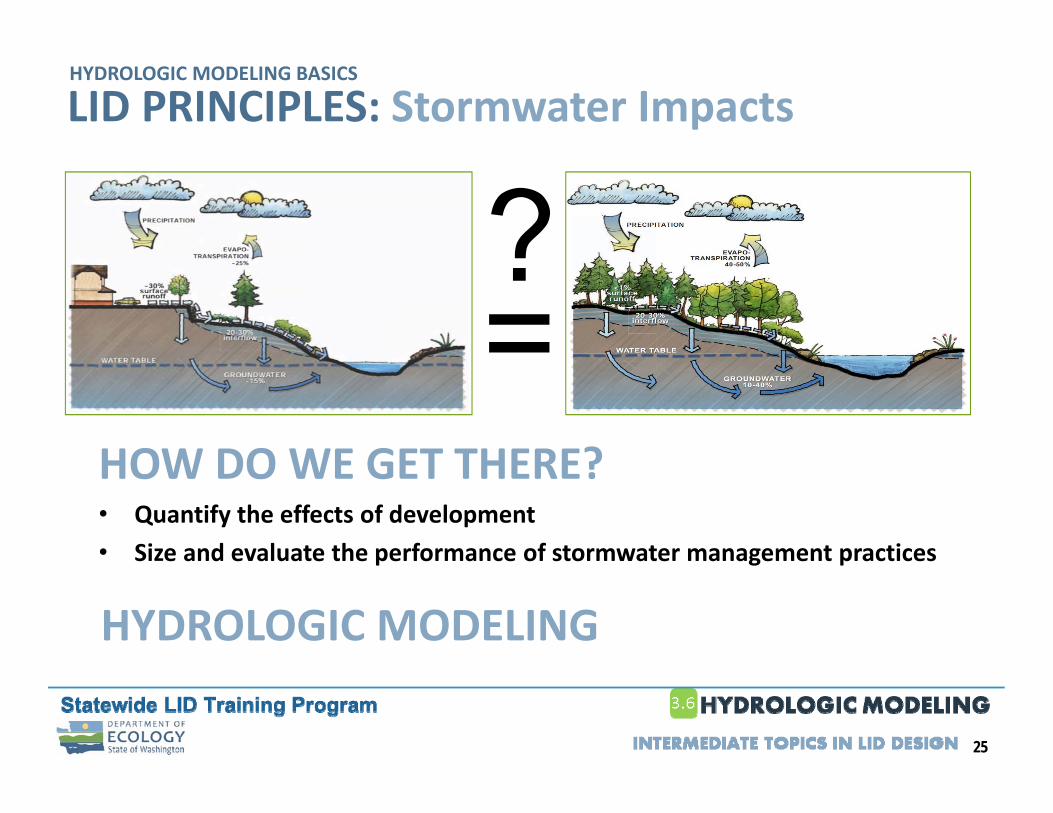
LID PRINCIPLES: Stormwater Impacts
=?
HOW DO WE GET THERE?• Quantify the effects of development• Size and evaluate the performance of stormwater management practices
HYDROLOGIC MODELING
HYDROLOGIC MODELING BASICS

26
PURPOSE OF HYDROLOGIC MODELINGHYDROLOGIC MODELING BASICS
• A: Use of mathematical equations to estimate hydrologic cycle components and facility performance based on:
• Weather patterns
• Land use
• Soil
• Topography
Source: http://www.und.nodak.edu/
• Q: What is hydrologic modeling?
27
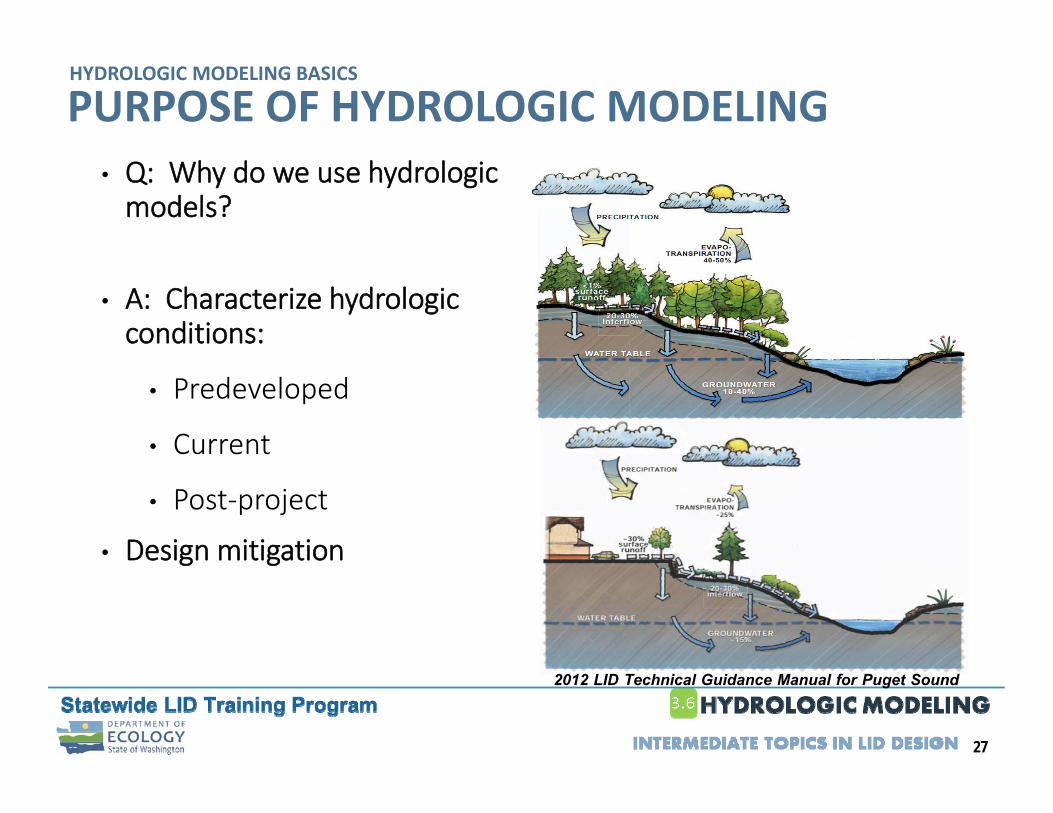
PURPOSE OF HYDROLOGIC MODELINGHYDROLOGIC MODELING BASICS
• Q: Why do we use hydrologic models?
• A: Characterize hydrologic conditions:
• Predeveloped
• Current
• Post‐project
• Design mitigation
2012 LID Technical Guidance Manual for Puget Sound

28
PURPOSE OF HYDROLOGIC MODELINGHYDROLOGIC MODELING BASICS
• Q: When does hydrologic modeling enter into your project?
• A: Start to finish
• Preliminary design (sizing)
• Final design (optimization)
• Demonstrate requirements met (permit submittals)
29
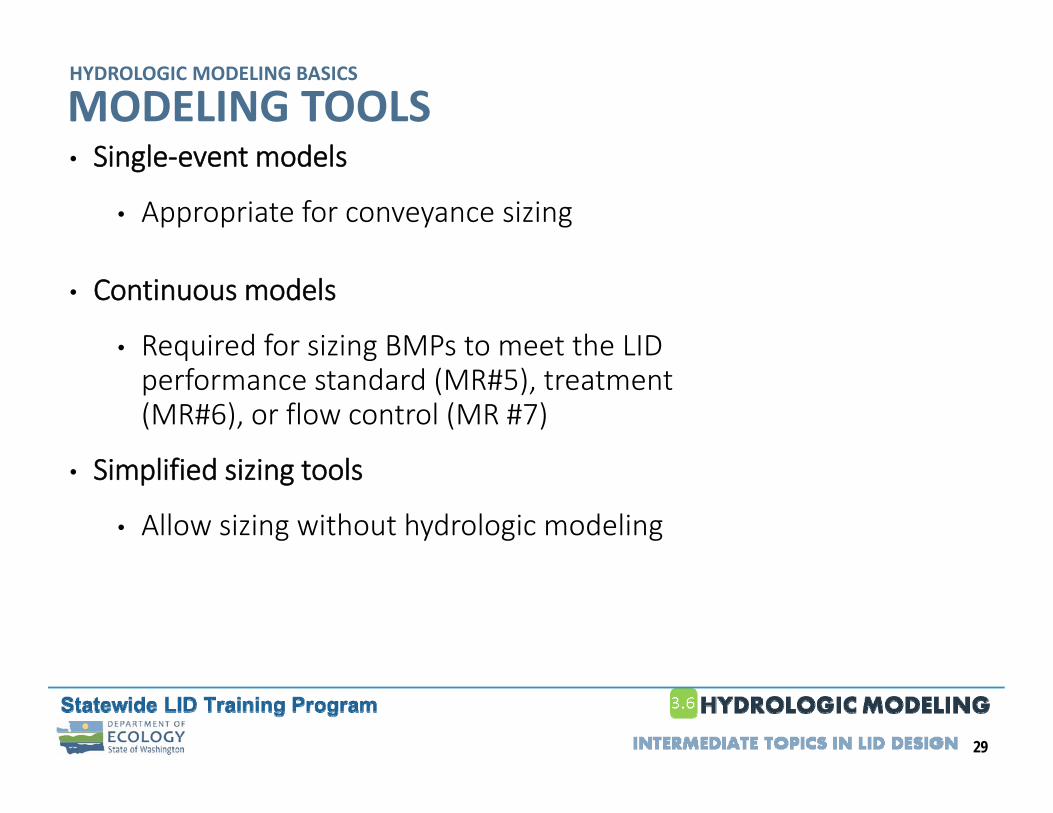
MODELING TOOLSHYDROLOGIC MODELING BASICS
• Single‐event models
• Appropriate for conveyance sizing
• Continuous models
• Required for sizing BMPs to meet the LID performance standard (MR#5), treatment (MR#6), or flow control (MR #7)
• Simplified sizing tools
• Allow sizing without hydrologic modeling

30
MODELING TOOLS: Single‐Event ModelsHYDROLOGIC MODELING BASICS
• Input single storm event, typically synthetic
• Output peak flow rates
• Typical methods and models
• SCS
• SBUH
• Rational Method
• StormShed
• HydroCAD
• SWMM
• HEC‐HMS
• SUSTAIN
Runo
ff (cfs)
Rainfall (in
)
Rainfall (in)
Pre‐developed Runoff (cfs)
Post‐developed Runoff (cfs)
Time (hrs)
31
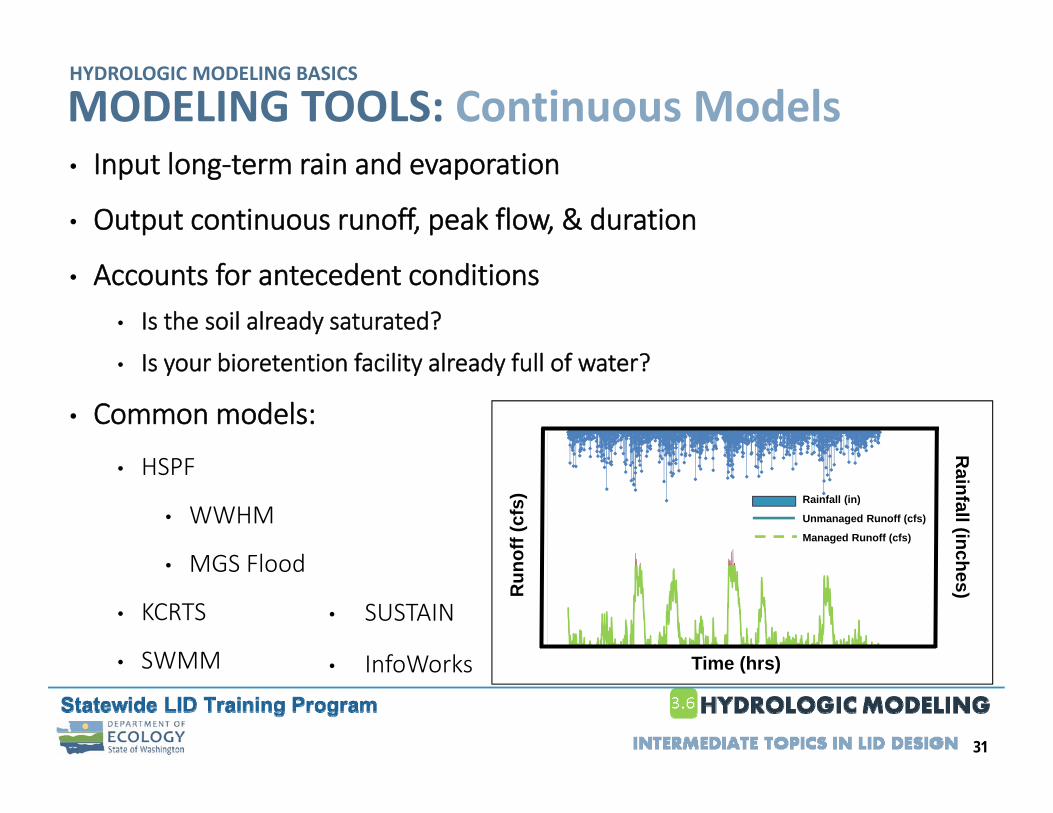
MODELING TOOLS: Continuous ModelsHYDROLOGIC MODELING BASICS
• Input long‐term rain and evaporation
• Output continuous runoff, peak flow, & duration
• Accounts for antecedent conditions• Is the soil already saturated?
• Is your bioretention facility already full of water?
• Common models:
• HSPF
• WWHM
• MGS Flood
• KCRTS
• SWMM Time (hrs)
Run
off (
cfs)
Rainfall (inches)
Rainfall (in)
Unmanaged Runoff (cfs)
Managed Runoff (cfs)
• SUSTAIN
• InfoWorks

32
MODELING TOOLS: WWHM/MGSFlood Input• Meteorological Data
• Rainfall (5‐min, 15‐min, hourly)• Evaporation (daily)
• Land Cover Types• Regional calibrated parameters (Dinicola 1990)• Impervious areas
• Timing: slope, length of flow path, surface roughness• Volume: depression storage
• Pervious areas • Timing: slope, length of flow path, surface roughness• Volume: depression storage, vegetative cover, soil type
• BMP Configurations
HYDROLOGIC MODELING BASICS

33
Meteorological Data Select precipitation region Select mean annual
precipitation depth
MGS Flood
MODELING TOOLS: WWHM/MGSFlood InputHYDROLOGIC MODELING BASICS

34
Meteorological Data Select precipitation region Select mean annual
precipitation depth
MODELING TOOLS: WWHM/MGSFlood InputHYDROLOGIC MODELING BASICS

35
Meteorological Data Select precipitation region Select mean annual
precipitation depth
MODELING TOOLS: WWHM/MGSFlood InputHYDROLOGIC MODELING BASICS

36
MGS Flood
Land Cover
SWMM
By comparison…
MODELING TOOLS: WWHM/MGSFlood InputHYDROLOGIC MODELING BASICS

37
MODELING TOOLS: Simplified Sizing ToolsHYDROLOGIC MODELING BASICS
• Kitsap County: Pavement sized as function of contributing impervious area and precipitation
BMP Design Infilt. Rate (in/hr)
Flow Control Standard (MR #7) Sizing Equation
M B
Permeable Pavement Facility
6 inch ponding depth
0.25 0.1100 ‐ 1.0536Area (sf) = Impervious Area (sf) x [M x Precip. (in) + B] 0.5 0.0187 + 0.4945
1.0 0.0048 + 0.3531
Permeable Pavement Surface
Slope <= 2%0.13 – 0.249 0.005 0 Aggregate Depth (in) =
M x Precip. (in) ≥ 0.25 0.01 0

38
MODELING TOOLS: Simplified Sizing ToolsHYDROLOGIC MODELING BASICS
GSI‐CalcKitsap County Pre‐Sized Calculator

39
21
45
performance standards

40
NPDES MUNICIPAL STORMWATER PERMIT: Minimum Requirements (MRs)
PERFORMANCE STANDARDS
1. Preparation of Stormwater Site Plans
2. Construction Stormwater Pollution Prevention Plan (SWPPP)
3. Source Control of Pollution
4. Preservation of Natural Drainage Systems and Outfalls
5. On‐Site Stormwater Management
6. Run‐off Treatment
7. Flow Control
8. Wetlands Protection
9. Operations and Maintenance

41
Implementation options:• List #1 • List #2 • LID Performance Standard
MINIMUM REQUIREMENT #5
SEA Street
PERFORMANCE STANDARDS

42
MR #5 applies to:
MINIMUM REQUIREMENT #5
Projects triggering MR #1‐#5 only
List #1 or LID Performance Standard Applies
Projects triggering MR
#1‐#9
List #2 or LID Performance Standard Applies
PERFORMANCE STANDARDS

43
Project Type & Location RequirementDevelopment (new or redevelopment) on any parcel inside the UGA, or development outside the UGA on a parcel less than 5 acres
LID Performance Standard and BMP T5.13
OR
List #2
(applicant option)
Development (new or redevelopment) outside the UGA on a parcel of 5 acres or larger
LID Performance Standard and BMP T5.13
MINIMUM REQUIREMENT #5: Projects Triggering MR #1‐#9
PERFORMANCE STANDARDS

44
MINIMUM REQUIREMENT #5: List Option
Consider all the BMPs in the order listed and use the first BMP that is considered feasible.
Roofs Other Hard SurfacesLawn and Landscaped Areas
PERFORMANCE STANDARDS

45
MINIMUM REQUIREMENT #5: List #1Roofs Other Hard Surfaces
1. Full Dispersion or Downspout Full Infiltration (T5.30 or T5.10A)
2. Rain Gardens or Bioretention (T5.14A or B)> 5% of drainage area
3. Downspout Dispersion Systems (T5.10B)
4. Perforated Stub‐out Connections (T5.10C)
1. Full Dispersion (T5.30)
2. Permeable Pavement, Rain Gardens, or Bioretention• (T5.15, T5.14A, T5.14B)• Rain Garden or Bioretention
area > 5% of drainage area
3. Sheet Flow Dispersion, or Concentrated Flow Dispersion (T5.12 or T5.11)
Lawn and Landscaped Areas
1. Soil Quality and Depth (BMP T5.13)
PERFORMANCE STANDARDS

46
MINIMUM REQUIREMENT #5: LIST #2Roofs Other Hard Surfaces
1. Full Dispersion or Downspout Full Infiltration (T5.30 or T5.10A)
2. Bioretention (T5.14B)> 5% of drainage area
3. Downspout Dispersion Systems (T5.10B)
4. Perforated Stub‐out Connections (T5.10C)
1. Full Dispersion (T5.30)
2. Permeable Pavement (T5.15)
3. Bioretention( T5.14B)> 5% of drainage area
4. Sheet Flow Dispersion, or Concentrated Flow Dispersion (T5.12 or T5.11)
Lawn and Landscaped Areas
1. Soil Quality and Depth (BMP T5.13)
PERFORMANCE STANDARDS

47
Source: Ecology SWMMWW Presentation
Match pre‐developed durations from 8% of the 2‐year peak flow to 50% of the 2‐year peak flow
MINIMUM REQUIREMENT #5: LID PERFORMANCE STANDARD
Flow Control
LID LID Performance Standard addresses lower, more frequent stormwater flows
Flow Control Standard
addresses higher, less frequent
stormwater flows
PERFORMANCE STANDARDS

48
MINIMUM REQUIREMENT #6 and #7:PERFORMANCE STANDARDS
• Runoff treatment (MR #6)
• Infiltrate 91 percent of the total runoff volume through soil meeting Ecology treatment criteria (for infiltration BMPs)
• Flow Control (MR# 7)
• Match pre‐developed discharge rates from 50% of the 2‐year peak flow up to the full 50‐year peak flow
• Other flow control standards
• Combined sewer or capacity constrained basins (peak‐based standards): apply only in specific cities with flow control exempt areas with limited conveyance capacity
• Wetland protection

49
FLOW DURATION STANDARDSPERFORMANCE STANDARDS
• LID performance standard (MR #5)
• Flow control (MR #7)
LIDFlow Control

50
Precipitation: 38 inches annually (Seattle)
Predeveloped condition: Forest on till
Design Infiltration Rate: 0.25 inch/hour
MR 5: LID Standard
5,000 sf
5.1%
MR 6: Treatment Standard
5,000 sf
345 sf
6.2%
PERFORMANCE STANDARDS
SIZING COMPARISON EXAMPLE: Bioretention Configuration: Vertical walls
Ponding depth: 6 inches
MR 7: Flow Duration Standard
5,000 sf
1090 sf
27.8%
240 sf

51
LID COST ANALYSIS: Small Commercial
Scenario 7 to 10
Lot 1 AcreTotal Impervious 35,500 sf
Roof Area 5,000 sf
PERFORMANCE STANDARDS

52
LID COST ANALYSIS: Results Scenario 8
Scenario 8 – Small Commercial – 2005 – Till
Soil Quality and Depth
Detention Tank
Stormwater Treatment Planter Vault
HMA Parking
PERFORMANCE STANDARDS

53
LID COST ANALYSIS: Results Scenario 10
Scenario 10 – Small Commercial – 2012 – Till
Soil Quality and Depth
Bioretention
HMA Parking
Detention Tank
PERFORMANCE STANDARDS

54
LID COST ANALYSIS: 2005 manualPERFORMANCE STANDARDS

55
LID COST ANALYSIS: 2012 manual (with LID)PERFORMANCE STANDARDS

56
21
3
5BMP modeling specifics

57
7
1
DISPERSION
BIORETENTION PERMEABLE PAVEMENT
REVERSE SLOPE SIDEWALKS
VEGETATED ROOFS
2 3 4
5 6 7
CISTERNS
MINIMAL EXCAVATION FOUNDATIONS

58
7
1
DISPERSION
BIORETENTION PERMEABLE PAVEMENT
REVERSE SLOPE SIDEWALKS
VEGETATED ROOFS
2 3 4
5 6 7
CISTERNS
MINIMAL EXCAVATION FOUNDATIONS

59
• Shallow landscaped depressions that receive stormwater from small contributing areas
• Small scale, dispersed facilities
• Types:
• With underdrain
• Without underdrain
• With underdrain and liner
• Onsite, Flow Control, and Water Quality Performance
BIORETENTION: Definition and TypesBMP MODELING SPECIFICS

60
BIORETENTION: Without Underdrain• Relies on infiltration to native soil
• Can meet on‐site list requirement
• Can provide effective WQ treatment for some pollutants
• Can meet the flow control standard (MR #7) for many soil conditions
BMP MODELING SPECIFICS
Ecology

61
BIORETENTION: With Underdrain• Some infiltration to native soil
• Can meet on‐site list requirement (List #2 requires the underdrain to be elevated at least 6 inches)
• Can provide effective WQ treatment for some pollutants
• May not be able to meet flow control standard (MR #7) alone, but can help to achieve flow control goals (raised underdrain and orifice improve performance)
BMP MODELING SPECIFICS
Ecology

62
BIORETENTION: With Underdrain and Liner• No infiltration to native soil
• Can provide effective WQ treatment for some pollutants
Cannot meet flow control standard (MR #7) alone, but can help to achieve flow control goals (orifice improves performance)
BMP MODELING SPECIFICS

63
BIORETENTION: Current Modeling Guidelines• Implicit Method (2012 LID Manual)
• Lump surface ponding and storage in bioretention soil if
• Subgrade infiltration rate < long‐term bioretention soil infiltration rate
• Slope ≤ 1 %
• Effective depth = ponding depth + bioretention soil depth x void ratio (%)
• MGS Flood and WWHM3
• Neglects movement of water through layers
BMP MODELING SPECIFICS

64
BIORETENTION: Current Modeling Guidelines
Native soil infiltration rate
Bioretention soil thickness and porosity
Freeboard
Side slope
“Swale” bottom area and slope
Riser height
Riser diameter
Inflow
Effective depth
Piping Native Soil
Key : Effective subsurface storage
Overflow
Subsurface storage modeled as effective storage depth (soil depth x porosity)
Bioretention soil
BMP MODELING SPECIFICS
Implicit Method

65
BIORETENTION: Current Modeling Guidelines• Explicit Method
• Explicitly represents:• Surface ponding
• Infiltration into bioretention soil and native soil
• Storage in bioretention soil
• Overflow
• Underdrain flow
• MGSFlood4, WWHM4, WWHM2012
BMP MODELING SPECIFICS

66
BIORETENTION: Current Modeling Guidelines
Native soil infiltration rate
Bioretention soil thickness and porosity
Diameter and elevation of underdrain (if any)
Piping Underdrain
Subbase
AggregateKey :
Bioretention Soil
Freeboard
Side slope
“Swale” bottom area and slope
Bioretention soil infiltration rate
Riser height
Riser diameter
* Showing “riser outlet structure” (alternative: “vertical orifice and overflow”)
Inflow
Effective depth
Overflow
BMP MODELING SPECIFICS
Explicit Method

67
BIORETENTION: Model Representation
Contributing area
Precipitation
Evaporation
Runoff/Interflow
Infiltration to native
Bioretention Module
Point o
f Com
plianceSurface
storage
Precipitation
Evaporation
Underdrain flow
Piping
Underdrain
Native SoilAggregate
Key : Bioretention Soil
Subsurface storage (voids)
Overflow
Infiltration to soil
Where flow control standard must be met *
To GW
BMP MODELING SPECIFICS
* Can be met with a combination of bioretention and downgradient retention/detention facilities

68
BIORETENTION: Model Representation
Surface SSD Table0.83’
Surface storage
Infiltration to soil
Overflow
0’
Stage(ft)
Area (ac)
Storage (ac‐ft)
Discharge (cfs)
Infilt.(cfs)
0.0 0 0 0 0
0.2 0.0070 0.0056 0 0.0035
0.4 0.0075 0.0058 0 0.0038
0.6 0.0081 0.0060 0 0.0041
0.8 0.0086 0.0063 0 0.0044
0.9 0.0089 0.0064 0.8 0.0045
1.0 0.0092 0.0065 1.5 0.0046
BMP MODELING SPECIFICS
Explicit Surface Routing

69
BIORETENTION: Sizing for LID Performance Standard• WWHM2012 Example‐ Explicit Method
• Site in Seattle
• Size bioretention cell to meet LID Performance Standard
• Predeveloped condition = forest on till
• Native soil is till (0.3 inch/hour design infiltration rate)
• Bioretention cell (12” ponding depth, no underdrain)
• Receiving runoff from 2,000 sf of impervious area (0.046 acres)
• Using bioretention module in WWHM2012
• 15 minute time‐step
BMP MODELING SPECIFICS

70
BIORETENTION: Sizing for LID Performance Standard
• Precipitation/Evap. Data Select county and location on map
• Computational Time Step 15 minutes
Option Menu
BMP MODELING SPECIFICS

71
BIORETENTION: Sizing for LID Performance Standard
Predeveloped Basin Select area, soil type, land cover and slope
BMP MODELING SPECIFICS
72
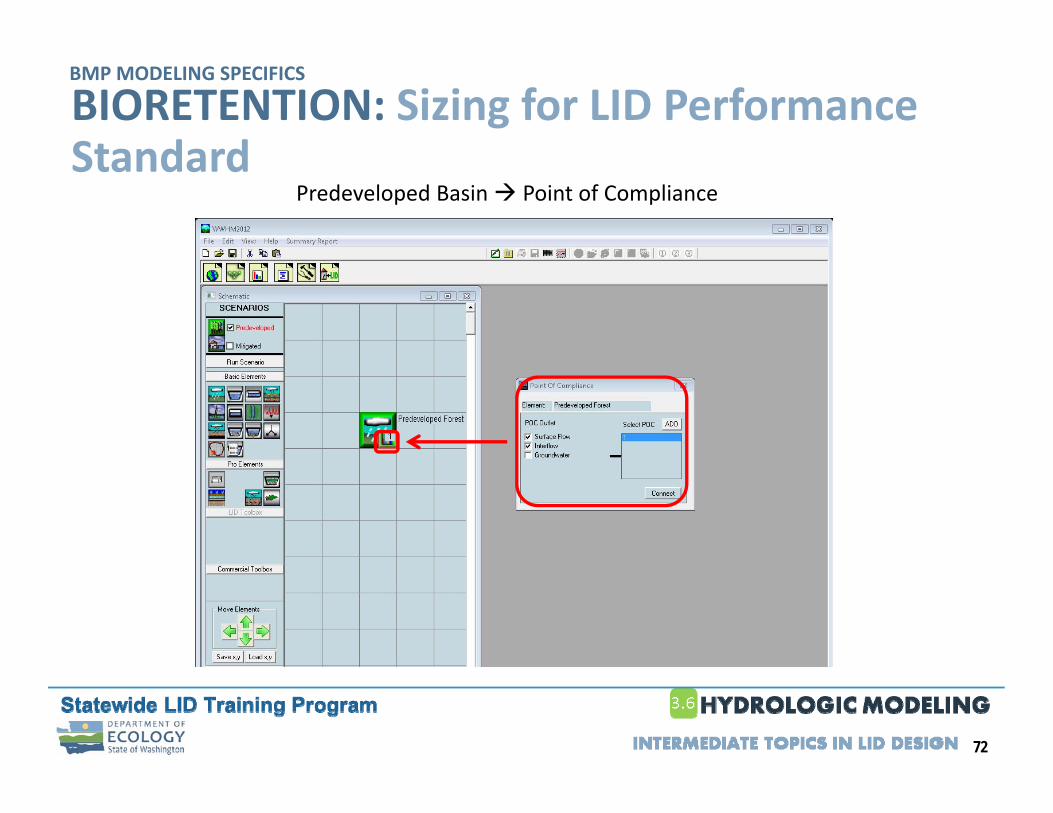
BIORETENTION: Sizing for LID Performance Standard
Predeveloped Basin Point of Compliance
BMP MODELING SPECIFICS

73
BIORETENTION: Sizing for LID Performance Standard
Developed Mitigated Basin Impervious with same area and slope….
BMP MODELING SPECIFICS

74
BIORETENTION: Sizing for LID Performance Standard
Developed Mitigated Basin (continued): Route to Bioretention Module
BMP MODELING SPECIFICS

75
BIORETENTION: Sizing for LID Performance Standard
Developed Mitigated Basin (continued): Characterize Bioretention
Dimensions
BSM
Infiltration to Native Soil
Outlet & Ponding Depth
Name
BMP MODELING SPECIFICS

76
BIORETENTION: Sizing for LID Performance Standard
Soil Inputs
BMP MODELING SPECIFICS
Wilting point (cm3 water/ cm3 soil)
Porosity (decimal)Saturated hydraulic conductivity (cm/hr)
* 15.24 cm/hr = 6 in/hr (this value will need to be manually updated to 30.48 cm/hr in order to use the 12 in/hr BSM infiltration rate allowed in the 2014 SWMMWW)
Van Genuchten number (constant)Alpha hydraulic parameter constant (constant)
Hydraulic parameter constant (constant)Bubbling pressure head (cm)

77
BIORETENTION: Sizing for LID Performance Standard
Stage Storage Discharge Table
BMP MODELING SPECIFICS

78
BIORETENTION: Sizing for LID Performance Standard
Flow Duration Curve‐ Developed Unmitigated (Impervious)
50% 2‐yr
8% 2‐yr
GOAL
BMP MODELING SPECIFICS
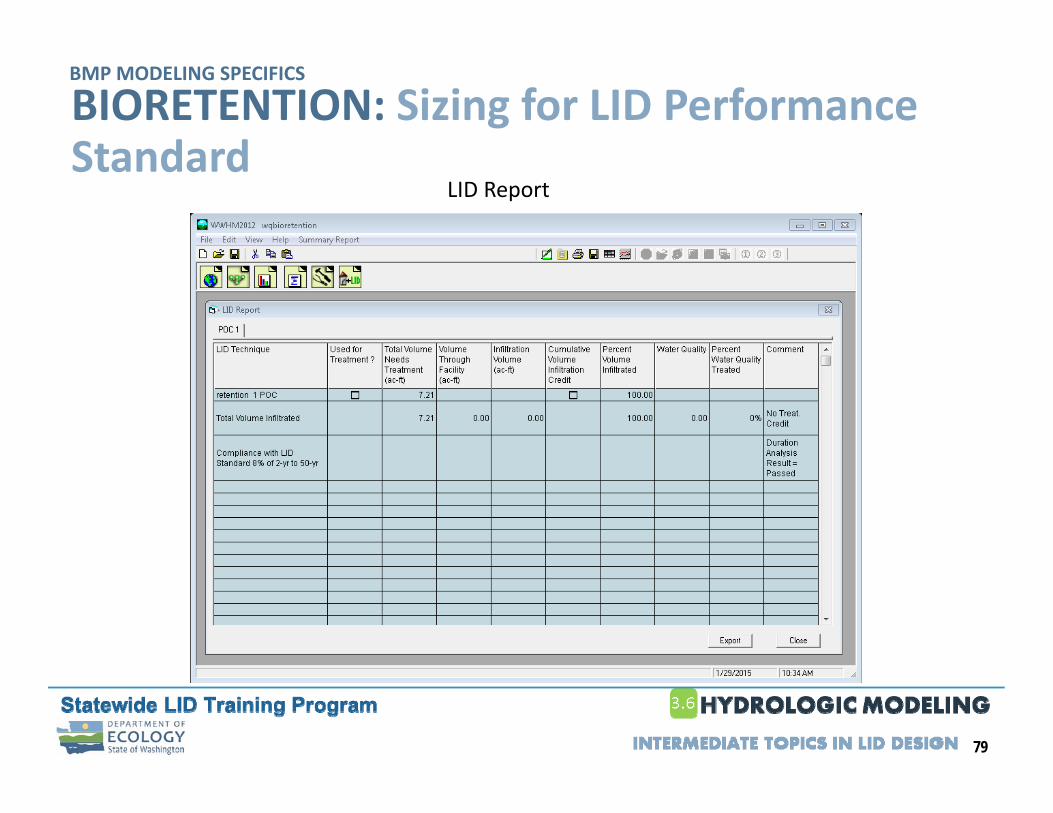
79
BIORETENTION: Sizing for LID Performance Standard
LID Report
BMP MODELING SPECIFICS

80
BIORETENTION: Sizing for LID Performance Standard
Iteratively Sized Bioretention Area to Meet Duration Standard
Bioretention bottom area = 20 sf (1% of contributing impervious area) Footprint area = 65 sf (3.3% of contributing impervious area)
(given 12” ponding, 6” freeboard, 3:1 side slopes)
Infiltrates almost 90% runoff
BMP MODELING SPECIFICS

81
BIORETENTION: Sizing for Flow ControlFlow Frequency Results
BMP MODELING SPECIFICS

82
BIORETENTION: Sizing for Flow ControlFlow Frequency Results
Use Gringorten or WeibullMethod for low annual flows
BMP MODELING SPECIFICS

83
BIORETENTION: Sizing for Flow ControlIteratively Sized Bioretention Area to Meet Duration Standard
Bioretention bottom area = 370 sf (18.5% of contributing impervious area) Footprint area = 550 sf (27.5% of contributing impervious area)
(given 12” ponding, 6” freeboard, 3:1 side slopes)
Infiltrates almost 100% runoff
BMP MODELING SPECIFICS

84
BIORETENTION: Water Quality TreatmentIteratively Size to Infiltrate 91% Runoff File
Bioretention bottom area= 22.8 sf (1.14% of contributing impervious area) Footprint area = 76.8 sf (3.8% of contributing impervious area)
(given 12” ponding, 6” freeboard, 3:1 side slopes)
Infiltrates 91%
BMP MODELING SPECIFICS

85
BIORETENTION: Water Quality TreatmentCheck Drawdown Criterion‐WQ volume infiltrated through facility in 48 hours
Volume infiltrated in 48 hrs = ponding area at mid‐depth x infiltration rate x 48 hrs = 40.8 sf x 0.3 in/hr x 48 hours = 49 cf = 0.001124 acre‐ft < 0.001 acre‐ft
Does not meet Ecology recommendation
BMP MODELING SPECIFICS
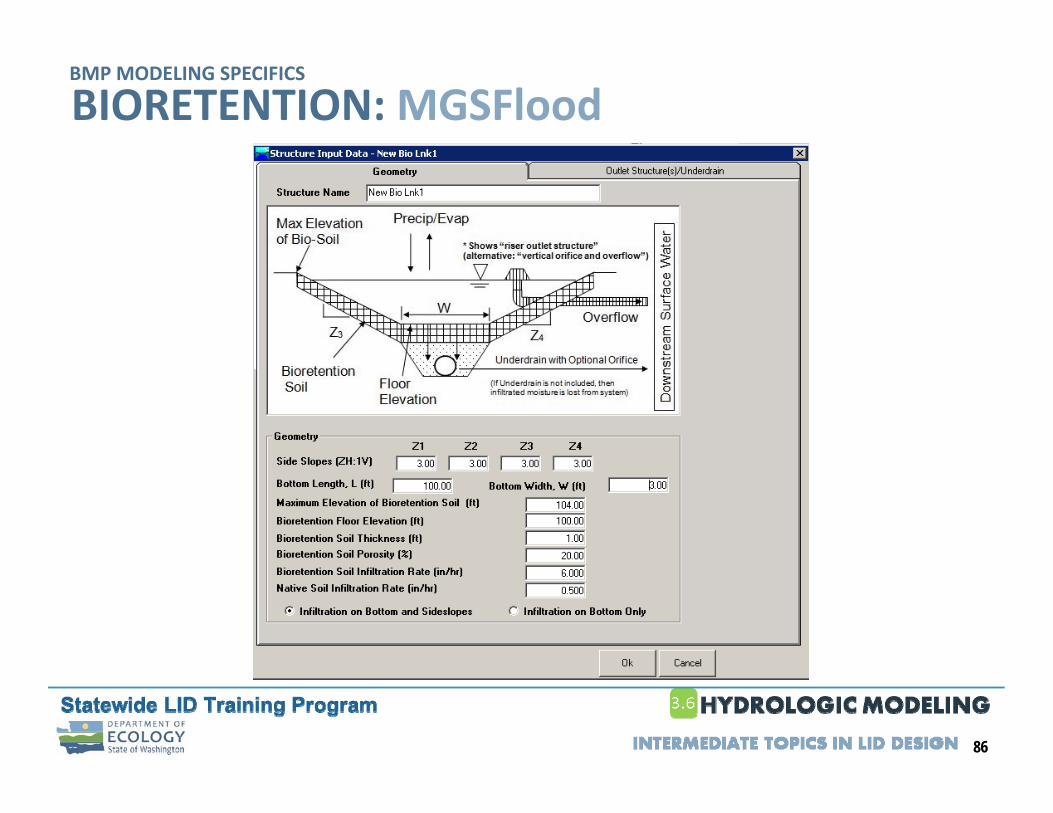
86
BIORETENTION: MGSFloodBMP MODELING SPECIFICS

87
GSI-Calc Overview

88
GSI‐Calc Overview• Sizing tool for LID BMPs as a function of:
• Site precipitation region & mean annual precip
• Contributing impervious area
• Predominant site soil type (till or outwash)
• Native soil design infiltration rate
• Assist developers & reviewers to size/ design LID without continuous modeling
• Reduce barriers to LID implementation
BMP MODELING SPECIFICS

89
GSI‐Calc Applicability• Lowland areas of Western WA
• Up to 1,500 feet above sea level
• Higher elevations impacted by snow accumulation/melt
• Projects subject to selected standards:• Ecology flow control standard in MR #7* (match 50% of 2‐year to 50‐year to forest condition)
• Ecology treatment standard for infiltration BMPs(infiltration 91% through soil meeting requirements)
• Kitsap County predeveloped recharge standard*(Kitsap County only)
*Predeveloped forest on till and outwash soil evaluated
BMP MODELING SPECIFICS

90
• Native Soil Infiltration Rates:• Predominantly underlain by till: 0.125 to >0.5 in/hr
• Predominantly underlain by outwash: 0.5 to >3 in/hr
• Contributing Area = Impervious Surface• If a drainage area is mix of impervious and pervious (and the pervious area requires mitigation), could use total area for conservative facility size
• Hope to add pervious surface runoff into future version
GSI‐Calc ApplicabilityBMP MODELING SPECIFICS

91
• Bioretention (3H:1V side slopes)• with and without underdrain
• Linear Bioretention (3H:1V side slopes)• without underdrain
• Bioretention Planter (vertical walls)• with underdrain
• Permeable Pavement Surface• low slope and higher slope
• Newly Planted and Retained Trees
Area Sizing Equations
Aggregate Sizing Equations
Flow Control Credits
LID BMPsBMP MODELING SPECIFICS

92
Precipitation Modeled
Western Coastal Region: 70 & 90 in/yr
Vancouver Castle Rock Corridor: 40, 56, & 80 in/yr
Western Puget Sound: 32, 40, 48, 56, & 80 in/yr
Eastern Puget Sound: 24, 40, 48, 56, & 80 in/yr
Selected prec/evaptimeseries were
modeled for each region
BMP MODELING SPECIFICS

93
GSI‐Calc TourSite Precipitation zone
Enter manually or use Google Earth
Mean annual precipitation (in)
BMP MODELING SPECIFICS

94
GSI‐Calc TourGoogle Earth option
BMP MODELING SPECIFICS

95
GSI‐Calc Tour
Applicable design standard
Site predominant soil types
Area requiring mitigation
BMP MODELING SPECIFICS

96
GSI‐Calc Tour
Design infiltration rate
Ponding depth
Bioretention bottom area
Square or linear facility
BMP MODELING SPECIFICS

97
EXERCISE

98
Break

99
7
1
DISPERSION
BIORETENTION PERMEABLE PAVEMENT
REVERSE SLOPE SIDEWALKS
VEGETATED ROOFS
2 3 4
5 6 7
CISTERNS
MINIMAL EXCAVATION FOUNDATIONS
100
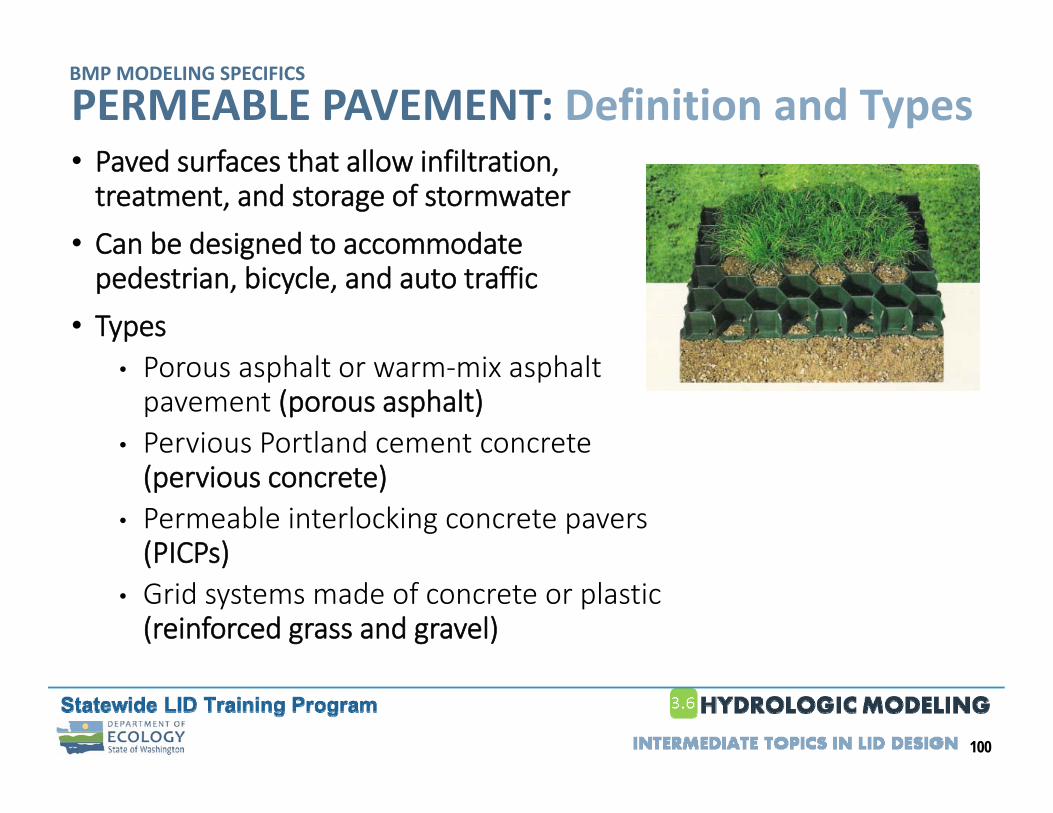
PERMEABLE PAVEMENT: Definition and Types• Paved surfaces that allow infiltration, treatment, and storage of stormwater
• Can be designed to accommodate pedestrian, bicycle, and auto traffic
• Types• Porous asphalt or warm‐mix asphalt pavement (porous asphalt)
• Pervious Portland cement concrete (pervious concrete)
• Permeable interlocking concrete pavers (PICPs)
• Grid systems made of concrete or plastic (reinforced grass and gravel)
BMP MODELING SPECIFICS

101
PERMEABLE PAVEMENT: 0‐2% subgrade slope
Rainfall
• Can neglect lateral flow
• Subsurface storage depth modeled = aggregate thickness
Lateral flow along relatively impermeable
subbase
BMP MODELING SPECIFICS

102
PERMEABLE PAVEMENT: > 2 to 5% subgrade slope without berms
• Cannot neglect lateral flow
• Subsurface storage depth modeled = average subsurface ponding depth (when no berms, may be estimated as = 1/2”)
Rainfall
BMP MODELING SPECIFICS

103
PERMEABLE PAVEMENT: > 2 to 5% subgrade slope with berms
• Cannot neglect lateral flow
BMP MODELING SPECIFICS

104
PERMEABLE PAVEMENT: > 2 to 5% subgrade slope with berms
• Subsurface storage depth modeled = average subsurface ponding depth
• = water depth before berm overtopping* or overflow
• Function of slope, check dam height, and check dam spacing
BMP MODELING SPECIFICS

105
PERMEABLE PAVEMENT: Run‐on• Run‐on?:
• Always designed to manage rain falling on the permeable pavement area
• May also be designed to mitigate run‐on (flow from other areas)
Rainfall
Run‐on from other areas?
BMP MODELING SPECIFICS

106
PERMEABLE PAVEMENT: Current Modeling GuidelinesBase Material Underdrain Subgrade Slope Model Surface as:
Above Surrounding
Grade
Yes – not elevated Any Impervious surface
Yes – elevated Any Impervious surface
No Any Grass over underlying soil type (till or outwash)
Partially or Below
Surrounding Grade
Yes – not elevated Any Impervious surface
Yes – elevated Any Impervious surface routed to gravel infiltration trench (same size as the pavement area). Trench depth = aggregate depth below surrounding grade
No 0‐2% Same as “Yes – elevated”
>2% Impervious surface routed to gravel infiltration trench (same size as the pavement area). Trench depth = subsurface storage depth if berms (nominal 1/2‐inch if no berms)
BMP MODELING SPECIFICS

107
PERMEABLE PAVEMENT: Gravel Trench Model Representation
Gravel Trench Parameters
Subbase infiltration rate
Wearing Course Overflow
SubbaseAggregate
Key :
Aggregate layer thickness and porosity
Subsurface ponding depth in storage reservoir controlled by overflow or berms in subbase
Pavement area*
* May include additional contributing area
Raised overflow pipe
BMP MODELING SPECIFICS

108
PERMEABLE PAVEMENT: Gravel Trench Model Representation
Model Configuration
Wearing Course Overflow
SubbaseAggregate
Key :
Pavement area (and area draining to it, if any)
Precipitation
EvaporationInfiltration Neglected
Gravel trench area
Only aggregate available for storage is modeled
Theoretical riser
Point o
f Co
mpliance
Porosity
Overflow
Note: Only aggregate under overflow invert modeled
Runoff/Interflow
To GW
Where flow control standard must be met
Infiltration to native
BMP MODELING SPECIFICS
109
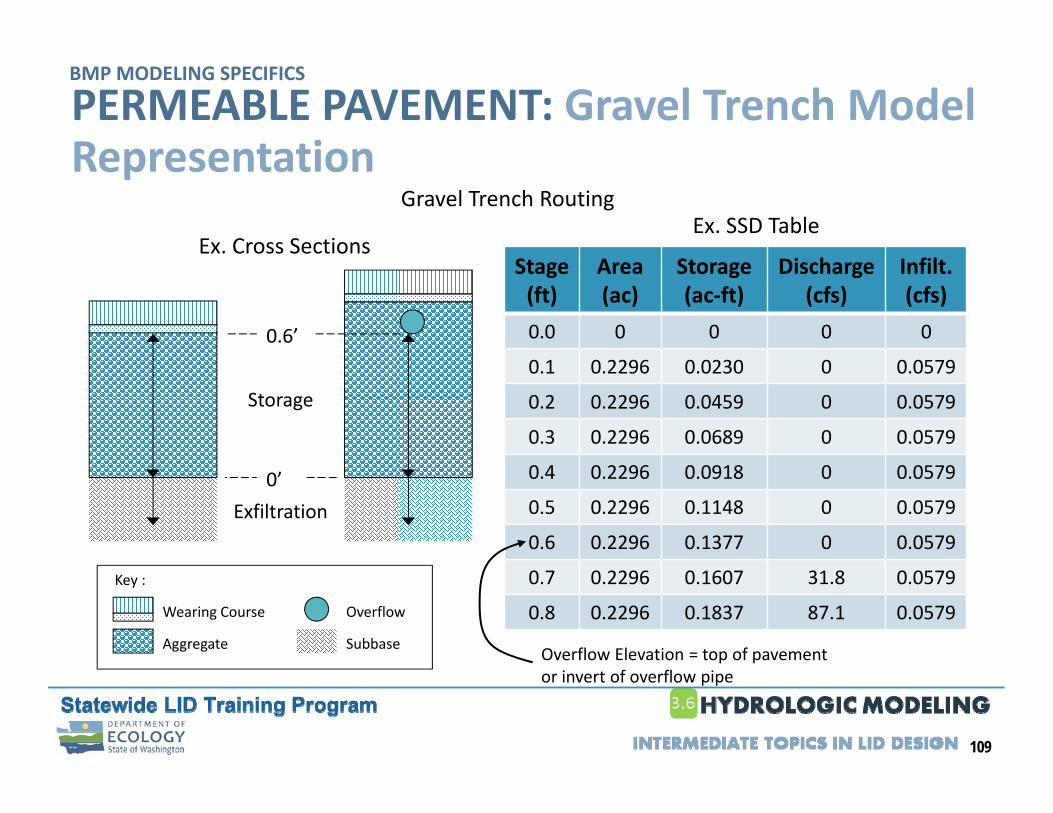
PERMEABLE PAVEMENT: Gravel Trench Model Representation
Gravel Trench Routing
0’
Ex. Cross Sections
0.6’
Exfiltration
Storage
Wearing Course Overflow
SubbaseAggregate
Key :
Ex. SSD Table
Stage(ft)
Area (ac)
Storage (ac‐ft)
Discharge (cfs)
Infilt.(cfs)
0.0 0 0 0 0
0.1 0.2296 0.0230 0 0.0579
0.2 0.2296 0.0459 0 0.0579
0.3 0.2296 0.0689 0 0.0579
0.4 0.2296 0.0918 0 0.0579
0.5 0.2296 0.1148 0 0.0579
0.6 0.2296 0.1377 0 0.0579
0.7 0.2296 0.1607 31.8 0.0579
0.8 0.2296 0.1837 87.1 0.0579
Overflow Elevation = top of pavement or invert of overflow pipe
BMP MODELING SPECIFICS

110
PERMEABLE PAVEMENT: Sizing for Flow Control• WWHM2012 Example – Explicit Method
• Site in King County
• Soil is till (0.25 inch/hour design infiltration rate)
• Permeable pavement parking lot is 10,000 sf
• Receiving run‐on from 5,000 sf of additional area
• Design goal = Ecology Flow Control standard (assuming a predeveloped forest condition)
• Size aggregate depth (av. subsurface ponding depth)
• SIZING FOR FLOW CONTROL GOAL → MAY NEED TO BE THICKER TO SATISFY OTHER DESIGN GOALS (EX. LOADING)
BMP MODELING SPECIFICS

111
PERMEABLE PAVEMENT: Sizing for Flow Control
• Precipitation/Evap. Data Select county and location on map
• Computational Time Step 15 minutes
Option Menu
BMP MODELING SPECIFICS

112
PERMEABLE PAVEMENT: Sizing for Flow Control
Predeveloped Basin Select area, soil type, land cover and slope
15,000 sf
BMP MODELING SPECIFICS

113
PERMEABLE PAVEMENT: Sizing for Flow Control
Predeveloped Basin Select area, soil type, land cover and slope
BMP MODELING SPECIFICS

114
PERMEABLE PAVEMENT: Sizing for Flow Control
Developed Mitigated Basin Area contributing runon to permeable pavement….
5,000 sf
Lateral Impervious Basin
BMP MODELING SPECIFICS

115
PERMEABLE PAVEMENT: Sizing for Flow Control
Developed Mitigated Basin (continued): Route to Permeable Pavement Module
Impervious land surface over gravel trench with infiltration
BMP MODELING SPECIFICS

116
PERMEABLE PAVEMENT: Sizing for Flow Control
Developed Mitigated Basin (continued): Characterize Permeable Pavement
Area
Pavement Section
Infiltration to Native Soil
SSD Table
Name
POC
Pavement depth + freeboard above surface
Depression storage before runoff (weir flow over edge)
BMP MODELING SPECIFICS

117
PERMEABLE PAVEMENT: Sizing for Flow Control
Stage Storage Discharge Table
Overflow
BMP MODELING SPECIFICS

118
PERMEABLE PAVEMENT: Sizing for Flow Control
Flow Duration Curve‐ Developed Unmitigated (Impervious)
50‐yr
½ 2‐yr
GOAL
BMP MODELING SPECIFICS

119
PERMEABLE PAVEMENT: Sizing for Flow Control
Flow Duration Curve‐ Developed Mitigated (with Permeable Pavement)
BMP MODELING SPECIFICS

120
PERMEABLE PAVEMENT: Sizing for Flow Control
Iteratively Sized Storage Aggregate Depth to Meet Duration Standard
Infiltrates almost 100% runoff
5.5” required to meet goal
BMP MODELING SPECIFICS

121
PERMEABLE PAVEMENT: Sizing for Flow Control
Flow Frequency Results
Use Gringorten or WeibullMethod for zero annual flows
BMP MODELING SPECIFICS

122
PERMEABLE PAVEMENT: Sizing for Flow Control
Example: Permeable Pavement in King County designed to achieve Creek Protection Duration Standard (Forest on Till)
Example
BMP MODELING SPECIFICS
123
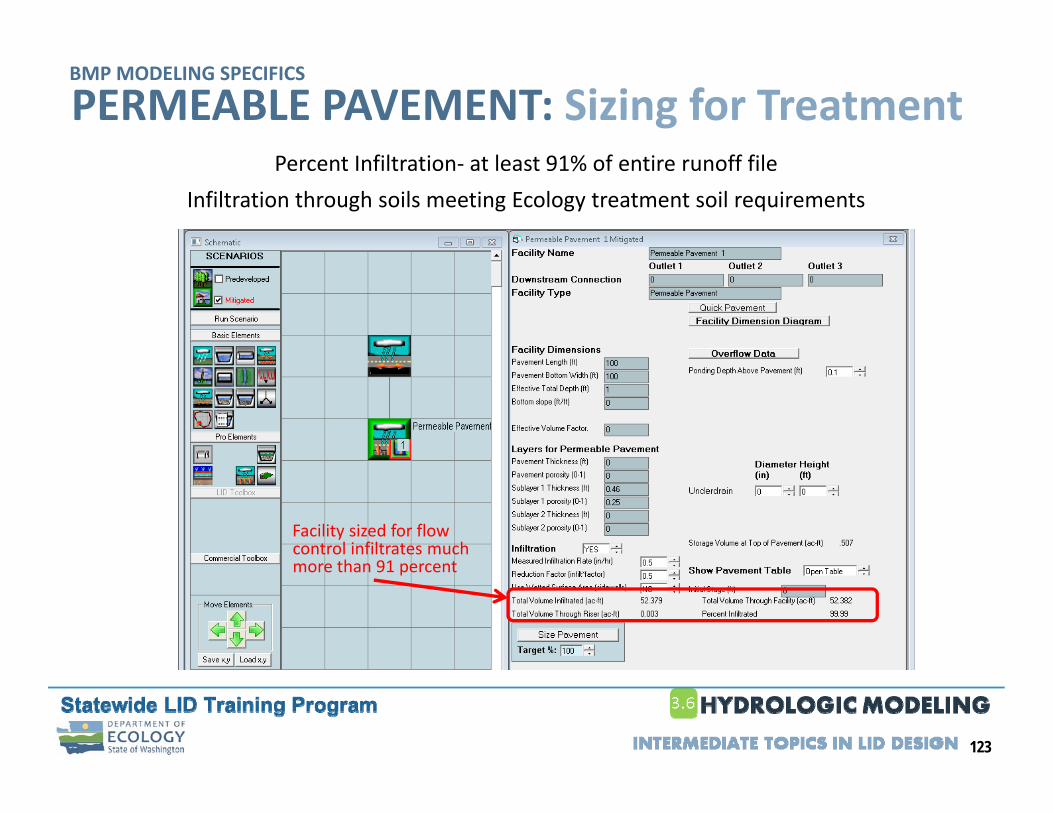
PERMEABLE PAVEMENT: Sizing for TreatmentPercent Infiltration‐ at least 91% of entire runoff file
Infiltration through soils meeting Ecology treatment soil requirements
Facility sized for flow control infiltrates much more than 91 percent
BMP MODELING SPECIFICS
124
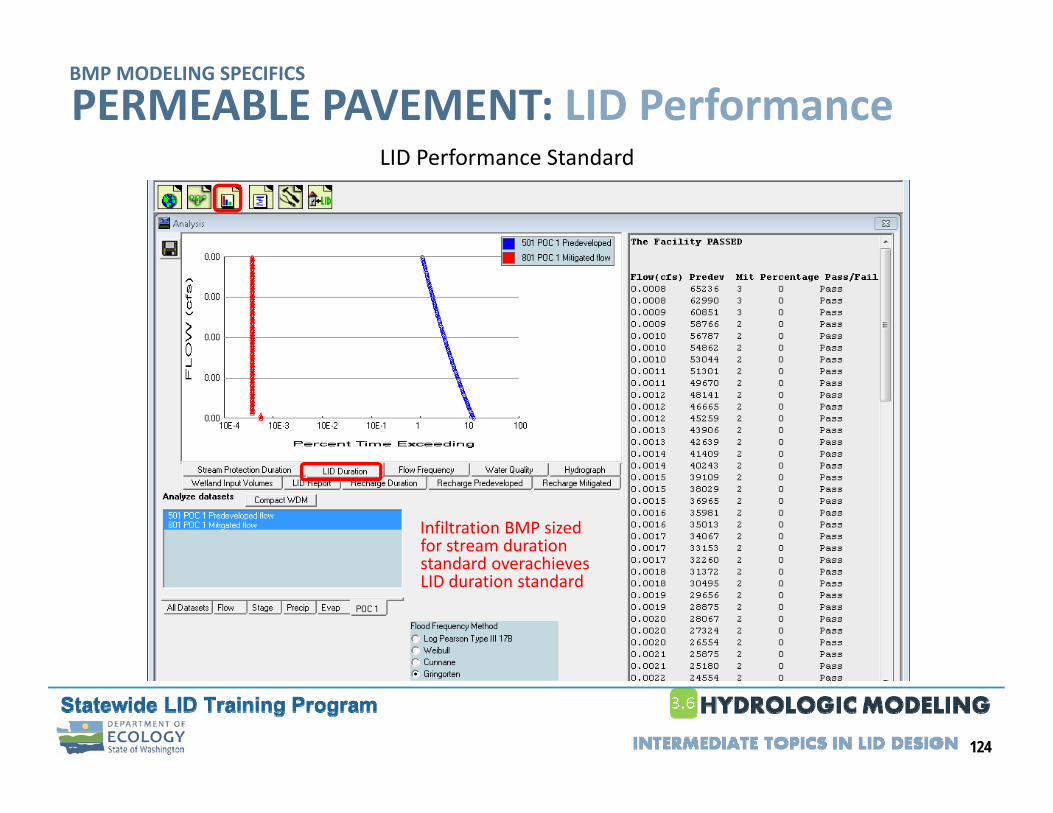
PERMEABLE PAVEMENT: LID Performance
Infiltration BMP sized for stream duration standard overachieves LID duration standard
BMP MODELING SPECIFICS
LID Performance Standard

125
PERMEABLE PAVEMENT: MGSFloodBMP MODELING SPECIFICS

126
7
1
DISPERSION
BIORETENTION PERMEABLE PAVEMENT
REVERSE SLOPE SIDEWALKS
VEGETATED ROOFS
2 3 4
5 6 7
CISTERNS
MINIMAL EXCAVATION FOUNDATIONS
127
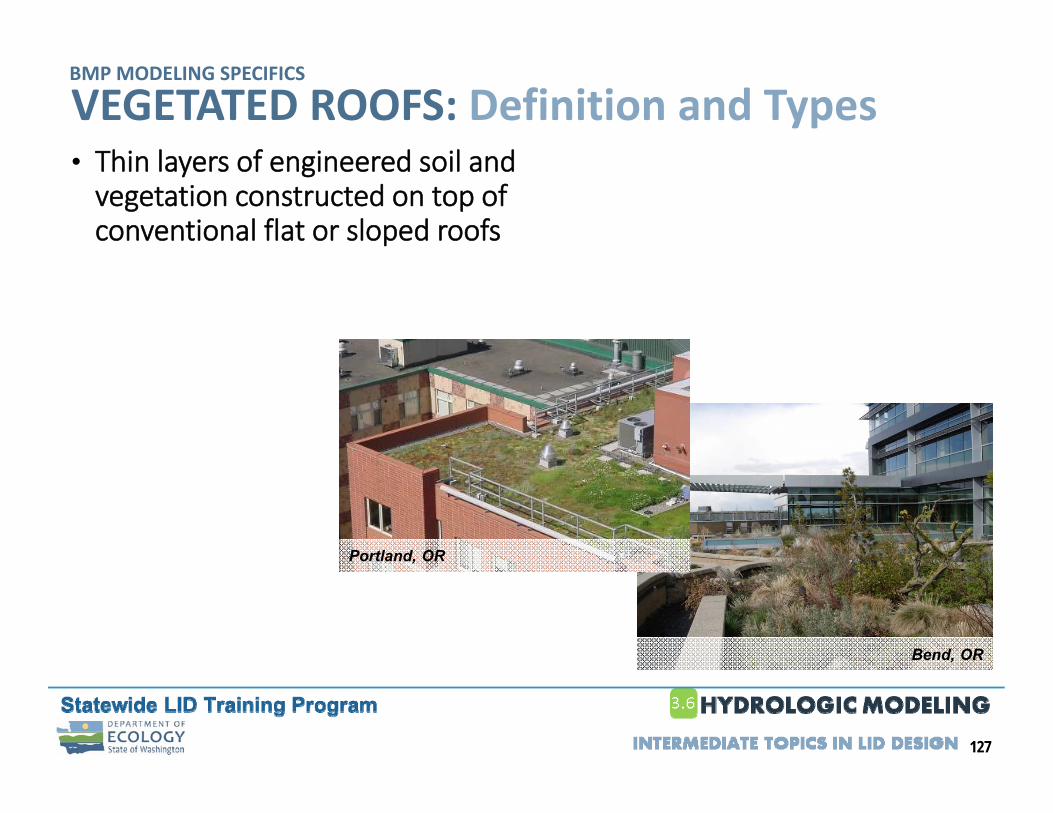
VEGETATED ROOFS: Definition and Types• Thin layers of engineered soil and vegetation constructed on top of conventional flat or sloped roofs
Bend, OR
Portland, OR
BMP MODELING SPECIFICS

128
VEGETATED ROOFS: Current Modeling Guidelines*: implicit method• 3‐8” growing media
• Model as 50% till landscaped / 50% impervious area
• > 8” growing media
• Model as 50% till pasture / 50% impervious area
BMP MODELING SPECIFICS
*2012 SWMMWW
(amended in 2014)

129
VEGETATED ROOFS: Current Modeling Guidelines: explicit method
Source: WWHM3 Eco‐Roof Documentation, Memorandum prepared by Clear Creek Solutions to Seattle Public Utilities, December 7, 2005.
BMP MODELING SPECIFICS
Modified PERLND
130
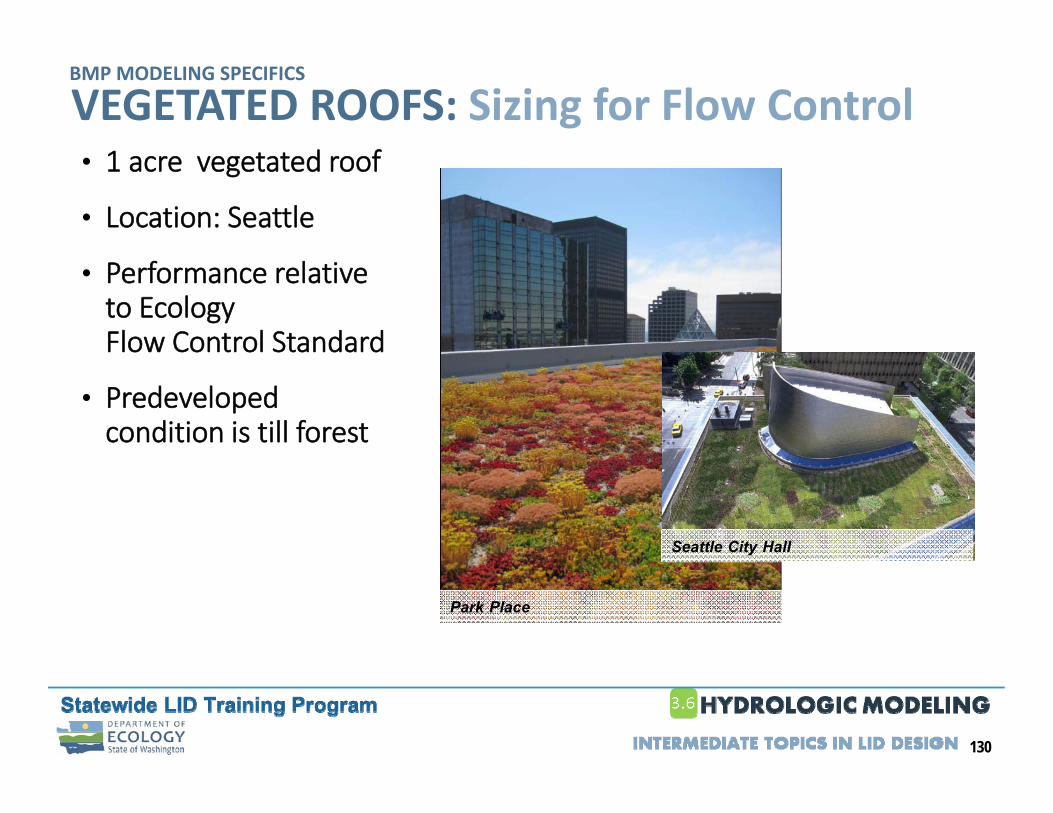
VEGETATED ROOFS: Sizing for Flow Control• 1 acre vegetated roof
• Location: Seattle
• Performance relative to Ecology Flow Control Standard
• Predevelopedcondition is till forest
Park Place
Seattle City Hall
BMP MODELING SPECIFICS

131
VEGETATED ROOFS: Sizing for Flow ControlSelect Precipitation
BMP MODELING SPECIFICS

132
VEGETATED ROOFS: Sizing for Flow ControlDefine Predeveloped Condition
BMP MODELING SPECIFICS
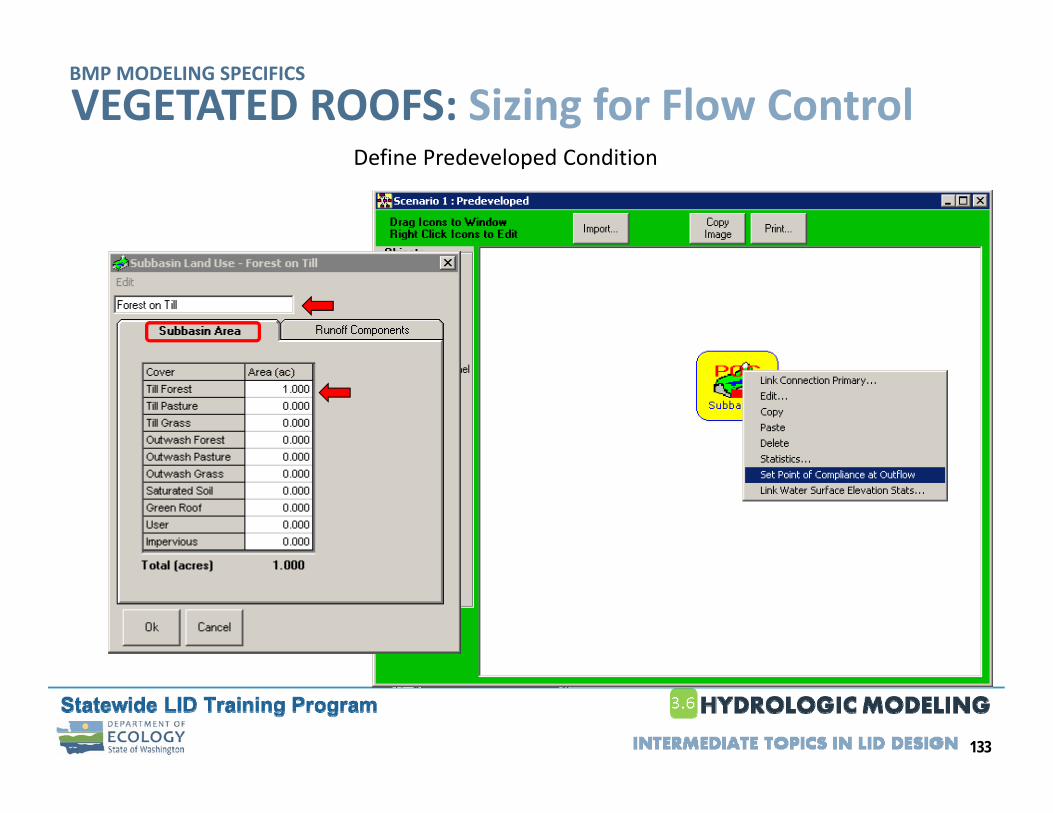
133
VEGETATED ROOFS: Sizing for Flow ControlDefine Predeveloped Condition
BMP MODELING SPECIFICS

134
VEGETATED ROOFS: Sizing for Flow ControlDefine Developed Mitigated Condition
BMP MODELING SPECIFICS

135
VEGETATED ROOFS: Sizing for Flow ControlDefine Developed Mitigated Condition
BMP MODELING SPECIFICS

136
VEGETATED ROOFS: Sizing for Flow ControlDefine Developed Mitigated Condition
BMP MODELING SPECIFICS

137
VEGETATED ROOFS: Sizing for Flow ControlRun Model
BMP MODELING SPECIFICS
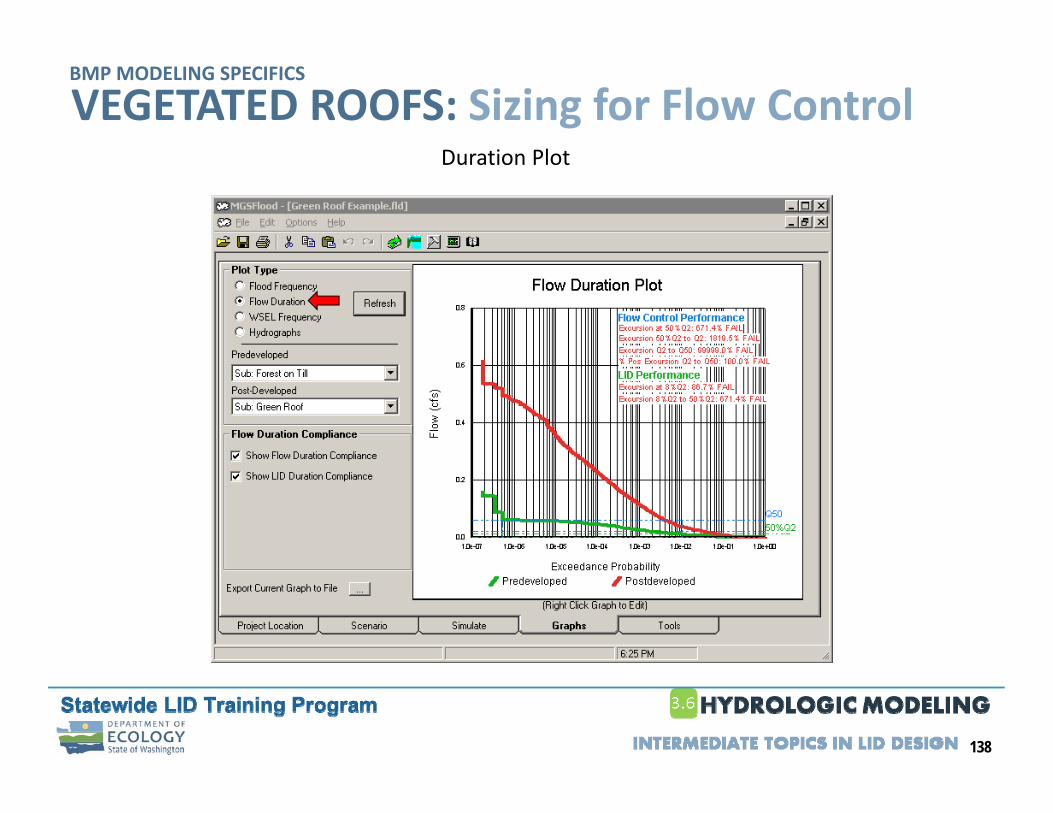
138
VEGETATED ROOFS: Sizing for Flow ControlDuration Plot
BMP MODELING SPECIFICS

139
VEGETATED ROOFS: Sizing for Flow ControlMGSFlood Module
Vegetated roof reduces downstream BMP size
BMP MODELING SPECIFICS

140
VEGETATED ROOFS: WWHMBMP MODELING SPECIFICS

141
7
1
DISPERSION
BIORETENTION PERMEABLE PAVEMENT
REVERSE SLOPE SIDEWALKS
VEGETATED ROOFS
2 3 4
5 6 7
CISTERNS
MINIMAL EXCAVATION FOUNDATIONS

142
• Typical in environments where rainfall or other conditions limit water supply
• Collects and stores runoff from roofs, or other surfaces
• Above or below ground cisterns
• Various materials:
• Fiberglass
• Polyethylene
• Concrete
CISTERNS: Definition and Types
• Metal
• Wood
Living Systems Design
BMP MODELING SPECIFICS

143
• Detention
• Typically below ground
• Slows runoff entering the stormwater system
• Harvesting
• Typically above ground
• Water is reused for irrigation or plumbing
CISTERNS: Types
Living Systems Design
BMP MODELING SPECIFICS

144
CISTERNS: Current Modeling Guidelines: detention cisterns
Fremont, Seattle
• Explicitly Modeled
• Vault/tank with low flow orifice and overflow
• Orifice Limitations
• Minimum orifice size typically will not achieve creek protection flow duration standards
• Uses
• Useful tool for CSO control
• Upstream of bioretentionNote: No recommendations in 2005 or 2012 LID Manual
BMP MODELING SPECIFICS

145
CISTERNS: Current Modeling Guidelines: harvesting cisterns
Fremont, Seattle
• Explicitly Model
• Estimate average annual runoff volume (V) using continuous model
• Size cisterns to provide storage, V
• For interior reuse, perform monthly water balance
• Subtract roof area from site‐wide model if sizing flow control or water quality treatment
MODELING BMPS

146
7
1
DISPERSION
BIORETENTION PERMEABLE PAVEMENT
REVERSE SLOPE SIDEWALKS
VEGETATED ROOFS
2 3 4
5 6 7
CISTERNS
MINIMAL EXCAVATION FOUNDATIONS

147
DISPERSION: Definition and TypesBMP MODELING SPECIFICS
• Vegetated areas that collect runoff from impervious surfaces
• Restores the natural drainage patterns of sheet flow and infiltration
• Types:
• Full dispersion
• Downspout dispersion
• Concentrated flow dispersion
• Sheet flow dispersion
Meadow at the Hylebos

148
DISPERSION: Current Modeling GuidelinesBMP MODELING SPECIFICS
• Full Dispersion
• Residential developments that implement full dispersion are assumed to fully meet the treatment and flow control requirements and do not have to use approved runoff models to demonstrate compliance
149
DISPERSION: Current Modeling GuidelinesBMP MODELING SPECIFICS
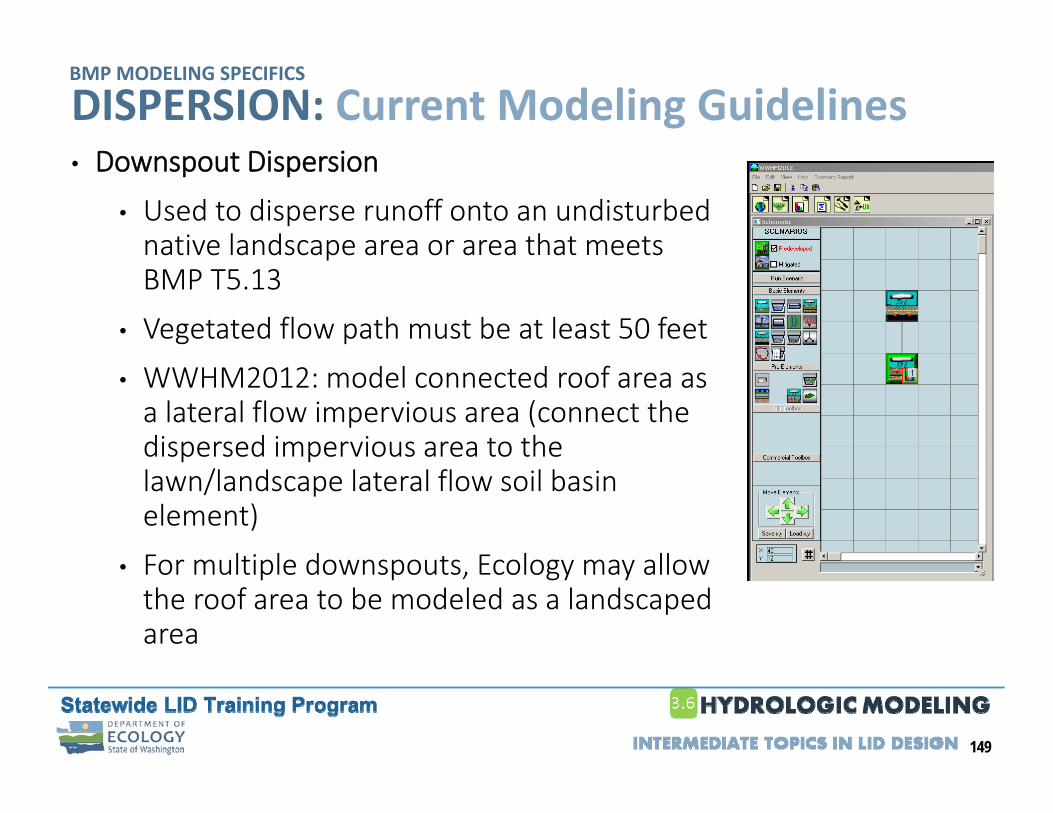
• Downspout Dispersion
• Used to disperse runoff onto an undisturbed native landscape area or area that meets BMP T5.13
• Vegetated flow path must be at least 50 feet
• WWHM2012: model connected roof area as a lateral flow impervious area (connect the dispersed impervious area to the lawn/landscape lateral flow soil basin element)
• For multiple downspouts, Ecology may allow the roof area to be modeled as a landscaped area

150
DISPERSION: Current Modeling GuidelinesBMP MODELING SPECIFICS
• Concentrated Flow Dispersion
• Used to disperse runoff onto an undisturbed native landscape area or area that meets BMP T5.13
• Vegetated flow path must be at least 50 feet
• WWHM2012: model impervious area as a lateral flow impervious area (connect the dispersed impervious area to the lawn/landscape lateral flow soil basin element)
• For multiple concentrated flow dispersion areas, Ecology may allow the impervious area to be modeled as a landscaped area

151
DISPERSION: Current Modeling GuidelinesBMP MODELING SPECIFICS
• Sheet Flow Dispersion
• Used to disperse runoff onto an undisturbed native landscape area or area that meets BMP T5.13
• WWHM2012: model impervious area as a lateral flow impervious area (connect the dispersed impervious area to the lawn/landscape lateral flow soil basin element)
• For multiple sheet flow dispersion areas, Ecology may allow the impervious area to be modeled as a landscaped area

152
7
1
DISPERSION
BIORETENTION PERMEABLE PAVEMENT
REVERSE SLOPE SIDEWALKS
VEGETATED ROOFS
2 3 4
5 6 7
CISTERNS
MINIMAL EXCAVATION FOUNDATIONS

153
• Limit soil disturbance
• Allow storm flows to more closely approximate natural shallow subsurface interflow paths
MINIMAL EXCAVATION FOUNDATIONS: Definition
BMP MODELING SPECIFICS

154
MINIMAL EXCAVATION FOUNDATIONS: Current Modeling Guidelines• Roof runoff dispersed on up gradient side of structure
• Dispersion per BMP T5.10 (downspout dispersion)
• Model roof as pasture on native soil
• Highest credit available
• Note: Area receiving credit reduced when step‐forming is used on a slope
BMP MODELING SPECIFICS

155
MINIMAL EXCAVATION FOUNDATIONS: Current Modeling Guidelines• Roof runoff dispersed on down gradient side of structure
• Dispersion per BMP T5.10 (downspout dispersion) AND at least 50 ft of vegetated flow path that meets BMP T5.13
• Model roof as the connected roof area as a lateral flow impervious area (connect the dispersed impervious area to the lawn/landscape lateral flow soil basin element)
BMP MODELING SPECIFICS

156
7
1
DISPERSION
BIORETENTION PERMEABLE PAVEMENT
REVERSE SLOPE SIDEWALKS
VEGETATED ROOFS
2 3 4
5 6 7
CISTERNS
MINIMAL EXCAVATION FOUNDATIONS

157
• Sidewalks sloped to drain away from the road and onto adjacent vegetated areas
Design Criteria
• Greater than 10 feet of vegetated surface downslope that is not directly connected into the storm drainage system
• Vegetated area receiving flow from sidewalk must be native soil or meet guidelines in BMP T5.13
REVERSE SLOPE SIDEWALKS: DefinitionBMP MODELING SPECIFICS

158
REVERSE SLOPE SIDEWALKS: Current Modeling Guidelines
BMP MODELING SPECIFICS
• In WWHM3, enter sidewalk as lawn/landscape on native soil
• In WWHM2012, use the lateral flow elements to send the impervious area runoff onto the lawn/landscape that will be used for dispersion

159
EXERCISE

160
21
34
wrap up
161
COURSE CATALOG
www.wastormwatercenter.org/lidswtrainingprogram

162
ONLINE EVALUATION
• An on‐line evaluation will be sent to you within 5 days following this training

163
Two certificates:
• LID Design certificate
• Long‐term LID Operations certificate
Sign out!
CERTIFICATE
164
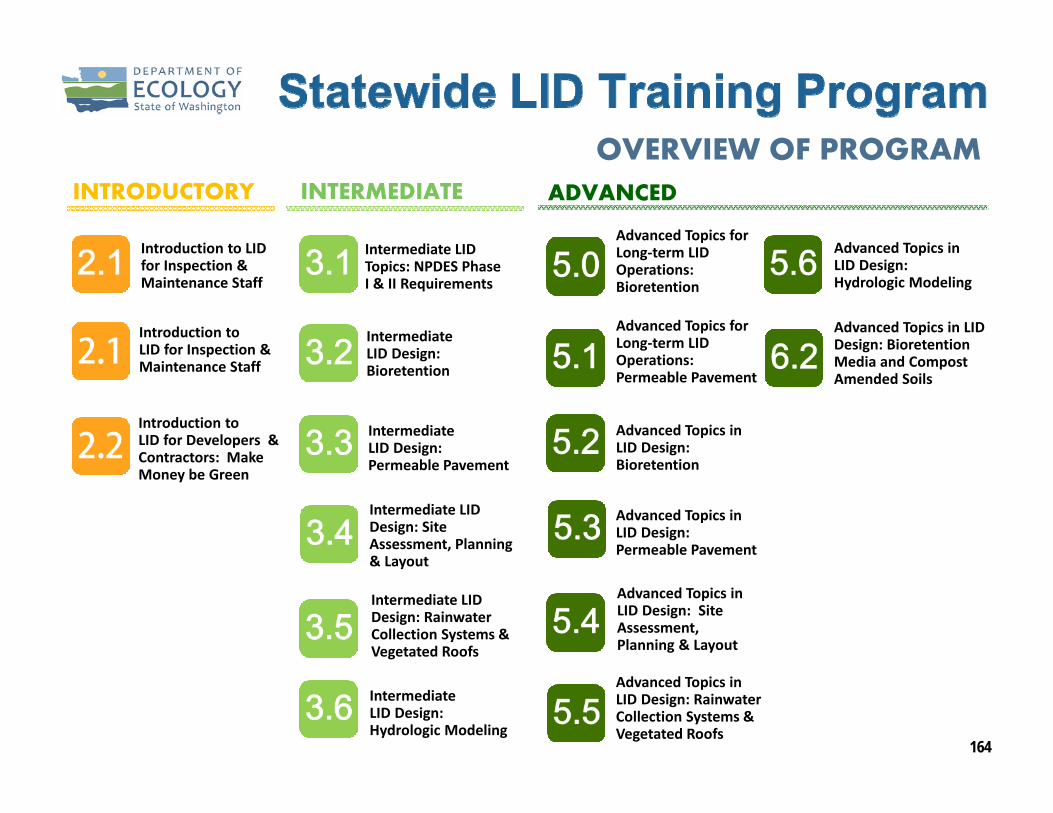
Introduction to LID for Inspection & Maintenance Staff
INTRODUCTORY INTERMEDIATE ADVANCED
Intermediate LID Design: Rainwater Collection Systems & Vegetated Roofs
Intermediate LID Topics: NPDES Phase I & II Requirements
Intermediate LID Design: Permeable Pavement
Intermediate LID Design: Hydrologic Modeling
Advanced Topics in LID Design:Bioretention
Advanced Topics in LID Design:Permeable Pavement
Advanced Topics in LID Design:Hydrologic Modeling
Advanced Topics in LID Design: Site Assessment, Planning & Layout
Advanced Topics in LID Design: Rainwater Collection Systems & Vegetated Roofs
Advanced Topics in LID Design: BioretentionMedia and Compost Amended Soils
OVERVIEW OF PROGRAM
Advanced Topics for Long‐term LID Operations: Bioretention
Intermediate LID Design: Bioretention
Advanced Topics for Long‐term LID Operations: Permeable Pavement
Intermediate LID Design: Site Assessment, Planning & Layout
Introduction toLID for Inspection & Maintenance Staff
Introduction toLID for Developers & Contractors: Make Money be Green

165
PROJECT LEAD
ADDITIONAL TRAINING SUPPORT
OVERVIEW OF PROGRAM
CORE TEAM

166
ONLINE RESOURCES
For information on training and other resources, visit the Washington Stormwater Center website:
http://www.wastormwatercenter.org
Stay connected through Social Media
• Come “Like” our Page
• Sign up to follow and get Tweets