module 3. price incentives and disincentives session 1. commodity selection
Post on 21-Dec-2015
218 views
TRANSCRIPT
MODULE 3. Price Incentives and DisincentivesSESSION 1. Commodity Selection

Presentation of main criteria for selecting the products for which price incentives and disincentives will be calculated.
Agree on the list of products for which price incentives and disincentives will be calculated
Module objectives:
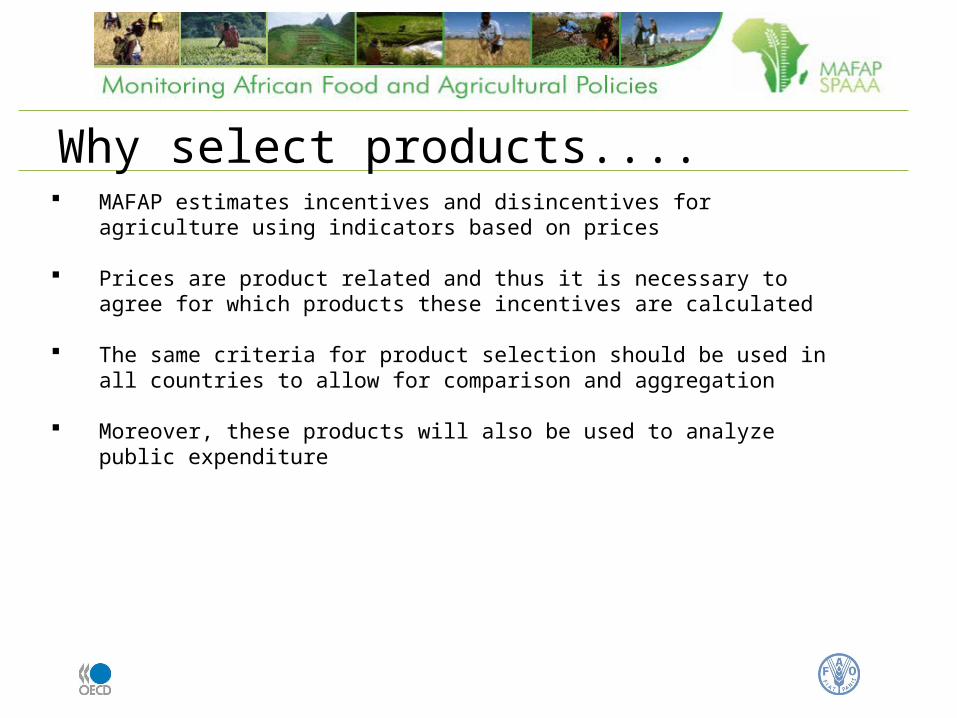
MAFAP estimates incentives and disincentives for agriculture using indicators based on prices
Prices are product related and thus it is necessary to agree for which products these incentives are calculated
The same criteria for product selection should be used in all countries to allow for comparison and aggregation
Moreover, these products will also be used to analyze public expenditure
Why select products....

Trade status:
Import substitute: produced in country but the country is a net importer of the commodity
Exported good: produced in the country and exported (cash-crops)
Non-traded: produced in the country and due to its characteristics (i.e. perishable) or market development (i.e. no processing; high transportation costs) the commodity is not internationally traded with this country
Classification of goods according to...

1st criteria: Cover a significant percentage of total agricultural production (target: 70% in value)
2nd criteria: cover major items of the food import bill
3rd criteria: cover major agricultural exports
4th criteria: cover major items of the diet (in quantity, calories and expenditure)
And any other product that the country might be interested in studying
Criteria for product selection
How to strike a balance between a comprehensive product selection and a manageable amount of products
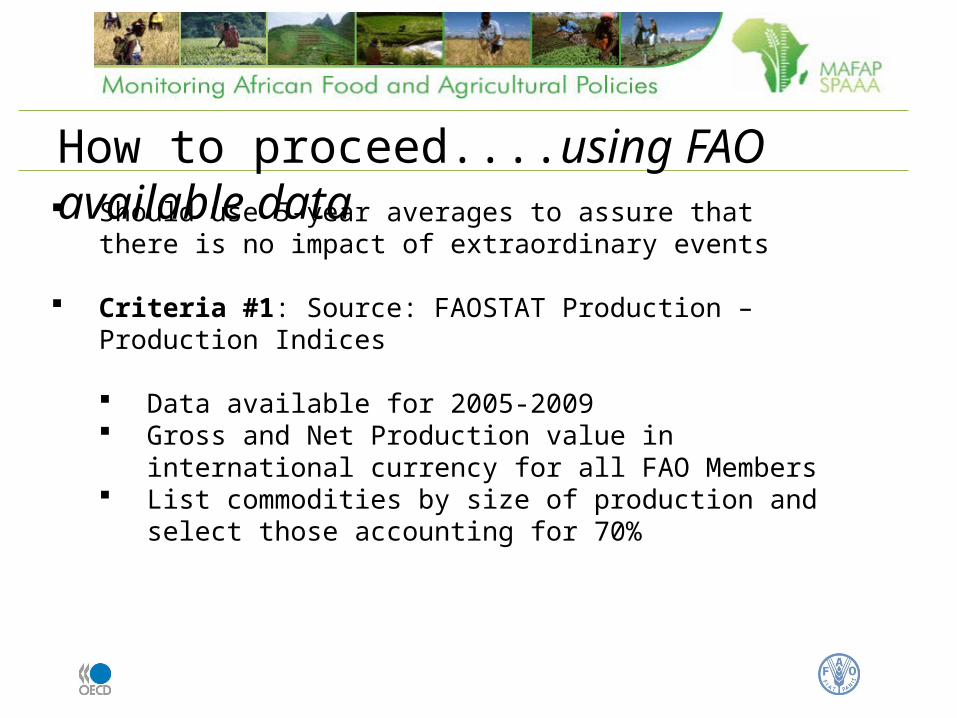
Should use 5-year averages to assure that there is no impact of extraordinary events
Criteria #1: Source: FAOSTAT Production – Production Indices
Data available for 2005-2009 Gross and Net Production value in international currency for all
FAO Members List commodities by size of production and select those
accounting for 70%
How to proceed....using FAO available data


Criteria #2 & #3: Source: FAOSTAT TradeSTAT – Crops and Livestock products
Data available for 2004-2008 Import and Export Value List commodities by value of exports and imports and select
those accounting for 70%
How to proceed....using FAO available data


Criteria #4: Source: FAOSTAT Food Balance Sheets
Latest data available for 2007 Data on quantities and calories per commodity Again select products covering at least 70% of diet For expenditure need to use retail prices from other sources
(ideally covering a significant % of diet)
How to proceed....using FAO available data


Start with commodities covering 70% of agricultural output. Add any major import or export not covered above if it represents
more than 5% of total exports or imports or more than 1% of total country’s agricultural output.
Add any major staple food in diet not covered above if it represents more than 5% of total diet or more than 1% of total country’s agricultural output.
Check whether Africa-Wide and Regional-Wide key products are included, if not add if it represents more than 1% of total country’s agricultural output.
Review the list and see whether it is feasible to study all commodities.
If not delete products with the minor impact on total agricultural output.
Combining the different criteria....

List of commodities covering 70% of
agricultural output
Are commodities covering 70%
of X and M included?
Are commodities
covering 70% of diet
included?
Do the missed commodities
represent more than 5% of total X
or M?
Add products to
the initial list
Are Africa and region wide
products covered?
Do the missed commodities
represent more than 5% of total
diet?
Add products to
the initial list
Is there any additional
product interesting for
analysis?
FINAL LIST OF PRODUCTS
Do the missed commodities
represent more than 1% of total
agricultural output?
Add products to
the initial list
Add products to
the initial list
Is the list feasible
for study?
Reduce products starting from
smallest share of total agricultural
output
yes
yesyes
no
yesyes
yes
yesyes
no
no
no
no
no
no
no

Undertake the same process with local data sources (maybe more recent – diet composition mainly)
Are the list the same? How can we explain differences?
Does the country want to include a specific commodity? why?
Check against local data sources....
ACTIVITY: Do the product selection procedure as described and discuss potential issues for analysis based on data availability
OUTPUT: Final product list agreed

Thank you!