module 1: understanding career and technical education
TRANSCRIPT

| CTEResearchNetwork.org | [email protected] 12997_09/20
Module 1:
Understanding Career and Technical Education Data and Why It Matters Facilitator’s Guide
Authors: Marjorie Cohen
Steve Klein Cherise Moore
Reviewers: Pradeep Kotamraju, PhD
Linda Romano Lyn Velle
October 2020

| CTEResearchNetwork.org | [email protected] 2
Contents Page
Overview ..................................................................................................................................... 3
Module Description ..................................................................................................................... 3
Module Objectives ...................................................................................................................... 3
Intended Audience ...................................................................................................................... 3
Materials ..................................................................................................................................... 3
Time Requirements .................................................................................................................... 4
Outline of Module ....................................................................................................................... 4
Facilitator’s Script/Notes for Module ........................................................................................... 4
References and Resources ...................................................................................................... 15

| CTEResearchNetwork.org | [email protected] 3
Overview This module is part of a series of six practitioner training modules developed as part of the Career & Technical Education (CTE) Research Network Lead. The six modules are:
Module 1: Understanding CTE Data and Why It Matters
Module 2: Using Data and Research to Improve CTE Programs
Module 3: CTE Program Evaluation: Why It Matters to Practitioners
Module 4: Using State Data to Partner With Researchers
Module 5: Using Research to Design Your CTE Program for Equity
Module 6: How to Communicate About Your CTE Program Using Research
The work of the CTE Research Network Lead is supported by the Institute of Education Sciences at the U.S. Department of Education with funds provided under the Carl D. Perkins Career and Technical Education Act through Grant R305N180005 to the American Institutes for Research (AIR). The work of the Network member projects is supported by the Institute. The opinions expressed are those of the authors and do not represent the views of the Institute or the U.S. Department of Education.
Module Description As the education and workforce development community looks more and more to CTE to help ensure students are both college and career ready, data become more and more important. How do we know a CTE program is successful? For which types of students is the CTE program successful? How do we integrate components from other successful programs to improve what we are doing? Without looking at data and understanding research, we cannot answer such questions. This module is for those practitioners who are new to CTE or need a refresher on CTE data and research.
Module Objectives After viewing this module, practitioners will:
Answer fundamental questions about data and research for CTE programs.
Connect data to Perkins V requirements.
Define evidence-based research, understand why it is important, and where to find it.
Understand real-world examples of CTE data and research.
Intended Audience This training module is intended for local and state program administrators. The module can be completed individually using the facilitator’s guide. Groups or teams will also benefit from this module being led by a facilitator using this guide.
Materials The following materials are recommended for the training module and associated activities:
Module 1 PowerPoint

| CTEResearchNetwork.org | [email protected] 4
Chart paper
Copies of Activity Handouts 1–3:
• Activity 1: Opening Self-Reflection
• Activity 2: Identifying What Exists
• Activity 3: Closing Self-Reflection
Time Requirements The total time required for this module is approximately 60 minutes. You may need to allot additional time for the activities depending on the audience’s familiarity with the content.
Outline of Module Materials Activities Estimated Time Slide 1 None (cover slide) As participants
arrive (if in person)
Slides 2–4 I. Welcome, Introductions, Agenda, and Overview 5 minutes
Slides 5–6 II. Objectives and Instructions 3 minutes
Slide 7; Activity 1 III. Activity 1: Opening Self-Reflection 5 minutes
Slides 8–11 IV. Defining Key Terminology 4 minutes
Slide 12-22 Activity 2
V. Understanding CTE Data What Are CTE Data Where Do CTE Data Come From? How Are CTE Data Collected? Activity 2: Identifying What Exists Why Do CTE Data Matter?
20 minutes
Slides 23–33
VI. Understanding CTE Research What Are the Types of Research? How Do Data Support Research? What Are the Levels of Evidence in Research? Finding Evidence-Based Resources
17 minutes
Slide 34–37 Activity 3
VII. Closing Activity, Resources, and Contact Information Activity 3: Closing Self-Reflection
6 minutes
Total Time 60 minutes
Facilitator’s Script/Notes for Module The following section is a slide-by-slide script that provides guidance to facilitators as they present the content and learning activities included in this module. Reviewing the entire guide prior to facilitating the module is highly recommended.

| CTEResearchNetwork.org | [email protected] 5
Module 1: Understanding CTE Data and Why It Matters
Script and Notes PPT Slide Slide 1: High-quality career and technical education, often referred to as CTE, can prepare students to succeed in postsecondary education and careers. This module is designed to support school district and college CTE program administrators in understanding CTE data and how best to use them.
Slide 2: This training series was developed by the CTE Research Network. The CTE Research Network is supported by the Institute of Education Sciences at the U.S. Department of Education with funds provided under the Carl D. Perkins Career and Technical Education Act through Grant R305N180005 to the American Institutes for Research (AIR). Network activities are directed towards increasing the number of CTE impact studies and strengthening the capacity of the field to conduct and use rigorous CTE research. AIR and its partners—the Association for Career and Technical Education (ACTE), JFF, and Vanderbilt University—serve as the CTE Research Network Lead.
Slide 3: This module, “Understanding CTE data and why it matters,” is the first in a six-part series created by the CTE Research Network to support CTE stakeholders in learning more about how to use data and research to improve CTE programming. Although the modules need not be viewed sequentially, we suggest that you consider doing so if you plan to complete the entire series. This first module in the series offers background on what CTE data are and how they can be used to support evidence-based research.
Slide 4: This training module series is designed to support educators in understanding the importance of data and evidence-based research in CTE. It is intended to help CTE practitioners understand what CTE data are, and the different types of data that exist. It also addresses the source of these data and how they can be used. Next, attention shifts to understanding CTE research. Here, the focus is on clarifying the type of research that exists, how data can be used to support research, and the different levels of evidence that are used in research. It concludes with information on how practitioners can find evidence-based programs, policies, and practice to improve programming.
| CTEResearchNetwork.org | [email protected] 6
Script and Notes PPT Slide Slide 5: After viewing this module, you will have a better understanding of what CTE data are and how research can be used to improve CTE programs. You also will be able to connect data to federal accountability requirements contained in the Carl D. Perkins Career and Technical Education Act, as amended by the Strengthening Career and Technical Education for the 21st Century Act, also referred to as Perkins V. In addition, you will be able to define what evidence-based research is, understand why it is important, and know where to find it. Real-world examples are offered to help you connect theory to practice.
Slide 6: This interactive module includes processes and tools to help you improve CTE programming at your site. To help contextualize your experience, activities are provided to help you gain an understanding of how you may use the tools provided to implement change.
Before you begin viewing, we recommend downloading and printing the activity worksheets and actively using them to apply your learnings.
Slide 7: (5 mins.) To help frame your module engagement, please think about how you might use CTE data and research to help strengthen your CTE programming. Simply put, how might you apply the information you learn to undertake change within your site? Stop the module and follow the directions on the Self-Reflection Activity worksheet.
NOTE: For facilitated in-person professional learning, this opening reflection question activity should be done as a 15-minute think-pair-share.
Slide 8: It’s important that you are aware of some key terminology in order to measure CTE program performance. The next three slides review key terms used throughout this module. You may wish to download the module glossary that includes these terms, as well as other terms relating to the use of data and research, to help inform your work.
Slide 9: High-quality CTE programming offers students the academic knowledge and technical and employability skills necessary for success in the workplace and in further education—both options, not one over the other. Employability skills, also referred to as soft skills, include the ability to think critically, work independently and in teams, and show up on time and motivated to work. CTE also offers educators the opportunity to strengthen the connection and coherence among K–12 education, postsecondary education, and workforce development efforts.

| CTEResearchNetwork.org | [email protected] 7
Script and Notes PPT Slide Slide 10: Educators perform research to understand how education systems are operating and to assess their effectiveness. As described in this module, research may take different forms and fall into different categories of rigor. Although this information will be shared in greater detail below, you should be familiar with the terms quantitative and qualitative research. Quantitative research entails the collection of data that can be expressed in numeric terms. In contrast, qualitative research involves the collection of data that can be expressed in non-numeric terms, such as data through interviews and focus groups.
Slide 11: Rigor describes the extent to which quantitative research can be used to describe CTE programming and its ability to support predictive statements. Descriptive research is primarily narrative in form and is intended to describe current conditions but may not be used for predictive purposes. Correlational research is used to express relationships between study variables and can support prediction, though not to draw cause-and-effect conclusions. Causal research, often referred to as rigorous research, is used to quantify study findings and support the use of predictive statements that can be used to establish cause-and-effect relationships. For this reason, causal research is the preferred approach for studying a CTE program.
Slide 12: Educators collect a large amount of data on CTE programming. This information is compiled for a range of purposes, including compliance with federal Perkins V reporting requirements and to address state fiscal and administrative needs. This section will help you understand the types of data that are collected and their sources, as well as how they are used.
Slide 13: Educators collect data to better understand how education systems are operating and to assess their effectiveness. These data typically consist of statistics or facts that are compiled from a range of sources to offer insight into program operations and the outcomes that students achieve. Consequently, CTE data consist of statistics or facts that are specific to technical coursework.
| CTEResearchNetwork.org | [email protected] 8
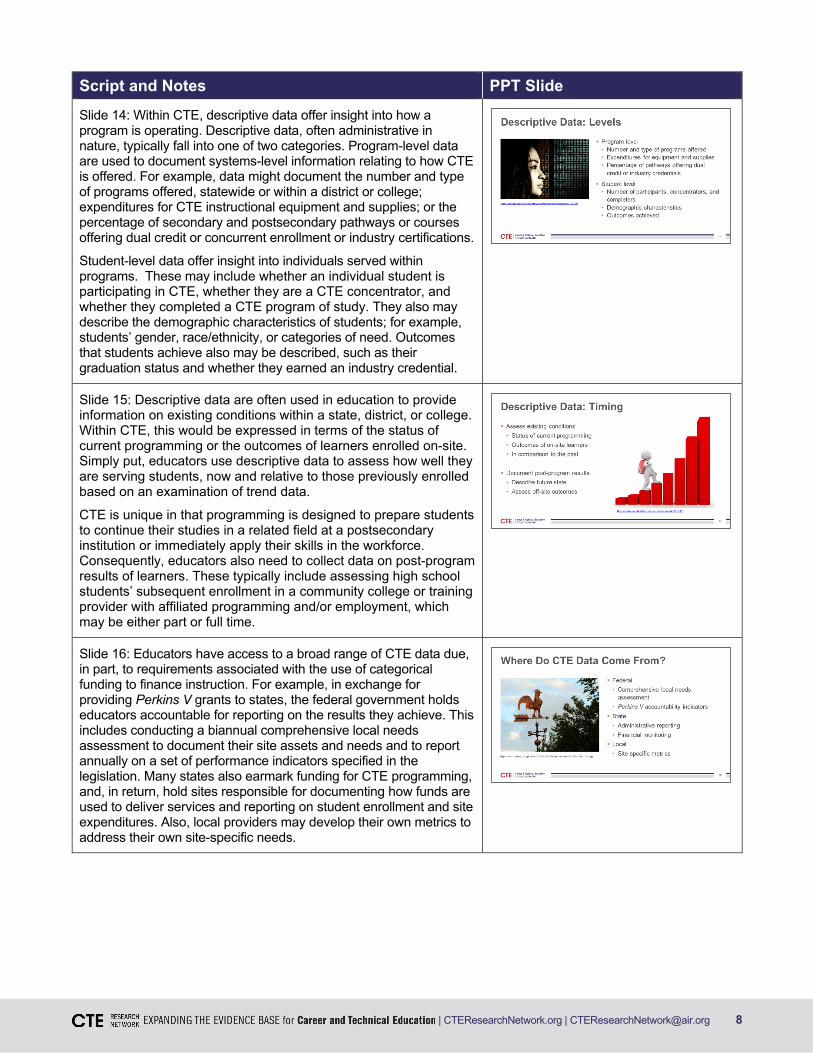
Script and Notes PPT Slide Slide 14: Within CTE, descriptive data offer insight into how a program is operating. Descriptive data, often administrative in nature, typically fall into one of two categories. Program-level data are used to document systems-level information relating to how CTE is offered. For example, data might document the number and type of programs offered, statewide or within a district or college; expenditures for CTE instructional equipment and supplies; or the percentage of secondary and postsecondary pathways or courses offering dual credit or concurrent enrollment or industry certifications.
Student-level data offer insight into individuals served within programs. These may include whether an individual student is participating in CTE, whether they are a CTE concentrator, and whether they completed a CTE program of study. They also may describe the demographic characteristics of students; for example, students’ gender, race/ethnicity, or categories of need. Outcomes that students achieve also may be described, such as their graduation status and whether they earned an industry credential.
Slide 15: Descriptive data are often used in education to provide information on existing conditions within a state, district, or college. Within CTE, this would be expressed in terms of the status of current programming or the outcomes of learners enrolled on-site. Simply put, educators use descriptive data to assess how well they are serving students, now and relative to those previously enrolled based on an examination of trend data.
CTE is unique in that programming is designed to prepare students to continue their studies in a related field at a postsecondary institution or immediately apply their skills in the workforce. Consequently, educators also need to collect data on post-program results of learners. These typically include assessing high school students’ subsequent enrollment in a community college or training provider with affiliated programming and/or employment, which may be either part or full time.
Slide 16: Educators have access to a broad range of CTE data due, in part, to requirements associated with the use of categorical funding to finance instruction. For example, in exchange for providing Perkins V grants to states, the federal government holds educators accountable for reporting on the results they achieve. This includes conducting a biannual comprehensive local needs assessment to document their site assets and needs and to report annually on a set of performance indicators specified in the legislation. Many states also earmark funding for CTE programming, and, in return, hold sites responsible for documenting how funds are used to deliver services and reporting on student enrollment and site expenditures. Also, local providers may develop their own metrics to address their own site-specific needs.

| CTEResearchNetwork.org | [email protected] 9
Script and Notes PPT Slide Slide 17: Researchers collect data using a range of strategies. Researchers may collect their own original data or conduct an analysis of existing databases.
For example, for data sets, a researcher might obtain district attendance data to assess how absences for students concentrating their studies in a CTE program compare with those not enrolling.
Observational studies engage the researcher in collecting data. For example, a researcher may sit in a class to observe and code student or teacher behavior or go on-site to view the education setting firsthand and/or conduct focus group interviews.
Finally, surveys are often used to collect comparable data from large groups of people and may be administered online or using paper and pen. Surveys also can be used to understand how a stakeholder group (e.g., students, parents, teachers, employers) feels about a CTE program.
Slide 18: (5 mins.) If your district or college is currently offering CTE programming, you may already have access to a range of data. This activity will help you to think about the types of data your program could have, or is already collecting, to assess CTE program operations and outcomes? Stop the module and follow the directions provided as part of the Activity 2 worksheet.
NOTE: For facilitated in-person professional learning, this opening reflection question activity should be done as a 15-minute think-pair-share.
Slide 19: Why collect CTE data? As you noted in the last activity, data may serve a range of purposes. Although there is no limit to their possible uses, data can usually be classified into three categories, which need not be mutually exclusive. The first relates to compliance reporting. Here, data are used to ensure that educators are employing resources for their intended purposes and can account for their usage. The second category is to quantify the progress that programs are making in preparing students for the future and recording the outcomes they achieve. Finally and most importantly, data can be used to help guide improvement. By looking at how programs and students are performing, educators can target their improvement efforts to the areas of greatest need.
For more information on performance measures and program evaluation, please see Module 3.
Slide 20: To illustrate the benefits that CTE confers, the Michigan Department of Education collects data on the level of participation in CTE programming for high school students and connects them to students’ subsequent postsecondary experiences. For example, this descriptive data shows that when looking at median annual wages for the class of 2012, state administrators found increasing benefits for students who completed more CTE coursework, and this held irrespective of the degree type students earned. Moreover, data indicate that median wages increased for students who earned relatively more advanced credentials or degrees.

| CTEResearchNetwork.org | [email protected] 10
Script and Notes PPT Slide Slide 21: To publicize student outcomes, the Sausalito Unified School District in California publicizes the number of students earning CTE certifications and who participated in an off-site internship. For example, in the 2019–20 school year, the district reported that 1,462 students earned an industry-recognized certification in one of 15 career fields and that 641 students were engaged in an internship. These data can help students and parents understand the immediate benefits that CTE confers.
Slide 22: To educate the public about system benefits, the College System of Tennessee provides visual and interactive information data on students participating in public community colleges and the state’s technical colleges of applied technology. For example, users may explore trend data to see information on student enrollment by program and demographics; student success, including job placement and licensure rates; and awards, by program and demographics. Users also may choose to see systemwide data or use toolbars to select a specific academic year or college. This information can help publicize the benefits that CTE confers as well as assist individuals in choosing a college or field of study.
Slide 23: Researchers often compile data elements to produce studies of CTE programming or practices. This research can take many forms; therefore, it is critical that educators understand the different ways that studies can be conducted to help them understand how findings should be interpreted.
Slide 24: Researchers may use different strategies to collect and report data. This affects how information is shared. Research that is qualitative expresses data not using numbers. Here, findings may be expressed in terms of population characteristics or observable phenomena that cannot be quantitatively measured. Alternatively, data may be expressed in quantitative terms, which are numerical. Here, results may be expressed as a count, value, or amount. Keep in mind that the two strategies for reporting data are not mutually exclusive; often, studies will use some combination of the two to help tell a complete story.
| CTEResearchNetwork.org | [email protected] 11
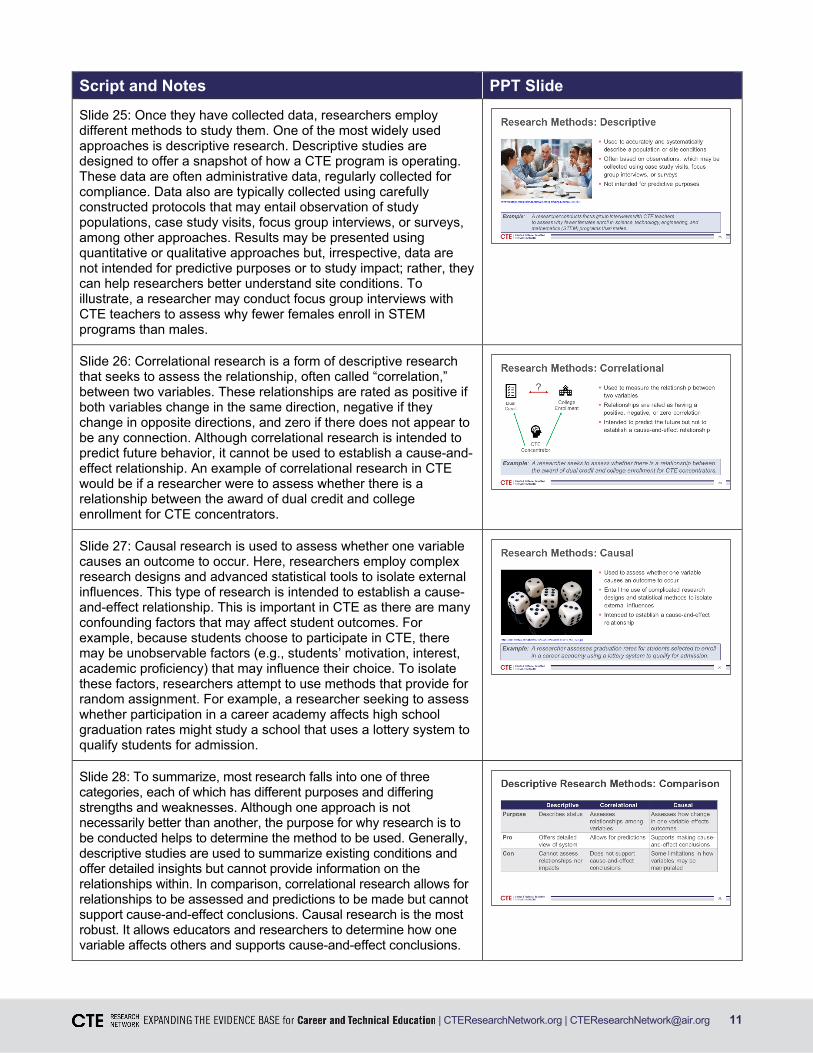
Script and Notes PPT Slide Slide 25: Once they have collected data, researchers employ different methods to study them. One of the most widely used approaches is descriptive research. Descriptive studies are designed to offer a snapshot of how a CTE program is operating. These data are often administrative data, regularly collected for compliance. Data also are typically collected using carefully constructed protocols that may entail observation of study populations, case study visits, focus group interviews, or surveys, among other approaches. Results may be presented using quantitative or qualitative approaches but, irrespective, data are not intended for predictive purposes or to study impact; rather, they can help researchers better understand site conditions. To illustrate, a researcher may conduct focus group interviews with CTE teachers to assess why fewer females enroll in STEM programs than males.
Slide 26: Correlational research is a form of descriptive research that seeks to assess the relationship, often called “correlation,” between two variables. These relationships are rated as positive if both variables change in the same direction, negative if they change in opposite directions, and zero if there does not appear to be any connection. Although correlational research is intended to predict future behavior, it cannot be used to establish a cause-and-effect relationship. An example of correlational research in CTE would be if a researcher were to assess whether there is a relationship between the award of dual credit and college enrollment for CTE concentrators.
Slide 27: Causal research is used to assess whether one variable causes an outcome to occur. Here, researchers employ complex research designs and advanced statistical tools to isolate external influences. This type of research is intended to establish a cause-and-effect relationship. This is important in CTE as there are many confounding factors that may affect student outcomes. For example, because students choose to participate in CTE, there may be unobservable factors (e.g., students’ motivation, interest, academic proficiency) that may influence their choice. To isolate these factors, researchers attempt to use methods that provide for random assignment. For example, a researcher seeking to assess whether participation in a career academy affects high school graduation rates might study a school that uses a lottery system to qualify students for admission.
Slide 28: To summarize, most research falls into one of three categories, each of which has different purposes and differing strengths and weaknesses. Although one approach is not necessarily better than another, the purpose for why research is to be conducted helps to determine the method to be used. Generally, descriptive studies are used to summarize existing conditions and offer detailed insights but cannot provide information on the relationships within. In comparison, correlational research allows for relationships to be assessed and predictions to be made but cannot support cause-and-effect conclusions. Causal research is the most robust. It allows educators and researchers to determine how one variable affects others and supports cause-and-effect conclusions.
| CTEResearchNetwork.org | [email protected] 12
Script and Notes PPT Slide Slide 29: Data are foundational to the conduct of research. However, there needs to be a purpose for why data are collected. Formulating a research question is the first step in conducting a study because it helps to establish what a researcher is seeking to answer. Accordingly, research questions must clearly and concisely define what is to be studied and why. The question also helps to determine whether the research will be quantitative or qualitative, the type of method to be employed, and the type of data that will be collected. Most administrative data sets are for compliance and cannot help answer research questions. States and districts can partner with researchers to determine the type of data to be collected to help answer a research question.
For example, a research question might ask: What are the demographic characteristics of female students who achieve concentrator status in STEM programs? This would indicate that a qualitative, descriptive study might be in order, with data collected on students’ race/ethnicity with attention to other factors (e.g., disability status, socioeconomic status).
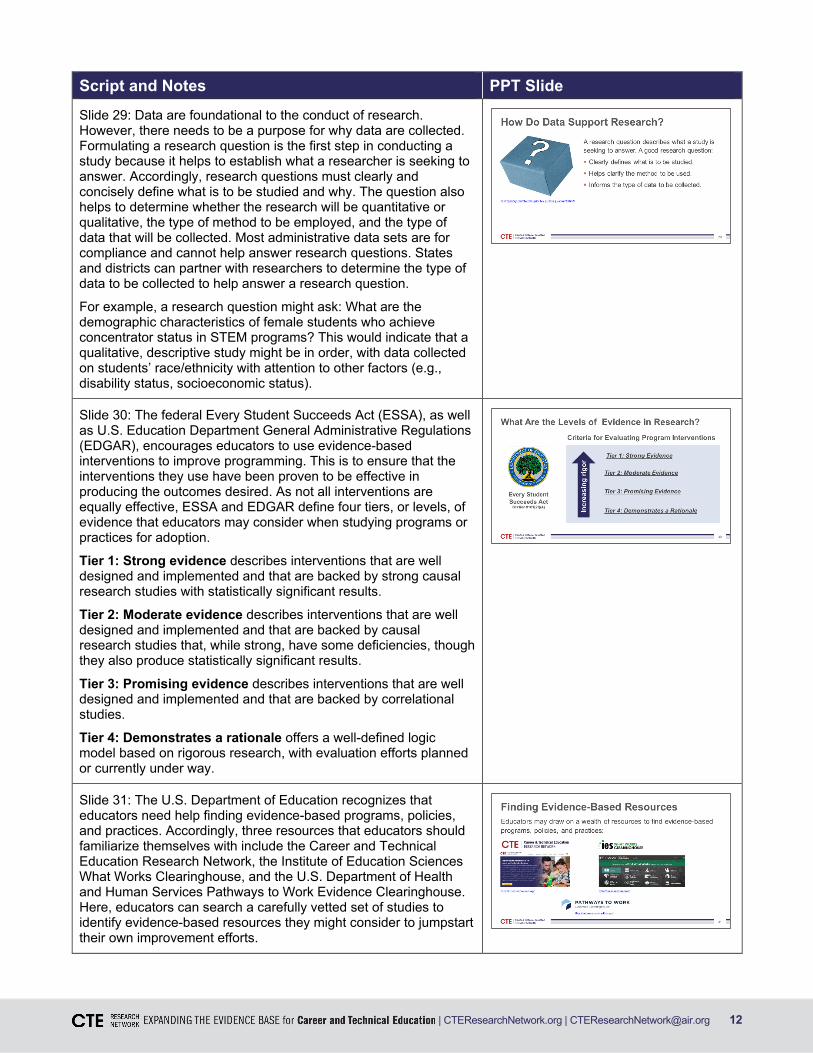
Slide 30: The federal Every Student Succeeds Act (ESSA), as well as U.S. Education Department General Administrative Regulations (EDGAR), encourages educators to use evidence-based interventions to improve programming. This is to ensure that the interventions they use have been proven to be effective in producing the outcomes desired. As not all interventions are equally effective, ESSA and EDGAR define four tiers, or levels, of evidence that educators may consider when studying programs or practices for adoption.
Tier 1: Strong evidence describes interventions that are well designed and implemented and that are backed by strong causal research studies with statistically significant results.
Tier 2: Moderate evidence describes interventions that are well designed and implemented and that are backed by causal research studies that, while strong, have some deficiencies, though they also produce statistically significant results.
Tier 3: Promising evidence describes interventions that are well designed and implemented and that are backed by correlational studies.
Tier 4: Demonstrates a rationale offers a well-defined logic model based on rigorous research, with evaluation efforts planned or currently under way.
Slide 31: The U.S. Department of Education recognizes that educators need help finding evidence-based programs, policies, and practices. Accordingly, three resources that educators should familiarize themselves with include the Career and Technical Education Research Network, the Institute of Education Sciences What Works Clearinghouse, and the U.S. Department of Health and Human Services Pathways to Work Evidence Clearinghouse. Here, educators can search a carefully vetted set of studies to identify evidence-based resources they might consider to jumpstart their own improvement efforts.

| CTEResearchNetwork.org | [email protected] 13
Script and Notes PPT Slide Slide 32: When given the chance, educators should gravitate to evidence-based interventions. Because they have been carefully studied, evidence-based approaches can increase your chances of success because the idea offered has been scientifically proven and tested. Evidence-based interventions also have clearly identified outcomes; that is, you know what you will be getting. Also, because outcomes have been statistically quantified, you have a better sense of the relative level of their effectiveness.
Slide 33: Although many interventions may be proven effective, not all are appropriate for your needs. In selecting an intervention, you should consider several things. This includes the study purpose; specifically, was the intervention you identified focused on solving a problem like your own? Also, was the type and level of study rigor acceptable for your needs? For example, a descriptive study of a curricular intervention to expand program completion for nontraditional students may not be appropriate if you are needing to guarantee that its adoption will increase student performance. You also need to consider the context. Was the study site like your own? Were student populations similar? Finally, you need to consider the expected results. Were the outcomes reported aligned to your goals? Will the level of effectiveness justify your investment?
Slides 34–35: Closing Reflection and Resources
Slide 34: Congratulations on completing Model 1: Understanding CTE Data and Why It Matters. We hope that this module has provided you with useful information to help structure your CTE improvement efforts.
Slide 35: To help close out your module engagement, please consider how you might use the information contained in this module to improve your use of data and research. Stop the module and follow the directions on the Activity 3 worksheet.
For facilitated in-person professional learning, this closing reflection question activity should be done as a 20-minute grouped exercise.

| CTEResearchNetwork.org | [email protected] 14
Script and Notes PPT Slide Slides 36–37: References, Resources, and Contact Information
Review resources and final slide with contact information.
Thank participants for attending.

| CTEResearchNetwork.org | [email protected] 15
References and Resources Institute of Education Sciences. (n.d.). What Works Clearinghouse. Retrieved from https://ies.ed.gov/ncee/wwc
Michigan Department of Education. (2019). Michigan career and technical education 2018-2019. Retrieved from https://www.michigan.gov/documents/mde/CTE_Fact_Brochure_201920_online_ADA_687807_7.pdf
Santa Ana Unified School District. (2020). Career technical education: Preparing all students for success in college and career. Retrieved from https://www.sausd.us/cte
The College System of Tennessee, Office of Policy and Strategy. (n.d.)..Data and research. Retrieved from https://www.tbr.edu/policy-strategy/data-and-research
U.S. Department of Health and Human Services. (2020). Pathways to Work Evidence Clearinghouse. Retrieved from https://pathwaystowork.acf.hhs.gov/
Activity Handouts 1–3