modulation of remyelination by adaptive inflammation and
TRANSCRIPT
Modulation of remyelination by adaptive inflammation and electrical stimulation
Dissertation
For the award of the degree
"Doctor rerum naturalium" (Dr. rer. nat.)
of the Georg-August-University Göttingen
within the doctoral program Molecular Medicine
of the Georg-August University School of Science (GAUSS)
submitted by
Patrik Kunz
born in
Dortmund, Germany
Göttingen, 2017

Members of the Thesis Committee
Supervisor
Prof. Dr. Walter Paulus
Department of Clinical Neurophysiology
University Medical Center, Georg-August University Göttingen
Second member of the thesis committee
Prof. Dr. Wolfgang Brück
Department of Neuropathology
University Medical Center, Georg-August University Göttingen
Third member of the thesis committee
Prof. Dr. Jutta Gärtner
Department of Pediatrics
University Medical Center, Georg-August University Göttingen
Affidavit
I hereby declare that my doctoral thesis entitled “Modulation of remyelination by
adaptive inflammation and electrical stimulation” has been written independently with
no other sources and aids than quoted.
___________________
Patrik Kunz
Göttingen, April 2017

Meinen Eltern

List of publications
Original article
Kunz P, Antal A, Hewitt M, Neef A, Opitz A, Paulus W (2017). 5 kHz Transcranial Alternating
Current Stimulation: Lack of Cortical Excitability Changes When Grouped in a Theta Burst
Pattern. Frontiers in Human Neuroscience 10, 1-8
Abstract
Kunz P, Stadelmann-Nessler C, Paulus W.
tACS in a rat model of focal demyelination.
6th International Conference of Transcranial Brain Stimulation, September 7th-10th 2016,
Göttingen, Germany, poster session
Kunz P*, Escher A*, Brück W, Nessler S, Barrantes-Freer A, Stadelmann-Nessler, C
Influence of autoimmune inflammation on remyelination in cuprizone-induced demyelination.
12th European on Glia Cells on Health and Disease, July 15th-18th 2015, Bilbao, Spain, poster
session
*=equal contribution
Kunz P, Antal, A, Paulus, W
Modulation of cortical excitability by grouped electrical stimulation protocols.
30th International Congress of Clinical Neurophysiology, March 19th-23rd 2014, Berlin,
Germany, poster session

Table of Content
Table of Content
Acknowledgements .......................................................................................................... I
Abstract ............................................................................................................................ II
List of Figures ................................................................................................................. IV
List of Tables ................................................................................................................... VI
Abbreviations ................................................................................................................. VII
1. Introduction ............................................................................................................... 1
1.1 Multiple sclerosis .................................................................................................. 1
1.1.1 MS pathology ................................................................................................................... 2
1.1.2 MS lesion histopathology ................................................................................................ 5
1.1.3 MS animal models ........................................................................................................... 6
1.1.3.1 Experimental autoimmune encephalomyelitis ........................................................... 6
1.1.3.2 Toxic demyelination by Cuprizone administration ...................................................... 7
1.1.3.3 Cuprizone-EAE model .................................................................................................. 8
1.1.3.4 Focal demyelinated lesions ......................................................................................... 9
1.2 Myelination ............................................................................................................ 9
1.2.1 Oligodendrocyte development ..................................................................................... 10
1.2.2 Remyelination in MS...................................................................................................... 11
1.3 Electrical stimulation in neurodegenerative diseases .......................................13
1.3.1 Clinical application ......................................................................................................... 13
1.3.2 Influence of electrical stimulation on neuronal progenitor cells .................................. 14
1.3.3 Peripheral nerve regeneration/remyelination by electrical stimulation ...................... 14
1.3.4 Influence of electrical stimulation on CNS remyelination ............................................. 15
1.4 Transcranial electrical stimulation ......................................................................18
1.4.1 Transcranial magnetic stimulation ................................................................................ 18
1.4.2 Transcranial alternating current stimulation ................................................................ 19
1.5 Aim of this thesis .................................................................................................20
2. Methods ....................................................................................................................22
2.1 Materials ...............................................................................................................22
2.2 Cuprizone-EAE .....................................................................................................35
2.2.1 Animals .......................................................................................................................... 35

Table of Content
2.2.2 Cuprizone-induced demyelination ................................................................................ 35
2.2.3 Induction of brain inflammation ................................................................................... 35
2.2.4 Electron microscopy ...................................................................................................... 36
2.2.5 Histopathology .............................................................................................................. 37
2.2.5.1 Histochemical stainings ............................................................................................. 37
2.2.5.2 Immunohistochemical stainings ................................................................................ 38
2.2.6 Flow cytometric analysis ............................................................................................... 40
2.2.7 Statistical analysis .......................................................................................................... 41
2.3 Electrical stimulation in mixed cortical cultures ................................................43
2.3.1 Primary cultures – oligodendrocytes............................................................................. 43
2.3.2 Primary cultures – oligodendrocytes and neurons ....................................................... 44
2.3.3 Electrical stimulation in vitro ......................................................................................... 45
2.3.4 LDH cytotoxicity test ...................................................................................................... 45
2.3.5 Immunocytochemical stainings ..................................................................................... 46
2.3.6 Quantification of myelin protein expression in oligodendrocyte cultures ................... 46
2.3.7 Quantification of myelinated fibers in oligodendrocyte/neuron mixed cultures ......... 46
2.4 Electrical stimulation in rodent models of demyelination .................................47
2.4.1 Focal demyelination model ........................................................................................... 47
2.4.1.1 Animals ...................................................................................................................... 47
2.4.1.2 Stereotactical injection .............................................................................................. 48
2.4.1.3 Electrical Stimulation ................................................................................................. 48
2.4.2 Chronic cuprizone model............................................................................................... 48
2.4.2.1 Animals ...................................................................................................................... 49
2.4.2.2 Electrical stimulation ................................................................................................. 49
2.4.3 Histopathology .............................................................................................................. 49
2.4.3.1 Histochemical stainings ............................................................................................. 49
2.4.4 Immunohistochemical stainings .................................................................................... 50
2.4.5 Data analysis .................................................................................................................. 51
2.5 Transcranial electrical stimulation in healthy human subjects ........................54
2.5.1 Subjects ......................................................................................................................... 54
2.5.2 Transcranial magnetic stimulation ................................................................................ 54
2.5.3 Experimental design ...................................................................................................... 55
2.5.4 Electrical theta burst stimulation .................................................................................. 55
2.5.5 Data analysis .................................................................................................................. 56
Table of Content
3.1 Influence of autoimmune inflammation on remyelination in Cuprizone-induced demyelination .......................................................................................................58
3.1.1 Cuprizone administration for 4.5 weeks leads to demyelination in the corpus callosum in Cup and Cup-EAE animals .......................................................................................... 58
3.1.2 Increased infiltration and activation of immune competent cells in Cuprizone/MOG treated animals .............................................................................................................. 59
3.1.3 The number of OPC and mature OLG is largely unaffected by EAE induction .............. 62
3.1.4 The density of myelin producing cells and degree of remyelination remain unchanged after immunization with MOG35-55 peptide ................................................................... 64
3.1.5 Increased axonal damage in Cuprizone/MOG treated animals .................................... 66
3.1.6 The density of myelinated axons is unaffected by EAE induction ................................. 67
3.2 Influence of transcranial alternating current stimulation on spontaneous remyelination in in vitro and in vivo models ......................................................71
3.2.1 Influence of alternating current stimulation on cell viability and myelin production in primary oligodendroglial cell cultures and mixed cortical cell cultures ........................ 71
3.2.1.1 The amount of myelin producing oligodendrocytes in primary oligodendrocyte cultures remains unchanged after electrical stimulation .......................................... 71
3.2.1.2 Myelination and cell viability in mixed cortical cell cultures are unaffected by electrical stimulation ................................................................................................. 72
3.2.2 Influence of transcranial alternating current stimulation on spontaneous remyelination in rodent models of demyelination ....................................................... 75
3.2.2.1 Focal EAE model ........................................................................................................ 75
3.2.2.2 Chronic Cuprizone model .......................................................................................... 85
3.3 Transcranial electrical stimulation in healthy human subjects ........................92
3.3.1 MEP amplitudes after eTBS did not differ from MEP after sham treatment ................ 92
3.3.2 No significant effect on MEP amplitudes after stimulation with altered ecTBS protocols ....................................................................................................................................... 94
4.1 Influence of autoimmune inflammation on remyelination in Cuprizone-induced demyelination .......................................................................................................97
4.1.1 Increased infiltration of the CNS by immune competent cells in Cup-EAE mice .......... 97
4.1.2 Damaging and neuroprotective effects of autoimmune inflammation ........................ 98
4.1.3 Influence of adaptive inflammation on oligodendrocyte populations and remyelination ....................................................................................................................................... 99
4.2 Influence of transcranial alternating current stimulation on spontaneous remyelination in in vitro and in vivo models .................................................... 102
4.2.1 Electrical stimulation in oligodendrocyte and mixed cortical cultures ....................... 102

Table of Content
4.2.1.1 Safe application of 10 mA alternating currents....................................................... 102
4.2.1.2 Electrical stimulation failed to increase myelination in vitro .................................. 102
4.2.2 Electrical stimulation in rodent models of demyelination .......................................... 103
4.2.2.1 Induction of focal demyelinated lesions after intracortical injection of anti-MOG antibody and complement ...................................................................................... 103
4.2.2.2 Robust remyelination in sham and ESTIM animals ................................................. 105
4.2.2.3 Heterogeneous remyelination of the corpus callosum after 13 weeks of Cuprizone administration ......................................................................................................... 107
4.2.2.4 ESTIM failed to exert effects on remyelination or oligodendrocyte populations ... 108
4.3 Transcranial electrical stimulation in healthy human subjects ...................... 111
4.3.1 Differences in electric field strength and orientation may cause lack of effects on cortical excitability by eTBS protocols ......................................................................... 111
4.3.2 Safe application of 10 mA eTBS but high interindividual variability ........................... 112
5. Summary and conclusion ..................................................................................... 114
5.1 Influence of autoimmune inflammation on remyelination in Cuprizone-induced demyelination ..................................................................................................... 114
5.2 Influence of transcranial alternating current stimulation on spontaneous remyelination in in vitro and in vivo models .................................................... 115
5.3 Transcranial electrical stimulation in healthy human subjects ...................... 116
6. Bibliography ........................................................................................................... 117

Acknowledgements
~ I ~
Acknowledgements
First and foremost, I would like to thank my supervisors Prof. Dr. Walter Paulus and
Prof. Dr. Stadelmann-Nessler for their great and constant support, their guidance as well as
for providing me with the opportunity to pursuit my own ideas. I am particularly thankful for all
the interesting and multi-facet experiences I was able to gain by working in the Department
of Clinical Neurophysiology as well as in the Department of Neuropathology. Furthermore, I
am grateful for all the inspiring discussions, which frequently took place despite very tight
schedules and I enjoyed the professional but also familiar atmosphere in both Departments.
I would also like to thank Prof. Dr. Wolfgang Brück, not only for giving me the
opportunity to work in the Department of Neuropathology but also for being part of my thesis
committee and for the inspiring discussions during the thesis committee meetings. In line
with this, many thanks to Prof. Dr. Jutta Gärtner for being the third member of my thesis
committee and for the helpful contributions during the meetings.
Moreover, I want to thank Dr. Stefan Nessler, Dr. Claudia Wrzos, Dr. Anne Winkler, Dr. Alonso Barrantes-Freer, Dr. Alexander Opitz and Prof. Dr. Andrea Antal for
teaching me so many different methods and for helping me out with experimental designs.
Speaking of experiments, I would have never been able to perform so many without
the excellent help of our laboratory assistants Olga, Heidi, Brigitte, Katja, Angela, Jasmin
and Giselheid. Further thanks go to Uta and Mareike for teaching me several aspects of
immunohistochemical stainings. Moreover, special thanks to Claudia and Anne for their
helpful comments on this manuscript.
Furthermore, I would like to thank my colleagues from the Department of Clinical
Neurophysiology Ivan, Zsolt, Gabriel, Annika, Alex, Albert, Yuichiro, Manuel and Giorgi for the frequent support as well as the good times inside and outside of the clinic. Also, many
thanks to the ladies of the Neuropathology Martina, Franzi, Verena, Claudia, Anne, Silke,
Lena, Nielsen, Nadine, Jana, Caro, Susi, Erika, Linda, Sarah, Kim and, of course, also to
Basti, Darius as well as all other colleagues and friends. Thank you so much for all the
great times, the scientific (and completely non-scientific) discussions and especially for
accepting and welcoming the roomless guy from the Neurophysiology back in the days.
Finally, I would like to thank my parents Jutta and Martin for always supporting me
and for all the trust and faith they have in me. Last but certainly not least, thank you Kathi for
always being there for me and for your sympathy and love.

Abstract
~ II ~
Abstract
Multiple sclerosis (MS) is a chronic, inflammatory demyelinating disease of the central
nervous system (CNS). Typical characteristics of MS are blood-brain barrier (BBB)
breakdown, invasion of peripheral immune cells, demyelinated lesions and axonal damage
with functional loss. Although the brain is able to remyelinate demyelinated lesions to a
certain degree during the relapsing-remitting phase, for reasons yet unknown remyelination
fails in the later, chronic stages of MS. The different disease stages of MS feature different
pathological mechanisms, e.g. T cell infiltration and inflammatory activity decreases during
the chronic phase, accompanied by a reduced remyelination capacity of the demyelinated
lesions. Therefore, in this thesis, we evaluated the impact of CNS infiltrating and auto-
reactive immune cells on remyelination in a mouse model of demyelination.
We demonstrated that the induction of experimental autoimmune encephalomyelitis
(EAE) by immunization with MOG35-55 peptide in a model of Cuprizone-induced
demyelination led to increased infiltration of inflammatory mediators like T cells, B cells, NK
cells, granulocytes and inflammatory monocytes and subsequent increased axonal damage.
The infiltration of the CNS by auto-reactive immune cells however, did not substantially
influence the remyelination process, as indicated by the analysis of oligodendrocyte
populations, myelin formation and myelinated fiber density in the corpus callosum (CC).
To improve the efficacy of remyelination in demyelinating diseases like MS is of great
therapeutic interest. Recent studies demonstrated neuroregenerative effects and increased
(re-)myelination by electrical stimulation in mixed cortical cell cultures as well as rodent
models of peripheral nerve injury and ischemic stroke. Based on these studies, we
established a novel method for transcranial electrical stimulation in a rat model of focal,
cortical demyelination as well as in a mouse model of chronic, Cuprizone-induced
demyelination. Furthermore, we evaluated the impact of alternating current stimulation on
oligodendrocyte survival, myelin production and the myelination of axonal fibers in
oligodendrocyte and mixed cortical cultures.
The in vitro experiments did not reveal an impact of electrical stimulation on
oligodendrocyte numbers and cell viability. Also, no effects on myelin production or the
amount of myelinated fibers could be determined. However, we were able to apply
transcranial alternating electrical currents safely and mostly non-invasively and therefore
established the foundation for further experiments. However, the lack of effects on
oligodendrocyte populations and remyelination, most likely caused by insufficient stimulation
of neurons, indicate the need for improved stimulation protocols in terms of intensity and
directionality.

Abstract
~ III ~
Theta burst stimulation (TBS), a form of repetitive transcranial magnetic stimulation
(rTMS) established by Huang et al. in 2005, showed promising results in modulating
neuronal activity of healthy human subjects, demonstrated by alterations of motor responses.
Since the application of rTMS can be very uncomfortable for the recipient and bears an
elevated risk of inducing epileptic seizures, we translated the established TBS protocols into
electrical TBS (eTBS) protocols using high frequency, high intensity transcranial alternating
currents.
A double-blinded, crossover clinical study on healthy human subjects was conducted,
and eTBS proofed to be a safe and non-invasive way to apply high frequency, high intensity
alternating currents to the human brain. However, no effects on cortical excitability were
observed by analysis of muscle evoked potential (MEP) responses.

List of Figures
~ IV ~
List of Figures
Figure 1: MS pathogenesis and cytokine involvement.......................................................... 4
Figure 2: Electrical currents in the CNS – influence on progenitor cell recruitment, OPC
behavior and myelination....................................................................................................... 17
Figure 3: Time scale of cuprizone treatment and EAE induction........................................... 36
Figure 4: Time line of electrical stimulation in oligodendrocyte cultures and mixed cortical
cultures.................................................................................................................................. 45
Figure 5: Quantification of myelinated axons in mixed cortical cultures................................ 47
Figure 6: Time line of the chronic cuprizone model............................................................... 49
Figure 7: Schematic overview of the four separate counting areas used to evaluate OLG
populations in the focal EAE model....................................................................................... 52
Figure 8: Schematic illustration of the eTBS protocols.......................................................... 56
Figure 9: 4.5 weeks of Cuprizone administration causes severe demyelination of the CC in
Cup and Cup-EAE mice......................................................................................................... 59
Figure 10: Immunization with MOG35-55 peptide leads to increased infiltration of immune
competent cells...................................................................................................................... 61
Figure 11: Less mature OLG in the medial corpus callosum at the RM time point after EAE
induction................................................................................................................................ 63
Figure 12: The extent of de- and remyelination is unaffected by EAE induction................... 65
Figure 13: The density of PLP-mRNA+ cells is not affected by immunization with MOG35-55
peptide................................................................................................................................... 66
Figure 14: Increased number of APP+ axons in the lateral CC of Cup-EAE mice................. 67
Figure 15: The density of myelinated axons is significantly reduced in Cup-EAE animals at
the DM time point and not significantly different between the experimental groups at the RM
time point............................................................................................................................... 69
Figure 16: O4+ oligodendrocytes and expression of MBP are unaffected by electrical
stimulation.............................................................................................................................. 72
Figure 17: ESTIM does not influence the amount of myelinated fibers................................. 73

List of Figures
~ V ~
Figure 18: Cell survival is not influenced by electrical stimulation......................................... 74
Figure 19: Formation of a demyelinated lesion after stereotactical injection with Z2 antibody
and mouse complement without substantial axonal damage and loss.................................. 76
Figure 20: Lesion formation of sham and ESTIM animals over a time course of 21 days
demonstrated by MBP immunohistochemistry....................................................................... 77
Figure 21: Demyelinated lesion size gradually decreases over a time course of three
weeks..................................................................................................................................... 78
Figure 22: Oligodendrocyte populations are largely unaffected by ESTIM............................ 81
Figure 23: Numbers of proliferating OLG are unaltered after ESTIM.................................... 85
Figure 24: The extent of remyelination of ESTIM treated animals does not differ from sham
treated animals...................................................................................................................... 86
Figure 25: ESTIM did not change the density of OPC after chronic demyelination............... 87
Figure 26: Numbers of NogoA+ cells are not altered by ESTIM............................................. 88
Figure 27: Overall low number of proliferating OPC after 5 and 10 days.............................. 89
Figure 28: The amount of proliferating mature OLG is unaltered by ESTIM......................... 90
Figure 29: MEP amplitudes after eiTBS, eimTBS and ecTBS did not differ from sham........ 93
Figure 30: MEP responses remain unchanged after stimulation with altered ecTBS
protocols................................................................................................................................ 95
Figure 31: High interindividual variability of MEP amplitudes following eTBS and sham
stimulation.............................................................................................................................. 95

List of Tables
~ VI ~
List of Tables
Table 1: Reagents.................................................................................................................. 22
Table 2: Primary antibodies for immunohistochemical stainings........................................... 25
Table 3: Secondary antibodies for immunohistochemical stainings...................................... 26
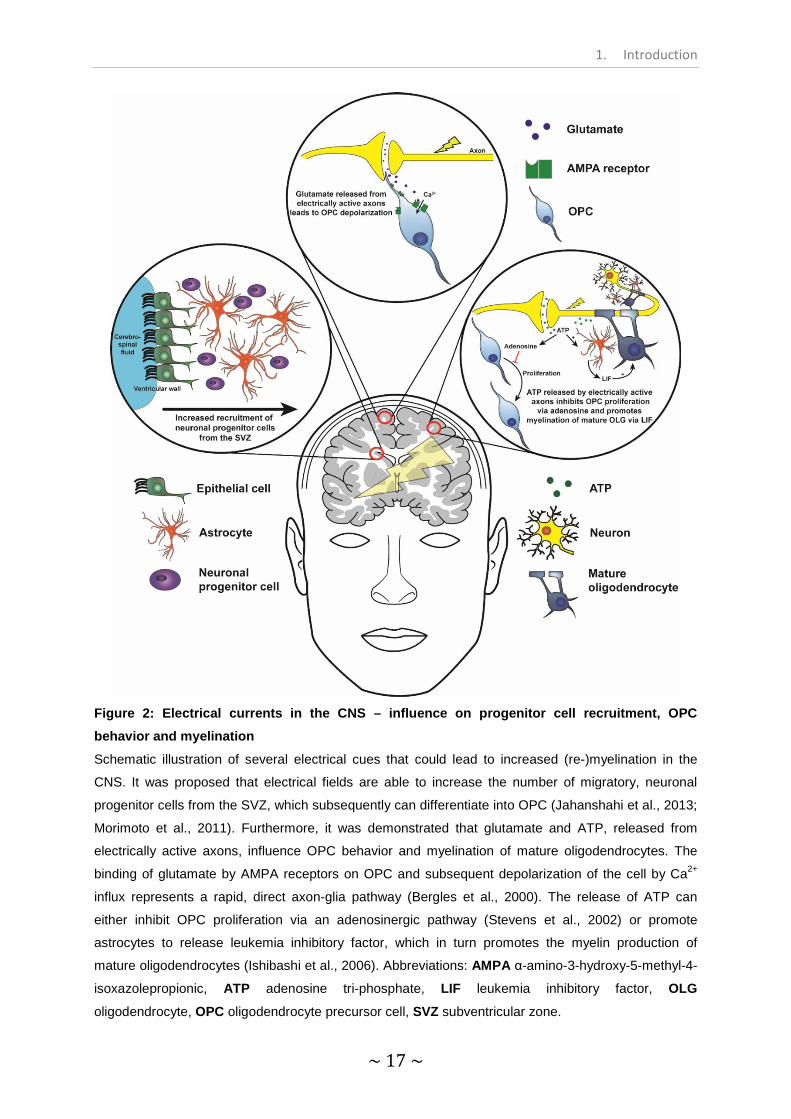
Table 4: Flow cytometric antibodies...................................................................................... 27
Table 5: Proteins and enzymes............................................................................................. 27
Table 6: Solutions, buffer and media ..................................................................................... 29
Table 7: Consumables........................................................................................................... 31
Table 8: Technical devices.................................................................................................... 32
Table 9: Software................................................................................................................... 33
Table 10: EAE score assessment.......................................................................................... 36
Table 11: Demyelination score assessment.......................................................................... 38
Table 12: Classification of leukocyte subpopulations............................................................ 41

Abbreviations
~ VII ~
Abbreviations
AEC Amino ethyl carbazol
ADCC Antibody dependent cellular cytotoxicity
AMPA α-amino-3-hydroxy-5-methyl-4-isoxazolepropionic acid
APAAP Alkaline phosphatase – anti alkaline phosphatase
APC Antigen presenting cell
APP Amyloid precursor protein
ATP Adenosine triphosphate
BBB Blood-brain barrier
BCIP 5-bromo-4-chloro-3-indolyl phosphate
BDNF Brain derived neurotrophic factor
BrdU Bromodeoxyuridin
BSA Bovine serum albumin
cAMP Cyclic adenosine monophosphate
CC Corpus callosum
CD Cluster of differentiation
CFA Complete Freund’s Adjuvant
CNS Central nervous system
DAB 3,3’-Diaminobenzidine
DAPI 4',6-diamidino-2-phenylindole
DM Demyelination
DNA Deoxyribonucleic acid
DRG Dorsal root ganglion
EAE Experimental autoimmune encephalomyelitis
ecTBS Electrical continuous theta burst stimulation

Abbreviations
~ VIII ~
EDTA Ethylenediaminetetraacetic acid
eimTBS Electrical intermediate theta burst stimulation
eiTBS Electrical intermittent theta burst stimulation
EM Electron microscope
ESTIM Electrical stimulation
eTBS Electrical continuous theta burst stimulation
FCS Fetal calf serum
FDI First dorsal interosseous muscle
GM Gray matter
HBSS Hank's balanced salt solution
HCl Hydrochloric acid
HE Hematoxylin-Eosin
i.p. Intraperitoneal
IFA Incomplete Freund’s adjuvant
IFNγ Interferon-γ
IL-17 Interleukin-17
iNOS Inducible nitric oxide synthase
LDH Lactate dehydrogenase
LFB Luxol fast blue
LIF Leukemia inhibitory factor
MBP Myelin basic protein
MEP Muscle evoked potential
MHC Major histocompatibility complex
MOG Myelin oligodendrocyte glycoprotein
MS Multiple sclerosis

Abbreviations
~ IX ~
NAGM Normal appearing gray matter
NBT 4-nitro blue tetrazolium chloride
NF Neurofilament
NK cells Natural killer cells
NMDAr N-methyl-D-aspartate receptor
NogoA Myelin-associated neurite growth inhibitor
OLG Oligodendrocyte
OPC Oligodendrocyte precursor cell
PBS Phosphate buffered saline
PDGFR Platelet derived growth factor
PLP Proteolipid protein
PNS Peripheral nervous system
PPMS Primary progressive multiple sclerosis
PTX Pertussis toxin
RM Remyelination
RMT Resting motor threshold
RRMS Relapsing-remitting multiple sclerosis
rTMS Repetitive transcranial magnetic stimulation
SDS Sodium dodecyl sulfate
SPMS Secondary progressive multiple sclerosis
SVZ Subventricular zone
tACS Transcranial alternating current stimulation
TBS Theta burst stimulation
tDCS Transcranial direct current stimulation
tES Transcranial electric stimulation

Abbreviations
~ X ~
TGFβ Tumor growth factor β
TMS Transcranial magnetic stimulation
TNFα Tumor necrosis factor α
TTFields Tumor-treatment fields
TTX Tetrodotoxin
WM White matter

1. Introduction
~ 1 ~
1. Introduction
1.1 Multiple sclerosis
Multiple sclerosis (MS) is a chronic, inflammatory demyelinating disease of the central
nervous system (CNS) which affects approximately 2.5 million people worldwide with a
higher prevalence in women (HealthLine; Ahlgren et al., 2011). Although the exact cause of
MS is still unknown, it is widely accepted to be a T cell driven auto-inflammatory disease
(Noseworthy et al., 2000; Weiner, 2004). Speculations are made about genetic, cultural,
environmental and behavioral impacts on the disease, since, e.g., people in the northern part
of the northern hemisphere appear to be more susceptible to MS compared to people living
in the equatorial area (WHO, Atlas: Multiple Sclerosis Resources in the World 2008). The
heterogeneous disease course and prognosis of MS is another problem, which makes the
care for people with MS very challenging. The typical disease course, with the onset placed
between 25-30 years, starts with a pre-symptomatic disease with occasional neurological
symptoms called clinically isolated syndrome (Eriksson et al., 2003). Often, patients with a
clinically isolated syndrome develop relapsing-remitting MS (RRMS) in which inflammatory,
demyelinating lesions occur in the white (WM) and gray matter (GM) of the CNS (Dendrou et
al., 2015; Lassmann and Bradl, 2017). These lesions are frequently the cause for severe loss
of motor and sensory function (Tallantyre et al., 2010). However, during RRMS the CNS is
still able to remyelinate to a certain degree, whereby clinical symptoms might be reversed
(Duncan et al., 2009). RRMS ultimately leads into a secondary progressive disease phase
(SPMS). During SPMS, the severity of clinical disability increases without much evidence for
ongoing inflammatory activity, whereas the remyelination capacity seems to decrease
(Dendrou et al., 2015). Therefore, patients experience increased loss of body functions and a
severe impairment in the quality of their life (Tallantyre et al., 2010).
Another form of MS is the primary progressive disease course (PPMS), which is often
characterized by a more rapid disease progression. In PPMS, the axonal loss and thereby
the functional impairment increases gradually without regenerative phases, as the like can be
found in RRMS (Dendrou et al., 2015).
During each of the different MS phases, the molecular and cellular processes differ
significantly and make a correct treatment challenging. For instance, the degree of T cell
infiltration and therefore inflammation decreases in the later disease course (Kutzelnigg et
al., 2005; Serafini et al., 2004) accompanied by a reduction of inflammatory active plaques,
while at the same time, focal demyelinated white matter lesions are still present (Lassmann
et al., 2007). Highly effective drugs like rituximab, alemtuzumab or dimethyl fumarate work
almost exclusively by reducing lymphocyte numbers. Therefore, while effectively reducing
the relapse rate and increasing the time to progression of disability during RRMS, they prove
1. Introduction
~ 2 ~
to be less effective during the progressive disease course (Coles et al., 2006; Hauser et al.,
2013; Hawker et al., 2009). During primary and secondary progressive MS, it is of foremost
importance to improve neuroprotection and neuroaxonal repair to prevent neurodegeneration
caused by the underlying disease process.
1.1.1 MS pathology
The main hallmarks of MS are blood-brain barrier (BBB) breakdown, invasion of
peripheral immune cells, primary demyelinated lesions with subsequent oligodendroglial
demise as well as neuroaxonal damage and loss. The infiltration of autoreactive T and B
cells through the BBB into the CNS is a phenomenon which occurs early in the disease
development and is believed to be a major cause of disease pathology (Fig. 1; Noseworthy
et al., 2000; Popescu and Lucchinetti, 2012; Weiner, 2004). It was discovered that circulating
CD4+ T cells from MS patient were recognizing the basic myelin proteins proteolipid protein
(PLP), myelin oligodendrocyte glycoprotein (MOG) and myelin basic protein (MBP), therefore
indicating that the demyelinated lesions might be caused by an autoimmune response
following autoantigen presentation in the periphery (Bielekova et al., 2004). However, CD4+ T
cells obtained from healthy controls were found to occasionally display similar results
(Hellings et al., 2001).
Autoreactive CD4+ T cells in MS patients consist mostly of the subtypes TH1 and
TH17, producing the pro-inflammatory cytokines interferon-γ (IFNγ) and interleukin-17 (IL-
17), respectively (Cao et al., 2015; Goverman, 2009). Once inside the CNS, it is believed that
pro-inflammatory cytokines like IFNγ, IL-17, IL-1β, IL-2 and tumor necrosis factor α (TNFα)
facilitate an immune reaction and further weaken the BBB (Minagar and Alexander, 2003).
IFNγ and IL-17 promote the activation of antigen presenting cells, represented in the CNS by
astrocytes, microglia and macrophages, while IL-1β is mostly expressed by microglia and
infiltrating macrophages and can induce oligodendrocyte death in vitro (Martins et al., 2011;
Takahashi et al., 2003). IL-2 in turn, is released by CD4+ and CD8+ T cells after reactivation
with antigen presenting cells and leads to further T and B cell proliferation as well as IgG2
antibody production (Martins et al., 2011). TNFα is another cytokine released by CD4+ TH1 T
cells and is assumed to play a role in BBB breakdown, demyelination and oligodendrocyte
damage (Duchini et al., 1996; Ledeen and Chakraborty, 1998; Takahashi et al., 2003). The
inflammatory milieu caused by proinflammatory cytokines as well as a weakening of the BBB
results in further autoreactive lymphocytes and serum factors entering the CNS. Among the
infiltrates, autoreactive CD8+ T cells dominate but also B cells can be found (Frischer et al.,
2009). The CD8+ T cell numbers were found to closely correlate with axonal damage (Booss
et al., 1983; Frischer et al., 2009; Hayashi et al., 1988). While it is assumed that infiltrating
CD4+ T cells are the major source of CNS inflammation during the initial phase of MS, CD8+

1. Introduction
~ 3 ~
T cells are predominantly found during the ongoing disease and presumably are key players
for inflammation and tissue damage during the later phases of MS (Lassmann and Bradl,
2017). Similarly, the number of B cells also varies during MS development. For instance, an
increased number of antibody-secreting plasma cells was discovered in patients with
progressing PPMS or SPMS compared to RRMS (Frischer et al., 2009).
Activated microglia and macrophages express nitric oxide and reactive oxygen
species like myeloperoxidase (e.g. during myelin phagocytosis)(Gray et al., 2008; Marik et
al., 2007). Although the exact mechanisms behind neurodegeneration in MS remain mostly
elusive, several studies demonstrated mitochondrial injury and impairment due to DNA
mutation following exposure to raised levels of reactive oxygen and nitric oxide (Campbell et
al., 2012; Fischer et al., 2012; Haider et al., 2011). Oligodendrocytes (OLG) are responsible
for producing vast amounts of myelin and enwrapping nearby axons in the CNS and
therefore require a high metabolic rate and, as a result, are very susceptible to mitochondrial
damage. Thereby, it appears plausible that OLG are severely affected by an extended
increase in inflammation and mitochondrial stress induced by reactive oxygen species.
Accompanying the loss of myelin sheaths, MS lesions often depict axonal
degeneration and synaptic dysfunction (Jürgens et al., 2016; Popescu and Lucchinetti,
2012). Interestingly, a recent study demonstrated that an experimental delay of axonal
degeneration in an inflammatory, demyelinating mouse model of MS did not ameliorate the
degree of axonal damage (Singh et al., 2017). Thus, indicating a more intricate mechanism
behind axonal degeneration, including impairment of axonal transport and intra-axonal Ca2+
concentrations (Singh et al., 2017). The impairment of axonal activity due to the lack of
trophic support by extended demyelination or by axonal damage might, among other factors,
result in synaptic loss (Albert et al., 2016).

1. Introduction
~ 4 ~

1. Introduction
~ 5 ~
Figure 1: MS pathogenesis and cytokine involvement (continued from previous page)
It is assumed that autoreactive T cells are activated by antigen presenting cells in the periphery and
subsequently infiltrate the CNS through the BBB. Presumably, the initial phase of MS is mostly driven
by infiltrating CD4+ T cells consisting of the subtypes TH1 and TH17, which are producing
proinflammatory cytokines like IL-2, IL-17, IFNγ or TNFα. The cytokine release can lead to increased T
and B cell proliferation, activation of CNS antigen presenting cells, BBB impairment as well as
demyelination. During the later stage of MS, CD8+ T cells are predominantly involved in spreading
inflammation and tissue damage. Activated B cells transform into plasma cells and produce myelin
specific antibodies, which ultimately leads to phagocytosis of myelin sheaths by macrophages and
microglia. Abbreviations: APC antigen presenting cells, BBB blood brain barrier, MΦ macrophage.
1.1.2 MS lesion histopathology
The loss of myelin, as observed in MS, manifests in demyelinated lesions, which not
only occur in the white matter but also in the cerebral and cerebellar cortex as well as in the
deep gray matter. Interestingly, MS appears to be the only demyelinating disease
demonstrating subpial cortical lesions (Fischer et al., 2013), which can be characterized into
subpial, intracortical, leukocortical and pancortical lesions, depending on the respective
location (Bø et al., 2003; Kuhlmann et al., 2017). The lesion formation in MS is a very
dynamic process and is accompanied by infiltration of macrophages, microglia as well as T
and B cells. In the case of acute demyelination, microglia and macrophages clear the lesion
of myelin debris by phagocytosis (Mosley and Cuzner, 1996). Therefore, newly formed MS
lesions usually depict a high density of macrophages/microglia with incorporated fragments
of myelin (Kuhlmann et al., 2017). Since it seems that the number of macrophages and
microglia in MS lesions changes more dynamically compared to the amount of T cells and B
cells, Kuhlmann et al. suggested a new MS lesion classification system in 2017 (Kuhlmann et
al., 2017). The commonly used term “active lesion” refers to the most abundant lesion type
found in RRMS patient, featuring loss of myelin, severe infiltration with microglia and/or
blood-derived macrophages as well as T cells (Kuhlmann et al., 2017; Kutzelnigg et al.,
2005). Active lesions can also be found in SPMS patients, although less frequently
(Kutzelnigg et al., 2005). The new classification system by Kuhlmann et al. separates active
lesions into active and demyelinating as well as active and post-demyelinating lesions
(Kuhlmann et al., 2017). The active/demyelinating lesions are characterized by the presence
of macrophages/microglia containing myelin degradation products such as MBP or PLP.
Active/post-demyelinating lesions on the other hand, only show foamy
macrophages/microglia, containing unspecific lipids instead of myelin debris. Moreover,
Kuhlmann and colleagues distinguished active lesions from mixed active/inactive lesions,
which are further separated into mixed active/inactive and demyelinating as well as post-
demyelinating lesions. The main differences in mixed active/inactive compared to active

1. Introduction
~ 6 ~
lesions are a hypocellular lesion center and a lesion border marked by activated
macrophages/microglia (Kuhlmann et al., 2017). Demyelinating mixed active/inactive lesions,
as per Kuhlmann et al., can again be discriminated from post-demyelinating mixed lesions by
the presence of macrophages/microglia actively digesting myelin fragments. Inactive lesions,
finally, can be distinguished from active and mixed active/inactive lesions by their
hypocellular nature and almost complete depletion of oligodendrocytes as well as the lack of
a macrophage/microglia rim at the lesion border (Kuhlmann et al., 2017). According to
Kuhlmann and colleagues, all of the before mentioned lesion types may show signs of
remyelination. However, extensive remyelination can only be observed in approximately 20%
of the lesions (Goldschmidt et al., 2009; Patrikios et al., 2006).
The impaired remyelination is a fundamental problem in MS and I will describe the
mechanisms behind (re-)myelination as well as potential treatment approaches in 1.2.
Beforehand, however, I will describe relevant MS animal models, which helped many
discoveries regarding MS in the past decades, and discuss their advantages and
shortcomings.
1.1.3 MS animal models
1.1.3.1 Experimental autoimmune encephalomyelitis
Although there are several different animal models for MS, none is truly able to mirror
all the different facets of MS. The most frequently used model to study the inflammatory and
immunological aspects of MS is experimental autoimmune encephalomyelitis (EAE).
The origin of EAE leads back to 1925, when Koritschoner and Schweinburg
immunized rabbits with human spinal cord homogenate and induced spinal cord
inflammation and subsequently paralysis (Koritschoner and Schweinburg, 1925). To improve
reproducibility, Kabat et al. introduced the addition of complete Freund’s adjuvant (CFA),
consisting of inactivated mycobacteria, which significantly amplified the immune response by
increasing the phagocytic uptake and antigen presentation (Billiau and Matthys, 2001; Kabat
et al., 1951). Out of it evolved the EAE model as it is known today, with many different
application forms in different vertebrates. EAE can be induced in mice, rats and primates
(and other species) by immunization against myelin associated proteins and peptides like
e.g. myelin oligodendrocyte glycoprotein MOG35-55 peptide (Mendel et al., 1995). Although
EAE was originally introduced in rabbits and later in rats, today it is mostly performed in
mice, primarily due to a variety of genetically modified strains as well as less animal keeping
costs and easier handling (Croxford et al., 2011). Similar to MS, this model displays
infiltration of the CNS by activated lymphocytes, a breach of the BBB and axonal damage,
which however, mainly takes place in the spinal cord. Contrary to MS, the inflammatory
mediators are mostly autoreactive major histocompatibility complex (MHC) class II restricted

1. Introduction
~ 7 ~
CD4+ T cells which orchestrate mainly primary axonal damage with prevailing secondary
demyelination (Kim et al., 2006; Nikić et al., 2011; Soulika et al., 2009), while in MS generally
a primary demyelination with secondary axonal damage is displayed. The immunization of
mice with MOG35-55 peptide and CFA is usually accompanied by injections with pertussis
toxin (PTX) (Hofstetter et al., 2002).
This active EAE model generally displays an ascending paralysis, starting at the tail
(disease onset 10-14 days after immunization), followed by impairment/paralysis of the hind
limbs, the abdominal muscles and ultimately the forelimbs. Similar to progressive MS, EAE
induction in C57Bl/6 mice leads to a monophasic disease course with infrequent remission
and chronic neurological impairment.
In recent years, many alternative EAE models were established. Among these are
models like the adoptive transfer of T cells as well as animals that develop a spontaneous
EAE due to genetic manipulation. The former extracts myelin-antigen specific T cells from a
donor animal and transfers them into a naïve recipient animal to induce brain inflammation
(Ben-Nun et al., 1981; Flügel et al., 2001). The spontaneous EAE model, on the other hand,
uses transgenic animals which express T cell receptors specific for myelin proteins like MOG
(Bettelli et al., 2003). Up to 80% of double transgenic mice develop a spontaneous EAE
several months after birth (Pöllinger et al., 2009). However, similar to the classic EAE, the
inflammation is driven mainly by CD4+ T cells.
1.1.3.2 Toxic demyelination by Cuprizone administration
Different aspects of MS can be studied by models of toxic demyelination. Several
models were established in recent years, utilizing substances like Cuprizone, lysolecithin or
ethidium bromide. Cuprizone, one of the most frequently used toxic agents, is administered
by mixing the cuprizone powder with animal chow. Most commonly, it is fed to C57Bl/6 mice
and leads to demyelination by oligodendrocyte death if administered for four to six weeks,
depending on the Cuprizone dose and the age at the time of application (Hiremath et al.,
1998; Matsushima and Morell, 2001). Once the mice are put on normal chow, they
remyelinate over a time course of several days to weeks up to an almost full recovery.
The exact mechanisms behind the oligodendrocyte death remain largely unknown,
although it is assumed that Cuprizone, being a copper chelator, exerts its effects by depriving
oligodendrocytes (and all other cells) of copper. Copper is a trace element required by
cytochrome oxidase, which plays a crucial role in oxidative phosphorylation. Copper
deficiency results in enlarged, bloated and subsequently impaired mitochondria in the liver,
thus demonstrating a severe impact on cell metabolism (Suzuki, 1969; Suzuki and Kikkawa,
1969). Since oligodendrocytes entertain a high metabolic rate to provide axons with vast
amounts of myelin as well as trophic support, it is believed that they are especially

1. Introduction
~ 8 ~
susceptible to metabolic stress caused by the lack of copper (Matsushima and Morell, 2001).
However, re-administering copper to Cuprizone treated mice failed to reduce oligodendrocyte
death and demyelination (Carlton, 1967).
Although the demyelination followed by remyelination in the Cuprizone model
provides a good opportunity to study the molecular backgrounds of de- and remyelination,
the spontaneous remyelination phase following Cuprizone treatment occurs very rapidly and
displays an extensive recovery. Therefore, short-termed Cuprizone feeding does not mirror
the impaired remyelination observed in PPMS and SPMS. To deal with this problem, the
chronic Cuprizone model was established (Matsushima and Morell, 2001). Here, mice were
fed Cuprizone for an extended period of 12 weeks and showed an impaired remyelination for
at least 6 weeks (Harsan et al., 2008; Hussain et al., 2013).
In contrast to MS, the immune response after Cuprizone administration is mainly
driven by microglial and astrocytic response, limiting the comparability to MS (Carlton, 1967;
Hiremath et al., 1998). To study demyelination under the influence of infiltrating autoreactive
immune cells, a new animal model including inflammatory T cells should be established.
1.1.3.3 Cuprizone-EAE model
One way to address the multi-faceted symptoms of MS would be to combine the
Cuprizone model with the phenotypic CNS demyelination with the adaptively-driven EAE as it
was done in the doctoral thesis of Angelika Escher in 2008 and by Boretius and colleagues in
2012 (Boretius et al., 2012). As previously mentioned, the degree of inflammation in MS
decreases in the later, progressive disease course (Kutzelnigg et al., 2005; Serafini et al.,
2004). This correlates with an impairment in remyelination and increased neurodegeneration
(Noseworthy et al., 2000), thus provoking the thought that a certain inflammatory milieu might
support remyelination (Foote and Blakemore, 2005). On the other hand, Lin et al. reported in
2006 that IFNγ, a pro-inflammatory cytokine produced by activated T cells and natural killer
cells in MS, effectively impaired remyelination in Cuprizone and EAE animals (Lin et al.,
2006).
The immunization of Cuprizone treated mice with MOG35-55 peptide in combination
with PTX and thereby activation of the adaptive immune system in a model of CNS
demyelination might shed some light on the impact of inflammatory mediators on
remyelination. So far, A. Escher was able to demonstrate that the induction of EAE in
Cuprizone animals led to an increase of inflammatory cells like CD3+ T cells, microglia and
macrophages as well as increased expression of the inflammatory markers iNOS, MHC class
II and IFNγ. However, no difference was discovered between Cuprizone-EAE and Cuprizone
animals by analysis of myelin- and oligodendrocyte specific stainings and oligodendrocyte
related genes in the corpus callosum (CC).

1. Introduction
~ 9 ~
1.1.3.4 Focal demyelinated lesions
The focal stereotactical injection of myelin specific antibodies or pro-inflammatory
cytokines represents another way to study primary demyelination in white or gray matter
lesions. In 2006, Merkler et al. established a method to target EAE lesions to the cortex.
Demyelinated lesions were created by cortical injection of TNFα and IFNγ in rats sub-
clinically immunized with recombinant MOG1-125 protein (Merkler et al., 2006). Thereby,
demyelinated cortical lesions with T cell as well as microglia/macrophage involvement were
induced, resembling cortical lesions observed in MS patients (Kutzelnigg et al., 2005).
Furthermore, these cortical demyelinated lesions underwent rapid and extensive
remyelination (Merkler et al., 2006).
A further advantage of stereotactical injections is the introduction of autoreactive
antibodies into the CNS which otherwise would not be able to pass the BBB effectively
(Saadoun et al., 2010, 2014; Wrzos et al., 2014). For instance, in 2014 Wrzos et al.
demonstrated that the injection of recombinant anti-aquaporin 4 auto-antibodies of NMO
patients in combination with human complement produced astrocyte-depleted lesions with
secondary oligodendrocyte death and demyelination, therefore elucidating different
mechanisms regarding demyelination in MS and NMO (Wrzos et al., 2014). Consequently,
the stereotactical injection of demyelinating agents into the CNS offers promising
opportunities to study de- and remyelination with and without activation of the immune
system in a controlled and reproducible manner.
1.2 Myelination
Myelin is a complex structure, which is formed by mature oligodendrocytes in the
CNS and by Schwann cells in the peripheral nervous system (PNS) to provide metabolic and
mechanical support for axons and to improve nerve conduction by a process called “saltatory
conduction”. Oligodendrocytes form sheaths of myelin around nearby axons, which is a
major component of the white matter in humans (50-60% dry weight of the white
mater)(Morell and Norton, 1980) and was first discovered by Virchow in 1854 (Virchow,
1854). Recent studies indicated that alongside improved nerve conduction, myelin or more
precisely oligodendrocytes and Schwann cells also provide metabolic and trophic support for
myelinated axons (Beirowski et al., 2014; Fünfschilling et al., 2012; Lee et al., 2012; Morrison
et al., 2013). For instance, in 2012 Lee et al. demonstrated that the lack of lactate transport
by the lactate transporter monocarboxylate transporter 1, localized in myelin sheaths around
CNS axons, led to axonal dysfunction and neurodegeneration (Lee et al., 2012).
Most of the myelination during human development takes place during the first year of
life and continues throughout young adulthood (Fields, 2008). The ability of the CNS for
myelination remains during the entire life and is directly linked to brain plasticity, as

1. Introduction
~ 10 ~
demonstrated by a process called “adaptive myelination”. It explains how experiences like
learning new motor or cognitive skills can have a direct effect on white matter volume, not
only during development (Bengtsson et al., 2005) but also in healthy adults (Schlegel et al.,
2012; Scholz et al., 2010). Although the formation of new myelin sheaths is very important, it
is crucial to control myelination so as not to myelinate, for instance, inactive axons, axons,
which are already myelinated or the full length of an unmyelinated axon. This is
accomplished by complex processes, which are not fully understood yet. In vitro studies
suggest that electrical activity from axons might lead to the release of neurotransmitters such
as ATP and glutamate which in turn influence oligodendrocyte calcium levels and modulate
MBP protein synthesis (Wake et al., 2011). These findings could explain the increase in WM
volume observed during adaptive myelination. Furthermore, ligands expressed by axons like
Jagged, polysialylated-neural adhesion cell molecule and Lingo1 were discovered to inhibit
either oligodendrocyte precursor cell (OPC) differentiation or myelination (Charles et al.,
2000; Mi et al., 2005; Wang et al., 1998). Moreover, during the enwrapping process the
axonal and glial surfaces have to communicate with each other in order to sustain the
contact. In this, the axoglial adhesion complex consisting of contactin-1 and the contactin-
associated protein 1 seem to play a crucial role on the axon with the counterpart neurofascin
on the glia surface (Pedraza et al., 2009; Zonta et al., 2008).
Different models exist to describe the method by which oligodendrocytes enwrap
axons in the CNS, e.g. the “jelly roll” model (Bunge et al., 1961), the “serpent” model
(Pedraza et al., 2009), the “liquid croissant” model (Sobottka et al., 2011) or the “ofiomosaic”
model (Ioannidou et al., 2012). A recent study indicated that oligodendrocytes might
myelinate axons with a single triangular-shaped membrane sheath which wraps around the
axon by the foremost leading edge going underneath the previously produced layer and
simultaneously expanding laterally (Snaidero et al., 2014). The myelin sheath extends
laterally until it forms paranodal loops with the help of the before mentioned proteins
contactin-1, contactin-associated protein 1 and neurofascin, thus creating the nodes of
Ranvier. Since the frequency and length of internodes on each axon plays an important role
in neuronal coupling and conduction velocity (Waxman, 1997; Wu et al., 2012), a controlled
myelination is crucial. Oligodendrocytes, being the myelin producing cells in the CNS, are
one of the key players in orchestrating those mechanisms, therefore oligodendrocyte
development and maturation is regulated by a complex set of factors.
1.2.1 Oligodendrocyte development
Oligodendrocytes have to differentiate from oligodendrocyte precursor cells into
immature pre-myelinating oligodendrocytes and subsequently into mature oligodendrocytes
before they are able to enwrap axons with myelin sheaths. During early development, initial

1. Introduction
~ 11 ~
waves of OPC are generated in the ventral part of the neural tube, which changes to the
dorsal area of the neural tube during the late developmental course (Penfield, 1924). But
OPC are continuously produced throughout adulthood as well, originating from neural stem
cells in the subventricular zone (SVZ) (Menn et al., 2006), as well as from NG2 glia cells,
which can be found throughout the CNS and seem to remain in a slowly proliferative state
(Dawson et al., 2003; Simon et al., 2011; Young et al., 2013). Regardless of the
developmental stage, OPC typically proliferate and migrate through the CNS before reaching
a target site and differentiating into mature myelinating oligodendrocytes. The process of
differentiation is tightly regulated by numerous genes, transcription factors and
neurotransmitters. Following, I will summarize a few of the regulators, which are vital for the
differentiation from OPC into mature myelinating oligodendrocytes.
The transcription factor Olig2, for instance, is expressed in oligodendrocytes
throughout their development, primarily in OPC and premature oligodendrocytes, thus
serving as a prominent oligodendrocyte lineage marker. Olig2 is crucial for the development
of oligodendrocytes as was shown by Takebayashi in 2002 (Takebayashi et al., 2002).
Further transcription factors like Hes5 (Liu et al., 2006), Sox5 and Sox6 (Stolt et al., 2006) or
the receptor tyrosine kinase PDGFRα (Raff et al., 1988) were identified to prevent OPC from
undergoing differentiation, therefore an inhibition of those factors with e.g. microRNA 219
and 338 is necessary to allow further differentiation (Dugas et al., 2011). As previously
mentioned the ligand Jagged1, which is expressed by axons, also inhibits OPC maturation
(Wang et al., 1998), while axonal activity might serve as a pro-differentiation stimulus. In this
regard, recent studies indicated a correlation between the release of adenosine and/or
adenosine triphosphate (ATP) by electrically active axons and improved differentiation of
OPC and subsequent myelination (Ishibashi et al., 2006; Stevens et al., 2002). The utilization
of DNA microarrays led to the discovery of the so called myelin gene regulatory factor, a
specific transcription factor which is solely expressed by post mitotic oligodendrocytes and
whose absence leads to a halt in the maturation process at a premyelinating state (Emery et
al., 2009). Therefore, it can be summarized that the inactivation of several transcription
factors and ligands, which keep OPC from undergoing differentiation with the simultaneous
activation/expression of maturation-inducing transcription factors and cytokines is necessary
to provide the development of OPC into mature myelinating oligodendrocytes (Liu and
Casaccia-Bonnefil, 2010).
1.2.2 Remyelination in MS
As previously mentioned, the remyelination of demyelinated lesions is a phenomenon
mostly observed in RRMS, which, however, eventually fails in the later, progressive disease
course in many patients for reasons largely unknown (Dendrou et al., 2015; Franklin, 2002).

1. Introduction
~ 12 ~
This is dire, since remyelination seems to provide axonal protection and prevents axonal
atrophy (Irvine and Blakemore, 2008; Kuhlmann et al., 2002). Improving remyelination is
therefore a prime goal in the development of treatment strategies for demyelinating diseases
like MS. A deeper understanding of efficient human remyelination, e.g. in RRMS, is a
prerequisite.
First of all, remyelination in demyelinating diseases is presumably driven by OPC
(Gensert and Goldman, 1997). A study performed by Prayoonwiwat and Rodriguez in 1993
using an animal model of experimental demyelination discovered that the amount of
oligodendrocytes in the white matter was higher after remyelination compared to the
oligodendrocyte number before demyelination (Prayoonwiwat and Rodriguez, 1993),
therefore indicating that migrating OPC and not resident mature oligodendrocytes are crucial
for remyelination. This claim is supported by two further studies: Target et al. demonstrated
that mature myelinating oligodendrocytes were unable to form new myelin sheaths after
being transplanted into areas of demyelination (Targett et al., 1996), while Keirstead and
Blakemore showed in 1997 that post-mitotic oligodendrocytes, which survived in
demyelinated areas despite having lost their myelin sheaths, lack the ability to enwrap
nearby axons in newly formed myelin (Keirstead and Blakemore, 1997).
Two major sources were identified to contribute to the generation of new
oligodendrocytes in response to demyelination: the subventricular zone and slowly
proliferating NG2 glia cells (Dawson et al., 2003; Menn et al., 2006; Nait-Oumesmar et al.,
1999; Young et al., 2013). NG2 glia cells appear to be the first line of defense in case of
demyelination. They can be found throughout the CNS and are able to quickly form
remyelinating oligodendrocytes (Dawson et al., 2003). Additionally, progenitor cells resident
in the SVZ were found to contribute to remyelination by sending migratory precursor cells
into the demyelinated lesion, which ultimately form remyelinating oligodendrocytes (Menn et
al., 2006; Nait-Oumesmar et al., 1999).
The repopulation of demyelinated areas with newly formed, remyelinating
oligodendrocytes is crucial for the regenerative phase in RRMS and other demyelinating
diseases. In the chronic phase of MS, however, remyelination seems to fail. In contrast to
earlier beliefs that this failure is caused by the total absence of OPC, it was discovered that
OPC are present to a certain degree but somehow unable to proliferate and differentiate into
remyelinating oligodendrocytes (Wolswijk, 1998). Stimulating OPC to proliferate and
differentiate could therefore be a promising method to improve remyelination in chronic
demyelinated lesions.

1. Introduction
~ 13 ~
1.3 Electrical stimulation in neurodegenerative diseases
Electrical stimulation as means to study nerve excitation and to treat neurological
conditions is not a recent development but was used already over two centuries ago. As an
example, the Italian physician Luigi Galvani (1737-1798) was among the first who utilized
electrical stimulation to study nerve and muscle responses (Whittaker, 1910). Many scientists
and physicians were following in his steps, and the methods of applying electrical currents in
experimental models and clinical situations became more sophisticated. Since the nervous
system is intrinsically driven by electricity, researchers were able to modulate cognitive
processes like motor cortex excitability (e.g. Nitsche and Paulus, 2000) or working memory
performance (e.g. Alekseichuk et al., 2016). However, also molecular and cellular
mechanisms like cell proliferation and cytokine production were found to be influenced by
electrical fields (Ishibashi et al., 2006; Kirson et al., 2007).
1.3.1 Clinical application
A way to apply electrical currents to deep brain structures is called deep brain
stimulation. It has become a useful method in the treatment of Parkinson’s Disease and
epilepsy and can help patients with intractable variants of these diseases, in which
established treatment methods fail (Morace et al., 2016; Volkmann et al., 2013). Deep brain
stimulation requires, however, an invasive surgical implantation of electrodes into specific
brain areas (e.g. the subthalamic nucleus, globus pallidus or ventral intermediate thalamic
nucleus in case of Parkinson’s Disease) (Muthuraman et al., 2017; Volkmann et al., 2013).
Entirely noninvasive clinical applications of electric currents in the brain, on the other
hand, are the so-called tumor treatment fields (TTFields). TTFields consist of high frequency
(100-200 kHz) alternating currents applied to patients with recurrent glioblastoma, generating
electric fields of 1-2 V/cm (Kirson et al., 2007). Kirson et al. demonstrated that TTFields were
able to reduce tumor cell growth in glioblastoma patients and, if used in combination with
established chemotherapy, also increased the efficiency of the chemotherapy (Kirson et al.,
2007, 2009). In vitro and in vivo experiments revealed that the unidirectional forces of high
frequency alternating electric fields interfere with the spindle tubulin orientation during cell
proliferation, therefore causing an arrest of cell proliferation and the death of dividing cells
(Kirson et al., 2004). Although tumor cells appear to be very susceptible to TTfields due to
their highly proliferative nature, a drawback of this method might be the fact that the
proliferation of cells engaged in regenerative processes like, e.g. neuronal progenitor cells
from the SVZ, would also be affected.
However, electrical stimulation can be applied in various ways, and many of them
showed promising neuroregenerative effects.

1. Introduction
~ 14 ~
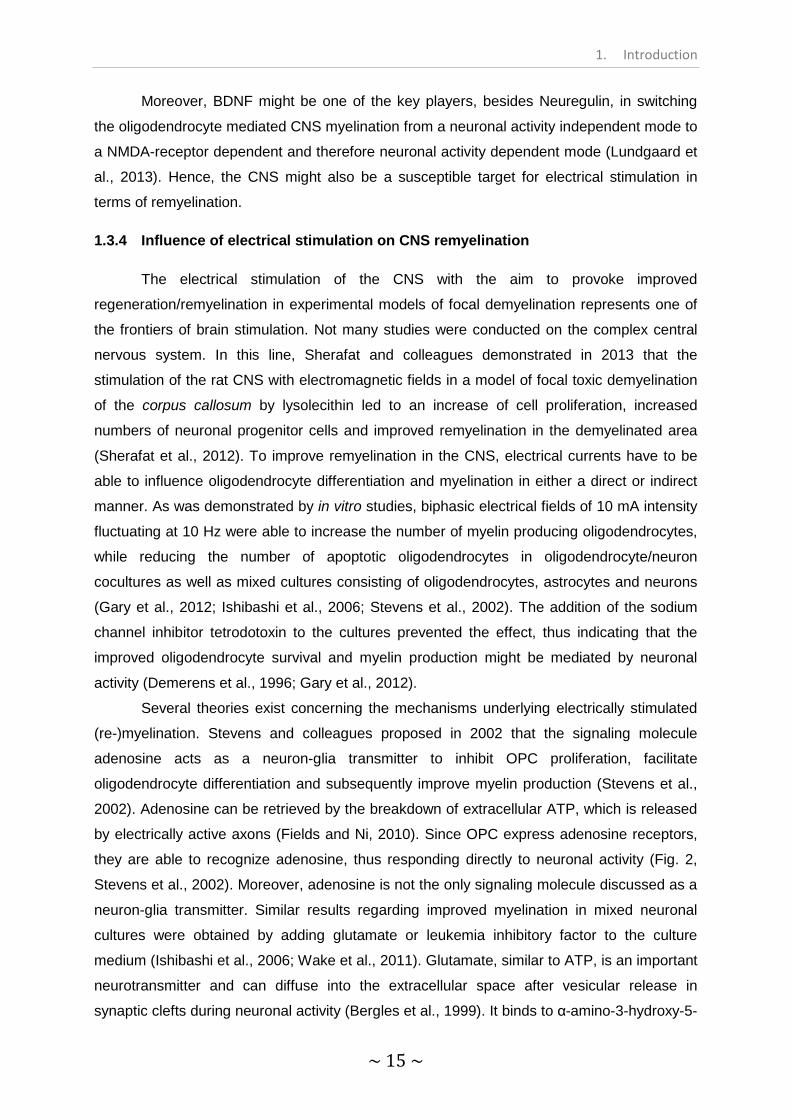
1.3.2 Influence of electrical stimulation on neuronal progenitor cells
Recent studies conducted on animal stroke models discovered beneficial effects of
electrical stimulation on neuroregeneration by recruitment of neuronal progenitor cells (Fig.
2). For instance, striatal stimulation of rats in the chronic phase of a middle cerebral artery
occlusion model with 100 µA at 2 Hz led to an increased migration of proliferating neuronal
progenitor cells from the SVZ towards the area of the ischemic stroke as well as an
increased number of proliferating cells inside the ischemic penumbra (Morimoto et al., 2011).
Similarly, Jahanshahi et al. demonstrated in 2013 that the stimulation of stroke rats with
monopolar biphasic electrical currents of 100 µA at frequencies of 30-330 Hz resulted in
increased cell proliferation in the SVZ as well as enhanced migration of neuronal progenitors
towards the area and an increased neurogenesis inside the area of ischemic stroke
(Jahanshahi et al., 2013). Such findings formed the term “electrotaxis”, which describes the
process of increased migration along an electrical field. Earlier studies also demonstrated
that neuronal progenitor cells migrated in a direct current field toward the cathode in an
intensity dependent manner (Li et al., 2008). Therefore, it seems that electrical currents,
applied in a correct way, are able to influence the recruitment of neuronal progenitor cells,
thus affecting tissue repair and regeneration.
1.3.3 Peripheral nerve regeneration/remyelination by electrical stimulation
Recognizing the potential of electrical stimulation, many studies performed
experiments on rodent models of peripheral nerve injury. In this regard, Huang et al.
demonstrated in 2013 the regenerative effects of short electrical stimulation (20 min of 3 V
biphasic stimulation at 20 Hz) on nerve recovery in a rodent model of sciatic nerve injury
(Huang et al., 2013). After crushing the sciatic nerve, the application of biphasic electrical
stimulation led to an increase of motor- as well as sensory neurons, which regenerated into
the distal nerve stump, accompanied by an increase in nerve conduction velocity and a
decrease of muscle atrophy. It was discussed that the regenerative effects were mediated by
upregulation of regeneration-associated genes like T-α1-tubulin or neurotrophic factors such
as brain derived neurotrophic factor (BDNF) and its receptor tyrosine kinase trkB in neurons
(Al-Majed et al., 2000; Huang et al., 2013). BDNF is secreted by electrically active axons and
plays a central role in the axon-glia interaction in the peripheral nervous system (Chan et al.,
2006; Ng et al., 2007). A study conducted by Wan et al. in 2010 verified the effect of
electrical stimulation on BDNF expression: after stimulating the crush-injured sciatic nerve of
rats with 20 Hz biphasic currents for one hour, Wan and colleagues observed increased
levels of BDNF in stimulated rats for up to eight weeks, accompanied by an increased
number of myelinated axons (Wan et al., 2010).
1. Introduction
~ 15 ~
Moreover, BDNF might be one of the key players, besides Neuregulin, in switching
the oligodendrocyte mediated CNS myelination from a neuronal activity independent mode to
a NMDA-receptor dependent and therefore neuronal activity dependent mode (Lundgaard et
al., 2013). Hence, the CNS might also be a susceptible target for electrical stimulation in
terms of remyelination.
1.3.4 Influence of electrical stimulation on CNS remyelination
The electrical stimulation of the CNS with the aim to provoke improved
regeneration/remyelination in experimental models of focal demyelination represents one of
the frontiers of brain stimulation. Not many studies were conducted on the complex central
nervous system. In this line, Sherafat and colleagues demonstrated in 2013 that the
stimulation of the rat CNS with electromagnetic fields in a model of focal toxic demyelination
of the corpus callosum by lysolecithin led to an increase of cell proliferation, increased
numbers of neuronal progenitor cells and improved remyelination in the demyelinated area
(Sherafat et al., 2012). To improve remyelination in the CNS, electrical currents have to be
able to influence oligodendrocyte differentiation and myelination in either a direct or indirect
manner. As was demonstrated by in vitro studies, biphasic electrical fields of 10 mA intensity
fluctuating at 10 Hz were able to increase the number of myelin producing oligodendrocytes,
while reducing the number of apoptotic oligodendrocytes in oligodendrocyte/neuron
cocultures as well as mixed cultures consisting of oligodendrocytes, astrocytes and neurons
(Gary et al., 2012; Ishibashi et al., 2006; Stevens et al., 2002). The addition of the sodium
channel inhibitor tetrodotoxin to the cultures prevented the effect, thus indicating that the
improved oligodendrocyte survival and myelin production might be mediated by neuronal
activity (Demerens et al., 1996; Gary et al., 2012).
Several theories exist concerning the mechanisms underlying electrically stimulated
(re-)myelination. Stevens and colleagues proposed in 2002 that the signaling molecule
adenosine acts as a neuron-glia transmitter to inhibit OPC proliferation, facilitate
oligodendrocyte differentiation and subsequently improve myelin production (Stevens et al.,
2002). Adenosine can be retrieved by the breakdown of extracellular ATP, which is released
by electrically active axons (Fields and Ni, 2010). Since OPC express adenosine receptors,
they are able to recognize adenosine, thus responding directly to neuronal activity (Fig. 2,
Stevens et al., 2002). Moreover, adenosine is not the only signaling molecule discussed as a
neuron-glia transmitter. Similar results regarding improved myelination in mixed neuronal
cultures were obtained by adding glutamate or leukemia inhibitory factor to the culture
medium (Ishibashi et al., 2006; Wake et al., 2011). Glutamate, similar to ATP, is an important
neurotransmitter and can diffuse into the extracellular space after vesicular release in
synaptic clefts during neuronal activity (Bergles et al., 1999). It binds to α-amino-3-hydroxy-5-

1. Introduction
~ 16 ~
methyl-4-isoxazolepropionic acid (AMPA) receptors on OPC, which are able to depolarize in
response due to Ca2+ influx, therefore demonstrating a rapid and direct signaling pathway
between axons and OPC (Fig. 2, Bergles et al., 2000). Ishibashi and colleagues
demonstrated in 2006 that astrocytes release the signaling molecule leukemia inhibitory
factor (LIF) in response to extracellular ATP, released by electrically active axons (Fig. 2,
Ishibashi et al., 2006). Leukemia inhibitory factor, in turn promotes myelination of mature
oligodendrocytes.
In summary, neuronal activity and thereby electrical currents seem to play important
roles in myelination and the promotion of remyelination, thus representing promising targets
for the treatment of demyelinating conditions, experimentally and clinically.
1. Introduction
~ 17 ~
Figure 2: Electrical currents in the CNS – influence on progenitor cell recruitment, OPC behavior and myelination
Schematic illustration of several electrical cues that could lead to increased (re-)myelination in the
CNS. It was proposed that electrical fields are able to increase the number of migratory, neuronal
progenitor cells from the SVZ, which subsequently can differentiate into OPC (Jahanshahi et al., 2013;
Morimoto et al., 2011). Furthermore, it was demonstrated that glutamate and ATP, released from
electrically active axons, influence OPC behavior and myelination of mature oligodendrocytes. The
binding of glutamate by AMPA receptors on OPC and subsequent depolarization of the cell by Ca2+
influx represents a rapid, direct axon-glia pathway (Bergles et al., 2000). The release of ATP can
either inhibit OPC proliferation via an adenosinergic pathway (Stevens et al., 2002) or promote
astrocytes to release leukemia inhibitory factor, which in turn promotes the myelin production of
mature oligodendrocytes (Ishibashi et al., 2006). Abbreviations: AMPA α-amino-3-hydroxy-5-methyl-4-
isoxazolepropionic, ATP adenosine tri-phosphate, LIF leukemia inhibitory factor, OLG
oligodendrocyte, OPC oligodendrocyte precursor cell, SVZ subventricular zone.

1. Introduction
~ 18 ~
1.4 Transcranial electrical stimulation
A non-invasive way to introduce electrical currents into the brain, as opposed to the
invasive deep brain stimulation, is the transcranial stimulation. Transcranial electrical
stimulation (tES) comes in many different forms and application methods. The most
frequently used methods are transcranial magnetic stimulation (TMS), transcranial direct
current stimulation (tDCS) and transcranial alternating current stimulation (tACS). TMS, tDCS
and tACS as well as many variations of those protocols are widely used in experimental and
clinical studies to investigate structural and functional aspects of the human brain. Some tES
protocols like TMS or tDCS are also applied for diagnostic purposes of neurological diseases
or as means of treatment, e.g. in post-stroke recovery (Boggio et al., 2007; Khedr et al.,
2005; Takeuchi et al., 2005).
1.4.1 Transcranial magnetic stimulation
TMS is a non-invasive brain stimulation technique utilizing a magnetic field of 1-2
Tesla induced by a coil connected to a capacitor to establish an electrical field of up to 150
V/m for about 100 µs (Pascual-Leone et al., 2002). The electric field can be used to
depolarize or hyperpolarize neurons in the underlying tissue in a painless manner. The use
of TMS dates back to 1896, where D’Arsonval induced phosphenes (flashes of light caused
by stimulation of the optic nerve) by stimulating the retina of volunteers (d’Arsonval, 1896).
The first TMS device for clinical experimentation however, was introduced in 1985 by Barker
et al. (Barker et al., 1985). The easy and safe application of TMS offered numerous
opportunities to study structural and functional aspects of the human CNS and PNS.
Depending on the clinical/experimental demands, different coil forms were created like the
round coil for establishing a broad, diffuse electric field or the bent coil for occipital
stimulation. The most frequently used coil shape in experimental studies is the figure-of-eight
coil, due to the high focality of the induced electric field. This combination of two round coils
creates the possibility to stimulate certain areas in the human cortex like the M1 region of the
motor cortex.
With the help of monophasic TMS (one TMS pulse every four seconds), scientists
and physicians can induce action potentials in, e.g. the M1 region of the motor cortex to
provoke involuntary muscle contraction in the responding muscles. The amplitude of the
muscle contraction can be measured by an electromyogram and is called “muscle evoked
potential” (MEP). Measuring MEP represents an easy way to determine the current state of
cortical excitability and can be used as a baseline in experimental setups to test the effects of
tES interventions. Furthermore, MEP can be used in diagnostic situations to evaluate the
nerve conduction in neurological diseases.

1. Introduction
~ 19 ~
A further application form of TMS is repetitive TMS (rTMS), featuring monophasic
TMS pulses in a higher frequency. It is generally believed that high-frequency rTMS (≥ 5 Hz)
results in an increase and low-frequency rTMS (≤ 1 Hz) results in a decrease of cortical
excitability (Rothkegel et al., 2010). In clinically applications, it is used to treat
neuropsychiatric diseases like chronic pain or depression (Lefaucheur et al., 2014;
O’Reardon et al., 2007). The effects induced by rTMS are expected to be mediated by
changes in synaptic plasticity following alterations of cortical excitability (Lenz et al., 2014;
Noh et al., 2015; Trebbastoni et al., 2016; Vlachos et al., 2012). An effective way to modulate
cortical excitability was demonstrated by Huang et al. in 2005 with the use of “theta burst
stimulation” (TBS). TBS consists of 3 pulses repeated at 50 Hz and was applied in three
different protocols: intermittent TBS (iTBS), intermediate TBS (imTBS) and continuous TBS
(cTBS). Intermittent and continuous TBS induced facilitation and inhibition of cortical
excitability, respectively, which outlasted the stimulation by 30-60 minutes (Huang et al.,
2005). Although many studies were able to replicate this data (Gamboa et al., 2010; Huang
et al., 2007; Di Lazzaro et al., 2005), a high intra- and interindividual variability is very
common among the physiological responses of tES protocols (Hamada et al., 2013; Maeda
et al., 2000).
1.4.2 Transcranial alternating current stimulation
tACS consists of oscillating electrical currents. In contrast to TMS, tACS usually does
not directly induce action potentials in neurons but can entrain clusters of neurons,
depending on the frequency used (Chaieb et al., 2011; Terney et al., 2008). Besides the
frequency, the main parameters of tACS are stimulation intensity and waveform shape.
Those can be altered in order to try to achieve different goals like, e.g., modulating ongoing
rhythms in the cortex (80-250 Hz, 1 mA; Moliadze et al., 2010), provoking changes in
corticospinal excitability (2-70 Hz, 1.5 mA; Feurra et al., 2011), modulating voluntary
movements in visuo-motor tasks (20 Hz, up to 0.7 mA; Pogosyan et al., 2009) or even
ameliorate carcinogenesis (100-200 kHz, 1-2 V/cm; Kirson et al., 2007). Furthermore, it was
shown that transcranial alternating currents in the range of 2-5 kHz could be applied safely
with 1-2 mA intensity at the motor cortex and led to an increase in MEP amplitude for up to
one hour (Chaieb et al., 2011), while the application of rTMS at such high frequencies
exhibits a high risk of inducing epileptic seizures (Wassermann, 1998). It is generally
believed that the modulatory effects of tACS below 1 kHz are induced by entrainment of
neuronal oscillations with an impact on cortical excitability as well as on learning
(Alekseichuk et al., 2016), whereas tACS in the kilohertz range preferentially modulates the
excitability of neuronal membranes (Antal and Paulus, 2013). Moreover, Cuellar and
colleagues demonstrated in 2013 that the application of alternating currents with frequencies

1. Introduction
~ 20 ~
of 2-100 kHz on the dorsal root ganglions of the exposed spinal cord inhibits sensory
neurons, thus mediating a pain-relieving effect (Cuellar et al., 2013).
In summary, countless variations of tACS protocols were applied in experimental
studies and many different outcomes were observed. Although many studies lack
reproducibility, the easy non-invasive application and the high variability to which tACS
protocols can be shaped allows for intensive study of cortical excitability and the influence of
electric currents on molecular mechanisms.
1.5 Aim of this thesis
This thesis is divided into three parts. The first two parts address the question of how
to improve remyelination in different rodent models of multiple sclerosis. The third part
represents a clinical study, in which the safe application of high frequency/high intensity
tACS protocols was evaluated in healthy human participants, with further regard to the
modulation of cortical excitability.
Part I. Influence of autoimmune inflammation on remyelination in Cuprizone-induced demyelination
The inflammatory demyelinating disease multiple sclerosis features demyelinated
lesions with substantial axonal damage and mostly, but not exclusively, during the early
disease phase, a strong infiltration of autoreactive adaptive immune cells (Lassmann et al.,
2007). The most commonly used MS animal models, the EAE and Cuprizone model, are only
able to mirror certain aspects of MS. However, by combining these two models into a
Cuprizone-EAE model, we can evaluate the impact of infiltrating, inflammatory cells and
mediators on the remyelination of CNS demyelination. We thus immunized Cuprizone treated
C57Bl/6 mice with MOG35-55 peptide and determined the impact of infiltrating, autoreactive
immune cells on axonal damage, oligodendrocyte populations and remyelination in the
corpus callosum.
Part II. Influence of transcranial alternating current stimulation on spontaneous remyelination in in vitro and in vivo models
The potential of electrical currents to improve oligodendrocyte survival and increase
(re-)myelination was demonstrated in cell culture experiments as well as animals models of
peripheral nerve injury (Gary et al., 2012; Huang et al., 2013; Ishibashi et al., 2006; Wan et
al., 2010). However, only a very limited number of electrical stimulation studies were
conducted on models of CNS demyelination. Since the promotion of oligodendrocyte
differentiation and the improvement of remyelination is a crucial factor in MS, especially

1. Introduction
~ 21 ~
during the progressive disease phase, the feasibility of transcranial electrical stimulation in
this context should be thoroughly tested.
Therefore, in the second part of this thesis, we initially evaluated the impact of 10 Hz,
10 mA alternating current stimulation on myelin production, oligodendrocyte survival and
myelination of axonal fibers in oligodendrocyte as well as mixed cortical cultures.
Subsequently, we applied alternating currents of 100 µA at 10 Hz to different rodent models
of demyelination in a transcranial fashion to determine the effect of electrical stimulation on
lesion formation, degree of remyelination as well as OPC recruitment, proliferation and
differentiation. The parameters of the stimulation protocols were chosen based on promising
results of recent studies.
Part III. Transcranial electrical stimulation in healthy human subjects
The application of electrical currents to the human brain in a transcranial fashion
provides a non-invasive method to modulate cortical plasticity. As demonstrated by Huang et
al. in 2005, TBS protocols are able to either facilitate or inhibit neuronal excitation in the
motor cortex, depending on the stimulation pattern (Huang et al., 2005). To induce high
frequency rTMS pulses in the human brain, however, can be very uncomfortable for the
participant and is connected to a greater risk of epileptic seizures (Wassermann, 1998).
tACS on the other hand, can be safely applied in the low kilohertz range and does not lead to
uncomfortable sensations on the recipients’ skin when used with an intensity of 1-2 mA
(Chaieb et al., 2011). Therefore, we introduced the electrical theta burst protocol (eTBS),
which consists of high frequency, high intensity electric currents, applied in a TBS fashion.
We choose a 5 kHz “carrier frequency” in order to reduce pain perception and stimulation
intensities of up to 10 mA to induce short-term changes in cortical excitability. The
experiments were performed on healthy human volunteers in the setup of a clinical study
published in Frontiers in Human Neuroscience 2017 (Kunz et al., 2017).

2. Methods
~ 22 ~
2. Methods
2.1 Materials
Table 1 Reagents
Reagent Source of supply
4-nitro blue tetrazolium chlorid (NBT) Sigma‐Aldrich GmbH, Steinheim, Germany
5-bromo-4-chloro-3-indolyl phosphate
(BCIP) Sigma‐Aldrich GmbH, Steinheim, Germany
Acetic acid Merck Millipore, Darmstadt, Germany
Acetic anhydride Merck Millipore, Darmstadt, Germany
Amino ethyl carbazol (AEC) Sigma‐Aldrich GmbH, Steinheim, Germany
Ammonia Merck Millipore, Darmstadt, Germany
B27 supplement Gibco, Life Technologies GmbH, Darmstadt,
Germany
BME Medium Gibco, Life Technologies GmbH, Darmstadt,
Germany
Calcium chloride (CaCl2) Merck Millipore, Darmstadt, Germany
Chloral hydrate Merck Millipore, Darmstadt, Germany
Citric acid Merck Millipore, Darmstadt, Germany
Cuprizone Sigma-Aldrich GmbH, Steinheim, Germany
Cytotox-One Homogenous Membrane
Integrity Assay Promega, Madison, USA
DAB (3,3’-Diaminobenzidine) Sigma-Aldrich GmbH, Steinheim, Germany
Dextran Sigma-Aldrich GmbH, Steinheim, Germany
Disodium hydrogen phosphate dihydrate
(Na2HPO42H2O) Merck Millipore, Darmstadt, Germany
DMEM (+4.5 g/l D-glucose, +L-
Glutamine, -Pyruvate)
Gibco, Life Technologies GmbH, Darmstadt,
Germany
Eosin G Merck Millipore, Darmstadt, Germany

2. Methods
~ 23 ~
Reagent Source of supply
Ethanol, 100% Merck Millipore, Darmstadt, Germany
Formaldehyde Sigma-Aldrich GmbH, Steinheim, Germany
FoxP3 fixation concentrate eBioscience Ltd., Altrincham, UK
FoxP3 fixation diluent eBioscience Ltd., Altrincham, UK
FoxP3 permeabilization buffer, 10x eBioscience Ltd., Altrincham, UK
Fluorescence mounting medium Dako Deutschland GmbH, Hamburg,
Germany
Glutamax Sigma-Aldrich GmbH, Steinheim, Germany
Glutaraldehyde Merck Millipore, Darmstadt, Germany
Hank's balanced salt solution (HBSS) Gibco, Life Technologies GmbH, Darmstadt,
Germany
Hydrochloric acid (HCl) Merck Millipore, Darmstadt, Germany
Hydrogen peroxide (H2O2), 30% solution Merck Millipore, Darmstadt, Germany
Isoflurane Sigma-Aldrich GmbH, Steinheim, Germany
Isoxylol Merck Millipore, Darmstadt, Germany
Ketamin, 10% Medistar®, Ascheberg, Germany
Lead citrate Merck Millipore, Darmstadt, Germany
Levamisole Merck Millipore, Darmstadt, Germany
Lithium carbonate Merck Millipore, Darmstadt, Germany
Luxol Fast Blue (LFB) BDH Laboratories Supplies, VWR Int. Ltd.,
Poole, UK
L-thyroxin solution Merck Millipore, Darmstadt, Germany
Mayer’s hemalum Merck Millipore, Darmstadt, Germany
Monastral Blue (Copper (II)
phthalocyaninetetrasulfonic acid
tetrasodium salt)
Sigma‐Aldrich GmbH, Steinheim, Germany

2. Methods
~ 24 ~
Reagent Source of supply
Naphthol As-Bi phosphate Sigma‐Aldrich GmbH, Steinheim, Germany
Neufuchsin Sigma‐Aldrich GmbH, Steinheim, Germany
Nitric acid, 65% Merck Millipore, Darmstadt, Germany
NN-dimethylformamide Sigma‐Aldrich GmbH, Steinheim, Germany
Osmium tetroxide (OSO4) Carl Roth GmbH + Co. KG, Karlsruhe,
Germany
Paraffin (Paraplast Plus®) Tyco Healthcare, Neustadt, Germany
Paraformaldehyde Merck Millipore, Darmstadt, Germany
Penicillin‐streptomycin (10000 U/ml
penicillin; 10 mg/ml streptomycin) Sigma‐Aldrich GmbH, Steinheim, Germany
Percoll™ GE Healthcare, Uppsala, Sweden
Periodic acid Merck Millipore, Darmstadt, Germany
Peroxidase-conjugated streptavidin Sigma‐Aldrich GmbH, Steinheim, Germany
Phosphate buffered saline (PBS), 10x Biochrom AG, Berlin, Germany
Phosphate buffered saline (PBS), sterile Sigma‐Aldrich GmbH, Steinheim, Germany
Poly-L-lysin Sigma‐Aldrich GmbH, Steinheim, Germany
Propylenoxide Merck Millipore, Darmstadt, Germany
Renlam M-1 SERVA Electrophoresis GmbH, Heidelberg,
Germany
Silver nitrate (AgNO3) Carl Roth GmbH + Co. KG, Karlsruhe,
Germany
Sodium chloride (NaCl), solution Braun, Melsungen, Germany
Sodium dihydrogen phosphate
monohydrate (NaH2PO4H2O) Merck Millipore, Darmstadt, Germany
Sodium dodecyl sulfate (SDS) Merck Millipore, Darmstadt, Germany
Sodium hydroxide solution (NaOH) Merck Millipore, Darmstadt, Germany
Sodium nitrate Merck Millipore, Darmstadt, Germany

2. Methods
~ 25 ~
Reagent Source of supply
Sodium pyruvate solution (1.1%) Sigma‐Aldrich GmbH, Steinheim, Germany
Sodium thiosulfate pentahydrate Sigma‐Aldrich GmbH, Steinheim, Germany
Temgesik (Buprenorphinhydrochloride) Reckitt Benckiser, Slough, UK
Toluidine Blue Sigma‐Aldrich GmbH, Steinheim, Germany
Triiodthyronine solution Merck Millipore, Darmstadt, Germany
TritonX100 MP Biomedicals, LLC, Santa Ana, CA, USA
Trypan blue Stemcell Technologies, Vancouver, Canada
Uranylacetate Merck Millipore, Darmstadt, Germany
Xylazine solution, 20 mg/ml Ecuphar, Oostcamp, Belgium
Xylol Merck Millipore, Darmstadt, Germany
Table 2 Primary antibodies for immunohistochemical stainings
Primary antibody
Specificity Species/clone
Pretreatment Working dilution
Source of supply
APP Amyloid precursor protein
Mouse / 22C11 MW / C 1:2000
Merck
Millipore,
Darmstadt,
Germany
BrdU
Bromodeoxyuridin; analog of thymidine, used as a proliferation marker
Mouse MW / C 1:400
Merck Millipore, Darmstadt, Germany
MBP Myelin basic protein Rat - 1:200
Abcam, Cambridge, UK, Germany
NF200 Neurofilament Rabbit MW / C 1:100
Merck Millipore, Darmstadt, Germany

2. Methods
~ 26 ~
Primary antibody
Specificity Species/clone
Pretreatment Working dilution
Source of supply
NG2
membrane chondroitin sulfate proteoglycan; oligodendrocyte precursor cells
Rabbit MW / C 1:200
Merck Millipore, Darmstadt, Germany
NogoA
Myelin-associated neurite growth inhibitor; mature oligodendrocytes
Mouse / 11c7 MW / C 1:15000
Kind gift from M. Schwab, Zürich (Oertle et al., 2003)
O4 Oligodendrocyte lineage marker Mouse - 1:100 R&D Systems,
Abingdon, UK
Olig2
Transcription factor of oligodendrocyte precursor cells and mature oligodendrocytes
Rabbit MW 1:300
IBL International GmbH, Hamburg, Germany
PLP Proteolipid protein Mouse MW / C 1:250
Biozol Diagsnostica GmbH, Eching, Germany
TPPP/p25 Myelin protein; mature oligodendrocytes
Rabbit MW / C 1:500 Abcam, Cambridge, UK
Abbreviations: C citrate; MW micro wave
Table 3 Secondary antibodies for immunohistochemical stainings
Secondary antibody Working dilution Source of supply
Alexa488 (Cy2) anti-mouse 1:200 Thermo Fisher Scientific, Waltham,
MA, USA
Alexa647 (Cy5) anti-rat 1:100 Jackson ImmunoResearch Europe
Ltd., Suffolk, UK
anti-mouse biotinylated 1:200 GE Healthcare Europe GmbH,
Freiburg, Germany
Anti-rabbit biotinylated 1:200 Jackson ImmunoResearch Europe
Ltd., Suffolk, UK
Cy3 anti-rabbit 1:500 Jackson ImmunoResearch Europe
Ltd., Suffolk, UK
2. Methods
~ 27 ~
Table 4 Flow cytometric antibodies
Specificity Fluorochrome Clone Dilution Source of supply
CCR2 APC FAB5538A 1:100 R&D Systems Inc., Minneapolis,
Canada
CD11b PerCP M1/70 1:100 BioLegend, San Diego, CA,
USA
CD19 FITC eBio1D3 1:100 eBioscience Ltd., Altrincham,
UK
CD25 APC PC61.5 1:100 eBioscience Ltd., Altrincham,
UK
CD3 PE Cy7 145-2C11 1:100 eBioscience Ltd., Altrincham,
UK
CD4 PerCP RM4-5 1:100 BD Biosciences, Franklin Lakes,
NJ, USA
CD45 APC Cy7 30-F11 1:100 BioLegend, San Diego, CA,
USA
CD8 FITC 53-6.7 1:100 BD Biosciences, Franklin Lakes,
NJ, USA
FoxP3 PE FJK-16S 1:200 eBioscience Ltd., Altrincham,
UK
NK1.1 APC PK136 1:100 eBioscience Ltd., Altrincham,
UK
NKp46 PE 29A1.4 1:100 BioLegend, San Diego, CA,
USA
Abbreviations: APC allophycocyanine; CD cluster of differentiation; FITC fluorescein
isothiocyanate; PE phycoerythrin; PerCP peridinin chlorophyll protein
Table 5 Proteins and enzymes
Proteins and enzymes Source of supply
alkaline phosphatase – anti alkaline
phosphatase (APAAP) Sigma-Aldrich GmbH, Steinheim, Germany
anti-aquaporin4 antibody (for
stereotactical injection) J. Bennett et al., 2009 (doi:10.1002/ana.21802)
Bovine serum albumin (BSA) SERVA Electrophoresis GmbH, Heidelberg,
Germany

2. Methods
~ 28 ~
Proteins and enzymes Source of supply
Collagenase D Roche Diagnostics Deutschland GmbH,
Mannheim, Germany
complement sera from mouse,
lyophilized powder, 1 U/ml Sigma-Aldrich GmbH, Steinheim, Germany
DNAse I Roche Diagnostics Deutschland GmbH,
Mannheim, Germany
Fc-blocking anti-CD16/CD32 antibody Sigma-Aldrich GmbH, Steinheim, Germany
Fetal calf serum (FCS) Sigma-Aldrich GmbH, Steinheim, Germany
Horse serum Sigma-Aldrich GmbH, Steinheim, Germany
Incomplete Freund's Adjuvant (IFA) Sigma-Aldrich GmbH, Steinheim, Germany
Inactive mycobacteria H37RA BD Biosciences, Franklin Lakes, NJ, USA
MOG35-55 peptide Institute of Medical Immunology, University
Medical Center Charité, Berlin, Germany
Ovalbumin Sigma-Aldrich GmbH, Steinheim, Germany
Pertussis Toxin (PTX) List biological laboratories, Campbell, CA,
USA
Proteinase K Sigma-Aldrich GmbH, Steinheim, Germany
Trypsin-EDTA (0.25%) Gibco, Life Technologies GmbH, Darmstadt,
Germany
Z2 antibody, 4.8 mg/ml mouse IgG2A
(for stereotactical injection)
Hybridoma obtained from C. Linington (C.
Elliot et al., 2012; doi:10.1093/brain/aws105);
purified by S. Nessler

2. Methods
~ 29 ~
Table 6 Solutions, buffer and media
Solution/medium Composition
Anti-MOG antibody solution
3.6 mg/ml Z2 antibody
0.25 U/ml mouse complement
add Monastral Blue (approx. 1% of end
volume)
Bielschowsky development solution
20 ml 37% formaldehyde
100 ml Aqua bidest.
0.5 g citric acid
2 drops 65% nitric acid
Block mix (in situ hybridization)
870 µl BBR
100 µl FCS
30 µl human serum
BME medium
50 ml horse serum
5 ml Penicillin/Streptomycin
5 ml Glutamax
Dilute in BME medium and filtrate sterile
CFA (Complete Freunds’ Adjuvant)
Paraffin oil
15% mannide monooleate
6.7 mg/ml Mycobacterium tuberculosis H37RA
EM fixation solution (400 ml)
0.72 g NaH2PO4H2O
6.2 g Na2HPO42H2O
2 g NaCl
260 ml aqua dest.
40 ml 25% glutaraldehyde
100 ml 16% formaldehyde
Hybridization mix Washing buffer I (in situ hybridization)
10 µl Dextran
5 µl 20x SSC
25 µl deionized Formamid
2 µl Salmon-sp.-DNA
0.5 µl 2% SDS
3 µl PLP probe
5.5 µl DPEC-H2O

2. Methods
~ 30 ~
Solution/medium Composition
Ketamin/Xylacin anesthesia
NaCl, 0.9%, sterile
12% ketamine
10% xylazine
LFB solution
1 g LFB
1 l 96% ethanol
5 ml 10% acetic acid
NBT/BCIP substrate buffer (in situ hybridization)
175 µl NBT
225 µl BCIP
fill up with substrate buffer to 50 ml
Paraformaldehyde (PFA, 4%)
PBS
4% PFA
adjust pH to 7.4
PLP development solution
I. Dilute 10 mg sodium nitrate in 250
µl aqua bidest.
II. Dilute 14 mg Naphthol As-Bi
phosphate in 300 µl NN-
dimethylformamide.
III. Dilute 20 mg Levamisol in 50 ml
TBS, add I. and II. and adjust to pH
8.8
Proteinase K solution
34.2 ml TBS
800 µl CaCl2
375 µl proteinase K
Super SATO medium
2 ml B27-supplement
1 ml Glutamax
1 ml Penicillin/Streptomycin
1 ml horse serum
1 ml sodium pyruvate solution 1.1%
10 µl triiodothyronine solution (0.034 g in 10 ml
96% ethanol)
13 µl L-thyroxin solution (0.062 g in 0.104 g
NaOH, 6 ml H20, 14 ml 70% ethanol)
Fill up with DMEM (+4.5g/l D-glucose, + L-
Glutamine, -Pyruvate) and filtrate sterile

2. Methods
~ 31 ~
Solution/medium Composition
Washing buffer I (in situ hybridization)
7.5 ml 20x SSC
1.5 ml 10% SDS
fill up with DEPC-H2O to 150 ml
Washing buffer II Washing buffer I (in situ hybridization)
1 ml 20x SSC
1 ml 10% SDS
fill up with DEPC-H2O to 100 ml
Table 7 Consumables
Consumable Source of supply
Bottle top filter, 0.2 µm Sarstedt, Nümbrecht, Germany
Blaubrand® intraMARK micropipettes, 5 µl Brand GmbH, Wertheim, Germany
Cell culture flask, 75 cm², Falcon TH Geyer, Hamburg, Germany
Cell culture plate, flat bottom (24 well,
96 well) Greiner bio‐one, Kremsmünster, Austria
Cell strainer (40 µm) BD Biosciences, Franklin Lakes, NJ, USA
FACS tube, 5 ml BD Biosciences, Franklin Lakes, NJ, USA
Nunc™ Microwell™ Plates, 96 well round
bottom
Thermo Fisher Scientific, Waltham, MA,
USA
Petri dishes (3 cm, 7 cm Ø) Greiner bio‐one, Kremsmünster, Austria
Serological pipettes (5 ml, 10 ml, 25 ml) Sarstedt, Nümbrecht, Germany
Signa Gel® electrode conductive gel Parker Laboratories Inc., Fairfield, NJ, USA
Syringes BD Biosciences, Franklin Lakes, NJ, USA
Ten20 Weaver and Company, Aurora, CO, USA
Tubes (50 ml, 15 ml, 10 ml, 2 ml, 1.5 ml,
0.5 ml) Sarstedt, Nümbrecht, Germany

2. Methods
~ 32 ~
Table 8 Technical devices
Technical device Source of supply
5810R centrifuge Eppendorf, Hamburg, Germany
CCD Camera MegaView III, Soft Imaging System®)
C-Dish® IonOptix, Rathmines, Ireland
DS5 Isolated Bipolar Constant Current
Stimulator Digitimer, Welwyn Garden City, UK
EM10B electron microscope Carl Zeiss Microscopy GmbH, Oberkochen,
Germany
FACS Canto™ II BD Bioscience, Franklin Lakes, NJ, USA
Heracell VIOS 160i incubator Thermo Fisher Scientific, Waltham, MA,
USA
Sigma Delta Vaporizer® (Isoflurane pump) Penton Limited, Abingdon, UK
Isolated Pulse Stimulater 2100 A-M Systems, Carlsborg, USA
Leica Ultracut Leica, Wetzlar, German
Magstim 200 magnetic stimulator Magstim, Whiteland, Dyfed, UK
Microtome Leica, Wetzlar, German
Microwave Bosch, Gerling‐Schillerhohe, Germany
Neubauer counting chamber Superior Marienfeld, Lauda-Königshofen,
Germany
Olympus BX51 fluorescence microscope Olympus Corporation, Tokyo, Japan
Olympus VS120 fluorescence slide
scanner Olympus Corporation, Tokyo, Japan
Power 1401 AD converter Cambridge Electronic Design, Cambridge,
UK
Stereotactic device Stoelting Co, Wood Dale, IL, USA
Tecan Safire plate reader Tecan Group Ltd., Männedorf, Switzerland

2. Methods
~ 33 ~
Table 9 Software
Software Application Source of supply
BD FACSDiva Software v6.1.2
Data acquisition flow cytometry BD Biosciences, Franklin
Lakes, NJ, USA
FlowJo v7.6.1 Data analysis flow cytometry FlowJo LLC, Oregon,
U.S.
GraphPad Prism v5.0 Statistical analysis GraphPad software Inc., La
Jolla, CA, USA
ImageJ v1.50b Image processing and analysis ImageJ, National Institute of
Health, USA
Olympus cellsense
dimension v1.7.1 Image acquisition ESTIM in vitro
Olympus Corporation,
Tokyo, Japan
Olympus Olyvia v2.9 Whole slide image evaluation Olympus Corporation,
Tokyo, Japan
Olympus VS-ASW v2.9 Image acquisition ESTIM in vivo Olympus Corporation,
Tokyo, Japan
R v3.1.2 Data analysis The R Foundation for
Statistical Computing
Signal v2.16 Software for eTBS script and
MEP recording
Cambridge Electronic
Design Ltd.

2. Methods
~ 34 ~
Part I – Methods
Influence of autoimmune inflammation on remyelination in Cuprizone-induced demyelination
2. Methods
~ 35 ~
2.2 Cuprizone-EAE
2.2.1 Animals
A total number of 77 adult wildtype C57BL/6J mice (Charles River) aged between six
and eight weeks were held in groups of maximal eight animals per cage with food and water
ad libitum and on a 12:12 h light/dark cycle. The animals were separated into four groups:
cuprizone treated animals (Cup, n=29), cuprizone treated animals immunized with MOG35-55
peptide (Cup-EAE, n=32), cuprizone treated animals which were injected with ovalbumin
instead of MOG35-55 peptide (Cup-Ova, n=12) and untreated control animals (control, n=4).
All animal experiments were carried out in accordance to the Bundesamt für
Verbraucherschutz Oldenburg, Germany.
2.2.2 Cuprizone-induced demyelination
To induce demyelination (DM) of the corpus callosum (CC) mice were fed with a
0.25% Cuprizone diet the first two weeks. Afterwards, the dose was decreased to 0.15%
Cuprizone for the remaining three weeks. Cuprizone is a copper chelator which leads to a
toxic demyelination, most prominent in the corpus callosum, and was administered by mixing
cuprizone powder with normal mill chow. Non-treated control animals were fed with normal
chow for the same time period. A detailed overview of the experimental time schedule is
shown in Figure 3.
2.2.3 Induction of brain inflammation
To induce an infiltration of immune competent cells into the CNS, animals in the Cup-
EAE group received a 200 µl emulsion, separated into four 50 µl reservoirs and injected peri-
axillary and peri-inguinally. The emulsion consisted of 1 ml complete Freund’s adjuvants
(CFA; incomplete Freund’s adjuvants with inactive mycobacteria H37RA) mixed evenly with
1 mg/ml MOG35-55 peptide. The emulsion used for the ovalbumin control group was prepared
by the same protocol, however MOG35-55 peptide was replaced by the CNS-unspecific
antigen ovalbumin. The mice were immunized at day 17 and once again at day 24 after
starting cuprizone treatment (Fig. 3). To enhance the reaction of the immune system, 300 ng
Pertussis Toxin (PTX) was injected into Cup-EAE and Cup-Ova animals at the day of the first
immunization, as well as 2 and 8 days later. Neurological signs were assessed as described
in table 10. If animals reached a score of 3.5 or lost more than 25% of their weight, they were
sacrificed prematurely to prevent unnecessary animal suffering.

2. Methods
~ 36 ~
Figure 3: Time scale of cuprizone treatment and EAE induction
Mice were fed cuprizone for 35 days. The initial dose of 0.25% cuprizone was reduced to 0.15% after
14 days, to allow T cells to infiltrate the CNS without severe impairment. MOG35-55 peptide was
injected twice in mice from the Cup-EAE group, first after 17 days and the second time after 24 days.
Subsequently, PTX was injected in the same mice, to amplify the immune reaction. In Cup-Ova
animals, ovalbumin was injected instead of MOG35-55 peptide. All mice from the Cup-Ova group as
well as half of the mice from the Cup and Cup-EAE groups were sacrificed after 35 days to establish
the maximal extent of DM, while the remaining animals were sacrificed after five additional days on a
cuprizone-free diet to investigate the extent of RM. The time points of immunization with MOG35-55
peptide were adopted from the doctoral thesis of Angelika Escher, 2008.
Table 10: EAE score assessment
score clinical symptoms 0 no symptoms
0.5 partially limb tail 1 limb tail
1.5 limb tail + slight paresis of hind legs
2 limb tail + severe paresis of hind legs
2.5 severe paresis of hind legs + one leg
dragged behind 3 paralyzed hind legs
3.5 paralyzed hind legs + slight paresis of
forelegs
2.2.4 Electron microscopy
To examine the density of myelinated axons in the corpus callosum (CC), electron
microscopic pictures were taken using an EM 10 from ZEISS and analyzed. For this purpose,
the animals were anaesthetized by injecting an overdose of 14% chloral hydrate and
perfused transcardially with an EM fixation solution. In contrast to (immuno-) histochemical
stainings, sagittal sections of the brains were prepared. After dissection of the brains, pieces
of the CC were washed with 0.1 M phosphate buffered saline (PBS), fixed with 3%
glutaraldehyde, post fixed and contrasted with 1% osmium tetroxide followed by dehydration
through an ascending ethanol series (50% ethanol for 10 min, 0.5% uranyl acetate in 70%

2. Methods
~ 37 ~
ethanol for 1 h at 4°C, 80% ethanol for 10 min, 96% ethanol for 10 min, 100% ethanol twice
for 15 min, propylene oxide twice for 20 min). Subsequently, the samples were embedded in
Renlam M1 by incubation in a 1:1 mixture of Renlam M1 and propylene oxide for 35 min
followed by a 2:1 mixture of Renlam M1 and propylene oxide for 35 min and pure Renlam M1
for 40 min. Semi-thin sections (360 nm) were cut and stained with toluidine blue to define the
region of interest in the CC. Accordingly, ultra-thin sections (72 nm) of the region of interest
were cut and contrasted with lead citrate for 10 min. For analysis of axonal diameter and
myelin thickness, a magnification of x12000 was used. Quantitative analysis of myelinated
axons was carried out using ImageJ and R.
2.2.5 Histopathology
2.2.5.1 Histochemical stainings
Animals were anaesthetized by injecting an overdose of 14% chloral hydrate and
transcardially perfused with 0.1 M PBS followed by 4% paraformaldehyde. Brains were
removed and post fixed in 4% paraformaldehyde for two days at 4 °C. Afterwards, brains
were dissected and cut into 3-5 mm thick coronal slices, which were dehydrated in an
ascending ethanol series before being embedded in paraffin. Brain slices were cut with 2-4
µm width and stained with Luxol fast blue / periodic acid Schiff (LFB/PAS) for detection of
myelin, as described in the following section.
Luxol fast blue / periodic acid Schiff (LFB/PAS) staining
If not indicated otherwise, the following steps were performed at room temperature. In
preparation for the LFB/PAS staining, the brain slices were placed on microscope slides,
deparaffinized (three times 3 min in xylol and 3 min in isoxylol) and rehydrated (3 min in
ethanol 100%, followed by ethanol 90%). Afterwards, the slides were placed in a LFB
solution overnight at 60 °C.
On the next day, the slides were put in 90% ethanol for 5 min, followed by
differentiation steps in 0.05% lithium carbonate and 70% ethanol and washed with aqua dest.
For the second part of the LFB/PAS staining, the periodic acid Schiff, the brain slices were
placed in 1% periodic acid, washed thoroughly in tap water and processed in Schiff’s solution
for 20 min, followed by another washing step in tap water to stain the parenchyma. To stain
the cell nuclei, the slides were placed for 2 min in Mayer’s hemalum solution and, after
another washing step, differentiated in 1% HCl, followed by treatment with tap water and an
ascending ethanol series which finished xylol. The determination of the demyelinated area
was done using the semi-quantitative score shown in table 11 (DM score originally
established by Hiremath et al., 1998).

2. Methods
~ 38 ~
Table 11: Demyelination score assessment
score Degree of demyelination in the corpus callosum
0 no loss of myelin 1 less than 1/3 demyelinated 2 1/3 – 2/3 demyelinated 3 more than 2/3 demyelinated
2.2.5.2 Immunohistochemical stainings
All steps were conducted in a dark and moist chamber to prevent bleaching and
dehydration of the brain slices. By tissue fixation and embedding in paraffin, a masking of the
antigens can occur. Since an efficient binding of the primary antibody and the target antigen
is required for a successful immunostaining, a pretreatment might be necessary to unmask
the antigens, before conducting any further steps. A complete list of all primary antibodies as
well as the necessary pretreatments and the respective secondary antibodies can be found
in table 2 and table 3. If not indicated otherwise 50 µl of the respective solution was used on
each object slide, and all incubations were performed at room temperature, except if
incubated overnight, which were performed at 4 °C.
Olig2 and NogoA
Immunohistochemical stainings with primary antibodies against the transcription
factor Olig2 and the neurite growth inhibitor NogoA were used for detection of
oligodendrocyte lineage cells and mature oligodendrocytes, respectively. Both antibodies
required a pretreatment with citrate buffer, pH 6.0, 10 mM, to unmask the antigens. For this
purpose, the brain slices were placed in citrate buffer in a microwave oven and heated for 3
min. Afterwards, the citrate buffer was exchanged by PBS and the slices were placed in the
microwave oven for another 3 min. This process was repeated two more times and the slices
were then washed thoroughly with PBS. To block the endogenous peroxidase of the tissue
and the unspecific binding sites, all slides were processed in 50 ml 3.33% H2O2 in PBS,
followed by a PBS solution with 10% fetal calf serum (FCS; 10 min at 4°C). Each primary
antibody was diluted in a 10% FCS/PBS solution (Olig2: 1:300; NogoA: 1:15000), 100 µl of
which were equally applied onto each slide (for a complete list of primary antibodies see
table 2). The incubation was carried out at 4 C° overnight. On the next day, all slides were
washed with PBS and incubated with the secondary antibody (biotinylated anti-rabbit 1:200,
in 10% FCS/PBS; table 3) for 1 hour. Finally, all brain slices were incubated with peroxidase-
conjugated streptavidin (1:1000 in PBS), processed with the chromogen amino ethyl
carbazol (AEC) to visualize the antibodies and embedded with Immu-Mount mounting
medium.
2. Methods
~ 39 ~
Amyloid precursor protein (APP)
To identify axonal damage, an APP primary antibody was used. The slides received
the same treatment as described for the Olig2 and NogoA stainings as well as the same pre-
treatment with citrate buffer. To visualize the antibody, the chromogen 3,3’-Diaminobenzidine
(DAB) was used instead of AEC. To mark the cell nuclei, the slides were incubated for 10
sec in Mayer’s hemalum solution, differentiated in 1% HCl solution and treated with tap
water, followed by an ascending ethanol series.
Proteolipid protein (PLP)
A PLP immunohistochemical staining combined with an in situ hybridization was
performed to label the PLP protein (table 2) and the PLP mRNA, respectively. The in situ
hybridization was performed as described by Breitschopf et al. in 1992. Therefore, all slides
were treated twice with xylol for 20 min each to remove the paraffin. A descending ethanol
series (96%, 96%, 75%, 50%, 30%, DEPC-H2O, 3 min each) was performed to rehydrate the
tissue, followed by a post-fixation with 4% PFA for 20 min at 4 °C. After a washing step with
TBS (tris-buffered saline) the slides were treated with 0.2 M HCl for 10 min to denature the
proteins of the tissue, followed by another washing step with TBS. To expose the mRNA the
proteins had to be digested. This was done by processing the slides with 50 µg/ml proteinase
K (34.2 ml TBS + 800 µl CaCl2 + 375 µl proteinase K) for 20 min at 37 °C. Afterwards, the
slices were treated with cold TBS (-20 °C) for 5 min to stop the digestion. To inactivate the
endogenous alkaline phosphatase, all brain slices were treated with 0.5% acetic anhydride
(45 ml 0.1 M TBS + 225 µl acetic anhydride) for 10 min. After another washing step and an
ascending ethanol series (30%, 50%, 75%, 96%, 96%, chloroform, 3 min each) for
dehydration, the slides had to dry at room temperature. For the hybridization with the PLP
probe 50 µl of the hybridization mix was administered to each slice which were then covered
with a cover slip and incubated for 4 min at 95 °C to disintegrate the secondary structure of
the RNA, thus allowing an easier binding of the probe. Afterwards, the samples were placed
overnight in a moist chamber at 62 °C. The next day, all slides were treated with washing
buffer I two times for 10 min each, followed by two times 10 min with washing buffer II at 62
°C and two times 10 min with TBS at room temperature. In preparation for the antibody
incubation with anti-DigoxigeninAP, the slides were incubated with 100 µl of block solution for
15 min in a moist chamber. The anti-DigoxigeninAP antibody was diluted 1:250 in block
solution and incubated on the slices for 2 hours in a moist chamber. Afterwards, the slides
were washed three times with TBS and once with 4-nitro blue tetrazolium chloride / 5-bromo-
4-chloro-3-indolyl phosphate (NBT/BCIP) substrate buffer, followed by a final incubation
period overnight at 4 °C in NBT/BCIP substrate buffer.

2. Methods
~ 40 ~
In preparation for the immunohistochemical staining, all slices were incubated in 10%
FCS/TBS for 10 min to block unspecific binding sites. Subsequently, the primary antibody
(PLP, mouse, 1:500) was incubated for one hour, followed by a washing step with TBS and
the secondary antibody (rabbit anti-mouse, 1:50, incubation time one hour). The secondary
antibody connects the primary antibody with the alkaline phosphatase – anti alkaline
phosphatase (APAAP) complex (1:50, incubation time one hour), which can be visualized by
a specific development solution, followed by treatment in Mayer’s hemalum solution for 30
seconds.
2.2.6 Flow cytometric analysis
Animals used for flow cytometric (FACS) analysis were anaesthetized by injecting an
overdose of 14% chloral hydrate and transcardially perfused with 0.1 M PBS. Brains were
dissected, disintegrated, centrifuged for 12 min at 1200 rpm, resuspended in 800 µl DMEM
(without FCS) and digested with 1 mg/ml DNAse and 2.5 mg/ml collagenase for 45 min. The
digestion was stopped with DMEM (+2% FCS), the samples were centrifuged for 7 min at
1200 rpm and the pellets were resuspended in 5 ml DMEM+FCS. Subsequently, the cells
were separated from myelin by a Percoll gradient. For this purpose, a 37% and a 70%
Percoll phase was created and the cell solution was added carefully. The cells were
separated from myelin by centrifugation at 1600 rpm for 25 min after which they were
extracted and transferred to PBS (+2% FCS). In order to label the cells with FACS
antibodies, they were transferred to round bottom 96 well plates, which were centrifuged for
2 min at 1200 rpm, followed by a treatment with Fc-blocking anti-CD16/CD32 antibody
(1:100) for 10 min at 4°C. Subsequently, a mixture of FACS antibodies (table 4, table 11)
was added for 10 min at 4°C. For intracellular stainings like FoxP3, cells were fixed and
permeabilized before the antibody incubation to ensure an optimal labeling. Therefore, the
cells were washed twice in PBS + 2% FCS before they were fixed for 45 min in FoxP3
fixation concentrate (1:4 in FoxP3 fixation diluent). Afterwards, the cells were washed twice
in FoxP3 permeabilization buffer and labeled with FoxP3 (1:200 in permeabilization buffer)
for 30 min. All labeled cells were washed twice in PBS+ 2% FCS before being measured
using a BD FACSCanto II flow cytometer. Quantitative analysis was performed using FlowJo
version 7.6.1.

2. Methods
~ 41 ~
Table 12: Classification of leukocyte subpopulations
Leukocyte Specific surface and intracellular marker
T cells CD45+ CD3+ CD19-
NK cells CD45+ CD3- CD19- NK1.1+ NKp46+
B cells CD45+ CD3- CD19+
Granulocytes CD45+ CD11b+ Ly6G+
Inflammatory monocytes CD45+ CD11b+ Ly6C+ Ly6G- CCR2+
Microglia CD45int CD11bint Ly6C- Ly6C-
2.2.7 Statistical analysis
The statistical analysis was performed using GraphPad Prism for Windows version
5.0.0. t-Tests were used to compare two experimental groups with each other. In case of
non-Gaussian distribution, a Mann-Whitney test was performed. For the analysis of flow
cytometric data, one-way ANOVA followed by Bonferroni’s Multiple Comparison Test was
performed. If the data did not follow Gaussian distribution, a Kruskal-Wallis test was
performed, followed by Dunn’s Multiple Comparison Test. To compare more than two
groups, Two-way ANOVA followed by Sidak’s multiple comparisons test was performed.
Repeated measures Two-Way ANOVA followed by Bonferroni’s Multiple Comparison Test
was performed to compare the density of myelinated axons with the parameters COND
(condition) for Cup, Cup-EAE and naïve animals and TIME for the DM and RM time points. A
p value of ≤ 0.05 was considered significant and a p value between 0.1 – 0.051 was
considered a trend. Data are presented as mean ± SEM.

2. Methods
~ 42 ~
Part II – Methods
Influence of transcranial alternating current stimulation on spontaneous remyelination in in vitro and in vivo models

2. Methods
~ 43 ~
2.3 Electrical stimulation in mixed cortical cultures
To evaluate the effect of electrical stimulation on the viability and myelin expression of
oligodendrocytes, primary cell cultures of rat oligodendrocytes with and without cortical
neurons were established.
2.3.1 Primary cultures – oligodendrocytes
Two days prior to the isolation of oligodendrocytes, five cell culture flasks (75 cm²)
were coated with 0.01% poly-L-lysin (PLL) overnight at 37°C to enhance adherence of
oligodendrocytes. On the next day, the cell culture flasks were washed twice with PBS,
equipped with BME medium and placed in an incubator at 37°C and 5% CO2 overnight.
6 newborn Wistar rats from the in-house breeding facility were used on postnatal day
0 (P0) for each experiment (a total of 60 Wistar rats was used) to create primary
oligodendrocyte cultures. The following steps were performed using sterile scissors and
forceps which were frequently cleaned in aqua dest. and sterilized in 70% ethanol. The
animals were decapitated and the head was placed in a petri dish filled with Hank’s balanced
salt solution (HBSS) at 37°C. A cut was made along the medial line of the skull and two more
under each ear to provide access to the brain which was removed by using a blunt spatula.
After separating the hemispheres and removing the cerebellum, the meninges and the
choroid plexus, the brains were digested with 5 ml of 0.25% Trypsin-EDTA at 37°C for 20
min in a 50 ml Falcon tube. Afterwards, the brains were washed once with HBSS and 10 ml
BME medium (37°C) was added. To homogenize the brains, they were pipetted up and down
20 times and centrifuged for 8 min at 800 rpm. The pellet was resuspended in 10 ml BME
medium and the cell suspension was equally distributed between the five cell culture flasks,
coated with PLL. The cells were allowed to grow until confluent (approx. 10 days) with
medium changes every 3 days.
Once the cells were grown fully confluent, the oligodendrocytes were transferred onto
1 cm² coverslips placed in 3 cm petri dishes (each petri dish holds two coverslips). The
coverslips were previously coated with PLL (overnight at 37°C) and incubated with Super-
SATO medium (overnight at 37°C). To prevent the coverslips from slipping out of place
inside the petri dishes, a “frame” was carved around each coverslip using a scalpel.
In order to isolate oligodendrocytes from the mixed cultures containing astrocytes,
oligodendrocytes and microglia, first the microglia were shaken off by knocking the cell
culture flasks firmly. Afterwards, the flasks were washed once with BME medium, supplied
with new BME medium and vigorously shaken 20 times in a horizontal fashion to shake off
the oligodendrocytes from the astrocyte layer. The cell suspension was transferred through a
40 µm mesh into a 50 ml tube. After 10 min of centrifugation at 800 rpm, the pellet was
resuspended in 2 ml Super-SATO medium and transferred in a 3.5 cm petri dish (uncoated).

2. Methods
~ 44 ~
Since microglia tend to attach to the plastic surface of the petri dish, this method was used to
further separate the oligodendrocytes from microglia. After 30 seconds, the cell suspension
was transferred to a 5 ml tube and the amount of cells in the suspension was determined
using a Neubauer counting chamber. For this purpose, 1 µl of the cell suspension was mixed
with 9 µl of tryptophan blue (1:10) to mark apoptotic cells. Cells were transferred into petri
dishes equipped with coverslips at a density of 250000 cells per petri dish and separated into
an electrical stimulation group (ESTIM) and a non-stimulated control group (no ESTIM). The
electrical stimulation was performed one day after the transfer (Fig. 4 A). Half the medium of
each petri dish was exchanged by fresh Super-SATO medium each day.
2.3.2 Primary cultures – oligodendrocytes and neurons
To create oligodendrocyte/neuron cocultures, initially neurons were grown separately
on 1 cm coverslips, previously coated with PLL and placed in 3 cm petri dishes, for two
weeks. For this purpose, prenatal rats with an embryonic age of day 18 (E18) were obtained
from a pregnant Wistar rat from the in-house breeding facility (a total of 6 pregnant Wistar
rats were used). The following steps were performed using sterile scissors and forceps which
were frequently cleaned in aqua dest. and sterilized in 70% ethanol.
The rat was killed with CO2 and the amniotic sacs were removed. After detaching the
amniotic sac, the E18 rats were decapitated and the brains were removed and freed of
meninges using forceps only. The brains were digested with 0.25% Trypsin-EDTA and
washed once with BME medium. The brains were homogenized by pipetting them up and
down 20 times and subsequently centrifuged for 8 min at 800 rpm. The pellet was
resuspended in 10 ml BME medium and the cell count was determined by a Neubauer
counting chamber. Each previously prepared 3 cm petri dish received 500000 cells. The cells
were placed in an incubator at 37°C and 5% CO2 for two weeks. The Super-SATO medium
was changed every 2-3 days.
In parallel, oligodendrocyte cultures were created as described in 2.3.1 and cultured
for six days, before transferred into the petri dishes with the neuronal cultures at day 14,
respectively (a schematic display of the timeline can be found at Fig. 4 B). The
oligodendrocyte/neuron cocultures were separated into two experimental groups: an
electrical stimulation group (ESTIM) and a non-stimulated control group (no ESTIM). Both
groups were cultivated for another day, before the start of the electrical stimulation. Half the
medium of each petri dish was exchanged by fresh Super-SATO medium each day.

2. Methods
~ 45 ~
Figure 4: Time line of electrical stimulation in oligodendrocyte cultures and mixed cortical
cultures A Oligodendrocyte cultures were cultivated in culture flasks for ten days and subsequently transferred
onto coverslips coated with PLL. After an additional day of growth, the cells were either treated with
electrical stimulation (ESTIM) or not treated (NOSTIM) for four consecutive days. B Neuronal cultures
were cultivated for 14 days on PLL coated coverslips. In parallel, oligodendrocytes were cultivated for
six days in culture flasks, before being transferred onto the coverslips containing neurons. After one
day of acclimatization, the mixed cortical cultures were either stimulated (ESTIM) or not stimulated
(NOSTIM) for four consecutive days.
2.3.3 Electrical stimulation in vitro
The electrical stimulation was performed using a specialized 6-well lid (C-Dish©) from
IonOptix™, which provided two graphite electrodes reaching into each well to establish an
electric field within the medium. The 6-well lid was connected to an Isolated Pulse Stimulator
2100© from A-M Systems™ placed on top of the 3 cm petri dishes containing the cells. Both,
the oligodendrocyte cultures and the oligodendrocyte/neuron cocultures were stimulated in
the same way with the same protocol: 10 mA, 10 Hz alternating current for one hour per day
for four consecutive days at 37°C and 5% CO2 (Fig. 4). After each stimulation, one petri dish
of each experimental group was removed to perform LDH cytotoxicity tests and
immunocytochemical stainings.
2.3.4 LDH cytotoxicity test
The CytoTox-One™ Homogenous Membrane Integrity Assay from Promega™ was
used to evaluate the cell viability of the oligodendrocyte/neuron cocultures. The degree of
cytotoxicity in each well could be determined by measuring the amount of lactate
dehydrogenase (LDH) released into the medium by cells with damaged membranes.
In preparation for the cytotoxicity assay, the medium of each coculture petri dish was
removed completely and, together with all CytotoxOne™ reagents, was brought to room
temperature. As positive control (maximum LDH release) served a sample in which all cells
were killed by adding a lysis buffer (2 µl per 100 µl medium) for 1 hour. To start the assay,
100 µl from each sample were mixed with 100 µl CytoTox-One™ substrate mix in a 96-well

2. Methods
~ 46 ~
plate (flat bottom) and incubated for 10 min at room temperature. The supernatant of each
sample was vortexed before extracting 100 µl to ensure an equal distribution of the LDH. The
reaction was stopped by adding 50 µl CytoTox-One™ stop solution to each well and the
fluorescence was measured using the Safire™ plate reader from Tecan™ at 560 nm
excitation and 590 nm emission. The cytotoxicity was calculated using the following formula:
% cytotoxicity = (experimental−culture medium background)(maximum LDH release−culture medium background)
2.3.5 Immunocytochemical stainings
To prepare the cells for the immunocytochemical stainings, a fixation with 4%
paraformaldehyde had to be performed. For this purpose, the cells were washed two times
with PBS, fixed for 20 min in 4% PFA and washed again two times with PBS.
Fixed cells were treated with TritonX100 (0.5% in PBS) for 10 min to disintegrate the
cell membrane and ease the access for the antibodies. After washing three times with PBS,
unspecific binding sites were blocked with blocking buffer. In oligodendrocyte cultures,
primary antibodies against O4 and MBP were used, which label oligodendrocyte lineage cells
and myelin, respectively. For oligodendrocyte/neuron mixed cultures, NF200 was used in
addition to O4 and MBP to label axonal fibers. The primary antibodies were diluted in
blocking buffer and each incubated overnight at 4°C (table 2).
After washing three times with PBS, the fluorescence labeled secondary antibodies
(table 3) were prepared in blocking solution and incubated 1 hour each. The cells were
washed five times and subsequently incubated with DAPI (1:10000 in PBS) for 15 min at
room temperature to stain the cell nuclei. Finally, the cells were washed three times with PBS
and four times with aqua bidest before mounted on glass slides using fluorescent mounting
medium.
2.3.6 Quantification of myelin protein expression in oligodendrocyte cultures
To quantify the number of oligodendrocytes as well as the amount of myelin
expressing oligodendrocytes, the O4 positive and O4/MBP double positive cells were
counted using ImageJ (version 1.50b, National Institute of Health, USA). The cell counts are
depicted as the percentage of the total amount of DAPI positive cells.
2.3.7 Quantification of myelinated fibers in oligodendrocyte/neuron mixed cultures
The quantification of MBP/NF200 double positive fibers was performed using a
counting grid (Fig. 5) and ImageJ (version 1.50b, National Institute of Health, USA). Only
fibers crossing the counting grid were included. The amount of MBP/NF200 double positive
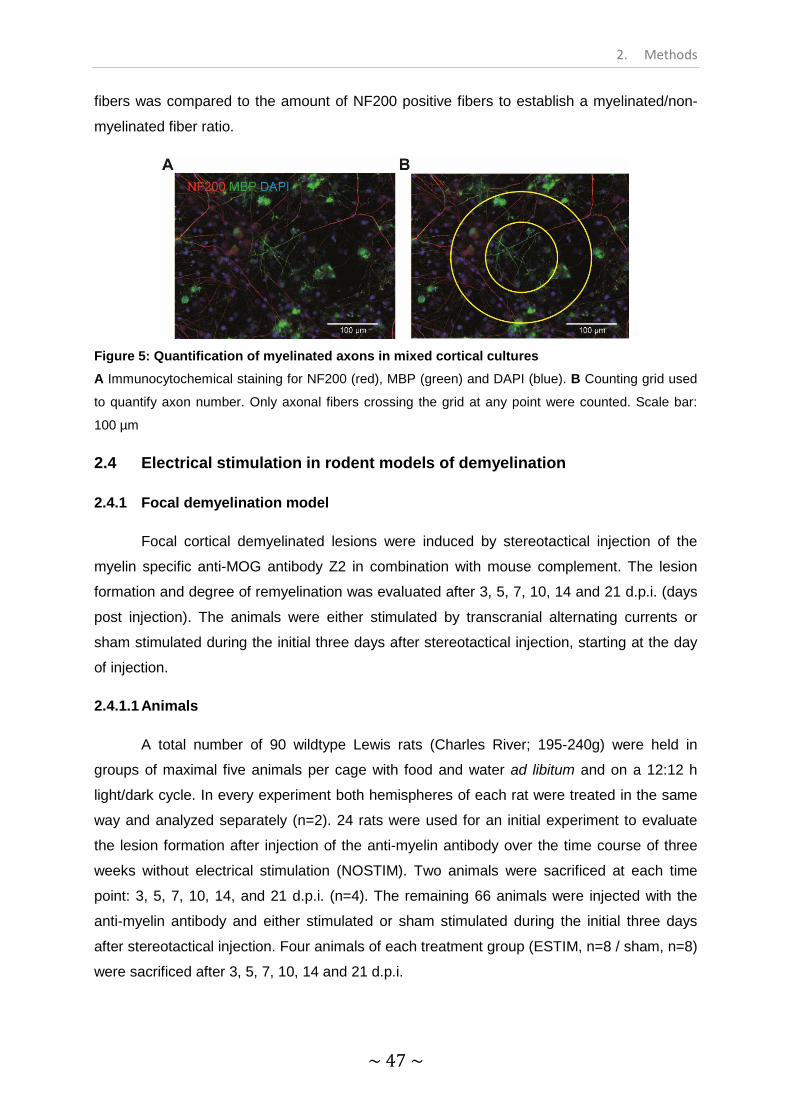
2. Methods
~ 47 ~
fibers was compared to the amount of NF200 positive fibers to establish a myelinated/non-
myelinated fiber ratio.
Figure 5: Quantification of myelinated axons in mixed cortical cultures A Immunocytochemical staining for NF200 (red), MBP (green) and DAPI (blue). B Counting grid used
to quantify axon number. Only axonal fibers crossing the grid at any point were counted. Scale bar:
100 µm
2.4 Electrical stimulation in rodent models of demyelination
2.4.1 Focal demyelination model
Focal cortical demyelinated lesions were induced by stereotactical injection of the
myelin specific anti-MOG antibody Z2 in combination with mouse complement. The lesion
formation and degree of remyelination was evaluated after 3, 5, 7, 10, 14 and 21 d.p.i. (days
post injection). The animals were either stimulated by transcranial alternating currents or
sham stimulated during the initial three days after stereotactical injection, starting at the day
of injection.
2.4.1.1 Animals
A total number of 90 wildtype Lewis rats (Charles River; 195-240g) were held in
groups of maximal five animals per cage with food and water ad libitum and on a 12:12 h
light/dark cycle. In every experiment both hemispheres of each rat were treated in the same
way and analyzed separately (n=2). 24 rats were used for an initial experiment to evaluate
the lesion formation after injection of the anti-myelin antibody over the time course of three
weeks without electrical stimulation (NOSTIM). Two animals were sacrificed at each time
point: 3, 5, 7, 10, 14, and 21 d.p.i. (n=4). The remaining 66 animals were injected with the
anti-myelin antibody and either stimulated or sham stimulated during the initial three days
after stereotactical injection. Four animals of each treatment group (ESTIM, n=8 / sham, n=8)
were sacrificed after 3, 5, 7, 10, 14 and 21 d.p.i.

2. Methods
~ 48 ~
2.4.1.2 Stereotactical injection
Animals were anesthetized i.p. by injecting a ketamine /xylazine solution (ketamine:
60 mg/kg body weight; xylazine: 8 mg/kg body weight) and mounted in a stereotactical
frame. The shaved head was firmly fixed and the skin above the skull was cut open with a
scalpel. The skin was held in place by clamps and a small hole for the injection was drilled
into the skull 1 mm caudal and 2 mm lateral of the bregma on each side of the head. After
exposing the brain, a glass capillary with a diameter of 0.05 - 0.1 mm was introduced 1.5 mm
deep into the brain, filled with 1 µl of the anti-MOG antibody solution. The solution was
injected very slowly and carefully at a steady pace. The glass capillary was left in the brain
for one minute before withdrawing to prevent any backflow of the liquid. Monastral Blue was
used to mark the injection site. Afterwards, the skin was sutured and the rat was placed in a
cage and injected with an analgetic (Temgesic©, 1 µl per 1 g body weight).
2.4.1.3 Electrical Stimulation
The rats were stimulated for 10 min each day with 100 µA and 10 Hz alternating
current in a transcranial fashion for three consecutive days, starting with the day of the
stereotactical injection. 30 min prior to the stimulation the rats were injected with an analgetic
(Temgesik). In preparation to the stimulation the rat was placed on the stomach on a heating
plate to prevent hypothermia and was anesthetized with Isoflurane by using an Isoflurane-
pump (Sigma Delta Vaporizer®). To reduce the impedance for the stimulation, the fissure of
the previous stereotactical injection was reopened and the stimulating electrode (1 cm²), to
which electrode conducting gel was added, was placed on top of the intact skull. The
reference electrode (35 cm²) was placed under the thorax. After the stimulation, the
electrodes were removed, the wound cleaned of any remaining electrode gel and sutured.
This procedure was repeated on the next two days to achieve a total of three days of
stimulation. The procedure of the sham stimulation is identical, with the exception that the
stimulator was not turned on during the stimulation.
2.4.2 Chronic cuprizone model
A chronic cuprizone model was used to evaluate the effect of electrical stimulation on
delayed remyelination. The animals were fed with cuprizone for an extended period of 13
weeks to ensure a delayed remyelination. Subsequently, they were put on normal chow to
induce remyelination and either stimulated or sham stimulated for five days or ten days (Fig.
6).
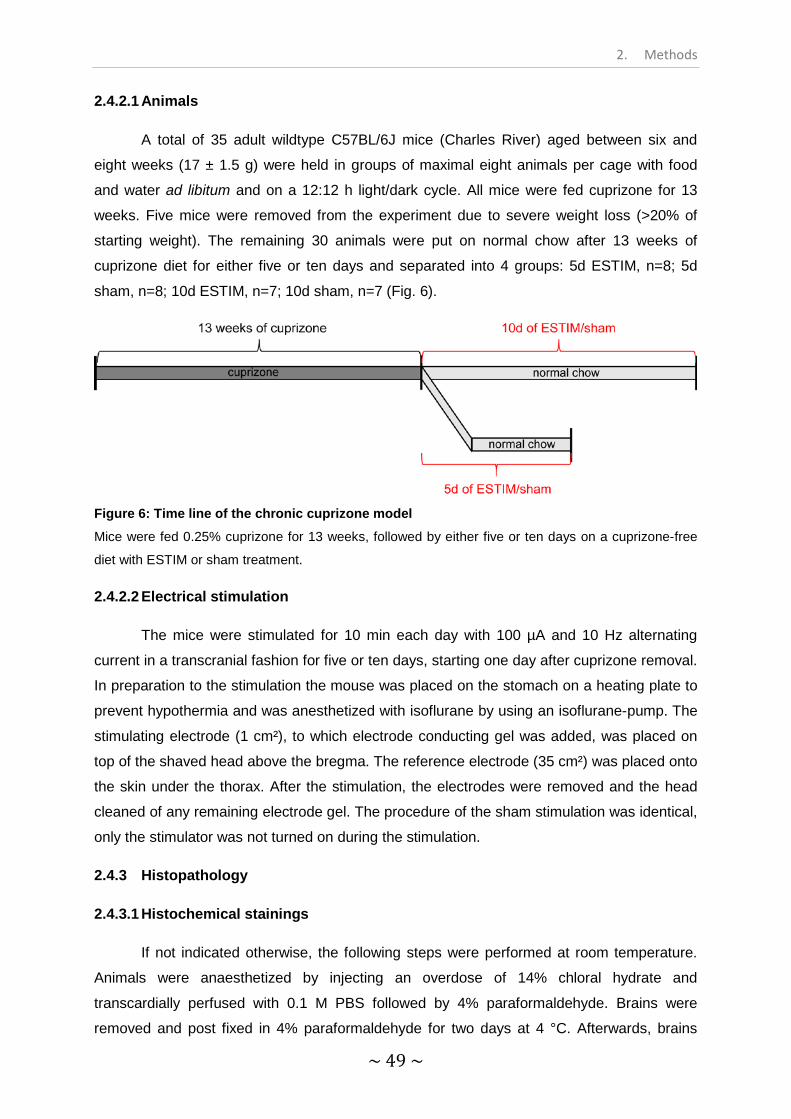
2. Methods
~ 49 ~
2.4.2.1 Animals
A total of 35 adult wildtype C57BL/6J mice (Charles River) aged between six and
eight weeks (17 ± 1.5 g) were held in groups of maximal eight animals per cage with food
and water ad libitum and on a 12:12 h light/dark cycle. All mice were fed cuprizone for 13
weeks. Five mice were removed from the experiment due to severe weight loss (>20% of
starting weight). The remaining 30 animals were put on normal chow after 13 weeks of
cuprizone diet for either five or ten days and separated into 4 groups: 5d ESTIM, n=8; 5d
sham, n=8; 10d ESTIM, n=7; 10d sham, n=7 (Fig. 6).
Figure 6: Time line of the chronic cuprizone model
Mice were fed 0.25% cuprizone for 13 weeks, followed by either five or ten days on a cuprizone-free
diet with ESTIM or sham treatment.
2.4.2.2 Electrical stimulation
The mice were stimulated for 10 min each day with 100 µA and 10 Hz alternating
current in a transcranial fashion for five or ten days, starting one day after cuprizone removal.
In preparation to the stimulation the mouse was placed on the stomach on a heating plate to
prevent hypothermia and was anesthetized with isoflurane by using an isoflurane-pump. The
stimulating electrode (1 cm²), to which electrode conducting gel was added, was placed on
top of the shaved head above the bregma. The reference electrode (35 cm²) was placed onto
the skin under the thorax. After the stimulation, the electrodes were removed and the head
cleaned of any remaining electrode gel. The procedure of the sham stimulation was identical,
only the stimulator was not turned on during the stimulation.
2.4.3 Histopathology
2.4.3.1 Histochemical stainings
If not indicated otherwise, the following steps were performed at room temperature.
Animals were anaesthetized by injecting an overdose of 14% chloral hydrate and
transcardially perfused with 0.1 M PBS followed by 4% paraformaldehyde. Brains were
removed and post fixed in 4% paraformaldehyde for two days at 4 °C. Afterwards, brains

2. Methods
~ 50 ~
were dissected and cut into 3-5 mm thick slices, which were dehydrated in an ascending
ethanol series before being embedded in paraffin. Brain slices were cut with 0.5 µm width
and stained with Hematoxylin / eosin (HE) for a general overview of the tissue, Luxol fast
blue / periodic acid Schiff (LFB/PAS) for detection of myelin and Bielschowsky for detection
of nerve fibers, as described in the following section. In preparation for histochemical
stainings, the brain slices were placed on microscope slides, deparaffinized (three times 3
min in Xylol and Isoxylol each) and rehydrated in a descending ethanol series (100%
ethanol, 90%, 70%, 50%, aqua bidest., 3 min each).
Hematoxylin / eosin staining (HE)
The first reagent of the HE staining, hematoxylin, is a basic dye, which stains
basophilic structures like the DNA or the rough endoplasmic reticulum. The second
component, eosin, is an alcohol based acid and colors eosinophilic structures like proteins.
Following the descending ethanol series the slices were processed in Mayer’s hemalum for 5
min, washed in aqua dest., differentiated in 1% HCl and blued with tap water for 10 min.
Subsequently, the slices were treated with 1% eosin for 5 min, washed with aqua dest.,
dehydrated through an ascending ethanol series and mounted.
Luxol fast blue / periodic acid Schiff (LFB/PAS) staining
A detailed description of the LFB/PAS staining can be found under 2.2.5.1.
Bielschowsky’s silver staining
The Bielschowsky staining colors nerve fibers and was used to detect possible axonal
loss due to necrosis after stereotactical injections. Following the deparaffination, the slices
were treated with a 20% silver nitrate solution for 20 min followed by 15 min in a 20% silver
nitrate solution to which 32% ammonia was added drop wise until the resulting precipitations
were cleared. Subsequently, the slices were transferred to into aqua bidest., to which initially
three drops of 32% ammonia were added, followed by ten drops of the development solution,
which started the development of the staining. The reaction was stopped with aqua dest., the
slices were incubated in 2% sodium thiosulfate for 2 min, washed with tap water and
dehydrated in an ascending ethanol series before mounted with glass coverslips.
2.4.4 Immunohistochemical stainings
The immunohistochemical stainings were performed as explained under 2.2.5.2. The
primary antibodies were used in the combinations MBP, Olig2/BrdU/MBP and
Olig2/p25/MBP for the focal demyelination model and Olig2/NogoA/BrdU for the chronic
2. Methods
~ 51 ~
cuprizone model. A complete list of all primary and secondary antibodies as well as the
pretreatments can be found in table 2 and table 3, respectively.
2.4.5 Data analysis
To evaluate the different cell populations of the histochemical and
immunohistochemical stainings, whole slide pictures were made by using the Olympus
VS120 fluorescence slide scanner with a 200-fold magnification. To reduce the file size, the
pictures were cropped and converted into tiff files. The quantification of the oligodendrocyte
cell populations of the chronic cuprizone model as well as oligodendrocyte populations and
the demyelinated lesion formation of the focal demyelination model was performed using
ImageJ (version 1.50b). Four separate counting areas were defined to evaluate the
oligodendrocyte populations, depending on their position in relation to the demyelinated
lesion (Fig. 7): demyelinated lesion area (lesion), perilesional area (peri-lesion, only at 3 and
5 d.p.i, defined as the area surrounding the lesion by up to 200 µm), remyelinated area (RM
area, only at 7 - 21 d.p.i) and normal appearing gray matter (NAGM). The statistical analysis
was performed using GraphPad Prism for Windows version 5.0.0. t-Tests were used to
compare two experimental groups with each other. In case of non-Gaussian distribution, a
Mann-Whitney test was performed. For comparing more than two experimental groups, a
Two-way ANOVA followed by Sidak’s multiple comparisons test was performed. To analyze
the lesion formation over time for each experimental group separately, a Kruskal-Wallis test
followed by Dunn’s multiple comparisons test was performed. A p value of ≤ 0.05 was
considered significant and a p value between 0.1 – 0.051 was considered a trend. Data are
presented as mean ± SEM.

2. Methods
~ 52 ~
Figure 7: Schematic overview of the four separate counting areas used to evaluate OLG populations in the focal EAE model
To quantify the OLG populations in relation to their distance towards the demyelinated lesion, four
separate areas were defined: demyelinated lesion area (lesion), perilesional area (peri-lesion, 3 and 5
d.p.i.), remyelinated area (RM area, 7 - 21 d.p.i.) and normal appearing gray matter (NAGM).

2. Methods
~ 53 ~
Part III – Methods
Transcranial electrical stimulation in healthy human subjects

2. Methods
~ 54 ~
2.5 Transcranial electrical stimulation in healthy human subjects
Transcranial alternating current stimulation (tACS) was applied in an electrical theta
burst (eTBS) fashion to the motor cortex of healthy human subjects to evaluate the impact of
electrical stimulation on corticospinal excitability.
2.5.1 Subjects
For the first part of the study which used 5 mA tACS, 17 healthy subjects aged 24.4 ±
3.4 years (9 females / 8 males) were recruited, of which three were left-handed. Due to
painful skin sensations during the electrical stimulation, two subjects from the first group (1
female / 1 male) withdraw from the clinical study. 14 healthy subjects aged 24.9 ± 4.5 years
(8 females / 6 males; all right handed) were recruited for the second part of the study. This
second study part utilized higher current intensity of 10 mA, therefore a sensation
questionnaire was introduced, which each participant had to complete after every session. Of
the second group of participants, four (3 female / 1 male) withdraw from the experiment due
to painful skin sensations. None of the volunteers matched any exclusion criteria like a
history of neurological disease, pregnancy, metallic implants or took any medications at the
time of the study. They all gave written informed consent and were compensated for
participating. The investigation was approved by the Ethics Committee of the Medical Faculty
of University of Göttingen, and conformed to the principals laid down in the Declaration of
Helsinki.
2.5.2 Transcranial magnetic stimulation
To measure potential changes in corticospinal excitability before and after eTBS,
monophasic single-pulse transcranial magnetic stimulation (TMS) was used as described by
Batsikadze et al., 2013 and Sommer et al., 2013. A figure-of-eight magnet coil (diameter of
one winding: 70 mm; peak magnetic field: 2.2 T) was held tangentially to the scalp over the
hand region of the motor cortex, with the handle pointing backwards and laterally at 45° from
midline to induce muscle evoked potentials (MEP). Two Ag-AgCl surface electrodes were
applied to the contralateral first dorsal interosseous (FDI) muscle in a belly-tendon montage
and used to record MEP induced by single pulse TMS. To determine the optimal position for
the coil (hotspot), single pulse TMS was induced until 1 mV MEP were recorded at the FDI. A
dermatological tested tattoo marker was used to mark the hotspot on the participants’ scalp,
therefore providing a fix point by which the coil can be repositioned at each measurement.
Resting motor threshold (RMT) was defined as the minimum stimulator output needed to
elicit a MEP response of ± 0.5 mV in the relaxed FDI muscle in at least 5 out of 10
consecutive trials. The signals were amplified and band-passed filtered (2 Hz to 2 kHz,

2. Methods
~ 55 ~
sampling rate 5 kHz, amplifier gain: 1000), digitized by a power 1401 AD converter,
controlled by Signal Software and stored for offline analysis.
2.5.3 Experimental design
The study was performed in a double-blinded, cross-over design with each eTBS
protocol applied in a randomized order. The participants were seated in a comfortable chair
with head and arm rests and were instructed to relax whenever necessary. Prior to the eTBS
treatment, two separate TMS measurements were performed with a ten-minute break in
between. The mean of the resulting MEP responses were calculated to establish a reliable
baseline. Further TMS measurements were performed immediately after the stimulation and
every 10 min for up to 60 min to evaluate eTBS after-effects. The experiments were
performed either between 09:00-12:00 a.m. or 03:00-07:00 p.m. and a minimum of one week
time was set between each session with the same subject to prevent any cross-session
effects.
2.5.4 Electrical theta burst stimulation
To apply eTBS, one electrode (3 x 4 cm; cable facing posterior direction) was placed
over the left primary motor cortex (M1 region), while the other electrode (6 x 8 cm; cable
facing lateral direction) was placed over the contralateral orbit. Both electrodes were
prepared with Ten20® conductive electrode paste to reduce the impedance during the
stimulation. The eTBS protocols were encoded by Signal Software version 2.16 and applied
by a DS5 isolated constant current stimulator. In the first part of the study, three different
eTBS protocols were used with an intensity of 5 mA. The eTBS protocols were adapted from
the original study performed by Huang et al. in 2005: intermittent eTBS (eiTBS), intermediate
eTBS (eimTBS) and continuous eTBS (ecTBS; Fig. 8). Each eTBS pattern consisted of three
stimulation pulses at 50 Hz, repeated every 200 ms for a total of 600 pulses each. Each of
these three pulses consisted of five sinusoidal bursts at 5 kHz, repeated every millisecond.
eiTBS uses a two-second train of eTBS repeated every 10 s for a total of 190 s. eimTBS
uses a five-second train of eTBS, repeated every 15 s for a total of 110 s. The ecTBS pattern
consists of a 40-second train of uninterrupted eTBS. As a forth protocol, sham stimulation
was introduced, in which the stimulator was programmed not to induce any currents. All
stimulation protocols, including sham, were set to last 240 seconds to ensure an optimal
blinding.
The second part of the study consisted of three altered ecTBS protocols: ecTBS with
sinusoidal bursts of 1 ms duration and 10 mA intensity, ecTBS with sinusoidal bursts of 5 ms
duration and 5 mA intensity and ecTBS with sinusoidal bursts of 5 ms duration and 10 mA
intensity.

2. Methods
~ 56 ~
Figure 8: Schematic illustration of the eTBS protocols
Each eTBS pattern consists of three pulses given at 50 Hz, repeated every 200 ms. Intermittent eTBS
(eiTBS) uses a 2 s train of eTBS, repeated every 10 s. Intermediate eTBS (eimTBS) uses a 5 s train of
eTBS, repeated every 15 s. Continuous eTBS (ecTBS) uses a 40 s train of uninterrupted eTBS. The
first part of the study uses sinusoidal bursts with a length of 1 ms at 5 kHz, whereas in the second part
of the study a burst length of 5 ms at 5 kHz was used in addition to the original sinusoidal bursts. The
basic TBS pattern were obtained and modified from Huang et al. (2005). This figure is part of a clinical
study, published in Frontiers in Human Neuroscience (Kunz et al. 2017).
2.5.5 Data analysis
Data were analyzed using GraphPad Prism for Windows version 5.0.0. Repeated
measures ANOVA with the parameters TYPE (type of stimulation) and TIME (time course of
60 min) was used on MEP data normalized to the respective baseline to compare each eTBS
condition vs. sham. Kruskal-Wallis test followed by Dunn’s multiple comparison test was
performed to compare specific time points to baseline. A p value of ≤ 0.05 was considered
significant and a p value of 0.1 – 0.051 was considered a trend. Data are presented as mean
± SEM.

3. Results
~ 57 ~
Part I – Results
Influence of autoimmune inflammation on remyelination in Cuprizone-induced demyelination

3. Results
~ 58 ~
3.1 Influence of autoimmune inflammation on remyelination in Cuprizone-induced demyelination
To evaluate the remyelination processes after Cuprizone-induced demyelination (two
weeks of 0.25% Cuprizone, followed by three weeks of 0.15%) with and without the
activation of the adaptive immune system, 77 mice were separated into four groups:
Cuprizone treated animals (Cup, n=29), Cuprizone treated animals immunized with MOG35-55
peptide (Cup-EAE, n=32), Cuprizone treated animals immunized with ovalbumin instead of
MOG35-55 peptide (Cup-Ova, n=12) and naïve control animals (n=4). The Cup-Ova mice
served as controls to Cuprizone/MOG treated animals during the initial set of experiments in
which the extent of the activation of the immune system was evaluated. Naïve controls were
used for electron microscopic analysis of the corpus callosum (CC) to compare the density of
myelinated fibers to Cup and Cup-EAE mice.
3.1.1 Cuprizone administration for 4.5 weeks leads to demyelination in the corpus callosum in Cup and Cup-EAE animals
The copper chelator Cuprizone was administered to all animals except the naïve
control mice for 4.5 weeks. To evaluate the extent of demyelination (DM) in the CC, LFB-
PAS stainings of the mouse brains of Cup and Cup-EAE animals were performed (Fig. 9 A-
C). For a more precise evaluation, the CC was separated into a medial and two lateral parts.
Semi-quantitative analysis using a well-established demyelination score (DM score, table 11;
Hiremath et al., 1998) revealed a severe demyelination in the medial as well as the lateral
CC of both experimental groups (Cup medial: 2.71 ± 0.29, Cup lateral: 2.86 ± 0.14; Cup-EAE
medial: 2.75 ± 0.16, Cup-EAE lateral: 3 ± 0; Fig. 9 D-F) to the same extent.

3. Results
~ 59 ~
Figure 9: 4.5 weeks of Cuprizone administration causes severe demyelination of the CC in Cup and Cup-EAE mice
LFB-PAS stainings of the CC of A naïve (n=4), B Cup (n=7) and C Cup-EAE mice (n=7). Cup and
Cup-EAE animals were fed Cuprizone for 4.5 weeks, while naïve animals were fed normal chow. D
Schematic illustration of the mouse brain with the medial and lateral parts of the CC separated by red
lines. Semi-quantitative analysis demonstrated an extensive demyelination in E the medial and F the
lateral CC of Cup as well as Cup-EAE animals. No significant difference was found by comparing the
two treatment groups using the Mann-Whitney test. Data are shown as means ± SEM.
3.1.2 Increased infiltration and activation of immune competent cells in Cuprizone/MOG treated animals
In the first set of experiments, the immune response after 4.5 weeks of Cuprizone
administration with and without MOG35-55 immunization was quantified by flow cytometric
analysis (Fig. 10). The total amount of T cells in the CNS of Cup-EAE mice was significantly
increased (34316 ± 7917 T cells, ***p<0.001) compared to the low number of T cells found in
Cuprizone treated mice (697.6 ± 132.4 T cells, Fig. 10 A). Cup-Ova mice demonstrated a
slightly, but not significantly, elevated level of T cells in the CNS compared to Cup animals
(7494 ± 2570 T cells, p=0.209), while compared to Cup-EAE animals the T cell population
was still slightly, but not significantly, smaller (p=0.125, Fig. 10 A). Following T cell activation
and infiltration after immunization with MOG35-55 peptide, an increase of NK cells was
expected as an immediate immune response. Indeed, the total cell count of NK cells was
significantly increased in Cup-EAE mice (2947 ± 538.5 NK cells) compared to Cup (164.3 ±
29.05 NK cells, ***p<0.001) and Cup-Ova (710.8 ± 200.3 NK cells, **p<0.01, Fig. 10 B)
animals. No increase in NK cells was registered following immunization with Ovalbumin
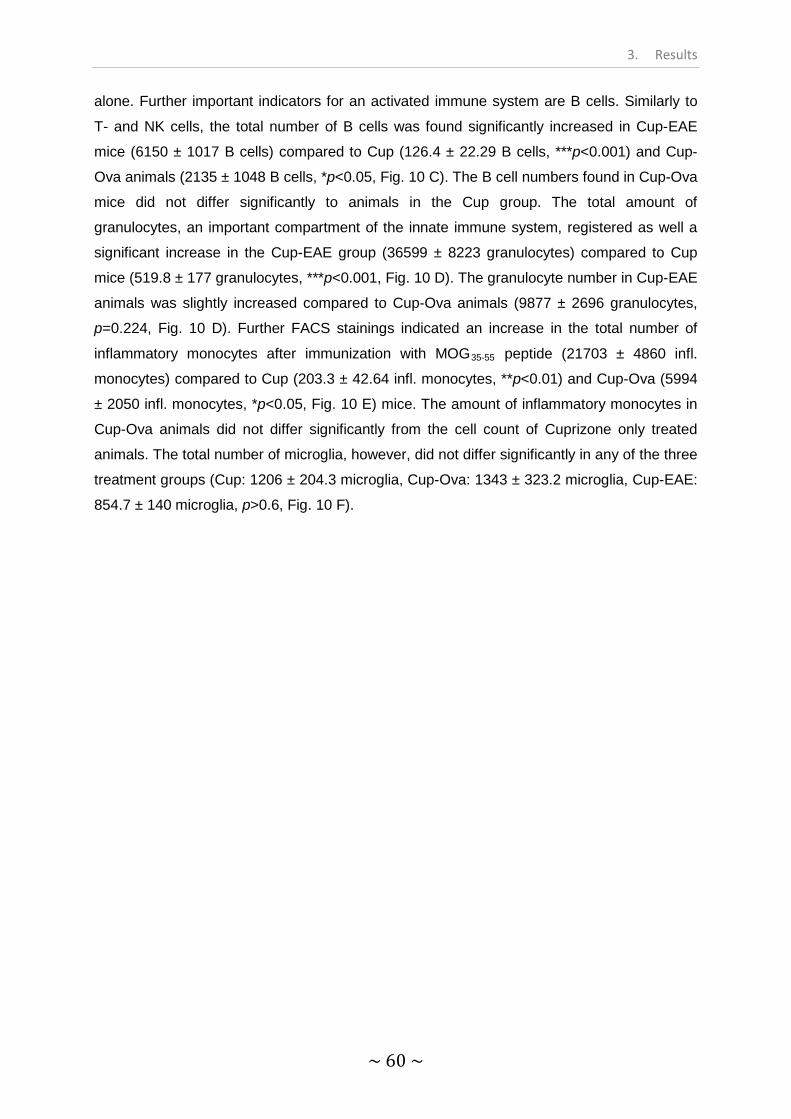
3. Results
~ 60 ~
alone. Further important indicators for an activated immune system are B cells. Similarly to
T- and NK cells, the total number of B cells was found significantly increased in Cup-EAE
mice (6150 ± 1017 B cells) compared to Cup (126.4 ± 22.29 B cells, ***p<0.001) and Cup-
Ova animals (2135 ± 1048 B cells, *p<0.05, Fig. 10 C). The B cell numbers found in Cup-Ova
mice did not differ significantly to animals in the Cup group. The total amount of
granulocytes, an important compartment of the innate immune system, registered as well a
significant increase in the Cup-EAE group (36599 ± 8223 granulocytes) compared to Cup
mice (519.8 ± 177 granulocytes, ***p<0.001, Fig. 10 D). The granulocyte number in Cup-EAE
animals was slightly increased compared to Cup-Ova animals (9877 ± 2696 granulocytes,
p=0.224, Fig. 10 D). Further FACS stainings indicated an increase in the total number of
inflammatory monocytes after immunization with MOG35-55 peptide (21703 ± 4860 infl.
monocytes) compared to Cup (203.3 ± 42.64 infl. monocytes, **p<0.01) and Cup-Ova (5994
± 2050 infl. monocytes, *p<0.05, Fig. 10 E) mice. The amount of inflammatory monocytes in
Cup-Ova animals did not differ significantly from the cell count of Cuprizone only treated
animals. The total number of microglia, however, did not differ significantly in any of the three
treatment groups (Cup: 1206 ± 204.3 microglia, Cup-Ova: 1343 ± 323.2 microglia, Cup-EAE:
854.7 ± 140 microglia, p>0.6, Fig. 10 F).
3. Results
~ 61 ~
Figure 10: Immunization with MOG35-55 peptide leads to increased infiltration of immune competent cells
Flow cytometric analysis of inflammatory cells in Cup (n=6), Cup-Ova (n=6) and Cup-EAE (n=9) mice.
Following immunization with MOG35-55 peptide, a significant increase in the total number of A T cells
(CD45+ CD3+; ***p<0.001), B NK cells (CD45+ Nk1.1+ Nkp46+; ***p<0.001), C B cells (CD45+ CD19+
CD3-; ***p<0.001), D granulocytes (CD45+ CD11b+ Ly6G+; ***p<0.001) and E inflammatory monocytes
(CD45+ Ly6C+ CCR2+; **p<0.01) was observed compared to Cuprizone only mice. Compared to Cup-
Ova mice, Cup-EAE animals demonstrated a significant increase in T cells (*p<0.05), NK cells
(**p<0.01), B cells (*p<0.05) and inflammatory monocytes (*p<0.05). F The total number of microglia
(CD45int CD11b+ Ly6G-) was similar in the different experimental groups (after immunization with either
ovalbumin or MOG35-55 peptide). Data were analyzed by One-way ANOVA followed by Bonferroni’s
multiple comparison test. For non-parametric data, the Kruskal-Wallis test followed by Dunn’s multiple
comparison test was performed. Data are shown as mean ± SEM.

3. Results
~ 62 ~
3.1.3 The number of OPC and mature OLG is largely unaffected by EAE induction
As demonstrated earlier, the number of T cells, which are known to contribute to an
inflammatory milieu by releasing pro-inflammatory cytokines like IFN-γ, was increased in
Cup-EAE animals. To assess whether the inflammatory environment influences the OLG
survival in the demyelinated corpus callosum, immunohistochemistry for the myelin-
associated neurite growth inhibitor NogoA and the transcription factor Olig2 were performed
(Fig. 11 A). OLG lacking the NogoA marker were considered OPC, while OLG expressing
NogoA were considered mature OLG. Animals were sacrificed after either 4.5 weeks of
Cuprizone treatment at the demyelination time point (DM) or after five additional days on
normal chow at the remyelination time point (RM) to evaluate OLG populations.
The average number of OPC found in the medial CC of Cup mice at the DM time
point remained similar compared to Cup-EAE mice (Cup DM: 705.1 ± 88.97 Olig2+NogoA-
cells/mm², Cup-EAE DM: 618.0 ± 74.86 Olig2+NogoA- cells/mm², Fig. 11 B) and decreased
after 5 days of RM for both groups (Cup RM: 315.0 ± 30.23 Olig2+NogoA- cells/mm²,
***p<0.001; Cup-EAE RM: 405.2 ± 36.06 Olig2+NogoA- cells/mm², *p<0.05; Fig. 11 B).
Similarly, OPC counts in the lateral area of the CC of Cup-EAE animals remained
comparable to Cup only mice at both time points (Cup DM: 441.5 ± 58.91 Olig2+NogoA-
cells/mm², Cup-EAE DM: 356.6 ± 34.33 Olig2+NogoA- cells/mm², Cup RM: 203 ± 17.37
Olig2+NogoA- cells/mm², Cup-EAE RM: 318.3 ± 47.48 Olig2+NogoA- cells/mm², Fig. 11 C).
However, only the Cup group demonstrated a significant drop in the OPC number after five
days of RM (**p=0.01), while the OPC number of Cup-EAE animals remained stable.
Quantifying the density of mature OLG in the medial CC, a different situation was
observed. The overall number of mature OLG was in general lower than the OPC number,
and a Two-way ANOVA revealed a difference in the density of NogoA+ OLG between Cup
and Cup-EAE animals (Cup DM: 265.3 ± 83.7 NogoA+ cells/mm², Cup-EAE DM: 169.5 ±
41.97 NogoA+ cells/mm², Cup RM: 241.7 ± 24.98 NogoA+ cells/mm², Cup-EAE RM: 88.98 ±
23.49 NogoA+ cells/mm², *p<0.05, F(1,23)=7.158, Fig. 11 D). However, a post-test with
Sidak’s multiple comparisons test demonstrated no significant effects between Cup and Cup-
EAE animals but a trend toward a decrease in the number of NogoA+ OLG after five
additional days of RM compared to the Cup group (p=0.0521; Fig. 11 D). No difference
between Cup and Cup-EAE animals was observed in the lateral CC at any time point, and
the number of NogoA+ OLG did not change significantly over time (Cup DM: 118.5 ± 33.4
NogoA+ cells/mm², Cup-EAE DM: 54.65 ± 12.74 NogoA+ cells/mm², Cup RM: 121.2 ± 14.93
NogoA+ cells/mm², Cup-EAE RM: 99.03 ± 25.51 NogoA+ cells/mm², Fig. 11 E).

3. Results
~ 63 ~
Figure 11: Less mature OLG in the medial corpus callosum at the RM time point after EAE
induction
Evaluation of OPC and mature OLG numbers by immunohistochemical stainings against Olig2 and
NogoA with (Cup-EAE DM n=6, Cup-EAE RM n=7) and without MOG35-55 immunization (Cup DM n=7,
Cup RM n=7). A Immunohistochemical staining of the CC of Cup and Cup-EAE mice after 4.5 weeks
of Cuprizone administration with antibodies against Olig2 (arrow) and NogoA (arrow head; scale bar:
100 µm, inset scale bar: 20 µm). B No significant effect on OPC numbers in the medial CC after EAE
induction compared to Cup. Both treatment groups depicted a significantly lower number of OPC at
the RM time point (Cup: ***p<0.001, Cup-EAE: *p<0.05; Two-way ANOVA followed by Sidak’s multiple
comparisons test). C No significant effect on OPC numbers in the lateral area of the CC after
immunization with MOG35-55 peptide compared to Cup. OPC of the Cup group are significantly
reduced at the RM time point (**p<0.01; Two-way ANOVA followed by Sidak’s multiple comparisons
test). D The Two-way ANOVA revealed a significant effect in the number of mature OLG in the medial
CC between Cup and Cup-EAE mice (*p<0.05, F(1,23)=7.158; Two-way ANOVA). After five days of
RM, Cup-EAE animals showed a slight decrease of mature OLG in the medial CC compared to Cup
3. Results
~ 64 ~
animals, which was not significant (p=0.0521; Two-way ANOVA followed by Sidak’s multiple
comparisons test). E The density of mature OLG in the lateral CC was similar in Cuprizone-fed
animals with and without EAE induction. Data are shown as mean ± SEM.
3.1.4 The density of myelin producing cells and degree of remyelination remain unchanged after immunization with MOG35-55 peptide
Oligodendrocytes are the myelin producing cells, thus any circumstances influencing
them could also affect the remyelination capacity. Therefore, LFB-PAS histochemical
stainings (Fig. 12 A) as well as PLP immunohistochemical stainings and PLP in situ
hybridization (Fig. 13 A) were performed to evaluate changes in myelin production after EAE
induction. A semi-quantitative analysis was performed using the already introduced DM
score (table 11) to evaluate the extent of demyelination in the CC.
As shown in 3.1.1, the DM score in the medial and the lateral area of the CC of Cup
mice as well as Cup-EAE mice did not differ after 4.5 weeks of Cuprizone feeding (Cup
medial: 2.71 ± 0.29, Cup-EAE medial: 2.75 ± 0.16, Cup lateral: 2.86 ± 0.14, Cup-EAE lateral:
3 ± 0, Fig. 12 B, C). Five days after Cuprizone withdrawal, the Cup-EAE animals
demonstrated a significant decrease in the DM score in the medial (Cup-EAE medial: 1.43 ±
0.37, **p<0.01, Fig. 12 B) as well as the lateral CC (Cup-EAE lateral: 2.07 ± 0.37, *p<0.05,
Fig. 12 C) compared to the DM time point. The DM score of Cup animals showed a
significant decrease in the medial CC (Cup medial: 1.57 ± 0.3, *p<0.05, Fig. 12 B) but not in
the lateral area (Cup lateral: 2.43 ± 0.23, Fig. 12 C). No significant effects were observed
between both experimental groups at the RM time point.

3. Results
~ 65 ~
Figure 12: The extent of de- and remyelination is unaffected by EAE induction A LFB-PAS histochemical stainings of Cup and Cup-EAE mice fed mice at the DM (Cup: n=7, Cup-
EAE: n=7) and RM time points (Cup: n=7, Cup-EAE: n=8; scale bar: 500 µm). B The remyelination
(indicated by dotted lines) slowly takes place in the medial area of the CC (Cup *p<0.05, Cup-EAE
**p<0.01, (p=0.0521; Two-way ANOVA followed by Sidak’s multiple comparisons test) and C the
lateral CC (Cup-EAE *p<0.05, Two-way ANOVA followed by Sidak’s multiple comparisons test) after 5
days on normal chow compared to the DM time point, as demonstrated by semi-quantitative analysis
of the CC using a DM score. No significant differences were observed between the experimental
groups. Data are shown as mean ± SEM.
In situ hybridization for PLP-mRNA, one of the major myelin proteins, displays the
amount of proteolipid protein mRNA present in the cell, thus serving as an indicator for
myelinating OLG. The number of PLP-mRNA+ cells was evaluated at the RM time point.
The density of PLP-mRNA+ cells did not change significantly after immunization with
MOG35-55 peptide neither in the medial (Cup: 668.9 ± 52.25 PLP-mRNA+ cells/mm², Cup-
EAE: 517.3 ± 57.1 PLP-mRNA+ cells/mm², Fig. 13 B) nor in the lateral CC (Cup: 386.8 ± 74.9

3. Results
~ 66 ~
PLP-mRNA+ cells/mm², Cup-EAE: 313.4 ± 47.91 PLP-mRNA+ cells/mm², Fig. 13 C).
Therefore, the induction of EAE does not seem to influence the PLP-mRNA expression 5
days into remyelination.
Figure 13: The density of PLP-mRNA+ cells is not affected by immunization with MOG35-55
peptide A In situ hybridization of PLP-mRNA in Cup (n=7) and Cup-EAE (n=7) mice after five days of RM
(scale bar: 100 µm, inset scale bar: 20 µm). Quantification of PLP-mRNA+ cells revealed no significant
difference between Cuprizone and Cuprizone-EAE animals in B the medial CC and C the lateral CC
(Mann-Whitney test). Data are shown as mean ± SEM.
3.1.5 Increased axonal damage in Cuprizone/MOG treated animals
To verify whether the increased inflammatory milieu would cause an increase of acute
axonal damage after 4.5 weeks of Cuprizone administration, brain slices of all three
experimental groups were immunohistochemically stained for amyloid precursor protein
(APP, Fig. 14 A) which accumulates when axonal transport is disturbed indicating axonal
damage. The corpus callosum was again separated into a medial and a lateral area and the
amount of APP+ axons was quantified for each experimental group. The average density of
APP+ axons in the medial part of the CC of Cup mice was 133.5 ± 33.15 APP+ axons/mm²,
which was similar in Cup-Ova (126.1 ± 15.18 APP+ axons/mm²) and Cup-EAE mice (180.0 ±
30.99 APP+ axons/mm², Fig. 14 B). In contrast, the number of APP+ axons in the lateral CC
increased significantly after EAE induction (Cup: 71.66 ± 16.53 APP+ axons/mm², Cup-EAE:
208.8 ± 25.242 APP+ axons/mm², ***p<0.001, Fig. 14 C). Furthermore, Cup-EAE mice

3. Results
~ 67 ~
displayed a significant increase of damaged axons in the lateral CC compared to Cup-Ova
animals (95.11 ± 15.66 APP+ axons/mm², **p<0.01, Fig. 14 C).
Figure 14: Increased number of APP+ axons in the lateral CC of Cup-EAE mice
Quantification of axonal damage by immunohistochemical stainings for APP in the CC of Cup (n=6),
Cup-Ova (n=6) and Cup-EAE (n=5) mice. A Immunohistochemical staining of the CC of Cup animals
and Cup-EAE animals for APP (scale bar: 100 µm, inset scale bar: 20 µm). Areas of axonal damage
are marked in brown (arrow). B Quantification of APP+ axons in the medial CC revealed no significant
difference between the three experimental groups. C Quantification of APP+ axons in the lateral CC
revealed a significant increase in the amount of damaged axons in Cup-EAE mice compared to Cup-
Ova (**p<0.01) and Cup mice (***p<0.001, One-way ANOVA). Data are shown as mean ± SEM.
3.1.6 The density of myelinated axons is unaffected by EAE induction
To support the light microscopical data on efficient remyelination in both Cup and
Cup-EAE animals on the electron microscopic level, pictures were taken at a 12000 fold
magnification and analyzed for the density of myelinated axons in Cuprizone-fed, Cuprizone-
EAE (Fig. 15 A) and naïve control animals. Between four and nine pictures were taken from
different areas of the CC of each mouse, and the amount of myelinated axons was
quantified.
Repeated measurements Two-way ANOVA was used to compare all three treatment
groups, using the parameters TIME for the DM and RM time point and COND for the different
group conditions. A significant interaction was found only for COND (F(2,19)=8.783,

3. Results
~ 68 ~
**p<0.01) and not for TIME (F(1,19)=3.382, p=0.0816), demonstrating a significant difference
between the treatment groups and a trend towards an increase in the density of myelinating
axons after five days on normal chow compared to the respective DM time point (Fig. 15 B).
The former manifested in decreased numbers of myelinated axons in Cup-EAE mice (Cup-
EAE: 0.42 ± 0.17 myelinated axons/µm², **p<0.01) compared to naïve animals (1.27 ± 0.16
myelinated axons/µm²) after 4.5 weeks of Cuprizone administration, while Cup animals
registered a trend towards a decrease in the number of myelinated axons (Cup: 0.67 ± 0.09
myelinated axons/µm², p=0.0823, Fig. 15 B). At the RM time point, the density of myelinated
fibers in both Cup (0.97 ± 0.16 myelinated axons/µm²) and Cup-EAE animals (0.82 ± 0.16
myelinated axons/µm², Fig. 15 B) recovered to the level of naïve controls, so no significant
difference was found between the three experimental groups. No significant difference with
regard to the density of myelinated axons was observed at any time point between Cup and
Cup-EAE mice.

3. Results
~ 69 ~
Figure 15: The density of myelinated axons is significantly reduced in Cup-EAE animals at the
DM time point and not significantly different between the experimental groups at the RM time point
Quantification of the density of myelinated fibers in the CC of Cuprizone treated animals (DM n=4, RM
n=5), Cuprizone-EAE animals (DM n=3, RM n=5) and naïve controls (n=4), evaluated after 4.5 weeks
of Cuprizone administration and after five additional days of Cuprizone-free diet. A Electron
microscopic pictures of the CC of Cup and Cup-EAE mice at the DM and RM time points (12000 fold
magnification, scale bar: 1 µm). B Repeated measures Two-way ANOVA revealed a trend toward an
increase in myelinated fibers between the DM and RM time points (F(1,19)=3.382, p=0.082) and a
significant interaction between the experimental groups (F(2,19)=8.783, **p<0.01). The density of
myelinated axons was significantly decreased in Cup-EAE animals (**p<0.01) compared to naïve
controls at the DM time point, while Cup animals showed a tendency toward a decrease (p=0.082). No
significant effects were registered after 5 days on normal chow for neither experimental group
compared to naïve controls. No changes were observed between Cuprizone and Cuprizone-EAE
animals. Data are shown as mean ± SEM.

3. Results
~ 70 ~
Part II – Results
Influence of transcranial alternating current stimulation on spontaneous remyelination in in vitro and in vivo models

3. Results
~ 71 ~
3.2 Influence of transcranial alternating current stimulation on spontaneous remyelination in in vitro and in vivo models
In the following part, the effect of electrical stimulation (ESTIM) on spontaneous (re-)
myelination was evaluated in different in vitro and in vivo models. Primary rat oligodendroglial
cell cultures as well as primary mixed cortical cell cultures consisting of oligodendrocytes,
astrocytes and neurons were created to investigate the influence of ESTIM on oligodendroglial
survival, myelin production and myelination of unmyelinated axons. To evaluate possible
effects of ESTIM on remyelination in rodent models of demyelination, transcranial alternating
currents were applied to rats with focally demyelinated lesions in the gray matter as well as
to mice which showed a delayed remyelination of the corpus callosum after prolonged
administration of Cuprizone.
3.2.1 Influence of alternating current stimulation on cell viability and myelin production in primary oligodendroglial cell cultures and mixed cortical cell cultures
Primary oligodendrocyte cultures were used to evaluate the effect of a 10 mA
electrical field fluctuating in a 10 Hz frequency on cell viability and myelin production in the
absence of axonal fibers. Myelinating mixed cortical cultures consisting of oligodendrocytes
and cortical neurons were used to evaluate the effect of electrical stimulation on cytotoxicity
and myelination of axonal fibers.
3.2.1.1 The amount of myelin producing oligodendrocytes in primary oligodendrocyte cultures remains unchanged after electrical stimulation
To investigate the effect of electrical stimulation on oligodendrocyte growth,
differentiation and myelin production, primary oligodendrocyte cultures were cultivated and
stimulated for four consecutive days (ESTIM). The amount of oligodendroglial O4+ cells
expression MBP was determined by immunocytochemistry (Fig. 16 A, B) and compared to
unstimulated control cultures (NOSTIM).
The number of O4 positive cells in ESTIM cultures was normalized to the number of
O4 positive cells in NOSTIM cultures. No change in the number of O4 positive cells of ESTIM
cultures was observed neither over the time course of four days nor in relation to NOSTIM
cultures (ESTIM d1: 166.8 ± 45.38% of NOSTIM, ESTIM d2: 109.9 ± 13.81% of NOSTIM,
ESTIM d3: 128.5 ± 13.18% of NOSTIM, ESTIM d4: 106.6 ± 15.0% of NOSTIM, Fig. 16 A).
A Two-way ANOVA was conducted to examine the number of O4+MBP+ cells in
NOSTIM and ESTIM cultures over the time course of 4 days and a significant increase over
time was observed (****p<0.0001, F(3,60)=16.54). 4.81 ± 3.28% of all DAPI positive cells in
the unstimulated group showed a co-labeling for O4 and MBP at day 1, which increased over

3. Results
~ 72 ~
time (NOSTIM d2: 21.22 ± 4.14%, NOSTIM d3: 21.16 ± 3.43%, NOSTIM d4: 20.0 ± 3.49%,
Fig. 16 B). Similarly, the amount of O4/MBP double positive cells of the stimulated cultures
increased over time as well (ESTIM d1: 2.02 ± 1.06%, ESTIM d2: 14.19 ± 3.43%, ESTIM d3:
23.8 ± 5.28%, ESTIM d4: 22.45 ± 3.75%, Fig. 16 B). Nevertheless, no significant effect was
observed at any time point by comparing both treatment groups.
Figure 16: O4+ oligodendrocytes and expression of MBP are unaffected by electrical stimulation Quantification of immunocytochemical stainings for O4 and MBP of OLG cultures after 1, 2, 3 and 4
days of either ESTIM (n=6-10) or NOSTIM (n=6-10). A The amount of O4+ cells in the ESTIM cultures,
normalized to NOSTIM cultures, remained stable over the time course of four days. B The number of
myelin forming OLG increased significantly over time (****p<0.0001, F(3,60)=16.54, Two-way
ANOVA). No significant differences were observed between NOSTIM and ESTIM cultures at any time
point. Data are shown as mean ± SEM.
3.2.1.2 Myelination and cell viability in mixed cortical cell cultures are unaffected by electrical stimulation
The effect of electrical stimulation on the myelination capacity of oligodendrocytes in
the presence of axonal fibers was evaluated using mixed cortical cultures consisting of
oligodendrocytes, astrocytes and cortical neurons. Immunocytochemistry for neurofilament
NF200 and MBP were performed to visualize myelinated and non-myelinated axons (Fig. 17
A). To quantify the number of myelinated fibers, five visual fields were randomly determined
on each cover slip, and axonal fibers were counted using a counting grid (Fig. 17 B).

3. Results
~ 73 ~
Figure 17: ESTIM does not influence the amount of myelinated fibers
Immunocytochemical stainings for NF200 (red) and MBP (green) were performed for mixed cortical
cultures after 1, 2, 3 and 4 days of either NOSTIM (n=8-10) or ESTIM (n=8-10). A One day after the
OLG cultures had been transferred onto neuronal cultures, mostly non-myelinated axons
(NF200+MBP-) were found. At d4, however, several MBP+ OLG were observed in both experimental
groups, enwrapping nearby axons with myelin sheaths (arrows). B The number of myelinated and
non-myelinated fibers was determined using a counting grid consisting of two circles overlying the
image. Only axonal fibers crossing a yellow line were counted. C Percentage of myelinated axonal
fibers in relation to the total amount of axonal fibers of both treatment groups after up to 4 days in vitro.
A Two-way ANOVA analyzing the percentage of myelinated axons over the time course of four days
for both experimental groups revealed a significant increase over time (*p<0.05, F(3,66)=3.762, Two-
way ANOVA). Sidak’s multiple comparisons test demonstrated no significant differences between the
two groups. Data are shown as mean ± SEM.
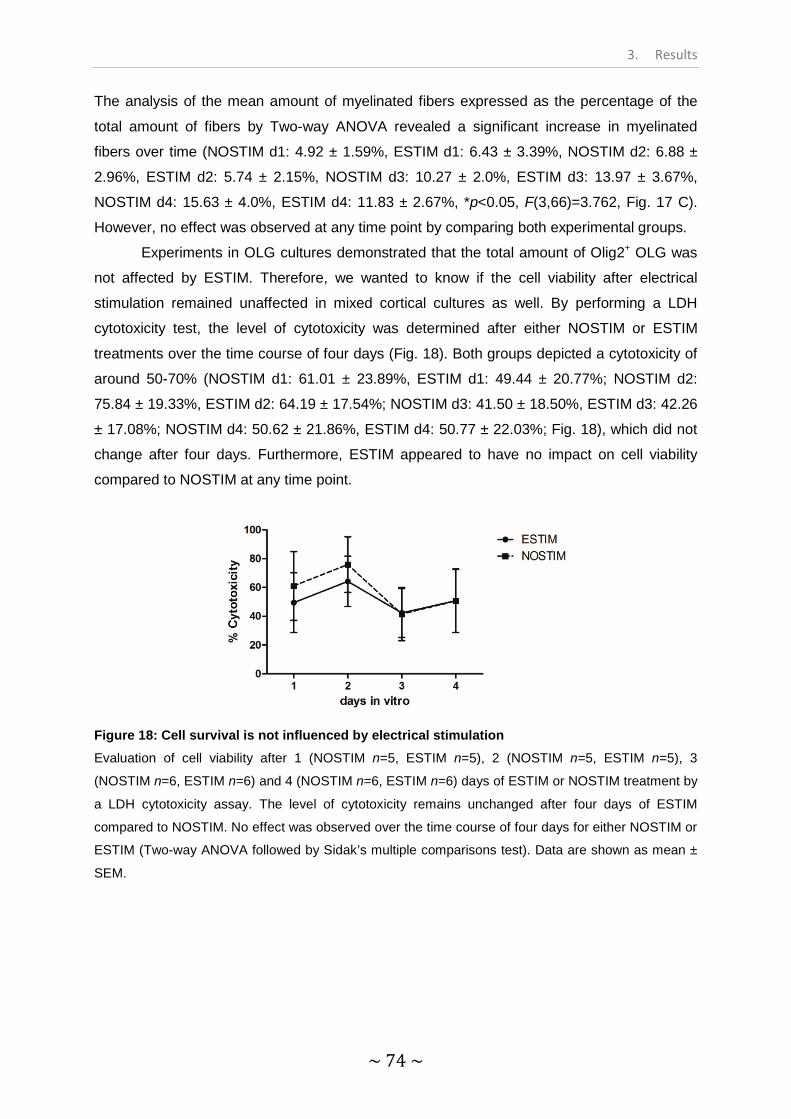
3. Results
~ 74 ~
The analysis of the mean amount of myelinated fibers expressed as the percentage of the
total amount of fibers by Two-way ANOVA revealed a significant increase in myelinated
fibers over time (NOSTIM d1: 4.92 ± 1.59%, ESTIM d1: 6.43 ± 3.39%, NOSTIM d2: 6.88 ±
2.96%, ESTIM d2: 5.74 ± 2.15%, NOSTIM d3: 10.27 ± 2.0%, ESTIM d3: 13.97 ± 3.67%,
NOSTIM d4: 15.63 ± 4.0%, ESTIM d4: 11.83 ± 2.67%, *p<0.05, F(3,66)=3.762, Fig. 17 C).
However, no effect was observed at any time point by comparing both experimental groups.
Experiments in OLG cultures demonstrated that the total amount of Olig2+ OLG was
not affected by ESTIM. Therefore, we wanted to know if the cell viability after electrical
stimulation remained unaffected in mixed cortical cultures as well. By performing a LDH
cytotoxicity test, the level of cytotoxicity was determined after either NOSTIM or ESTIM
treatments over the time course of four days (Fig. 18). Both groups depicted a cytotoxicity of
around 50-70% (NOSTIM d1: 61.01 ± 23.89%, ESTIM d1: 49.44 ± 20.77%; NOSTIM d2:
75.84 ± 19.33%, ESTIM d2: 64.19 ± 17.54%; NOSTIM d3: 41.50 ± 18.50%, ESTIM d3: 42.26
± 17.08%; NOSTIM d4: 50.62 ± 21.86%, ESTIM d4: 50.77 ± 22.03%; Fig. 18), which did not
change after four days. Furthermore, ESTIM appeared to have no impact on cell viability
compared to NOSTIM at any time point.
Figure 18: Cell survival is not influenced by electrical stimulation Evaluation of cell viability after 1 (NOSTIM n=5, ESTIM n=5), 2 (NOSTIM n=5, ESTIM n=5), 3
(NOSTIM n=6, ESTIM n=6) and 4 (NOSTIM n=6, ESTIM n=6) days of ESTIM or NOSTIM treatment by
a LDH cytotoxicity assay. The level of cytotoxicity remains unchanged after four days of ESTIM
compared to NOSTIM. No effect was observed over the time course of four days for either NOSTIM or
ESTIM (Two-way ANOVA followed by Sidak’s multiple comparisons test). Data are shown as mean ±
SEM.

3. Results
~ 75 ~
3.2.2 Influence of transcranial alternating current stimulation on spontaneous remyelination in rodent models of demyelination
3.2.2.1 Focal EAE model
The stereotactical injection of the myelin specific antibody Z2 in combination with
mouse complement leads to focal demyelinated lesions in the cortex of Lewis rats. tACS
(ESTIM, 100 µA, 10 Hz) and sham stimulation (sham) were applied on three consecutive
days for 10 minutes each day during the initial phase of lesion formation. Animals were
sacrificed at 3, 5, 7, 10, 14 and 21 days post injection (d.p.i.), and the extent of the
demyelinated area as well as the presence of different oligodendrocyte populations was
quantified on immunohistochemically stained brain sections. A third experimental group,
consisting of rats which were neither electrically nor sham stimulated but injected with the
same Z2/mouse complement solution (NOSTIM), was also assessed to compare the extent
of the MBP depleted area.
3.2.2.1.1 Intracortical injection of anti-MOG antibodies (Z2) and mouse complement leads to demyelinated lesions devoid of MBP with minimal axonal loss injection
Following the stereotactical injection of Z2 antibodies and mouse complement, a
cone-shaped area devoid of MBP was observed surrounding the injection site in the primary
motor cortex and extending subpially along the somatosensory cortex towards the visceral
area (Fig. 19). No axonal loss was detected in the demyelinated area, while only minimal
axonal loss was observed at the site of the stereotactical injection, confirmed by
Bielschowsky silver impregnation (Fig. 19). Whereas after five days a pronounced
demyelinated lesion was found following ESTIM as well as sham treatment, MBP
immunohistochemistry indicated a fast spontaneous remyelination, starting after seven days
(detected by thin MBP positive signals in the previously demyelinated area) and leading to an
almost completely remyelinated lesion at 21 d.p.i. for both treatment groups (Fig. 20).

3. Results
~ 76 ~
Figure 19: Formation of a demyelinated lesion after stereotactical injection with Z2 antibody and mouse complement without substantial axonal damage and loss
Depicted are brain hemispheres from a naïve rat and a rat injected with the MOG-specific antibody Z2
in combination with mouse complement. The hemispheres were stained for MBP to detect loss of
myelin and silver impregnated with Bielschowsky’s technique to exclude important axonal damage and
loss (scale bar: 500 µm). After injection of Z2 and mouse complement, a demyelinated lesion was
detected in the motor cortex around the injection site, which extended subpially along the
somatosensory cortex towards the visceral area (dotted line). Despite the loss of MBP signal, little or
no axonal damage was observed by Bielschowsky silver impregnation, indicating primary
demyelination.

3. Results
~ 77 ~
Figure 20: Lesion formation of sham and ESTIM animals over a time course of 21 days demonstrated by MBP immunohistochemistry Close view of the subpial area of sham and ESTIM treated animals after 5, 7 and 21 days, immuno-
stained for MBP (scale bar: 100 µm). At d5, the subpial area of both sham and ESTIM animals
depicted a loss of MBP signal. The first signs of remyelination were detected at d7 in both treatment
groups, indicated by thin MBP positive signals (dotted lines), which extended across the entire subpial
area after 21 days.
3.2.2.1.2 Remyelination of the MBP depleted area is slightly impaired at three weeks following tACS and sham stimulation
The extent of the demyelinated area (DM area) was analyzed by measuring the MBP
depleted areas in the gray matter and subpial area on MBP immuno-stained brain sections.
The size of the MBP depleted area decreased significantly over the time course of 21 days
for all three experimental groups (NOSTIM: ****p<0.0001, sham: *p<0.05, ESTIM: **p<0.01,
Fig. 21). The demyelinated area was largest at three days after lesion induction (NOSTIM:
1.62 ± 0.42 mm², sham: 1.64 ± 0.22 mm², ESTIM: 1.34 ± 0.24 mm²), gradually decreased
after five (NOSTIM: 0.87 ± 0.2 mm², sham: 1.03 ± 0.2 mm², ESTIM: 1.86 ± 0.23 mm²), seven
(NOSTIM: 0.79 ± 0.26 mm², sham: 1.25 ± 0.27 mm², ESTIM: 1.62 ± 0.29 mm²) and ten days
(NOSTIM: 0.32 ± 0.07 mm², sham: 0.51 ± 0.24 mm², ESTIM: 0.61 ± 0.2 mm²) and almost
disappeared after 14 (NOSTIM: 0.08 ± 0.02 mm², sham: 0.67 ± 0.26 mm², ESTIM: 0.46 ±
0.13 mm²) and 21 days (NOSTIM: 0.03 ± 0.02 mm², sham: 0.58 ± 0.16 mm², ESTIM: 0.59 ±
0.13 mm², Fig. 21) for all three experimental groups. However, the ESTIM group showed a

3. Results
~ 78 ~
trend toward a larger DM area size at 5 d.p.i. compared to sham and a significant increase
compared to NOSTIM at 5 and 7 d.p.i. (ESTIM vs. sham d5: p=0.056, ESTIM vs. NOSTIM
d5: **p<0.01, ESTIM vs. sham d7: p=0.454, ESTIM vs. NOSTIM d7: *p<0.05), which leveled
out to the DM area size of the sham group after 10 days. Furthermore, sham, in contrast to
ESTIM, demonstrated a trend towards a larger DM area after 14 days compared to NOSTIM
(sham vs. NOSTIM d14: p=0.082, Fig. 21). No significant differences in the size of the DM
area were observed between sham and ESTIM animals at any time point.
Figure 21: Demyelinated lesion size gradually decreases over a time course of three weeks Quantification of the demyelinated area after lesion induction reveals a gradual decrease in lesion size
within 21 days (NOSTIM: ****p<0.0001, n=7-11; sham: *p<0.05, n=4-6; ESTIM: **p<0.01, n=4-8). No
significant effect was observed by comparing sham and ESTIM animals. The size of the DM area of
ESTIM animals was significantly larger after 5 (**p<0.01) and 7 (*p<0.05) days compared to NOSTIM
animals. DM area was determined by analyzing MBP immunohistochemical stainings. Data were
analyzed by Two-way ANOVA followed by Tukey’s multiple comparisons test to compare all three
experimental groups and by Kruskal-Wallis test followed by Dunn’s Multiple Comparison Test to
analyze the lesion formation over time for each group separately. Data are shown as mean ± SEM.
3.2.2.1.3 The density of oligodendrocyte precursor cells and mature oligodendrocytes is unchanged after ESTIM
Oligodendrocyte precursor cells are mandatory for efficient remyelination. For this
reason, the amount of OPC and mature OLG in the gray matter of either sham treated or
ESTIM treated Lewis rats after induction of cortical demyelinated lesions was quantified. The
extracellular milieu inside and around the demyelinated lesion can be different from the
healthy tissue, thus affecting OLG populations in a different way. Therefore, four separate
counting areas were defined to evaluate the different OLG populations (Fig. 22 A):
demyelinated lesion area (DM lesion, 3-14 d.p.i.), perilesional area (perilesion, 3 and 5
d.p.i.), remyelinated area (RM area, 7-21 d.p.i.) and normal appearing gray matter (NAGM).
Since only very few animals displayed a demyelinated lesion after 21 days, no statistical

3. Results
~ 79 ~
analysis could be performed for the demyelinated lesion area at 21 d.p.i., and the time point
was removed for this specific counting area. To determine the density of OPC and mature
OLG, respectively, immunohistochemistry for the transcription factor Olig2 and the myelin
protein TPPP/p25 were used (Fig. 22 A). Cells lacking the marker for mature OLG
(Olig2+p25-) were considered OPC. Antibodies against MBP were used to label myelin, thus
visualizing de- and remyelination. DAPI was used to label the cell nuclei.
Three days after lesion induction, 78.78 ± 31.89 Olig2+p25- cells/mm² were found
inside the demyelinated lesion of sham treated animals and 100.7 ± 4.82 Olig2+p25-
cells/mm² were found in ESTIM treated animals (Fig. 22 B). At 5 d.p.i., the amount of OPC in
the ESTIM group decreased to 55.43 ± 17.14 Olig2+p25- cells/mm², although not significantly,
whereas the OPC number in the sham group remained unchanged (116.2 ± 7.92 Olig2+p25-
cell/mm², Fig. 22A). Similarly, no significant effects on OPC numbers were observed for the
remaining time points (ESTIM d7: 87.4 ± 24.51 Olig2+p25- cell/mm², sham d7: 106.7 ± 37.86
Olig2+p25- cells/mm², ESTIM d10: 48.07 ± 11.67 Olig2+p25- cells/mm², sham d10: 49.11 ±
4.17 Olig2+p25- cells/mm², ESTIM d14: 47.97 ± 16.34 Olig2+p25- cells/mm², sham d14: 51.72
± 3.84 Olig2+p25- cells/mm², Fig. 22 B). However, Two-way ANOVA revealed a significant
change of OPC over time (*p<0.05, F(4,29)=3.500). The density of p25+, mature OLG inside
the demyelinated area did not differ between sham and ESTIM but, similar to OPC,
demonstrated a decrease over the time course of 14 days (*p<0.05, F(4,28)=3.144, Fig. 22
C). 49.01 ± 16.03 p25+ cells/mm² were detected after three days in sham treated animals and
56.78 ± 6.07 p25+ cells/mm² in tACS treated animals. Almost the same number of mature
OLG was found after five (sham: 56.7 ± 10.9 p25+ cells/mm², ESTIM: 51.25 ± 7.79 p25+
cells/mm²), seven (sham: 32.37 ± 4.58 p25+ cells/mm², ESTIM: 48.89 ± 13.14 p25+
cells/mm²), ten days (sham: 27.07 ± 11.07 p25+ cells/mm², ESTIM: 32.62 ± 4.7 p25+
cells/mm²) and 14 days (sham: 28.25 ± 6.99 p25+ cells/mm², ESTIM: 22.85 ± 6.39 p25+
cells/mm², Fig. 22 C).
The time points 3 and 5 d.p.i. represented an early stage in which no remyelination of
the demyelinated area was detected yet. Therefore, a perilesional area was defined to
evaluate OLG populations which were resident in the lesion periphery. The total number of
p25+ OLG in the perilesional area of both experimental groups was higher than the number of
p25+ OLG in the DM lesion (sham: *p<0.05, ESTIM: **p<0.01) but smaller than the p25+ OLG
population in the NAGM (sham: **p<0.01, ESTIM: *p<0.05). In contrast to the ESTIM group,
only the total Olig2+p25- OPC population in the perilesional area of sham animals
demonstrated a significantly reduced cell count compared to NAGM (sham: **p<0.01).
Besides that, no further effect was observed between the experimental groups in regard to
OPC (sham d3: 62.66 ± 17.45 Olig2+p25- cells/mm², ESTIM d3: 93.43 ± 4.825 Olig2+p25-
cells/mm², p=0.35; sham d5: 102.7 ± 11.26 Olig2+p25- cells/mm², ESTIM d5: 79.86 ± 20.44
3. Results
~ 80 ~
Olig2+p25- cells/mm², Fig. 22 D) in the perilesional area. While mature OLG in the
perilesional area showed similar numbers with and without ESTIM (sham d3: 102 ± 22.07
p25+ cells/mm², ESTIM d3: 122.2 ± 15.3 p25+ cells/mm², sham d5: 145.3 ± 10.24 p25+
cells/mm², ESTIM d5: 152.6 ± 16.4 p25+ cells/mm², Fig. 22 E), a significant increase in p25+
cells was registered from d3 to d5 (*p<0.05, F(1,9)=5.434).

3. Results
~ 81 ~

3. Results
~ 82 ~
Figure 22: Oligodendrocyte populations are largely unaffected by ESTIM (continued from
previous page)
A Immunohistochemical stainings with antibodies against Olig2 (arrow) and p25 (arrow head) were
performed to quantify OPC and mature OLG populations after either sham or ESTIM treatment in four
different areas: inside the lesion, in the perilesional area, in the remyelinated area and in the NAGM.
The density of B OPC inside the lesion was not effected by ESTIM, while Two-way ANOVA revealed a
significant decrease over the time course (*p<0.05, F(4,29)=3.500; sham n=3-5, ESTIM n=3-5). C The
density of mature OLG (sham n=3-5, ESTIM n=3-5) inside the lesion remained unchanged after tACS.
Two-way ANOVA analysis demonstrated a significant drop in the number of mature OLG over time
(*p<0.05, F(4,28)=3.144). D The number of OPC (sham n=3-4, ESTIM n=3) in the perilesional area
demonstrated no effect between both experimental groups nor over the time course of two days, E
while the mature OLG (sham n=3-4, ESTIM n=3) in the perilesional area showed no effect between
ESTIM and sham animals as well, but demonstrated a significant increase in p25+ cell numbers from
d3 to d5 (*p<0.05, F(1,9)=5.434). F A significant decrease in the OPC population was observed in the
RM area (**p<0.01, F(3,27)=6.046), while again no change was observed between sham (n=3-5) and
ESTIM (n=3-5) animals. G The number of mature OLG in the RM area remained unchanged for sham
(n=3-5) as well as ESTIM animals (n=3-5). H The OPC population in the NAGM decreased
significantly over time (****p<0.0001, F(5,37)=7.224), whereas no differences between ESTIM (n=3-5)
and sham (n=2-5) animals was observed at any time point. I Neither sham (n=2-5) nor ESTIM (n=3-5)
animals demonstrated a significant effect on mature OLG in the NAGM. Data were analyzed by Two-
way ANOVA, followed by Sidak’s multiple comparisons test and are presented as mean ± SEM.
Since after seven days the first signs of remyelination were observed, a RM area was
defined for the time points 7, 10, 14 and 21 d.p.i., covering previously demyelinated areas
which showed signs of remyelination, e.g. thin and discontinuous MBP+ myelin fibers. A
significant decrease in the amount of OPC was observed by analysis of the RM area of sham
and ESTIM animals over the time course of two weeks with Two-way ANOVA (ESTIM d7:
87.05 ± 22.11 Olig2+p25- cells/mm², ESTIM d10: 75.07 ± 7.07 Olig2+p25- cells/mm², ESTIM
d14: 48.75 ± 4.2 Olig2+p25- cells/mm², ESTIM d21: 25.86 ± 8.04 Olig2+p25- cells/mm²; sham
d7: 78.32 ± 7.27 Olig2+p25- cells/mm², sham d10: 53.72 ± 5.79 Olig2+p25- cells/mm², sham
d14: 45.15 ± 10.76 Olig2+p25- cells/mm², sham d21: 36.25 ± 11.99 Olig2+p25- cells/mm²;
**p<0.01, F(3,27)=6.046; Fig. 22 F). The number of mature p25+ OLG, however, remained
stable (ESTIM d7: 101.1 ± 14.86 p25+ cells/mm², ESTIM d10: 80.76 ± 9.45 p25+ cells/mm²,
ESTIM d14: 99.81 ± 6.2 p25+ cells/mm², ESTIM d21: 81.56 ± 25.19 p25+ cells/mm²; sham d7:
90.86 ± 21.66 p25+ cells/mm², sham d10: 62.65 ± 21.51 p25+ cells/mm², sham d14: 105.1 ±
7.64 p25+ cells/mm², sham d21: 55.42 ± 15.93 p25+ cells/mm²; Fig. 22 G).
Regarding the NAGM, a Two-way ANOVA revealed a significant decrease in the OPC
population over the time course of 21 days (ESTIM d3: 132.5 ± 4.65 Olig2+p25- cells/mm²,
ESTIM d5: 98.0 ± 28.1 Olig2+p25- cells/mm², ESTIM d7: 122.0 ± 22.89 Olig2+p25- cells/mm²,
ESTIM d10: 71.7 ± 17.06 Olig2+p25- cells/mm², ESTIM d14: 80.64 ± 9.62 Olig2+p25-

3. Results
~ 83 ~
cells/mm², ESTIM d21: 46.91 ± 9.31 Olig2+p25- cells/mm²; sham d3: 92.33 ± 14.75
Olig2+p25- cells/mm², sham d5: 142.5 ± 7.55 Olig2+p25- cells/mm², sham d7: 108.1 ± 2.54
Olig2+p25- cells/mm², sham d10: 83.19 ± 28.21 Olig2+p25- cells/mm², sham d14: 59.31 ±
9.11 Olig2+p25- cells/mm², sham d21: 58.66 ± 14.39 Olig2+p25- cells/mm²; ****p<0.0001,
F(5,37)=7.224; Fig. 22 H), while Sidak’s multiple comparisons test revealed no significant
effect between sham and ESTIM animals. The amount of p25+ OLG in the NAGM
demonstrated no effect neither for the sham group (sham d3: 218.4 ± 22.01 p25+ cells/mm²,
sham d5: 229.1 ± 22.26 p25+ cells/mm², sham d7: 197.8 ± 43.09 p25+ cells/mm², sham d10:
146.9 ± 55.93 p25+ cells/mm², sham d14: 191.2 ± 16.91 p25+ cells/mm², sham d21: 190.6 ±
43.99 p25+ cells/mm², Fig. 22 I) nor for the ESTIM group (ESTIM d3: 258.8 ± 25.98 p25+
cells/mm², ESTIM d5: 230.5 ± 44.24 p25+ cells/mm², ESTIM d7: 192.0 ± 18.35 p25+
cells/mm², ESTIM d10: 196.0 ± 21.68 p25+ cells/mm², ESTIM d14: 235.6 ± 14.62 p25+
cells/mm², ESTIM d21: 206.0 ± 11.06 p25+ cells/mm², Fig. 22 I).
3.2.2.1.4 Proliferation of oligodendrocyte precursor cells and mature oligodendrocytes is unaffected by tACS
Bromodeoxyuridin (BrdU) was i.p.-injected into the rats immediately after induction of
focal cortical demyelination and then continuously every 12 hours for 5 days to label
proliferating cells in the tissue. By combining BrdU with the OLG marker Oilg2, we were able
to evaluate the effect of tACS on OLG proliferation in defined brain areas (DM lesion,
perilesional area, RM area and NAGM).
6.89 ± 1.01 Olig2+BrdU+ cells/mm² were found inside the demyelinated area of sham
animals after three days, and 11.11 ± 1.13 Olig2+BrdU+ cells/mm² in ESTIM animals (Fig. 23
A). The number of proliferating OLG remained unaffected after ESTIM treatment and did not
change significantly over the time course of 14 days (sham d5: 14.17 ± 5.87 Olig2+BrdU+
cells/mm², ESTIM d5: 18.81 ± 5.23 Olig2+BrdU+ cells/mm², sham d7: 9.56 ± 1.97 Olig2+BrdU+
cells/mm², ESTIM d7: 10.85 ± 1.58 Olig2+BrdU+ cells/mm², sham d10: 11.83 ± 2.72
Olig2+BrdU+ cells/mm², ESTIM d10: 9.92 ± 3.93 Olig2+BrdU+ cells/mm², sham d14: 20.77 ±
9.75 Olig2+BrdU+ cells/mm², ESTIM d14: 11.39 ± 5.02 Olig2+BrdU+ cells/mm², Fig. 23 A).
With 3.46 ± 0.57 Olig2+BrdU+ cells/mm² in the sham group and 2.9 ± 2.9 Olig2+BrdU+
cells/mm² in the ESTIM group at 3 d.p.i. as well as 4.53 ± 1.78 Olig2+BrdU+ cells/mm² in the
sham group and 6.53 ± 3.11 Olig2+BrdU+ cells/mm² in the ESTIM group at 5 d.p.i., the
density of OLG that had proliferated during the respective time frame in the perilesional area
did not differ significantly from the demyelinated lesion. No significant difference in BrdU
positive OLG between the two experimental groups was found.
Compared to the NAGM, the density of BrdU+ OLG in the RM area of sham animals
was significantly increased (sham *p<0.05, statistic not shown in Fig. 23). 11.86 ± 4.49

3. Results
~ 84 ~
Olig2+BrdU+ cells/mm² were found in the RM area of ESTIM animals after seven days, which
remained stable over time (ESTIM d10: 9.08 ± 2.64 Olig2+BrdU+ cells/mm², ESTIM d14: 7.09
± 3.22 Olig2+BrdU+ cells/mm², ESTIM d21: 5.05 ± 1.71 Olig2+BrdU+ cells/mm², Fig. 23 C).
Similarly, the number of proliferating OLG in the RM area of sham treated animals did not
change over the time course either (sham d7: 12.65 ± 6.65 Olig2+BrdU+ cells/mm², sham
d10: 5.42 ± 1.7 Olig2+BrdU+ cells/mm², sham d14: 14.65 ± 2.62 Olig2+BrdU+ cells/mm², sham
d21: 15.84 ± 3.74 Olig2+BrdU+ cells/mm², Fig. 23 C).
Three days after lesion induction, 2.13 ± 0.83 Olig2+BrdU+ cells/mm² were found in
the NAGM of sham treated animals and 3.08 ± 1.56 Olig2+BrdU+ cells/mm² of ESTIM treated
animals (Fig. 23 D). The number of proliferating OLG in both experimental groups remained
stable over time (sham d5: 4.25 ± 1.3 Olig2+BrdU+ cells/mm², sham d7: 3.68 ± 1.4
Olig2+BrdU+ cells/mm², sham d10: 2.16 ± 0.48 Olig2+BrdU+ cells/mm², sham d14: 9.04 ± 1.02
Olig2+BrdU+ cells/mm², sham d21: 7.49 ± 2.05 Olig2+BrdU+ cells/mm²; ESTIM d5: 6.24 ± 3.14
Olig2+BrdU+ cells/mm², ESTIM d7: 4.33 ± 0.81 Olig2+BrdU+ cells/mm², ESTIM d10: 8.33 ± 1.1
Olig2+BrdU+ cells/mm², ESTIM d14: 4.6 ± 1.98 Olig2+BrdU+ cells/mm², ESTIM d21: 4.54 ±
2.61 Olig2+BrdU+ cells/mm², Fig. 23 D). However, a trend was found if comparing both
experimental groups at 10 d.p.i. (p=0.056), demonstrating a minor increase in the
Olig2+BrdU+ cells in the ESTIM group.

3. Results
~ 85 ~
Figure 23: Numbers of proliferating OLG are unaltered after ESTIM Quantification of proliferating OLG in the DM lesion, the perilesion, the RM area and the NAGM of
sham and ESTIM treated rats by immunohistochemical stainings against BrdU and Olig2. Cell counts
of proliferating OLG in A the DM lesion (sham n=2-3, ESTIM n=3-5), B the perilesional area (sham
n=2-3, ESTIM n=3), C the RM area (sham n=4, ESTIM n=4) and D the NAGM (sham n=3-4, ESTIM
n=3-5) yielded no significant effect after electrical stimulation, as indicated by Two-way ANOVA
followed by Sidak’s multiple comparisons test. Data are shown as mean ± SEM.
3.2.2.2 Chronic Cuprizone model
The chronic Cuprizone model (continuous Cuprizone administration for 13 weeks)
was used to induce a toxic demyelination with impaired remyelination in the CC of Bl6/J
mice. Transcranial alternating currents were applied to modulate the remyelination of the
demyelinated area by targeting OPC and mature OLG. The animals were separated into four
groups and stimulated for either five days (5d ESTIM) or ten days (10d ESTIM). Sham
stimulated animals served as controls (5d sham, 10d sham). The medial and lateral parts of
the CC were analyzed separately with regard to the different OLG populations and the extent
of remyelination.
3.2.2.2.1 DM score unaffected by either 5d or 10d ESTIM
In contrast to the commonly used Cuprizone model (5 weeks of Cuprizone feeding)
which demonstrated a significant remyelination of the CC within 5 days after Cuprizone
withdrawal, the chronic Cuprizone model showed an impaired remyelination for at least 6
weeks (Harsan et al., 2008; Hussain et al., 2013). In the following experiment, LFB-PAS

3. Results
~ 86 ~
histochemical stainings were used to quantify the extent of de- and remyelination (dotted
line) in the CC using the aforementioned a DM score (table 11, Fig. 24 A).
Figure 24: The extent of remyelination of ESTIM treated animals does not differ from sham
treated animals
Evaluation of the extent of de- and remyelination in the CC of sham and ESTIM treated mice
after 5d (sham n=8, ESTIM n=8) and 10d (sham n=7, ESTIM n=7) of stimulation. A Detailed view of
LFB-PAS stainings of the CC after 5d and 10d of ESTIM. The dotted line indicates the previously
demyelinated and now in part remyelinated area (scale bar: 500 µm). B Semi-quantitative analysis of
the medial and C lateral area of the CC of 5d sham/ESTIM (n=8/n=8) and 10d sham/ESTIM (n=7/n=7)
mice. Remyelination is more extensive in the medial area. ESTIM animals demonstrated significantly
more remyelination of the lateral CC after 10 days of ESTIM compared to 5 days of ESTIM (**p<0.01,
Mann-Whitney test). Data are shown as mean ± SEM.
The semi-quantitative analysis revealed a more severe demyelination in the lateral
part of the CC (5d sham lateral: 2.38 ± 0.25, 5d ESTIM lateral: 3.0 ± 0, 10d sham lateral:
1.74 ± 0.21, 10d ESTIM lateral: 2.31 ± 0.16, Fig. 24 C) compared to the medial area for all
experimental groups and time points (5d sham medial: 0.75 ± 0.25, 5d ESTIM medial: 0.5 ±
0.19, 10d sham medial: 0.71 ± 0.18, 10d ESTIM medial: 0.63 ± 0.38, Fig. 24 B). Due to the
overall low DM score in the medial CC, no effects between the treatment groups and time
points were observed. If comparing the lateral area of sham and ESTIM treated mice, only

3. Results
~ 87 ~
the 10d ESTIM group demonstrated a significantly lower DM score compared to 5d ESTIM
animals (**p<0.01, Fig. 24 C).
3.2.2.2.2 OPC and mature OLG populations in the corpus callosum remain unchanged after ESTIM
To further evaluate the possible impact of ESTIM on remyelination, the OPC and
mature OLG populations in the corpus callosum were determined. For this purpose,
immunohistochemical stainings for the transcription factor Olig2 and the myelin-associated
neurite growth inhibitor NogoA were quantified. Cells positive for Olig2 but negative for
NogoA were considered OPC, while cells positive for NogoA were considered mature OLG
(Fig. 25 A, B). Furthermore, all animals were i.p.-injected with the proliferation marker BrdU
directly after Cuprizone withdrawal and every 12 hours for two consecutive days, to evaluate
effects of ESTIM on cell proliferation.
Figure 25: ESTIM did not change the density of OPC after chronic demyelination
Evaluation of the OPC population in the medial and lateral parts of the CC after either 5d or 10d sham
or ESTIM treatment. A Olig2+NogoA- OPC in the medial and B lateral part of the CC of 5d sham (n=8)
and 5d ESTIM (n=8) treated mice or 10d sham (n=7) and 10d ESTIM (n=7) treated mice. While no
significant difference in the OPC population was found between sham and ESTIM animals in neither
the medial nor the lateral CC, sham animals demonstrated a significant decrease of OPC in the lateral
CC after 10d (*p<0.05, Two-way ANOVA followed by Sidak’s multiple comparisons test). Data are
shown as mean ± SEM.
21.69 ± 7.2 Olig2+NogoA- cells/mm² were detected in the medial area of the CC of 5d
sham treated animals, which did not differ from 5d ESTIM animals (16.5 ± 4.55 Olig2+NogoA-
cells/mm², Fig. 25 A). Similarly, no effect was found after ten days of either sham or electrical
stimulation (10d sham medial: 9.55 ± 4.88 Olig2+NogoA- cells/mm², 10d ESTIM medial: 10.5
± 4.96 Olig2+NogoA- cells/mm², Fig. 25 A). A different picture was observed in the lateral CC.
The Two-way ANOVA analysis followed by Sidak’s multiple comparisons test revealed a
significant decrease of Olig2+NogoA- cells in sham animals after 10d compared to 5d (5d

3. Results
~ 88 ~
sham lateral: 20.58 ± 5.99 Olig2+NogoA- cells/mm², 10d sham lateral: 5.06 ± 1.77
Olig2+NogoA- cells/mm², *p<0.05, Fig. 25 B). The OPC number in ESTIM mice did not differ
either from sham animals or between time points (5d ESTIM lateral: 12.3 ± 4.18
Olig2+NogoA- cells/mm², 10d ESTIM lateral: 5.11 ± 2.76 Olig2+NogoA- cells/mm², Fig. 25 B).
Higher number of NogoA+ mature OLG than OPC was found in the CC of sham and
ESTIM treated mice. However, no effect was discovered after five and ten days of ESTIM
compared to sham treated mice in the medial area and lateral area of the CC (5d sham
medial: 857.5 ± 75.19 NogoA+ cells/mm², 5d ESTIM medial: 777.9 ± 89.85 NogoA+
cells/mm²; 10d sham medial: 782.7 ± 78.81 NogoA+ cells/mm², 10d ESTIM medial: 664.2 ±
78.66 NogoA+ cells/mm²; 5d sham lateral: 567.4 ± 93.17 NogoA+ cells/mm², 5d ESTIM
lateral: 447.0 ± 49.22 NogoA+ cells/mm², p=0.391; 10d sham lateral: 572.4 ± 45.09 NogoA+
cells/mm², 10d ESTIM lateral: 433.2 ± 59.07 NogoA+ cells/mm², Fig. 26 A, B).
Figure 26: Numbers of NogoA+ cells are not altered by ESTIM
Quantification of immunohistochemical stainings of the CC of sham (5d n=8, 10d n=8) and ESTIM (5d
n=7, 10d n=7) treated mice with antibodies against NogoA. NogoA+ cells were considered mature
OLG. No significant difference between the sham and ESTIM treated mice was observed after five or
ten days in A the medial or B lateral area of the CC (Two-way ANOVA followed by Sidak’s multiple
comparisons test). Data are shown as mean ± SEM.
Only very few Olig2+NogoA- OPC were co-labeled with BrdU, indicating recent
proliferation. After five days, one animal of the sham group showed BrdU+ OPC in the medial
as well as lateral area of the CC, while no BrdU+ OPC were found in any 5d ESTIM animals
(5d sham medial: 0.27 Olig2+BrdU+NogoA- cells/mm², 5d ESTIM medial: 0.0
Olig2+BrdU+NogoA- cells/mm²; 5d sham lateral: 0.37 Olig2+BrdU+NogoA- cells/mm², 5d
ESTIM lateral: 0.0 Olig2+BrdU+NogoA- cells/mm²; Fig. 27 A, B). However, after ten days only
two animals of the ESTIM group and none of the sham group demonstrated BrdU+ OPC in
the medial area (10d sham medial: 0.0 Olig2+BrdU+NogoA- cells/mm², 10d ESTIM medial:
2.18 ± 1.71 Olig2+BrdU+NogoA- cells/mm², Fig. 27 A) and one animal of each group showed

3. Results
~ 89 ~
BrdU+ OPC in the lateral area (10d sham lateral: 0.23 Olig2+BrdU+NogoA- cells/mm², 10d
ESTIM lateral: 0.50 Olig2+BrdU+NogoA- cells/mm², Fig. 27 B).
Figure 27: Overall low number of proliferating OPC after 5 and 10 days Immunohistochemical stainings against Olig2, NogoA and BrdU were used to quantify the amount of
proliferating OPC in the CC of sham (5d n=8, 10d n=8) or ESTIM (5d n=7, 10d n=7) treated mice. Very
few Olig2+NogoA- cells co-labeled with BrdU were found in A the medial and B the lateral CC at both
time points. Data are shown as mean ± SEM.
In contrast to the BrdU+ OPC population, a relatively high number of BrdU+NogoA+
cells were observed (Fig. 28 A, B). Nevertheless, no significant difference in the amount of
BrdU+ mature OLG was discovered in sham compared to ESTIM mice after 5d and 10d in the
medial area (5d sham medial: 28.02 ± 3.65 BrdU+NogoA+ cells/mm², 5d ESTIM medial: 18.43
± 5.33 BrdU+NogoA+ cells/mm²; 10d sham medial: 32.26 ± 9.33 BrdU+NogoA+ cells/mm², 10d
ESTIM medial: 20.66 ± 8.63 BrdU+NogoA+ cells/mm²) and in the lateral area of the CC (5d
sham lateral: 23.31 ± 2.21 BrdU+NogoA+ cells/mm², 5d ESTIM lateral: 12.55 ± 4.09
BrdU+NogoA+ cells/mm², 10d sham lateral: 23.14 ± 3.31 BrdU+NogoA+ cells/mm², 10d ESTIM
lateral: 13.66 ± 3.73 BrdU+NogoA+ cells/mm²; Fig. 28 A, B).
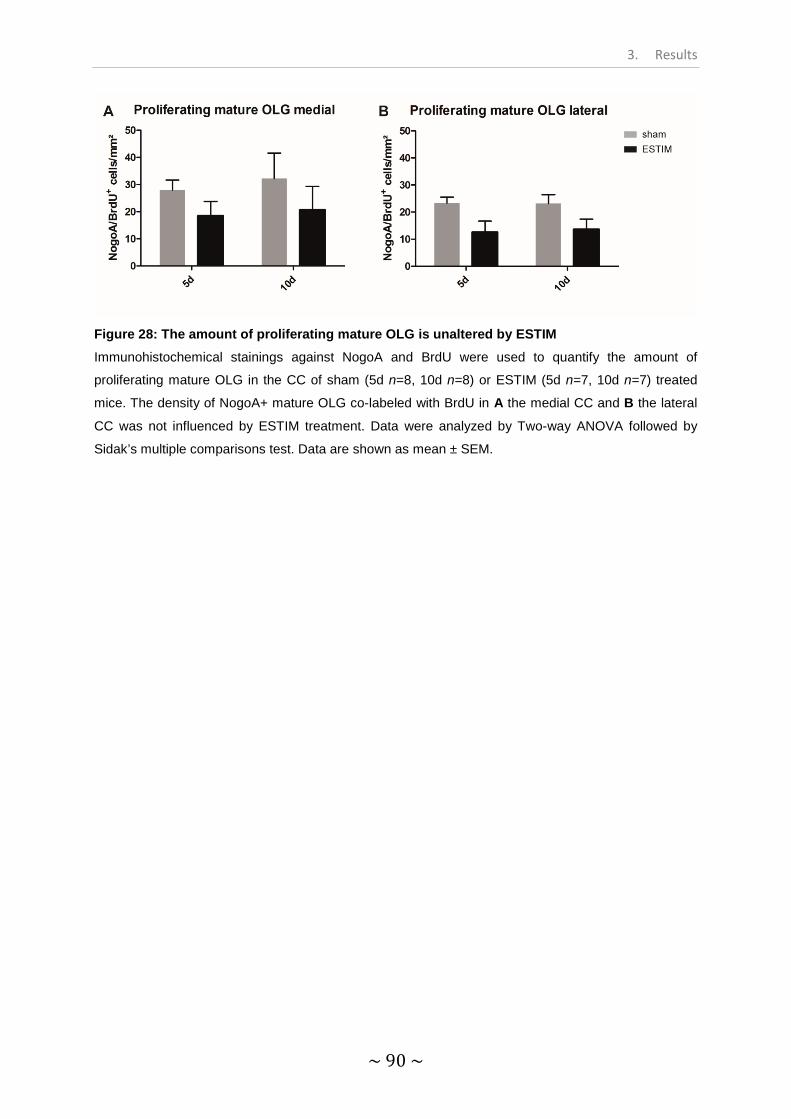
3. Results
~ 90 ~
Figure 28: The amount of proliferating mature OLG is unaltered by ESTIM
Immunohistochemical stainings against NogoA and BrdU were used to quantify the amount of
proliferating mature OLG in the CC of sham (5d n=8, 10d n=8) or ESTIM (5d n=7, 10d n=7) treated
mice. The density of NogoA+ mature OLG co-labeled with BrdU in A the medial CC and B the lateral
CC was not influenced by ESTIM treatment. Data were analyzed by Two-way ANOVA followed by
Sidak’s multiple comparisons test. Data are shown as mean ± SEM.

3. Results
~ 91 ~
Part III – Results
Transcranial electrical stimulation in healthy human subjects

3. Results
~ 92 ~
3.3 Transcranial electrical stimulation in healthy human subjects
The following experiments were conducted to evaluate the effect of tACS on motor
behavior of healthy human subjects and are part of a clinical study (Kunz et al., 2016). tACS
was applied with various eTBS patterns to healthy human subjects in a double-blinded
crossover study. The amplitudes of muscle evoked potentials (MEP) were measured twice
before and at 0, 10, 20, 30, 40, 50 and 60 min after the stimulation. Sham stimulation served
as a control. The experiments were separated into two parts. In the first part, three different
eTBS protocols (eiTBS, eimTBS, ecTBS) and one sham stimulation were delivered to fifteen
healthy subjects (Fig. 8). In the second part, three altered ecTBS protocols were delivered to
ten healthy subjects: 5 mA ecTBS with sinusoidal bursts of 5 ms duration, 10 mA ecTBS with
sinusoidal bursts of 1 ms and 10 mA ecTBS with sinusoidal bursts of 5 ms (Fig. 8). Each
stimulation was performed on a different day with at least one week in between.
3.3.1 MEP amplitudes after eTBS did not differ from MEP after sham treatment
Four different stimulation protocols were performed during the first part of the study:
eiTBS, eimTBS, ecTBS and sham. MEP amplitudes were recorded to evaluate changes in
motor behavior. Two MEP measurements were conducted before each stimulation and the
mean was used to establish a baseline for each session, respectively. The MEP baseline of
every subject was pooled (average baseline MEP: 1.01 ± 0.2 mV) and each dataset was
normalized to the respective baseline.
The normalized MEP amplitudes of eiTBS decreased significantly over time (eiTBS 0
min: 78.89 ± 12.03%, eiTBS 10 min: 73.49 ± 11.45%, eiTBS 20 min: 88.54 ± 14.75%, eiTBS
30 min: 72.17 ± 11.04%, eiTBS 40 min: 73.50 ± 7.09%, eiTBS 50 min: 82.25 ± 10.11%,
eiTBS 60 min: 64.45 ± 8.41%, **p<0.01, Fig. 29 A). While eimTBS depicted only a slight
decrease in MEP amplitudes (eimTBS 0 min: 104.6 ± 9.5%, eimTBS 10 min: 76.89 ±
10.92%, eimTBS 20 min: 91.86 ± 18.16%, eimTBS 30 min: 95.84 ± 21.67%, eimTBS 40 min:
80.56 ± 14.22%, eimTBS 50 min: 93.88 ± 14.96%, eimTBS 60 min: 95.87 ± 15.78%,
p=0.082, Fig. 29 B), an even stronger decrease of MEP size was observed for ecTBS treated
subjects (ecTBS 0 min: 100.3 ± 9.93%, ecTBS 10 min: 71.63 ± 10.42%, ecTBS 20 min:
76.93 ± 15.33%, ecTBS 30 min: 87.62 ± 10.25%, ecTBS 40 min: 71.37 ± 6.82%, ecTBS 50
min: 68.29 ± 8.98%, ecTBS 60 min: 62.36 ± 8.04%, ***p<0.001, Fig. 29 C). However, a
significant drop of MEP amplitudes was also registered after sham stimulation (sham 0 min:
108.8 ± 11.52%, sham 10 min: 108.4 ± 20.22%, sham 20 min: 87.19 ± 13.27%, sham 30 min:
87.05 ± 14.9%, sham 40 min: 100.7 ± 15.01%, sham 50 min: 74.16 ± 13.01%, sham 60 min:
90.34 ± 22.22%, *p<0.05, Fig. 29 A-C).

3. Results
~ 93 ~
Figure 29: MEP amplitudes after eiTBS, eimTBS and ecTBS did not differ from sham MEP responses 0, 10, 20, 30, 40, 50 and 60 min after stimulation with A eiTBS, B eimTBS and C
ecTBS. Data (n=15) was normalized to the respective baseline. MEP amplitudes of eiTBS (**p<0.01),
ecTBS (***p<0.001) and sham (*p<0.05) stimulated participants decreased significantly over the time
course compared to baseline. Repeated measurements Two-Way ANOVA was performed to compare
all eTBS protocols with each other and to compare each eTBS protocol to sham. No effect of TYPE of
stimulation was observed by comparing eiTBS, eimTBS and ecTBS (F(3,392)=0.76, p>0.05), nor by
comparing each eTBS protocol to sham (eiTBS F(1,196)=1.34; p>0.05, eimTBS F(1,196)=0.02;
p>0.05, ecTBS F(1,196)=1.3; p>0.05). Only ecTBS demonstrated a significant effect on TIME
compared to sham (F(1,196)=2.853; **p<0.01). Kruskal-Wallis test followed by Dunn’s multiple
comparison test was performed to compare each time point to baseline. Data are shown as means ±
SEM. This Figure is part of a clinical study, published in Frontiers in Human Neuroscience (Kunz et al.
2017).

3. Results
~ 94 ~
Moreover, no significant effect on MEP amplitudes was observed by comparing all
four stimulation protocols (repeated measurements Two-Way ANOVA (TYPE):
F(3,392)=0.76, p>0.05). Similarly, no effect of TYPE was discovered by comparing each
eTBS protocol with sham (repeated measurements Two-Way ANOVA (TYPE): eiTBS
F(1,196)=1.34; p>0.05, eimTBS F(1,196)=0.02; p>0.05, ecTBS F(1,196)=1.3; p>0.05). If
comparing ecTBS with sham, a significant effect of TIME was found, indicating a strong
decrease of MEP amplitudes over time (F(1,196)=2.853; **p<0.01). Common to eiTBS and
ecTBS, but not eimTBS or sham, is a significant decrease of MEP size within the first ten
minutes after stimulation compared to baseline (eiTBS/ecTBS 10 min: *p<0.05).
3.3.2 No significant effect on MEP amplitudes after stimulation with altered ecTBS protocols
The second part of the study consisted of three altered ecTBS protocols. Due to the
higher intensities used in this part, a sensation questionnaire was introduced, which all ten
volunteers had to fill out after each session. A mild tingling sensation was reported by five
participants and a medium intensity tingling sensation was reported by one participant. One
further subject experienced a mildly uncomfortable sensation during the 5 mA 5 ms burst
duration ecTBS protocol, but not during the 10 mA ecTBS protocols. The sensation of
phosphenes was reported only by one participant during the 10 mA ecTBS protocol with 1
ms sinusoidal burst duration.
The average baseline amplitude was 1.01 mV ± 0.21 mV, demonstrating relatively
stable baseline MEP, similarly to the first part of the study. The normalized MEP values of
the 5 mA ecTBS protocol with 5 ms sinusoidal burst duration did not differ significantly from
the baseline at any time point (5 mA 5 ms 0 min: 96.9 ± 7.88%, 5 mA 5 ms 10 min: 87.58 ±
12.83%, 5 mA 5 ms 20 min: 92.98 ± 18.41%, 5 mA 5 ms 30 min: 114.7 ± 26.29%, 5 mA 5 ms
40 min: 84.62 ± 12.84%, 5 mA 5 ms 50 min: 125.7 ± 25.89%, 5 mA 5 ms 60 min: 97.97 ±
18.15%, Fig. 30). The same situation was observed for the 10 mA 1 ms ecTBS protocol (10
mA 1 ms 0 min: 98.02 ± 12.86%, 10 mA 1 ms 10 min: 77.94 ± 9.24%, 10 mA 1 ms 20 min:
97.83 ± 9.8%, 10 mA 1 ms 30 min: 110.5 ± 20.91%, 10 mA 1 ms 40 min: 99.71 ± 13.88%, 10
mA 1 ms 50 min: 110.8 ± 13.0%, 10 mA 1 ms 60 min: 108.1 ± 19.66%) and the 10 mA 5 ms
ecTBS protocol (10 mA 5 ms 0 min: 99.87 ± 17.42%, 10 mA 5 ms 10 min: 85.93 ± 16.02%,
10 mA 5 ms 20 min: 105.7 ± 24.64%, 10 mA 5 ms 30 min: 84.88 ± 15.49%, 10 mA 5 ms 40
min: 82.11 ± 16.14%, 10 mA 5 ms 50 min: 77.7 ± 17.5%, 10 mA 5 ms 60 min: 102.2 ±
25.02%, Fig. 30). Furthermore, no significant effect could be demonstrated by comparing all
three ecTBS protocols for neither TYPE of stimulation (F(2,189)=0.17, p>0.05) nor TIME
(F(7,189)=0.95, p>0.05).

3. Results
~ 95 ~
As depicted in Figure 31, the individual MEP responses were highly variable for every
used stimulation protocol, including sham. Thus, no clear after-effect was found for any
stimulation protocol.
Figure 30: MEP responses remain unchanged after stimulation with altered ecTBS protocols MEP responses 0, 10, 20, 30, 40, 50 and 60 min after stimulation with 5 mA ecTBS with 5 ms
sinusoidal pulse duration, 10 mA ecTBS with 1 ms pulse duration and 10 mA ecTBS with 5 ms pulse
duration. Data (n=10) were normalized to the respective baseline. No significant effect on MEP size
was observed for any altered ecTBS protocol compared to baseline. Furthermore, no significant effect
on TYPE (F(2,189)=0.17, p>0.05) of stimulation or on TIME (F(7,189)=0.95, p>0.05) could be
observed by comparing all three protocols with repeated measures Two-Way ANOVA. Friedman’s test
followed by Dunn’s multiple comparison test was performed to compare each time point to baseline.
Data are shown as means ± SEM. This Figure is part of a clinical study, published in Frontiers in
Human Neuroscience (Kunz et al. 2017).
Figure 31: High interindividual variability of MEP amplitudes following eTBS and sham
stimulation Individual MEP responses of each subject participating in A the first study part and B the second study
part, normalized to baseline. A high interindividual variability was registered for all stimulation
protocols, including sham. This Figure is part of a clinical study, published in Frontiers in Human
Neuroscience (Kunz et al. 2017).

4. Discussion
~ 96 ~
Part I – Discussion
Influence of autoimmune inflammation on remyelination in Cuprizone-induced demyelination

4. Discussion
~ 97 ~
4.1 Influence of autoimmune inflammation on remyelination in Cuprizone-induced demyelination
4.1.1 Increased infiltration of the CNS by immune competent cells in Cup-EAE mice
Multiple Sclerosis is a chronic, inflammatory disease featuring demyelinated lesions in
the gray and white matter (Noseworthy et al., 2000; Stadelmann et al., 2011). Infiltrating
CD4+ and CD8+ T cells as well as B cells are key players in mediating the inflammatory
cascade during MS, leading to primary demyelination and neuroaxonal degeneration
(Noseworthy et al., 2000; Popescu and Lucchinetti, 2012; Weiner, 2004). However, it was
recently discussed whether neurodegenerative events such as oligodendrocyte death,
microglia activation as well as axonal damage, and not the adaptive immune system, are the
initial factors in driving MS lesion formation (Barnett and Prineas, 2004). Nevertheless, the
most common MS animal models were only able to mirror certain aspects of this disease,
like infiltration of immune competent cells followed by demyelinated lesions, which can
mainly be found in the spinal cord (EAE; Mendel et al., 1995) or toxin induced CNS
demyelination with sparse involvement of inflammatory infiltrates (Cuprizone; injection of
ethidiumbromide/lysolecithin; Jeffery and Blakemore, 1995; Matsushima and Morell, 2001).
Interestingly, the immunization of Cuprizone fed animals with MOG35-55 peptide led to
inflammatory, demyelinated lesions in the brain, as was demonstrated by Boretius and
colleagues in 2012 and subsequently by Scheld et al. in 2016 (Boretius et al., 2012; Scheld
et al., 2016).
In line with this, we showed that the combination of Cuprizone administration with
EAE induction led to a strong infiltration of the CNS with T cells, NK cells, B cells,
granulocytes and inflammatory monocytes accompanied by demyelination of the corpus
callosum (3.1.1, 3.1.2). It is widely accepted that the adaptive immune system plays a major
role during MS, and the upregulation of T and B cells is central to most EAE models (Mendel
et al., 1995; Weiner, 2004). B cells, for instance, play a multifactorial role in auto-immune
diseases: they can secrete antibodies in the form of plasma cells and serve as antigen
presenting cells, thus exerting immune modulatory purposes (Mizoguchi and Bhan, 2006).
According to the cytokine expression pattern, B cells can be separated into two subsets:
“effector” B cells, which express pro-inflammatory cytokines like TNFα, IFNγ, IL-6 or IL-12
and “regulatory” B cells, which express anti-inflammatory cytokines like IL-10 or transforming
growth factor-β (TGFβ-1)(Lund, 2008; Mizoguchi and Bhan, 2006; Wolf et al., 1996).
Therefore, raised levels of B cells in autoimmune diseases can exert different effects on the
immune response, depending on the B cell subset.
Besides the adaptive immune system, growing evidence for an involvement of the
innate immune system in MS can be found (e.g. Weiner, 2008). It was shown that agents of

4. Discussion
~ 98 ~
the innate immune system with immunomodulatory properties like NK cells, granulocytes and
inflammatory monocytes could potentially influence the disease course of MS as well as EAE
(Gandhi et al., 2010). NK cells, for instance, can be divided into two subsets: CD56high and
CD56low. The CD56low subsets seems to exert mainly cytotoxic functions, while CD56high
secretes anti-inflammatory cytokines and therefore might perform a regulatory function
(Cooper et al., 2001). Granulocytes, on the other hand, act as phagocytes in response to
inflammation. Neutrophil granulocytes are activated by TH17 cells expressing molecules like
granulocyte-colony stimulating factor or the ELR+ CXC chemokine CXCL1 and were found to
infiltrate the CNS during EAE (Pelletier et al., 2010; Rumble et al., 2015). Inflammatory
monocytes, which subsequently can differentiate into antigen presenting cells like dendritic
cells or macrophages, represent a further factor of the innate immune system that may
impact the disease course of MS or EAE by secretion of pro-inflammatory cytokines like IFNγ
or TNFα or by phagocytosis of myelin (Huang et al., 1999). Furthermore, the increase of
inflammatory monocytes in the brain may indicate that at least a part of the antigen
presenting cells mediating the immune response in the Cup-EAE model might be
represented by macrophages. A similar role is played by activated microglia, which also
serve as antigen presenting cells, clear myelin debris by phagocytosis and mediate the
immune response by expression of pro-inflammatory cytokines and enzymes like IL-1β and
inducible nitric oxide synthase (iNOS)(Gray et al., 2008; Mosley and Cuzner, 1996). As it was
shown in the present study, the microglia population in the CNS of Cuprizone animals was
not further increased after immunization with MOG35-55 peptide (3.1.2). This was expected,
since in the Cuprizone model, microglia are responsible for the clearance of myelin debris
and are therefore fully activated (Hiremath et al., 1998). Hence, it can be assumed that the
induction of EAE and subsequent breach of the BBB would not increase the activation of
microglia any further.
The increased infiltration of not only T and B cell populations in the Cup-EAE model
but also of important players of the innate immune system demonstrates a successful
inflammatory signaling cascade and the infiltration of immune competent cells, which
correlates with reports in MS patients (Compston and Coles, 2008).
4.1.2 Damaging and neuroprotective effects of autoimmune inflammation
As demonstrated in the doctoral thesis of A. Escher, the infiltration of myelin-specific
T cells into the CNS of cuprizone animals by immunization with MOG35-55 peptide led to
increased expression of the pro-inflammatory cytokine IFNγ as well as raised levels of the
pro-inflammatory molecule iNOS (Escher, 2008). IFNγ is expressed by inflammatory cells like
autoreactive CD4+ TH1 T cells, NK cells or macrophages and activates antigen presenting
cells in the CNS, represented by microglia, macrophages and astrocytes (Cao et al., 2015;

4. Discussion
~ 99 ~
Martins et al., 2011). Activated macrophages and microglia, in turn, produce reactive oxygen
species by expressing iNOS, which are highly toxic for most pathogenic microorganisms
(Dale et al., 2008; Nathan et al., 1983). Increased levels of reactive oxygen species however,
can lead to lipid peroxidation and axonal damage (Nathan and Ding, 2010; di Penta et al.,
2013). Indeed, an increase in APP+ axons in Cuprizone mice immunized with MOG35-55
peptide was detected in the lateral CC, indicating impaired axonal transport and therefore
increased axonal damage compared to Cuprizone only treated mice (3.1.5).
On the other hand, it was speculated that an inflammatory milieu might be beneficial
in terms of neuroprotection and remyelination (Hohlfeld, 2007). It was discovered that, upon
activation, immune cells can secrete neurotrophic factors like BDNF, neurotrophin-3, LIF or
glial cell line-derived neurotrophic factors like neurturin (Kerschensteiner et al., 1999, 2003;
Moalem et al., 2000). BDNF, for instance, is associated with enhanced neuron and immune
cell survival (Kerschensteiner et al., 1999) and can be found in inflammatory infiltrates in the
brains of MS patients (Stadelmann et al., 2002). Neurotrophin-3 and LIF were shown to
support oligodendrocytes, neurotrophin-3 by promoting the differentiation from OPC into
mature oligodendrocytes (Cohen et al., 1996) and LIF by increasing oligodendrocyte survival
in EAE (Butzkueven et al., 2006). Furthermore, neurturin might represent a signaling
pathway by which immune cells are able to control the secretion of TNFα (Vargas-Leal et al.,
2005). Taken together, it appears that inflammation might not only exert detrimental but also
neuroprotective effects. As mentioned at the beginning of this thesis, the early stages of MS
demonstrate a widespread inflammation but also the ability to remyelinate demyelinated
lesions, while during the progressive stage of MS, both the inflammatory milieu in the CNS
as well as the remyelination capacity of the CNS decreases (Goldschmidt et al., 2009;
Kutzelnigg et al., 2005; Serafini et al., 2004).
4.1.3 Influence of adaptive inflammation on oligodendrocyte populations and remyelination
In contrast to the discussed neuroprotective effects, the infiltration of peripheral
immune cells in Cuprizone treated animals by EAE induction did not lead to increased
numbers of OPC or myelin producing oligodendrocytes, or to increased remyelination, as
indicated by Olig2/NogoA immunohistochemical stainings (3.1.3), PLP mRNA in situ
hybridization as well as LFB-PAS histochemical stainings (3.1.4), respectively. Furthermore,
electron microscopic analysis of the corpus callosum of Cuprizone and Cuprizone-EAE
animals revealed no significant difference in the density of myelinated axons between the
groups, neither after 4.5 weeks of Cuprizone administration nor after five days on a
Cuprizone-free diet (3.1.6). Regarding the quantification of oligodendrocyte populations by
Olig2/NogoA immunohistochemical stainings, it seemed that the remyelination process might
4. Discussion
~ 100 ~
even be slightly impaired after immunization with MOG-peptide. Although no significant effect
on the OPC number (Olig2+NogoA- cells) could be found by directly comparing the two
experimental groups, the Cuprizone group depicted significantly less OPC in the lateral CC
after five days on cuprizone-free diet. This could hint at an impairment or delay of OPC
differentiation by adaptive inflammatory infiltrates. In line with this, Lin and colleagues
demonstrated in 2006 that IFNγ altered the time course of OPC recruitment into
demyelinated lesions in Cuprizone treated mice as well as reduced the number of
oligodendrocytes and impaired the remyelination in EAE animals (Lin et al., 2006). In
addition, a recent study showed that EAE induced inflammation results in a downregulation
of the OPC differentiating agent thyroid hormone and subsequent impairment of OPC
differentiation (Fernández et al., 2016). However, Cup-EAE animals showed only a trend
toward a decreased number of mature oligodendrocytes (NogoA+ cells) in the medial corpus
callosum compared to Cup animals but no significant effect. Therefore, according to
Olig2/NogoA immunohistochemical stainings, a slight delay of OPC differentiation due to the
inflammatory milieu in Cup-EAE mice remains possible.
On the other hand, the present study did not discover any differences in the amount
of PLP mRNA+ oligodendrocytes after five days on a Cuprizone-free diet between the two
experimental groups. One reason for this discrepancy could be the staining technique.
Kuhlmann and colleagues demonstrated in 2007 that in EAE lesions, fewer PLP mRNA+
oligodendrocytes were labeled compared to NogoA+ cells (Kuhlmann et al., 2007). It was
suggested that PLP mRNA expression might be more sensitive to autoimmune-mediated
demyelination than the expression of proteins like NogoA (Kuhlmann et al., 2007; Morell et
al., 1998). In this case, the PLP mRNA in situ hybridization might be the more reliable
technique. Furthermore, the data obtained from semi-quantitative demyelination analysis of
LFB-PAS stainings as well as the analysis of the density of myelinated axons by electron
microscopy supports the notion that a myelin-peptide-specific autoimmune response does
not influence the degree of remyelination in our model of CNS demyelination. In fact,
demyelination itself seems to be a sufficient trigger for remyelination, since both experimental
groups displayed a similar increase in myelinated axons after five days on Cuprizone-free
chow.
We demonstrated here that the experimental Cup-EAE model is able to combine
major hallmarks of MS in one model: demyelinated lesions in the brain, the infiltration of
peripheral immune cells and axonal damage. Furthermore, we were able to verify that the
infiltration of adaptive immune cells does neither substantially impair nor ameliorate the
remyelination process of the demyelinated lesion. Finally, the Cup-EAE model proved to be a
legitimate tool to study remyelination in the presence of peripherally activated CNS-
autoreactive T cells.

4. Discussion
~ 101 ~
Part II – Discussion
Influence of transcranial alternating current stimulation on spontaneous remyelination in in vitro and in vivo models
4. Discussion
~ 102 ~
4.2 Influence of transcranial alternating current stimulation on spontaneous remyelination in in vitro and in vivo models
Electrical stimulation might serve as a promising tool to improve OPC differentiation,
remyelination and nerve regeneration, as indicated by recent in vitro and in vivo studies
(Gary et al., 2012; Huang et al., 2013; Ishibashi et al., 2006; Sherafat et al., 2012). However,
most in vivo studies were conducted on exposed nerves of the PNS (Al-Majed et al., 2000;
Huang et al., 2013; McLean et al., 2014; Wan et al., 2010) and only very few studies
engaged in, mostly invasive, electrical stimulation of the CNS (Jahanshahi et al., 2013;
Morimoto et al., 2011; Sherafat et al., 2012). The aim of the second part of this thesis was to
apply electrical currents in a safe and non-invasive way to two different animal models of
CNS demyelination and to provoke increased OPC proliferation and differentiation as well as
improved remyelination. For this purpose, the safety and efficiency of the stimulation protocol
obtained from published in vitro studies (Gary et al., 2012; Ishibashi et al., 2006) was initially
tested in oligodendrocyte and mixed cortical cultures.
4.2.1 Electrical stimulation in oligodendrocyte and mixed cortical cultures
4.2.1.1 Safe application of 10 mA alternating currents
Gary and colleagues demonstrated in 2012 that the electrical stimulation protocol of
10 mA, 10 Hz biphasic stimulation applied to mixed cortical cultures (dorsal root ganglion
[DRG] neurons, oligodendrocytes, astrocytes) for one hour daily over seven days led to
increased numbers of MBP+ oligodendrocytes (Gary et al., 2012). Furthermore, the group
showed that this effect was reversed by addition of the voltage-dependent sodium channel
inhibitor tetrodotoxin (TTX), therefore indicating a dependency on the presence of neurons.
The initial experiments in the second part of this thesis were performed on oligodendrocyte
cultures to verify the safe and harmless application of 10 mA, 10 Hz biphasic electrical
currents. Indeed, the number of oligodendrocytes in ESTIM cultures did not differ from
untreated controls, as indicated by O4 immunocytochemical stainings (3.2.1.1). Both
treatment groups depicted an increase in O4 MBP double positive cells over the time course
of four days, beginning at day two. The electrical stimulation of oligodendrocytes did not
increase the expression of MBP in the absence of neurons, which was expected due to the
findings of Gary et al. in 2012.
4.2.1.2 Electrical stimulation failed to increase myelination in vitro
Contrary to the data demonstrated by Gary and colleagues (Gary et al., 2012),
electrical stimulation of mixed cortical cultures consisting of CNS neurons, astrocytes and
oligodendrocytes did not lead to improved myelination, as indicated by the amount of
4. Discussion
~ 103 ~
myelinated axons analyzed in 3.2.1.2. Although the cytotoxicity was not increased after
electrical stimulation (3.2.1.2), the cell viability over the time course of four days after
merging neuronal and oligodendrocyte cultures was relatively low for both treatment groups
(50-70% cytotoxicity). This might have influenced the overall low outcome of maximal 20%
myelinated axons of the total axonal fiber count in both conditions (3.2.1.2). It could be
assumed that an improvement of the mixed cortical cell culture in terms of cell viability and
overall degree of myelination might reveal ESTIM mediated effects, which were missed
otherwise.
As mentioned before, the beneficial effect of electrical stimulation on myelination is
dependent on the presence of neurons and several groups reported that neuronal activity
leads to the release of cytokines and neurotransmitter such as ATP and cyclic adenosine
monophosphate (cAMP), which ultimately increases myelination (Ishibashi et al., 2006;
Malone et al., 2013; Stevens et al., 2002). Malone and colleagues demonstrated that in
response to electrical stimulation, cultivated DRG neurons released cAMP and subsequently,
an increase of myelination by co-cultivated oligodendrocytes was observed (Malone et al.,
2013). The addition of extracellular cAMP to the cell culture media mimicked the beneficial
effect of electrical stimulation on myelination and therefore Malone et al. concluded that the
increased myelination might be regulated by neuronal activity via a cAMP pathway (Malone
et al., 2013). Hence, a failure in evoking neuronal activity by electrical stimulation could result
in negative results as observed in the present work. Although, we used the same stimulation
protocol with a similar application method as demonstrated by Gary et al. in 2012. However,
instead of rat DRG neurons, we performed the experiments with rat CNS neurons. We based
this decision on the fact that the subsequent in vivo experiments of CNS demyelination are
more closely resembled by CNS neurons. Yet, a recent study discovered that cultivated CNS
neurons require a maturation period of approximately 25 days before achieving full firing
functionality, while DRG neurons reach functional maturity already after five days in vitro
(Bourke et al., 2014). Since the CNS neurons in our experiments spent a maximum of 18
days in culture (14 days pre-ESTIM + 4 days ESTIM/NOSTIM), the impaired firing ability of
pre-mature CNS neurons might be another cause for the inability of the electrical stimulation
protocol to improve myelination in vitro.
4.2.2 Electrical stimulation in rodent models of demyelination
4.2.2.1 Induction of focal demyelinated lesions after intracortical injection of anti-MOG antibody and complement
Since the intensity of the applied electrical fields would decrease in deeper brain
structures, we targeted the cortex to induce demyelinated lesions, an area where the
electrical stimulation would be most effective. The stereotactical injection of the anti-MOG

4. Discussion
~ 104 ~
antibody Z2 in combination with mouse complement in Lewis rats led to cortical as well as
extensive subpial demyelinated lesions with only minimal damage to axonal fibers indicated
by MBP immunohistochemistry and Bielschowsky silver impregnation (3.2.2.1.1). Such
extensive subpial lesions are frequently found in MS patients and are, in contrast to white
matter lesions, more specific to MS (Moll et al., 2008).
Z2 is an IgG2 antibody specific for the myelin protein MOG. It can be assumed that it
attaches to myelin sheaths and forms antigen-antibody complexes, which can be recognized
directly by microglia or by the target recognition molecule C1q. C1q is part of the classical
complement pathway and amplifies the immune reaction by C3b attachment to the target
(Pangburn et al., 2008). C3b in turn initiates the cell destruction by assembling C5b-9 pores
in the cell membrane of the target cell (membrane attack complex), which allow water influx
and metabolite efflux as well as marks the target for phagocytosis by microglia. Furthermore,
C3b tags antigens so they can be processed by antigen presenting cells, thus facilitating the
immune response (Pangburn et al., 2008). Inflammatory mediators can be released after
activating the complement cascade, which might result in an opening of the BBB and
subsequent focal infiltration of macrophages as well as few T and B cells. Therefore, an
involvement of further immune competent cells besides microglia cannot be excluded.
However, it was shown that inflammation in cortical areas dissipates quickly (Merkler et al.,
2006), thus, even in the case of infiltration by inflammatory cells, a persisting inflammation in
this model of focal demyelination is unlikely. Besides the complement system, antibody-
dependent cellular cytotoxicity (ADCC) is as likely to play an important role in mediating
demyelination during a pathogenic antibody response. Lagumersindez-Denis and colleagues
used a similar model of cortical demyelinated lesions utilizing sub-threshold immunization
with MOG35-55 peptide and stereotactical injections of the pro-inflammatory cytokines TNFα
and IFNγ (Lagumersindez-Denis et al., 2017). They demonstrated the crucial role of
antibody-opsonization and NK cell mediated ADCC during demyelinated lesion formation in a
myelin-specific antibody response (Lagumersindez-Denis et al., 2017).
The size of the demyelinated area in our model decreased gradually over the time
course of 21 days in ESTIM, NOSTIM and sham animals, with first signs of remyelination
observed after seven days post injection (3.2.2.1.1, 3.2.2.1.2). Similar results were observed
in the focal EAE model of cortical demyelination by Merkler and colleagues, depicting a peak
of demyelination around three days post injection with a reduction of the demyelinated area
after seven days (Merkler et al., 2006). In the present work, the NOSTIM group depicted an
almost complete remyelination after 14 and 21 days, whereas the size of the demyelinated
area of both sham and ESTIM treated animals was still slightly larger at those time points,
although not significantly. This indicates that the application of the electrodes on the cranium
and therefore surgical opening of the scalp might induce an irritation of the area of

4. Discussion
~ 105 ~
stimulation, which possibly influenced the lesion regeneration. Unfortunately, a side-effect of
the stereotactical injection is a suture on the scalp of the rats, which renders a completely
non-invasive stimulation technique without re-opening of the scalp impossible.
The demyelinated area of the ESTIM treated animals at d5 and d7 was increased
compared to NOSTIM animals, while sham treated animals showed no significant change
compared to NOSTIM or ESTIM rats at those time points. Two possible explanations for this
effect could be that either the electrical stimulation impaired remyelination processes at an
early time point or the clearance of myelin debris by microglia was improved, which would
also result in less MBP+ signals. As OPC are responsible for remyelination (Keirstead and
Blakemore, 1997; Prayoonwiwat and Rodriguez, 1993; Targett et al., 1996), any impact on
them by electrical stimulation would also influence remyelination. In order to remyelinate,
OPC have to differentiate into myelin forming, mature oligodendrocytes. As demonstrated by
Kirson and colleagues in 2007, high frequency alternating electrical currents (>100 kHz) are
able to interfere with the formation of spindle tubulin during mitosis (TTF, Kirson et al., 2007).
Although the frequency of 10 Hz used in the present experiments was much lower than the
ones used in TTF, it remains possible that our stimulation protocols impaired OPC
proliferation and/or differentiation.
As mentioned above, another possible explanation for a larger area of MBP loss
might be an improved clearance of myelin debris. Indeed, a recent study indicated an
increase of Iba1+ activated microglia in the rat cortex following transcranial electrical
stimulation (Pikhovych et al., 2016). Moreover, a study performed on focal demyelination in a
rat peripheral nerve demonstrated enhanced myelin clearance by ED-1+ macrophages after
electrical stimulation with 20 Hz (McLean et al., 2014). Taken together, electrical stimulation
might be able to improve microglia activation in the rat cortex as well as phagocytic myelin
uptake. Further analysis of microglia/macrophage activation in the cortical lesions is required
and already planned to verify the presence of macrophages and possibly increased microglia
activation after electrical stimulation.
4.2.2.2 Robust remyelination in sham and ESTIM animals
Immunohistochemical stainings for Olig2 and p25 were performed to assess possible
effects of electrical stimulation on oligodendrocyte populations inside the demyelinated area,
in the perilesional area, the remyelinated area as well as the NAGM (3.2.2.1.3). Both
treatment groups displayed a slight drop in OPC numbers (Olig2+p25-) in the remyelinated
area, the NAGM and the demyelinated area, while no change for any group was observed in
the perilesional area. The decrease in the amount of OPC was expected and presumably
demonstrated the steady differentiation of OPC into mature oligodendrocytes. Despite the
fact that previous studies reported an increased recruitment of OPC from the SVZ after

4. Discussion
~ 106 ~
electrical stimulation in CNS models of demyelination and ischemic stroke (Jahanshahi et al.,
2013; Sherafat et al., 2012), the OPC populations of ESTIM treated animals remained
unchanged compared to sham treated animals. While the number of mature
oligodendrocytes (p25+) remained stable over the time course in the RM area as well as the
NAGM and no difference was detected between the two treatment groups in any counting
area, the p25+ cell count decreased over time in the DM lesion and increased in the
perilesional area for sham as well as ESTIM rats. Mature oligodendrocytes are required for a
successful remyelination and an increase of p25+ cells in the lesion periphery is therefore not
surprising. The slow decline in the number of mature oligodendrocytes inside the
demyelinated lesion, however, was unexpected, especially in context with the observed
remyelination. It can be discussed that the expression of mature oligodendrocyte proteins
like NogoA and p25 may be up-regulated in early demyelinated lesions, which might have
caused an underestimation of the true mature oligodendrocyte count at the later time points.
Furthermore, no increase in proliferating Olig2+ oligodendrocytes was observed by the
analysis of immunohistochemical stainings for the proliferation marker BrdU (3.2.2.1.4) in the
subpial and cortical area after electrical stimulation. In fact, the number of BrdU/Olig2 double
positive cells remained relatively stable over the observed time course in every counting
area. Since proliferating OPC are required for the observed successful remyelination, this
could indicate that the proliferation happens at a very early time point between d1 and d3.
According to several studies, axonal activity can influence OPC
proliferation/differentiation by release of cytokines and neurotransmitters such as glutamate
or ATP (Bergles et al., 2000; Ishibashi et al., 2006; Stevens et al., 2002). Both glutamate and
ATP were shown to affect Ca2+ responses in OPC (Bergles et al., 2000; Wake et al., 2011).
Ca2+ is an important signaling molecule and involved in many processes like proliferation,
migration or cell-cell communication (Berridge et al., 2000). However, it is still discussed,
whether glutamatergic synapses between OPC and neurons inhibit or facilitate OPC
proliferation (Maldonado and Angulo, 2015). This is due to controversial data, indicating for
instance, an increase in proliferating OPC in the developing rat optic nerve following
electrical stimulation (Barres and Raff, 1993) or on the other hand a decrease of NG2+ OPC
proliferation in response to glutamatergic synaptic activity in acute cortical slices (Mangin et
al., 2012).
By applying electrical currents during the initial phase of the lesion formation, we tried
to influence OPC proliferation and to increase oligodendrocyte differentiation. Despite the
controversial data mentioned before, we did not observe an increase or a decrease of
proliferating oligodendrocytes or any changes in the number of mature oligodendrocytes
following electrical stimulation. A reason for this could be the low stimulation intensity, which
might be insufficient to induce increased axonal firing. Due to the fact that this setup of

4. Discussion
~ 107 ~
transcranial alternating current stimulation in a rat model of cortical demyelination is the first
of its kind, no safety protocols exist yet. We chose a relatively low stimulation intensity to not
induce heat-related lesions, as they can be found with higher stimulation intensities during
transcranial direct current stimulation in rats (Liebetanz et al., 2009). We were aware that the
stimulation protocol might not be able to induce action potentials in neurons on its own.
However, we hypothesized that it might very well be able to influence neurons, which just
received a subthreshold synaptic input that did not depolarize the neuron enough to induce
an action potential. Depolarizing those neurons beyond the -50 mV threshold with electrical
stimulation might therefore result in action potentials. Nevertheless, the lack of effects on cell
proliferation and differentiation might indicate the need for stimulation protocols with higher
intensities. Future experiments should therefore establish safety protocols, to evaluate the
maximum stimulation intensity and duration possible that one can apply before provoking
heat-induced lesions.
As indicated by the assessment of the demyelinated area of NOSTIM animals, the
remyelination in this model of focal demyelination is the very robust and rapid. The window of
opportunity to influence the remyelination in a model that remyelinates almost completely
within 14-21 days is small. Therefore, we performed similar electrical stimulation experiments
in a mouse model of chronic, Cuprizone-induced demyelination.
4.2.2.3 Heterogeneous remyelination of the corpus callosum after 13 weeks of Cuprizone administration
It was reported that the continuous administration of Cuprizone over a time course of
12 weeks led to delayed remyelination in C57Bl/6 mice of at least 6 weeks (Harsan et al.,
2008; Hussain et al., 2013; Matsushima and Morell, 2001). After 6 weeks of Cuprizone
exposure, signs of remyelination can generally be seen, even in the presence of continuous
Cuprizone exposure (Matsushima and Morell, 2001). However, if Cuprizone administration
continues for another 6 weeks, the newly formed myelin and mature oligodendrocytes along
with resident OPC are depleted (Mason et al., 2004). Therefore, the exhaustion of progenitor
cells in the corpus callosum and the vicinity would delay further attempts of remyelination.
In line with this, we could demonstrate that the lateral part of the corpus callosum of
C57Bl/6 mice indeed showed a high demyelination score after five as well as after ten days
of cuprizone free diet (3.2.2.2.1). The medial part of the corpus callosum on the other hand,
depicted extended areas of thin LFB+ signals, likely indicating newly formed myelin as well as
strong LFB+ signals, indicating remaining myelin, which presumably was not affected by the
lengthy Cuprizone treatment. Regional differences in demyelination after Cuprizone
administration were reported before and were not only observed between different white
matter tracts of the CNS (Schmidt et al., 2013) but also between the lateral and medial

4. Discussion
~ 108 ~
corpus callosum (Tagge et al., 2016). Thus, the medial corpus callosum seemed to be less
affected by the Cuprizone treatment than the lateral corpus callosum. This could result in
more OPC available for remyelination or even less demyelination in the first place. Although
the analysis of immunohistochemical stainings for Olig2 and NogoA revealed no differences
in OPC numbers (Olig2+NogoA-) between the medial and lateral corpus callosum (3.2.2.2.2.),
the population of mature oligodendrocytes (NogoA+) was significantly higher in the medial
area compared to the lateral area for each time point and treatment condition. Therefore, an
increased differentiation of OPC into mature oligodendrocytes would result in a relatively low
OPC population, in fact as low as the number of OPC of the more severely affected lateral
corpus callosum. Taken together, the reduced demyelination score of the medial corpus
callosum could be explained by a less severe effect of Cuprizone in this area, resulting in
increased differentiation of OPC and increased remyelination compared to the lateral part.
4.2.2.4 ESTIM failed to exert effects on remyelination or oligodendrocyte populations
No effect was observed in electrically stimulated animals compared to sham treated
animals if comparing the demyelination score in LFB-PAS stainings or the oligodendrocyte
populations in the corpus callosum (3.2.2.2.1, 3.2.2.2.2). Albeit, the OPC (Olig2+NogoA-
BrdU+) in the lateral corpus callosum of sham animals showed a significant decrease after
ten days compared to five days of remyelination, while the OPC numbers of ESTIM animals
showed no significant effect. This might indicate a slight delay of OPC differentiation in
ESTIM animals, which, however, did not influence the remyelination of the corpus callosum.
In fact, only ESTIM animals demonstrated a significant decrease in the DM score between
five and ten days of remyelination. Furthermore, no effect on proliferating OPC or mature
oligodendrocytes (NogoA+BrdU+) was uncovered by comparing the two experimental groups
directly. Interestingly, the overall amount of proliferating OPC was very low for both time
points and treatment conditions, with many mice not showing any Olig2+NogoA-BrdU+ cells.
Since remyelination could be observed, this indicates that the proliferation of OPC necessary
for remyelination was either performed outside the corpus callosum or started already during
the phase of Cuprizone exposure and therefore before we injected the mice with BrdU.
Moreover, the duration of electrical stimulation for either five or ten days seemed to
have no influence as well, since both time points displayed equal results. Similar to the
previous experiment on focal cortical demyelination in rats, a change in the stimulation
protocol has to be considered. Neuronal activity is a crucial factor for increased OPC
proliferation/differentiation and myelin production as observed in the literature (Bergles et al.,
2000; Gary et al., 2012; Gibson et al., 2014; Ishibashi et al., 2006). To improve the ability of
our electrical stimulation protocols to influence neuronal activity, an increase of stimulation
intensity, as discussed before, or an alteration of the firing pattern should be investigated.

4. Discussion
~ 109 ~
However, one has to be careful in choosing such protocols, since not only can heat-induced
lesions occur by increasing the stimulation intensity (Liebetanz et al., 2009), but the artificial
increase of axonal firing could also lead to the generation of epileptic seizures (Norwood et
al., 2011).

4. Discussion
~ 110 ~
Part III – Discussion
Transcranial electrical stimulation in healthy human subjects

4. Discussion
~ 111 ~
4.3 Transcranial electrical stimulation in healthy human subjects
With the “theta burst” protocol (TBS), Huang and colleagues established an rTMS
stimulation protocol, which was able to either facilitate or inhibit cortical excitability depending
on the TBS pattern (Huang et al., 2005). Since the application of rTMS can be very
uncomfortable for the recipient and bears elevated risks of inducing epileptic seizures, we
tried to replicate the results observed by Huang et al. by using safer and more pleasant high
frequency, high intensity tACS protocols.
4.3.1 Differences in electric field strength and orientation may cause lack of effects on cortical excitability by eTBS protocols
Huang et al. demonstrated in 2005 that the application of rTMS based iTBS and cTBS
led to facilitation and inhibition of MEP responses for up to one hour, respectively (Huang et
al., 2005). In our study, however, the stimulation of healthy participants with tACS based
eTBS protocols did not evoke any changes in MEP responses. Furthermore, increasing the
stimulation intensity from 5 to 10 mA and prolonging the sinusoidal burst duration from 1 to 5
ms did not induce the expected effects on MEP amplitudes either. Although we used the
same three stimulation patterns (eiTBS, eimTBS and ecTBS), an obvious difference between
rTMS and tACS theta burst stimulation is the pulse intensity. While TMS pulses feature field
strengths of about 100 mV/mm for very brief periods, the peak-to-baseline amplitudes of a 5
mA eTBS sinusoidal waveform for instance only reaches electric fields of up to 1.35 mV/mm
in the cortical area, as indicated by a computational model of electric field distribution
performed by A. Opitz (fig. 5 in Kunz et al., 2017). However, electric fields in the range of
1.35 mV/mm might already be sufficient to modulate transmembrane potentials in neurons
and therefore increase the chance of axonal firing, as indicated by Deans and colleagues in
2007 (Deans et al., 2007). Yet, Deans et al. only used frequencies of up to 100 Hz and no
experiments were performed in the kilo-hertz range. While a single pulse of 1.35 mV/mm
may not modulate the neuronal membrane potential drastically, we hypothesized that a
continuous application of sinusoidal stimulation with 5 kHz might lead to a summation of
those minor effects, resulting in changes of neuronal excitability. In this line, Chaieb and
colleagues induced a lasting increase of MEP amplitudes using 1 mA tACS at 5 kHz,
demonstrating the effectiveness of 5 kHz tACS in modulating membrane potentials (Chaieb
et al., 2011). Moreover, Gildemeister described in 1943 that the voltage threshold required
for nerve excitation can be decreased by continuous application of alternating currents in the
kHz range (Gildemeister, 1943). Additionally, a recent study discovered that rat neuronal
cultures are able to evoke action potentials in response to electrical fields once every 100 µs
(Stern et al., 2015). In conjunction with the data obtained by Testa-Silva et al. in 2014,
demonstrating the ability of human pyramidal neurons to regulate action potential firing with
4. Discussion
~ 112 ~
sub-millisecond precision and verifying that human cortical neurons are able to track high
frequency inputs more efficiently than rodent cells (Testa-Silva et al., 2014), it can be
assumed that human cortical neurons should be able to respond to frequencies of at least 10
kHz. However, despite the aforementioned observations, no modulation of MEP amplitudes
was observed for any eTBS protocols compared to sham.
A further difference between rTMS and tACS pulses is the way the electric field
passes through the cortical layers. The TMS coil, held tangentially to the scull, induces an
electric field which either passes through the cortex in a posterior-anterior (PA) or in an
anterior-posterior (AP) direction, depending on the exact coil orientation. A PA directed
current would first activate cortical layer 1 before continuing to layer 6, therefore depolarizing
the soma of pyramidal tract cells, while an AP directed current would most likely first activate
cortical layer 6 and passing through to layer 1, thus leading to a soma-hyperpolarizing and
dendrite-depolarizing effect on pyramidal tract cells (Jefferys, 1981; Sommer et al., 2013).
Alternating currents, on the other hand, would interact with PA- as well as AP-oriented
structures and thus lack the direction specificity of direct currents. Therefore, to achieve
higher direction specificity, a tDCS offset in combination with the eTBS protocols could be
considered for future experiments.
4.3.2 Safe application of 10 mA eTBS but high interindividual variability
High pulse electric stimulation can lead to painful sensations on the skin (Merton and
Morton, 1980). In addition to previous studies demonstrating the safe application of 1-2 mA
tACS in the lower kHz range (Chaieb et al., 2011; Turi et al., 2013), Cuellar and colleagues
observed in 2013 that alternating currents in the frequency range of 2-100 kHz applied to
dorsal root ganglions of the exposed spinal cord of rats were able to inhibit sensory neurons
and therefore indicating a potential way to alleviate pain perception (Cuellar et al., 2013).
Based on this, we chose a 5 kHz carrier frequency to reduce pain perception at the skin.
Indeed, during the eTBS protocols with the highest applied intensity of 10 mA only one of ten
participants reported a medium-intensity tingling sensation and another participant reported
phosphenes. The remaining participants reported only mild tingling sensations, if any.
Therefore, it appears that alternating currents of up to 10 mA can be safely applied with a 5
kHz frequency.
Although no changes in MEP amplitudes were observed compared to sham, all
original eTBS protocols depicted a slight decrease in MEP size over the time course of 60
minutes, if compared to baseline. However, this is most likely caused by the increasingly
relaxed state of the participants sitting for more than one hour in a comfortable chair with arm
and head rests. The fact that sham stimulation demonstrated the same effect supports this
theory. Furthermore, during the second part of the study, we took greater care in keeping the
4. Discussion
~ 113 ~
level of consciousness of the participants at a constant level by engaging in soft small talk in
the breaks during the measurements. This could explain why none of the altered eTBS
protocols showed the decrease of MEP size over time as observed during the first study part.
A further factor that may contribute to the lack of observed effects of cortical
excitability might be the very high interindividual variability in MEP responses following any
eTBS or even sham protocols. In order to minimize the interindividual variability, we
standardized each session. This included an age range of healthy volunteers from 18-45
years, an equal number of female/male participants and a standardization of the stimulation
range of each eTBS protocol. Furthermore, we conducted the experiments only between
09:00 am and 06:00 pm, using the same laboratory. Nevertheless, many more factors can
contribute to a high variation of MEP results between individual subjects and between
repeated sessions with the same subject (Hamada et al., 2013; Maeda et al., 2000). Those
factors can be, as mentioned before, the awareness level of the subject or the time of day as
well as genetic differences like the BDNF polymorphism Val66Met (Ridding and Ziemann,
2010).
Concluding, eTBS proofed to be a method to safely apply high frequency tACS with
intensities of up to 10 mA. However, since no effect on cortical plasticity could be observed,
further alterations of the stimulation protocols like, e.g., a tDCS offset should be explored in
future experiments.

5. Summary and Conclusion
~ 114 ~
5. Summary and conclusion
5.1 Influence of autoimmune inflammation on remyelination in Cuprizone-induced demyelination
The inflammatory and demyelinating disease multiple sclerosis is characterized by
infiltration of autoreactive immune cells into the CNS, demyelinated lesions and axonal
damage. Remyelination, driven by OPC and mature oligodendrocytes, is believed to be
crucial in preventing permanent axonal damage and loss and is primarily found during
RRMS. In the chronic phases of the disease, however, remyelination frequently fails. It was
discussed, whether the inflammatory milieu, which is usually more pronounced during the
relapsing-remitting phase and less pronounced during chronic MS, can impact the
remyelination process.
By immunizing mice with MOG35-55 peptide during simultaneous Cuprizone
administration, we established a MS mouse model, which features demyelinated lesions in
the CNS with peripherally activated, infiltrating, auto-reactive immune cells like T cells, B
cells, granulocytes, NK cells and inflammatory monocytes. Accompanying the increased
immune cell infiltration and presence of inflammatory mediators, we observed an increased
impairment of axonal transport in the lateral corpus callosum of Cup-EAE mice, indicating
increased axonal damage. In addition, a decrease in the amount of mature oligodendrocytes
was observed in medial area of the corpus callosum at the remyelination time point following
EAE induction. However, further investigation of the remyelination of the corpus callosum by
myelin specific stainings revealed no changes between animals with and without adaptive
inflammation on top of demyelination. Moreover, a more detailed analysis of the density of
myelinated fibers by electron microscopy after 4.5 weeks of Cuprizone administration as well
as in the stage of remyelination on a Cuprizone-free diet demonstrated no significant
difference between the two experimental groups. Hence, the autoimmune response induced
by immunization with a myelin peptide seemed to have no effect on myelin production and
remyelination in the Cuprizone-induced mouse model of demyelination. Nevertheless, we
demonstrated that the Cuprizone-EAE model features important MS hallmarks like CNS
infiltrating, auto-reactive immune cells in combination with demyelination and axonal
damage. The Cuprizone-EAE model might therefore be a promising tool for future research
on inflammatory demyelinating CNS diseases.
5. Summary and Conclusion
~ 115 ~
5.2 Influence of transcranial alternating current stimulation on spontaneous remyelination in in vitro and in vivo models
The stimulation of remyelination is of foremost importance in demyelinating diseases
such as MS, since it is believed to prevent axons from becoming permanently damaged. The
differentiation of OPC into mature, myelinating oligodendrocytes is a crucial step in the
process of remyelination. As indicated by recent studies, the non-invasive application of
electrical currents could prove to be a promising therapeutic tool to stimulate OPC
differentiation, remyelination and nerve fiber regeneration. In the frame of the present work,
we developed stimulation protocols for in vitro and in vivo experiments. Initially, we applied
10 mA, 10 Hz alternating currents to oligodendrocyte cultures as well as mixed cortical
cultures to evaluate the impact of electrical stimulation on cytotoxicity, myelin production and
myelination of axonal fibers. No change in the number of O4+ cells was observed in ESTIM
treated oligodendrocyte cultures, indicating a nontoxic application of electrical fields.
Similarly, the amount of O4+MBP+ co-labeled cells remained unchanged. Thus, no increase
of myelin production was observed in the absence of neurons, which is in line with the
current literature. Although the amount of cytotoxicity in electrically stimulated mixed cortical
cultures, evaluated by analysis of LDH levels in the cell cultures, did not differ significantly
from untreated cultures, the density of myelinated fibers remained unchanged after electrical
stimulation as well. Therefore, the effect observed in the literature of increased MBP+
oligodendrocytes after electrical stimulation with 10 mA, 10 Hz biphasic currents could not be
replicated in the present experimental setup.
Subsequent experiments were performed on a rat model of focal, cortical
demyelination and on a mouse model of Cuprizone-induced, chronic demyelination with
impaired remyelination. Due to the lack of safety protocols for the novel method of
transcranial alternating current stimulation in rodent models of CNS demyelination, we chose
a less intense stimulation protocol of 100 µA at 10 Hz for our in vivo experiments. Indeed, we
were able to apply the electrical currents in a safe and mostly non-invasive way, without
provoking adverse effects such as heat-induced brain lesions or epileptic seizures. However,
analysis of the lesion formation and remyelination by MBP immunohistochemistry revealed a
minimal increase of the demyelinated area at five and seven days post injection in ESTIM
treated rats compared to sham animals. This effect might be caused by increased myelin
clearance by microglia. Apart from that, no significant differences in the size of the
demyelinated area, the oligodendrocyte populations or the oligodendrocyte proliferation were
observed when comparing ESTIM and sham treated animals. Similar results were obtained
in the chronic Cuprizone model, yielding no effect of electrical stimulation on corpus callosum
remyelination, oligodendrocyte populations or cell proliferation. Since it is believed that most
beneficial effects of electrical stimulation in terms of remyelination are mediated through

5. Summary and Conclusion
~ 116 ~
neuronal activity, the most plausible reason for the observed results is the inability of the
chosen stimulation protocol to improve neuronal activity. An increase of the stimulation
intensity, for instance, could prove to be more efficient. However, increasing the stimulation
intensity or prolonging the stimulation protocol could lead to severe adverse effects.
Therefore, future experiments should explore safety protocols.
5.3 Transcranial electrical stimulation in healthy human subjects
A number of transcranial stimulation protocols were shown to modulate neuronal
excitability. The TBS protocols performed by Huang et al. in 2005, for instance,
demonstrated inhibitory and excitatory effects on cortical excitability (Huang et al., 2005).
However, the application of TBS, as a form of rTMS, is uncomfortable for subjects and bears
elevated risks in inducing epileptic seizures. Here, we evaluated the feasibility of an electrical
form of TBS, which utilizes high intensity, high frequency alternating currents in a cross-over,
double-blind clinical study on healthy human subjects.
The original iTBS and cTBS protocols facilitated and inhibited MEP responses for up
to one hour post stimulation, respectively. While we based our eTBS protocols on the original
TBS protocols by Huang et al., no lasting effects on MEP amplitudes were observed for any
5 mA eTBS protocol compared to sham stimulation. Similarly, the continuous application of
10 mA ecTBS with a sinusoidal burst duration of either 1 or 5 ms produced no lasting effects
on motor responses. An obvious difference between the original TBS and eTBS protocols,
which may explain the lack of effects on cortical excitability, is the stimulation intensity.
Whereas magnetic TBS features very short impulses with intensities of about 100 mV/mm,
we observed current intensities of approximately 1.35 mV/mm during 5 mA eTBS (Kunz et
al., 2017). Nevertheless, based on the summation principal of Gildemeister (Gildemeister,
1943), we expected that a continuous stimulation with alternating currents might result in an
accumulation of charges, ultimately high enough to produce changes in neuronal excitability.
Another important difference between magnetic and alternating electric stimulation is the
directionality of the applied currents. While electric fields induced by magnetic coils passes
through the skull in either AP or PA direction, alternating currents would, by nature, always
alternate between both direction during the stimulation and therefore effect pyramidal tract
cells in different ways. To achieve higher direction specificity, we propose the use of a tDCS
offset for future experiments.
Finally, despite the lack of effect on MEP modulation, eTBS demonstrated to be a
safe and non-invasive way to apply high frequency, high intensity alternating currents to the
human brain.

Curriculum vitae
~ 117 ~
6. Bibliography
Ahlgren, C., Odén, A., and Lycke, J. (2011). High nationwide prevalence of multiple sclerosis
in Sweden. 17, 901–908. doi:10.1177/1352458511403794.
Al-Majed, a a, Neumann, C. M., Brushart, T. M., and Gordon, T. (2000). Brief electrical
stimulation promotes the speed and accuracy of motor axonal regeneration. J. Neurosci.
20, 2602–8. Available at: http://www.ncbi.nlm.nih.gov/pubmed/10729340.
Albert, M., Barrantes-freer, A., Lohrberg, M., Antel, J. P., Prineas, J. W., Palkovits, M., et al.
(2016). Synaptic Pathology in the Cerbellar Dentate Nucleus in Chronic Multiple
Sclerosis. Brain Pathol. 8472.
Alekseichuk, I., Turi, Z., Lara, G. A. De, Antal, A., and Paulus, W. (2016). Spatial Working
Memory in Humans Depends on Theta and High Gamma Synchronization in the
Prefrontal Cortex. Curr. Biol., 1–9. doi:10.1016/j.cub.2016.04.035.
Antal, A., and Paulus, W. (2013). Transcranial alternating current stimulation (tACS). Front.
Hum. Neurosci. 7, 317. doi:10.3389/fnhum.2013.00317.
Barker, A. T., Jalinous, R., and Freeston, I. L. (1985). Non-Invasive Magnetic Stimulation of
Human Motor Cortex. Lancet 325, 1106–1107. doi:10.1016/S0140-6736(85)92413-4.
Barnett, M. H., and Prineas, J. W. (2004). Relapsing and Remitting Multiple Sclerosis:
Pathology of the Newly Forming Lesion. Ann. Neurol. 55, 458–468.
doi:10.1002/ana.20016.
Barres, B. a, and Raff, M. C. (1993). Proliferation of oligodendrocyte precursor cells depends
on electrical activity in axons. Group 361, 258–60. doi:10.1038/361258a0.
Beirowski, B., Babetto, E., Golden, J., Chen, Y.-J., Yang, K., Gross, R., et al. (2014).
Metabolic regulator LKB1 plays a crucial role in Schwann cell- mediated axon
maintenance Bogdan. Nat. Neurosci. 17, 1351–1361. doi:10.1038/nn.3809.
Ben-Nun, A., Wekerle, H., and Cohen, I. R. (1981). The rapid isolation of clonable antigen-
specific T lymphocyte lines capable of mediating autoimmune encephalomyelitis. Eur. J.
Immunol. 11, 195–199. doi:10.1002/eji.1830110307.
Bengtsson, S. L., Nagy, Z., Skare, S., Forsman, L., Forssberg, H., and Ullén, F. (2005).
Extensive piano practicing has regionally specific effects on white matter development.
Nat. Neurosci. 8, 1148–50. doi:10.1038/nn1516.

Curriculum vitae
~ 118 ~
Bergles, D. E., Diamond, J. S., and Jahr, C. E. (1999). Clearance of glutamate inside the
synapse and beyond. Curr. Opin. Neurobiol. 9, 293–298. doi:10.1016/S0959-
4388(99)80043-9.
Bergles, D. E., Roberts, J. D., Somogyi, P., and Jahr, C. E. (2000). Glutamatergic synapses
on oligodendrocyte precursor cells in the hippocampus. Nature 405, 187–91.
doi:10.1038/35012083.
Berridge, M., Lipp, P., and Bootman, M. (2000). Signal transduction. The calcium entry pas
de deux. Science (80-. ). 287, 1604–5.
Bettelli, E., Pagany, M., Weiner, H. L., Linington, C., Sobel, R. A., and Kuchroo, V. K. (2003).
Myelin Oligodendrocyte Glycoprotein–specific T Cell Receptor Transgenic Mice Develop
Spontaneous Autoimmune Optic Neuritis. J. Exp. Med. J. Exp. Med 0, 1073–1081.
doi:10.1084/jem.20021603.
Bielekova, B., Sung, M.-H., Kadom, N., Simon, R., McFarland, H., and Martin, R. (2004).
Expansion and functional relevance of high-avidity myelin-specific CD4+ T cells in
multiple sclerosis. J. Immunol. 172, 3893–904. doi:10.4049/JIMMUNOL.172.6.3893.
Billiau, A., and Matthys, P. (2001). Modes of action of Freund’s adjuvants in experimental
models of autoimmune diseases. J. Leukoc. Biol. 70, 849–860. Available at:
http://www.jleukbio.org/content/70/6/849%5Cnhttp://www.jleukbio.org/content/70/6/849.f
ull%5Cnhttp://www.jleukbio.org/content/70/6/849.full.pdf%5Cnhttp://www.ncbi.nlm.nih.g
ov/pubmed/11739546.
Bø, L., Vedeler, C. a, Nyland, H. I., Trapp, B. D., and Mørk, S. J. (2003). Subpial
demyelination in the cerebral cortex of multiple sclerosis patients. J. Neuropathol. Exp.
Neurol. 62, 723–732. doi:10.1093/jnen/62.7.723.
Boggio, P., Nunes, A., Rigonatti, S., Nitsche, M., Pascual-Leone, A., and Fregni, F. (2007).
Repeated sessions of noninvasive brain DC stimulation is associated with motor
function improvement in stroke patients. Restor. Neurol. Neurosci. 25, 123–9.
Booss, J., Esiri, M., Tourtellotte, W., and Mason, D. (1983). Immunohistological analysis of T
lymphocyte subsets in the central nervous system in chronic progressive multiple
sclerosis. J Neurol Sci 62, 219–32.
Boretius, S., Escher, A., Dallenga, T., Wrzos, C., Tammer, R., Brück, W., et al. (2012).
Assessment of lesion pathology in a new animal model of MS by multiparametric MRI
and DTI. Neuroimage 59, 2678–88. doi:10.1016/j.neuroimage.2011.08.051.

Curriculum vitae
~ 119 ~
Bourke, J. L., Coleman, H. a, Pham, V., Forsythe, J. S., and Parkington, H. C. (2014).
Neuronal electrophysiological function and control of neurite outgrowth on electrospun
polymer nanofibers are cell type dependent. Tissue Eng. Part A 20, 1089–95.
doi:10.1089/ten.TEA.2013.0295.
Bunge, M. B., Bunge, R. P., and Ris, H. (1961). Ultrastructural study of remyelination in an
experimental lesion in adult cat spinal cord. J. Biophys. Biochem. Cytol. 10, 67–94.
doi:10.1083/jcb.10.1.67.
Butzkueven, H., Emery, B., Cipriani, T., Marriott, M., and Kilpatrick, T. (2006). Endogenous
Leukemia Inhibitory Factor Production Limits Autoimmune Demyelination and
Oligodendrocyte Loss. Glia 53, 696–703. doi:10.1002/glia.20321.
Campbell, G., Kraytsberg, Y., Krishnan, K., Ohno, N., Ziabreva, I., Reeve, A., et al. (2012).
Clonal Expansion of Mitochondrial DNA Deletions in Multiple Sclerosis. Acta
Neuropathol. 124, 209–220. doi:10.1007/s00401-012-1001-9.
Cao, Y., Goods, B., Raddassi, K., Nepom, G., Kwok, W., Love, C., et al. (2015). Distinct
Inflammatory Profiles of Myelin-Reactive T cells from Patients with Multiple Sclerosis.
Sci Transl Med 7. doi:10.1126/scitranslmed.aaa8038.
Carlton, W. (1967). Studies on the induction of hydrocephalus and spongy degeneration by
cuprizone feeding and attempts to antidote the toxicity. Life Sci 6, 11–9.
Chaieb, L., Antal, A., and Paulus, W. (2011). Transcranial alternating current stimulation in
the low kHz range increases motor cortex excitability. Restor. Neurol. Neurosci. 29,
167–175. doi:10.3233/RNN-2011-0589.
Chan, J. R., Jolicoeur, C., Yamauchi, J., Elliot, J., Fawcett, J. W., Ng, B. K., et al. (2006). The
polarity protein Par-3 regulates myelination. Science (80-. ). 314, 832–836.
doi:00/00/0A/85/ [pii]\r10.1051/medsci/2007233259.
Charles, P., Hernandez, M. P., Stankoff, B., Aigrot, M. S., Colin, C., Rougon, G., et al.
(2000). Negative regulation of central nervous system myelination by polysialylated-
neural cell adhesion molecule. Proc. Natl. Acad. Sci. U. S. A. 97, 7585–90.
doi:10.1073/pnas.100076197.
Cohen, R. I., Marmur, R., Norton, W. T., Mehler, M. F., and Kessler, J. A. (1996). Nerve
growth factor and neurotrophin-3 differentially regulate the proliferation and survival of
developing rat brain oligodendrocytes. J. Neurosci. 16, 6433–6442. Available at:
http://www.ncbi.nlm.nih.gov/pubmed/8815922.
Curriculum vitae
~ 120 ~
Coles, A. J., Cox, A., Le Page, E., Jones, J., Trip, S. A., Deans, J., et al. (2006). The window
of therapeutic opportunity in multiple sclerosis: Evidence from monoclonal antibody
therapy. J. Neurol. 253, 98–108. doi:10.1007/s00415-005-0934-5.
Compston, A., and Coles, A. (2008). Multiple sclerosis. Lancet 372, 1502–1517.
doi:10.1016/S0140-6736(08)61620-7.
Cooper, M., Fehniger, T., and Caligiuri, M. A. (2001). The biology of human natural killer-cell
subsets. Trends Immunol. 22, 633–640. doi:10.1016/S1471-4906(01)02060-9.
Croxford, A. L., Kurschus, F. C., and Waisman, A. (2011). Mouse models for multiple
sclerosis: historical facts and future implications. Biochim Biophys Acta. 1812, 177–83.
doi:10.1016/j.bbadis.2010.06.010.
Cuellar, J. M., Alataris, K., Walker, A., Yeomans, D. C., and Antognini, J. F. (2013). Effect of
high-frequency alternating current on spinal afferent nociceptive transmission.
Neuromodulation 16, 318–327. doi:10.1111/ner.12015.
Dale, D., Boxer, L., and Liles, W. (2008). The phagocytes : neutrophils and monocytes. Blood
112, 935–946. doi:10.1182/blood-2007-12-077917.
Dawson, M. R. L., Polito, A., Levine, J. M., and Reynolds, R. (2003). NG2-expressing glial
progenitor cells: An abundant and widespread population of cycling cells in the adult rat
CNS. Mol. Cell. Neurosci. 24, 476–488. doi:10.1016/S1044-7431(03)00210-0.
Deans, J. K., Powell, A. D., and Jefferys, J. G. R. (2007). Sensitivity of coherent oscillations
in rat hippocampus to AC electric fields. J. Physiol. 583, 555–565.
doi:10.1113/jphysiol.2007.137711.
Demerens, C., Stankoff, B., Logak, M., Anglade, P., Allinquant, B., Couraud, F., et al. (1996).
Induction of myelination in the central nervous system by electrical activity. Proc. Natl.
Acad. Sci. U. S. A. 93, 9887–92. Available at:
http://www.pubmedcentral.nih.gov/articlerender.fcgi?artid=38524&tool=pmcentrez&rend
ertype=abstract.
Dendrou, C. A., Fugger, L., and Friese, M. A. (2015). Immunopathology of multiple sclerosis.
Nat. Publ. Gr. 15, 545–558. doi:10.1038/nri3871.
Duchini, A., Govindarajan, S., Santucci, M., Zampi, G., and Hofman, F. (1996). Effects of
tumor necrosis factor-alpha and interleukin-6 on fluid-phase permeability and ammonia
diffusion in CNS-derived endothelial cells. J Investig Med 44, 474–82.

Curriculum vitae
~ 121 ~
Dugas, J. C., Cuellar, T. L., Scholze, A., Ason, B., Emery, B., Zamanian, J. L., et al. (2011).
Dicer1 and miR-219 Are Required for Normal Oligodendrocyte Differentiation and
Myelination. Neuron 65, 597–611. doi:10.1016/j.neuron.2010.01.027.
Duncan, I. D., Brower, A., Kondo, Y., Curlee, J. F., and Schultz, R. D. (2009). Extensive
remyelination of the CNS leads to functional recovery. 106, 6832–6836.
doi:10.1073/pnas.0812500106.
Emery, B., Agalliu, D., Cahoy, J. D., Watkins, T. A., Dugas, J. C., Sara, B., et al. (2009).
Identification of Myelin-gene Regulatory Factor as a Critical Transcriptional Regulator
Required for CNS Myelination. Cell 138, 172–185. doi:10.1016/j.cell.2009.04.031.
Eriksson, M., Andersen, O., and Runmarker, B. (2003). Long-term follow up of patients with
clinically isolated syndromes , relapsing-remitting and secondary progressive multiple
sclerosis. 260–274.
Escher, A. (2008). Neuroaxonale Schädigung in experimentellen Modellen der multiplen
Sklerose. Dr. Thesis.
Fernández, M., Baldassarro, V. A., Sivilia, S., Giardino, L., and Calzà, L. (2016).
Inflammation severely alters thyroid hormone signaling in the central nervous system
during experimental allergic encephalomyelitis in rat: Direct impact on OPCs
differentiation failure. Glia 64, 1573–1589. doi:10.1002/glia.23025.
Feurra, M., Paulus, W., Walsh, V., and Kanai, R. (2011). Frequency specific modulation of
human somatosensory: Cortex. Front. Psychol. 2, 1–6. doi:10.3389/fpsyg.2011.00013.
Fields, R. D. (2008). White matter in learning, cognition and psychiatric disorders. Trends
Neurosci. 31, 361–370. doi:10.1016/j.tins.2008.04.001.
Fields, R. D., and Ni, Y. (2010). Nonsynaptic Communication Through ATP Release from
Volume-Activated Anion Channels in Axons. Sci. Signal. 3.
doi:10.1126/scisignal.2001128.
Fischer, M. T., Sharma, R., Lim, J. L., Haider, L., Frischer, J. M., Drexhage, J., et al. (2012).
NADPH oxidase expression in active multiple sclerosis lesions in relation to oxidative
tissue damage and mitochondrial injury. Brain 135, 886–899. doi:10.1093/brain/aws012.
Fischer, M. T., Wimmer, I., Höftberger, R., Gerlach, S., Haider, L., Zrzavy, T., et al. (2013).
Disease-specific molecular events in cortical multiple sclerosis lesions. Brain 136,
1799–1815. doi:10.1093/brain/awt110.
Curriculum vitae
~ 122 ~
Flügel, A., Berkowicz, T., Ritter, T., Labeur, M., Jenne, D. E., Li, Z., et al. (2001). Migratory
Activity and Functional Changes of Green Fluorescent Effector Cells before and during
Experimental Autoimmune Encephalomyelitis. Immunity 14, 547–560.
doi:10.1016/S1074-7613(01)00143-1.
Foote, a. K., and Blakemore, W. F. (2005). Inflammation stimulates remyelination in areas of
chronic demyelination. Brain 128, 528–539. doi:10.1093/brain/awh417.
Franklin, R. J. M. (2002). Why does remyelination fail in multiple sclerosis? Nat. Rev.
Neurosci. 3, 705–14. doi:10.1038/nrn917.
Frischer, J. M., Bramow, S., Dal-Bianco, A., Lucchinetti, C. F., Rauschka, H., Schmidbauer,
M., et al. (2009). The relation between inflammation and neurodegeneration in multiple
sclerosis brains. Brain 132, 1175–1189. doi:10.1093/brain/awp070.
Fünfschilling, U., Supplie, L. M., Mahad, D., Boretius, S., Saab, A. S., Edgar, J., et al. (2012).
Glycolytic oligodendrocytes maintain myelin and long-term axonal integrity. Nature 485,
517–21. doi:10.1038/nature11007.
Gamboa, O. L., Antal, A., Moliadze, V., and Paulus, W. (2010). Simply longer is not better:
reversal of theta burst after-effect with prolonged stimulation. Exp. brain Res. 204, 181–
7. doi:10.1007/s00221-010-2293-4.
Gandhi, R., Laroni, a, and Weiner, H. (2010). Role of the innate immune system in the
pathogenesis of multiple sclerosis. J neuroimmunol 221, 7–14.
doi:10.1016/j.jneuroim.2009.10.015.Role.
Gary, D. S., Malone, M., Capestany, P., Houdayer, T., and McDonald, J. W. (2012).
Electrical stimulation promotes the survival of oligodendrocytes in mixed cortical
cultures. J. Neurosci. Res. 90, 72–83. doi:10.1002/jnr.22717.
Gensert, J. M., and Goldman, J. E. (1997). Endogenous progenitors remyelinate
demyelinated axons in the adult CNS. Neuron 19, 197–203. doi:10.1016/S0896-
6273(00)80359-1.
Gibson, E. M., Purger, D., Mount, C. W., Goldstein, A. K., Lin, G. L., Wood, L. S., et al.
(2014). Neuronal activity promotes oligodendrogenesis and adaptive myelination in the
mammalian brain. Science 344, 1252304. doi:10.1126/science.1252304.
Gildemeister, M. (1943). Untersuchungen über die Wirkung der Mittelfrequenzströme. 247,
366–404.

Curriculum vitae
~ 123 ~
Goldschmidt, T., Antel, J., König, F., Brück, W., and Kuhlmann, T. (2009). Remyelination
capacity of the MS brain decreases with disease chronicity. Neurology 72, 1914–21.
Goverman, J. (2009). Autoimmune T cell responses in the central nervous system.
Immunology 9, 393–407. doi:10.1038/nri2550.Autoimmune.
Gray, E., Thomas, T. L., Betmouni, S., Scolding, N., and Love, S. (2008). Elevated
myeloperoxidase activity in white matter in multiple sclerosis. Neurosci. Lett. 444, 195–
198. doi:10.1016/j.neulet.2008.08.035.
Haider, L., Fischer, M. T., Frischer, J. M., Bauer, J., Höftberger, R., Botond, G., et al. (2011).
Oxidative damage in multiple sclerosis lesions. Brain 134, 1914–1924.
doi:10.1093/brain/awr128.
Hamada, M., Murase, N., Hasan, A., Balaratnam, M., and Rothwell, J. C. (2013). The role of
interneuron networks in driving human motor cortical plasticity. Cereb. Cortex 23, 1593–
605. doi:10.1093/cercor/bhs147.
Harsan, L.-A., Steibel, J., Zaremba, A., Agin, A., Sapin, R., Poulet, P., et al. (2008).
Neurobiology of Disease Recovery from Chronic Demyelination by Thyroid Hormone
Therapy: Myelinogenesis Induction and Assessment by Diffusion Tensor Magnetic
Resonance Imaging. 28, 14189–14201. doi:10.1523/JNEUROSCI.4453-08.2008.
Hauser, S. L., Chan, J. R., and Oksenberg, J. R. (2013). Multiple sclerosis: Prospects and
promise. Ann. Neurol. 74, 317–27. doi:10.1002/ana.24009.
Hawker, K., O’Connor, P., Freedman, M. S., Calabresi, P. A., Antel, J., Simon, J., et al.
(2009). Rituximab in patients with primary progressive multiple sclerosis: Results of a
randomized double-blind placebo-controlled multicenter trial. Ann. Neurol. 66, 460–471.
doi:10.1002/ana.21867.
Hayashi, T., Morimoto, C., Burks, J. S., Kerr, C., and Hauser, S. L. (1988). Dual-label
immunocytochemistry of the active multiple sclerosis lesion: Major histocompatibility
complex and activation antigens. Ann. Neurol. 24, 523–531.
doi:10.1002/ana.410240408.
Hiremath, M. M., Saito, Y., Knapp, G. W., Ting, J. P. Y., Suzuki, K., and Matsushima, G. K.
(1998). Microglial/macrophage accumulation during cuprizone-induced demyelination in
C57BL/6 mice. J. Neuroimmunol. 92, 38–49. doi:10.1016/S0165-5728(98)00168-4.

Curriculum vitae
~ 124 ~
Hofstetter, H. H., Shive, C. L., and Forsthuber, T. G. (2002). Pertussis Toxin Modulates the
Immune Response to Neuroantigens Injected in Incomplete Freund’s Adjuvant:
Induction of Th1 Cells and Experimental Autoimmune Encephalomyelitis in the
Presence of High Frequencies of Th2 Cells. J. Immunol. 169, 117–125.
doi:10.4049/jimmunol.169.1.117.
Hohlfeld, R. (2007). Does inflammation stimulate remyelination? J. Neurol. 254, 47–54.
doi:10.1007/s00415-007-1009-6.
Huang, J., Zhang, Y., Lu, L., Hu, X., and Luo, Z. (2013). Electrical stimulation accelerates
nerve regeneration and functional recovery in delayed peripheral nerve injury in rats.
Eur. J. Neurosci. 38, 3691–701. doi:10.1111/ejn.12370.
Huang, Y. M., Xiao, B. G., Ozenci, V., Kouwenhoven, M., Teleshova, N., Fredrikson, S., et al.
(1999). Multiple sclerosis is associated with high levels of circulating dendritic cells
secreting pro-inflammatory cytokines. J. Neuroimmunol. 99, 82–90. doi:10.1016/S0165-
5728(99)00106-X.
Huang, Y. Z., Chen, R. S., Rothwell, J. C., and Wen, H. Y. (2007). The after-effect of human
theta burst stimulation is NMDA receptor dependent. Clin. Neurophysiol. 118, 1028–
1032. doi:DOI 10.1016/j.clinph.2007.01.021.
Huang, Y. Z., Edwards, M. J., Rounis, E., Bhatia, K. P., and Rothwell, J. C. (2005). Theta
burst stimulation of the human motor cortex. Neuron 45, 201–206.
doi:10.1016/j.neuron.2004.12.033.
Hussain, R., Ghoumari, A. M., Bielecki, B., Steibel, J., Boehm, N., Liere, P., et al. (2013). The
neural androgen receptor: A therapeutic target for myelin repair in chronic
demyelination. Brain 136, 132–146. doi:10.1093/brain/aws284.
Ioannidou, K., Anderson, K. I., Strachan, D., Edgar, J. M., and Barnett, S. C. (2012). Time-
lapse imaging of the dynamics of CNS glial-axonal interactions in vitro and ex vivo.
PLoS One 7. doi:10.1371/journal.pone.0030775.
Irvine, K. A., and Blakemore, W. F. (2008). Remyelination protects axons from
demyelination-associated axon degeneration. Brain 131, 1464–1477.
doi:10.1093/brain/awn080.
Ishibashi, T., Dakin, K. A., Stevens, B., Lee, P. R., Kozlov, S. V., Stewart, C. L., et al. (2006).
Astrocytes promote myelination in response to electrical impulses. Neuron 49, 823–832.
doi:10.1016/j.neuron.2006.02.006.

Curriculum vitae
~ 125 ~
Jahanshahi, A., Schonfeld, L., Janssen, M. L. F., Hescham, S., Kocabicak, E., Steinbusch,
H. W. M., et al. (2013). Electrical stimulation of the motor cortex enhances progenitor
cell migration in the adult rat brain. Exp. brain Res. 231, 165–77. doi:10.1007/s00221-
013-3680-4.
Jeffery, N., and Blakemore, W. (1995). Remyelination of mouse spinal cord axons
demyelinated by local injection of lysolecithin. J Neurocytol 24, 775–81.
Jefferys, J. G. R. (1981). Influence of electric fields on the excitability of granule cells in
guinea-pig hippocampal slices. J Physiol, 143–152.
Jürgens, T., Jafari, M., Kreutzfeldt, M., Bahn, E., Brück, W., Kerschensteiner, M., et al.
(2016). Reconstruction of single cortical projection neurons reveals primary spine loss in
multiple sclerosis. Brain 139, 39–46. doi:10.1093/brain/awv353.
Kabat, E. A., Wolf, A., Bezer, A. E., and Murray, J. P. (1951). Studies on Acute Disseminated
Encephalomyelitis Produced Experimentally in Rhesus Monkeys. J. Exp. Med. 93, 615–
633. Available at:
http://www.ncbi.nlm.nih.gov/pmc/articles/PMC2136070/%5Cnhttp://www.ncbi.nlm.nih.go
v/pmc/articles/PMC2136070/pdf/615.pdf.
Keirstead, H. S., and Blakemore, W. F. (1997). Identification of post-mitotic oligodendrocytes
incapable of remyelination within the demyelinated adult spinal cord. J. Neuropathol.
Exp. Neurol. 56, 1191–1201. Available at:
http://www.ncbi.nlm.nih.gov/pubmed/9370229.
Kerschensteiner, M., Gallmeier, E., Behrens, L., Leal, V., Misgeld, T., Klinkert, W. E., et al.
(1999). Activated human T cells, B cells, and monocytes produce brain-derived
neurotrophic factor in vitro and in inflammatory brain lesions: a neuroprotective role of
inflammation? J. Exp. Med. 189, 865–870. doi:10.1084/jem.189.5.865.
Kerschensteiner, M., Stadelmann, C., Dechant, G., Wekerle, H., and Hohlfeld, R. (2003).
Neurotrophic cross-talk between the nervous and immune systems: Implications for
neurological diseases. Ann. Neurol. 53, 292–304. doi:10.1002/ana.10446.
Khedr, E. M., Ahmed, M. A., Fathy, N., and Rothwell, J. C. (2005). Therapeutic trial of
repetitive transcranial magnetic stimulation after acute ischemic stroke. Neurology 65,
466–468. doi:10.1212/01.wnl.0000173067.84247.36.
Kim, J. H., Budde, M. D., Liang, H. F., Klein, R. S., Russell, J. H., Cross, A. H., et al. (2006).
Detecting axon damage in spinal cord from a mouse model of multiple sclerosis.
Neurobiol. Dis. 21, 626–632. doi:10.1016/j.nbd.2005.09.009.

Curriculum vitae
~ 126 ~
Kirson, E. D., Dbalý, V., Tovarys, F., Vymazal, J., Soustiel, J. F., Itzhaki, A., et al. (2007).
Alternating electric fields arrest cell proliferation in animal tumor models and human
brain tumors. Proc. Natl. Acad. Sci. U. S. A. 104, 10152–7.
doi:10.1073/pnas.0702916104.
Kirson, E. D., Gurvich, Z., Schneiderman, R., Dekel, E., Itzhaki, A., Wasserman, Y., et al.
(2004). Disruption of Cancer Cell Replication by Alternating Electric Fields. Cancer Res.
64, 3288–3295.
Kirson, E. D., Schneiderman, R. S., Dbalý, V., Tovarys, F., Vymazal, J., Itzhaki, A., et al.
(2009). Chemotherapeutic treatment efficacy and sensitivity are increased by adjuvant
alternating electric fields (TTFields). BMC Med. Phys. 9, 1. doi:10.1186/1756-6649-9-1.
Kuhlmann, T., Lingfeld, G., Bitsch, A., Schuchardt, J., and Brück, W. (2002). Acute axonal
damage in multiple sclerosis is most extensive in early disease stages and decreases
over time. Brain 125, 2202–2212. doi:10.1093/brain/awf235.
Kuhlmann, T., Ludwin, S., Prat, A., Antel, J., Brück, W., and Lassmann, H. (2017). An
updated histological classification system for multiple sclerosis lesions. Acta
Neuropathol. 133, 13–24. doi:10.1007/s00401-016-1653-y.
Kuhlmann, T., Remington, L., Maruschak, B., Owens, T., and Brück, W. (2007). Nogo-A is a
reliable oligodendroglial marker in adult human and mouse CNS and in demyelinated
lesions. J. Neuropathol. Exp. Neurol. 66, 238–246.
doi:10.1097/01.jnen.0000248559.83573.71.
Kunz, P., Antal, A., Hewitt, M., Neef, A., Opitz, A., and Paulus, W. (2017). 5 kHz Transcranial
Alternating Current Stimulation: Lack of Cortical Excitability Changes When Grouped in
a Theta Burst Pattern. Front. Hum. Neurosci. 10, 1–8. doi:10.3389/fnhum.2016.00683.
Kutzelnigg, A., Lucchinetti, C. F., Stadelmann, C., Brück, W., Rauschka, H., Bergmann, M.,
et al. (2005). Cortical demyelination and diffuse white matter injury in multiple sclerosis.
Brain 128, 2705–2712. doi:10.1093/brain/awh641.
Lagumersindez-Denis, N., Wrzos, C., Mack, M., Winkler, A., van der Meer, F., Reinert, M. C.,
et al. (2017). Differential contribution of immune effector mechanisms to cortical
demyelination in multiple sclerosis. Acta Neuropathol. doi:10.1007/s00401-017-1706-x.
Lassmann, H., and Bradl, M. (2017). Multiple sclerosis : experimental models and reality.
Acta Neuropathol. 133, 223–244. doi:10.1007/s00401-016-1631-4.

Curriculum vitae
~ 127 ~
Lassmann, H., Brück, W., and Lucchinetti, C. F. (2007). The immunopathology of multiple
sclerosis: An overview. Brain Pathol. 17, 210–218. doi:10.1111/j.1750-
3639.2007.00064.x.
Di Lazzaro, V., Pilato, F., Saturno, E., Oliviero, A., Dileone, M., Mazzone, P., et al. (2005).
Theta-burst repetitive transcranial magnetic stimulation suppresses specific excitatory
circuits in the human motor cortex. J. Physiol. 565, 945–50.
doi:10.1113/jphysiol.2005.087288.
Ledeen, R. W., and Chakraborty, G. (1998). Cytokines, signal transduction, and inflammatory
demyelination: Review and hypothesis. Neurochem. Res. 23, 277–289.
doi:10.1023/A:1022493013904.
Lee, Y., Morrison, B. M., Li, Y., Lengacher, S., Farah, M. H., Hoffman, P. N., et al. (2012).
Oligodendroglia metabolically support axons and contribute to neurodegeneration.
Nature 487, 443–448. doi:10.1038/nature11314.
Lefaucheur, J.-P., Andre-Obadia, N., Antal, A., Ayache, S. S., Baeken, C., Benninger, D. H.,
et al. (2014). Evidence-based guidelines on the therapeutic use of repetitive transcranial
magnetic stimulation (rTMS). Clin. Neurophysiol. 125, 2150–2206.
doi:10.1016/j.clinph.2014.05.021.
Lenz, M., Platschek, S., Priesemann, V., Becker, D., Willems, L. M., Ziemann, U., et al.
(2014). Repetitive magnetic stimulation induces plasticity of excitatory postsynapses on
proximal dendrites of cultured mouse CA1 pyramidal neurons. Brain Struct. Funct. 220,
3323–3337. doi:10.1007/s00429-014-0859-9.
Li, L., El-Hayek, Y. H., Liu, B., Chen, Y., Gomez, E., Wu, X., et al. (2008). Direct-current
electrical field guides neuronal stem/progenitor cell migration. Stem Cells 26, 2193–200.
doi:10.1634/stemcells.2007-1022.
Liebetanz, D., Koch, R., Mayenfels, S., König, F., Paulus, W., and Nitsche, M. a (2009).
Safety limits of cathodal transcranial direct current stimulation in rats. Clin.
Neurophysiol. 120, 1161–7. doi:10.1016/j.clinph.2009.01.022.
Lin, W., Kemper, A., Dupree, J. L., Harding, H. P., Ron, D., and Popko, B. (2006). Interferon-
γ inhibits central nervous system remyelination through a process modulated by
endoplasmic reticulum stress. Brain 129, 1306–1318. doi:10.1093/brain/awl044.
Liu, A., Li, J., Marin-Husstege, M., Kageyama, R., Fan, Y., Gelinas, C., et al. (2006). A
molecular insight of Hes5-dependent inhibition of myelin gene expression: old partners
and new players. EMBO J. 25, 4833–42. doi:10.1038/sj.emboj.7601352.
Curriculum vitae
~ 128 ~
Liu, J., and Casaccia-Bonnefil, P. (2010). Epigenetic regulation of oligodendrocyte identity.
Trends Neurosci. 33, 193–201. doi:10.1016/j.tins.2010.01.007.
Lund, F. E. (2008). Cytokine-producing B lymphocytes-key regulators of immunity. Curr.
Opin. Immunol. 20, 332–8. doi:10.1016/j.coi.2008.03.003.
Lundgaard, I., Luzhynskaya, A., Stockley, J. H., Wang, Z., Evans, K. a, Swire, M., et al.
(2013). Neuregulin and BDNF Induce a Switch to NMDA Receptor-Dependent
Myelination by Oligodendrocytes. PLoS Biol. 11, e1001743.
doi:10.1371/journal.pbio.1001743.
Maeda, F., Keenan, J. P., Tormos, J. M., Topka, H., and Pascual-Leone, A. (2000).
Interindividual variability of the modulatory effects of repetitive transcranial magnetic
stimulation on cortical excitability. Exp. Brain Res. 133, 425–430.
doi:10.1007/s002210000432.
Maldonado, P. P., and Angulo, M. C. (2015). Multiple Modes of Communication between
Neurons and Oligodendrocyte Precursor Cells. Neurosci. 21, 266–276.
doi:10.1177/1073858414530784.
Malone, M., Gary, D., Yang, I. H., Miglioretti, A., Houdayer, T., Thakor, N., et al. (2013).
Neuronal activity promotes myelination via a cAMP pathway. Glia 61, 843–54.
doi:10.1002/glia.22476.
Mangin, J.-M., Li, P., Scafidi, J., and Gallo, V. (2012). Experience-dependent regulation of
NG2 progenitors in the developing barrel cortex. Nat Neu 15, 1192–1194.
doi:10.1038/nn.3190.
Marik, C., Felts, P. A., Bauer, J., Lassmann, H., and Smith, K. J. (2007). Lesion genesis in a
subset of patients with multiple sclerosis: A role for innate immunity? Brain 130, 2800–
2815. doi:10.1093/brain/awm236.
Martins, T. B., Rose, J. W., Jaskowski, T. D., Wilson, A. R., Husebye, D., Seraj, H. S., et al.
(2011). Analysis of proinflammatory and anti-inflammatory cytokine serum
concentrations in patients with multiple sclerosis by using a multiplexed immunoassay.
Am. J. Clin. Pathol. 136, 696–704. doi:10.1309/AJCP7UBK8IBVMVNR.
Mason, J. L., Toews, A., Hostettler, J. D., Morell, P., Suzuki, K., Goldman, J. E., et al. (2004).
Oligodendrocytes and progenitors become progressively depleted within chronically
demyelinated lesions. Am. J. Pathol. 164, 1673–82. doi:10.1016/S0002-9440(10)63726-
1.
Curriculum vitae
~ 129 ~
Matsushima, G. K., and Morell, P. (2001). The neurotoxicant, cuprizone, as a model to study
demyelination and remyelination in the central nervous system. Brain Pathol. 11, 107–
116. doi:10.1111/j.1750-3639.2001.tb00385.x.
McLean, N. a, Popescu, B. F., Gordon, T., Zochodne, D. W., and Verge, V. M. K. (2014).
Delayed nerve stimulation promotes axon-protective neurofilament phosphorylation,
accelerates immune cell clearance and enhances remyelination in vivo in focally
demyelinated nerves. PLoS One 9, e110174. doi:10.1371/journal.pone.0110174.
Mendel, I., de Rosbo, N. K., and Ben-Nun, A. (1995). A myelin oligodendrocyte glycoprotein
peptide induces typical chronic experimental autoimmune encephalomyelitis in H-2b
mice: Fine specificity and T cell receptor V beta expression of encephalitogenic T cells.
Eur. J. Immunol. 25, 1951–1959. doi:10.1002/eji.1830250723.
Menn, B., Garcia-Verdugo, J. M., Yaschine, C., Gonzalez-Perez, O., Rowitch, D., and
Alvarez-Buylla, A. (2006). Origin of oligodendrocytes in the subventricular zone of the
adult brain. J. Neurosci. 26, 7907–7918. doi:10.1523/JNEUROSCI.1299-06.2006.
Merkler, D., Ernsting, T., Kerschensteiner, M., Brück, W., and Stadelmann, C. (2006). A new
focal EAE model of cortical demyelination: multiple sclerosis-like lesions with rapid
resolution of inflammation and extensive remyelination. Brain 129, 1972–83.
doi:10.1093/brain/awl135.
Merton, P., and Morton, H. (1980). Stimulation of the cerebral cortex in the intact human
subject.
Mi, S., Miller, R. H., Lee, X., Scott, M. L., Shulag-Morskaya, S., Shao, Z., et al. (2005).
LINGO-1 negatively regulates myelination by oligodendrocytes. Nat. Neurosci. 8, 745–
751. doi:10.1038/nn1460.
Minagar, A., and Alexander, J. S. (2003). Blood-brain barrier disruption in multiple sclerosis.
Mulitple Scler. 9, 540–549. doi:10.1191/1352458503ms965oa.
Mizoguchi, A., and Bhan, A. K. (2006). A case for regulatory B cells. J. Immunol. 176, 705–
10. doi:10.4049/jimmunol.176.2.705.
Moalem, G., Gdalyahu, a, Shani, Y., Otten, U., Lazarovici, P., Cohen, I. R., et al. (2000).
Production of neurotrophins by activated T cells: implications for neuroprotective
autoimmunity. J. Autoimmun. 15, 331–345. doi:10.1006/jaut.2000.0441.

Curriculum vitae
~ 130 ~
Moliadze, V., Antal, A., and Paulus, W. (2010). Boosting brain excitability by transcranial high
frequency stimulation in the ripple range. J Physiol 588, 4891–4904.
doi:10.1113/jphysiol.2010.196998.
Moll, N. M., Rietsch, A. M., Ransohoff, A. J., Cossoy, M. B., Huang, D., Eichler, F. S., et al.
(2008). Cortical demyelination in PML and MS. Neurology, 336–337.
Morace, R., Di Gennaro, G., Quarato, P., D’Aniello, A., Mascia, A., Grammaldo, L., et al.
(2016). Deep brain stimulation for intractabile epilepsy. J. Neurosurg. Sci. 60, 189–198.
Morell, P., Barrett, C. V, Mason, J. L., Toews, A. D., Hostettler, J. D., Knapp, G. W., et al.
(1998). Gene expression in brain during cuprizone-induced demyelination and
remyelination. Mol. Cell. Neurosci. 12, 220–7. doi:10.1006/mcne.1998.0715.
Morell, P., and Norton, W. (1980). Myelin. Sci Am 242, 88–90.
Morimoto, T., Yasuhara, T., Kameda, M., Baba, T., Kuramoto, S., Kondo, A., et al. (2011).
Striatal stimulation Nurtures endogenous neurogenesis and angiogenesis in chronic-
phase ischemic stroke rats. Cell Transplant. 20, 1049–1064.
doi:10.3727/096368910X544915.
Morrison, B. M., Lee, Y., and Rothstein, J. D. (2013). Oligodendroglia metabolically support
axons and maintain structural integrity. Trends Cell Biol 23, 1–17.
doi:10.1016/j.tcb.2013.07.007.
Mosley, K., and Cuzner, M. L. (1996). Receptor-mediated phagocytosis of myelin by
macrophages and microglia: Effect of opsonization and receptor blocking agents.
Neurochem. Res. 21, 481–487. doi:10.1007/BF02527713.
Muthuraman, M., Deuschl, G., Koirala, N., Riedel, C., Volkmann, J., and Groppa, S. (2017).
Effects of DBS in parkinsonian patients depend on the structural integrity of frontal
cortex. Sci. Rep. 7. doi:10.1038/srep43571.
Nait-Oumesmar, B., Decker, L., Lachapelle, F., Avellana-Adalid, V., Bachelin, C., and Baron-
Van Evercooren, a. (1999). Progenitor cells of the adult mouse subventricular zone
proliferate, migrate and differentiate into oligodendrocytes after demyelination. Eur. J.
Neurosci. 11, 4357–4366. doi:10.1046/j.1460-9568.1999.00873.x.
Nathan, B. Y. C. F., Murray, H. W., Wiebe, M. E., and Rubin, B. Y. (1983). Identification of
interferon-3 as the lymphokine that activates human macrophage oxidative metabolism
and antimicrobial activity. 158, 670–689.
Curriculum vitae
~ 131 ~
Nathan, C., and Ding, A. (2010). Nonresolving Inflammation. Cell 140, 871–882.
doi:10.1016/j.cell.2010.02.029.
Ng, B. K., Chen, L., Mandemakers, W., Cosgaya, J. M., and Chan, J. R. (2007). Anterograde
Transport and Secretion of Brain-Derived Neurotrophic Factor along Sensory Axons
Promote Schwann Cell Myelination. J. Neurosci. 27, 7597–7603.
doi:10.1523/JNEUROSCI.0563-07.2007.
Nikić, I., Merkler, D., Sorbara, C., Brinkoetter, M., Kreutzfeldt, M., Bareyre, F. M., et al.
(2011). A reversible form of axon damage in experimental autoimmune
encephalomyelitis and multiple sclerosis. Nat. Med. 17, 495–9. doi:10.1038/nm.2324.
Nitsche, M., and Paulus, W. (2000). Excitability changes induced in the human motor cortex
by weak transcranial direct current stimulation. J. Physiol. 527 Pt 3, 633–9.
doi:PHY_1055 [pii].
Noh, N. A., Fuggetta, G., and Manganotti, P. (2015). Theta-burst transcranial magnetic
stimulation alters the functional topography of the cortical motor network. Malaysian J.
Med. Sci. 22, 36–44.
Norwood, B. A., Bauer, S., Wegner, S., Hamer, H. M., Oertel, W. H., Sloviter, R. S., et al.
(2011). Electrical stimulation-induced seizures in rats: A “dose- response” study on
resultant neurodegeneration. Epilepsia 52, 109–112. doi:10.1111/j.1528-
1167.2011.03159.x.
Noseworthy, J., Lucchinetti, C., Rodriguez, M., and Weinshenker, B. (2000). Multiple
Sclerosis. Nwe Engl. J. Med. 343, 938–952.
O’Reardon, J. P., Solvason, H. B., Janicak, P. G., Sampson, S., Isenberg, K. E., Nahas, Z.,
et al. (2007). Efficacy and Safety of Transcranial Magnetic Stimulation in the Acute
Treatment of Major Depression: A Multisite Randomized Controlled Trial. Biol.
Psychiatry 62, 1208–1216. doi:10.1016/j.biopsych.2007.01.018.
Pangburn, M., Ferreira, V., and Cortes, C. (2008). Discrimination between Host and
Pathogens by the Complement System. Vaccine 26, I15–I21.
doi:10.1016/j.biotechadv.2011.08.021.Secreted.
Pascual-Leone, A., Davey, N. J., Rothwell, J. C., Wassermann, E. M., and Puri., B. K.
(2002). Handbook of Transcranial Magnetic Stimulation. J. Psychiatry Neurosci. 28,
406. Available at: http://www.ncbi.nlm.nih.gov/pmc/articles/PMC193984/.

Curriculum vitae
~ 132 ~
Patrikios, P., Stadelmann, C., Kutzelnigg, A., Rauschka, H., Schmidbauer, M., Laursen, H.,
et al. (2006). Remyelination is extensive in a subset of multiple sclerosis patients. Brain
129, 3165–3172. doi:10.1093/brain/awl217.
Pedraza, L., Huang, J. K., and Colman, D. (2009). Disposition of axonal caspr with respect to
glial cell membranes: Implications for the process of myelination. J. Neurosci. Res. 87,
3480–3491. doi:10.1002/jnr.22004.
Pelletier, M., Maggi, L., Micheletti, A., Lazzeri, E., Tamassia, N., Cosmi, L., et al. (2010).
Evidence for a cross-talk between human neutrophils and Th17 cells Evidence for a
cross-talk between human neutrophils and Th17 cells. 115, 335–343.
doi:10.1182/blood-2009-04-216085.
di Penta, A., Moreno, B., Reix, S., Fernandez-Diez, B., Villanueva, M., Errea, O., et al.
(2013). Oxidative Stress and Proinflammatory Cytokines Contribute to Demyelination
and Axonal Damage in a Cerebellar Culture Model of Neuroinflammation. PLoS One 8.
doi:10.1371/journal.pone.0054722.
Pikhovych, A., Stolberg, N. P., Jessica Flitsch, L., Walter, H. L., Graf, R., Fink, G. R., et al.
(2016). Transcranial Direct Current Stimulation Modulates Neurogenesis and Microglia
Activation in the Mouse Brain. Stem Cells Int. 2016, 2715196.
doi:10.1155/2016/2715196.
Pogosyan, A., Gaynor, L. D., Eusebio, A., and Brown, P. (2009). Boosting Cortical Activity at
Beta-Band Frequencies Slows Movement in Humans. Curr. Biol. 19, 1637–1641.
doi:10.1016/j.cub.2009.07.074.
Pöllinger, B., Krishnamoorthy, G., Berer, K., Lassmann, H., Bosl, M. R., Dunn, R., et al.
(2009). Spontaneous relapsing-remitting EAE in the SJL/J mouse: MOG-reactive
transgenic T cells recruit endogenous MOG-specific B cells. J Exp Med 206, 1303–
1316. doi:10.1084/jem.20090299.
Popescu, B. F., and Lucchinetti, C. F. (2012). Pathology of demyelinating diseases. Annu
Rev Pathol 7, 185–217. doi:10.1146/annurev-pathol-011811-132443.
Prayoonwiwat, N., and Rodriguez, M. (1993). The potential for oligodendrocyte proliferation
during demyelinating disease. 55–63.
Raff, M. C., Lillien, L., Richardson, W. D., Burne, J., and Noble, M. (1988). Platelet-derived
growth factor from astrocytes drives the clock that times oligodendrocyte development
in culture. Nature 336, 562–565. doi:10.1038/333562a0.

Curriculum vitae
~ 133 ~
Ridding, M. C., and Ziemann, U. (2010). Determinants of the induction of cortical plasticity by
non-invasive brain stimulation in healthy subjects. J. Physiol. 588, 2291–304.
doi:10.1113/jphysiol.2010.190314.
Rothkegel, H., Sommer, M., and Paulus, W. (2010). Breaks during 5 Hz rTMS are essential
for facilitatory after effects. Clin. Neurophysiol. 121, 426–430.
doi:10.1016/j.clinph.2009.11.016.
Rumble, J. M., Huber, A. K., Krishnamoorthy, G., Srinivasan, A., Giles, D. A., Zhang, X., et
al. (2015). Neutrophil-related factors as biomarkers in EAE and MS. J. Exp. Med. 212,
23–35. doi:10.1084/jem.20141015.
Saadoun, S., Waters, P., Bell, B. A., Vincent, A., Verkman, A. S., and Papadopoulos, M. C.
(2010). Intra-cerebral injection of neuromyelitis optica immunoglobulin G and human
complement produces neuromyelitis optica lesions in mice. Brain 133, 349–361.
doi:10.1093/brain/awp309.
Saadoun, S., Waters, P., Owens, G. P., Bennett, J. L., Vincent, A., and Papadopoulos, M. C.
(2014). Neuromyelitis optica MOG-IgG causes reversible lesions in mouse brain. Acta
Neuropathol. Commun. 2, 35. doi:10.1186/2051-5960-2-35.
Scheld, M., Rüther, B. J., Große-Veldmann, R., Ohl, K., Tenbrock, K., Dreymüller, D., et al.
(2016). Neurodegeneration Triggers Peripheral Immune Cell Recruitment into the
Forebrain. J. Neurosci. 36, 1410–1415. doi:10.1523/JNEUROSCI.2456-15.2016.
Schlegel, A. A., Rudelson, J. J., and Tse, P. U. (2012). White matter structure changes as
adults learn a second language. J Cogn Neurosci 24, 1664–1670.
doi:10.1162/jocn_a_00240.
Schmidt, T., Awad, H., Slowik, A., Beyer, C., Kipp, M., and Clarner, T. (2013). Regional
heterogeneity of cuprizone-induced demyelination: Topographical aspects of the midline
of the corpus callosum. J. Mol. Neurosci. 49, 80–88. doi:10.1007/s12031-012-9896-0.
Scholz, J., Klein, M. C., Behrens, T. E. J., and Johansen-berg, H. (2010). Training induces
changes in white matter architecture. Nat Neurosci 12, 1370–1371.
doi:10.1038/nn.2412.Training.
Serafini, B., Rosicarelli, B., Magliozzi, R., Stigliano, E., and Aloisi, F. (2004). Detection of
ectopic B-cell follicles with germinal centers in the meninges of patients with secondary
progressive multiple sclerosis. Brain Pathol. 14, 164–174. doi:10.1111/j.1750-
3639.2004.tb00049.x.

Curriculum vitae
~ 134 ~
Sherafat, M. A., Heibatollahi, M., Mongabadi, S., Moradi, F., Javan, M., and Ahmadiani, A.
(2012). Electromagnetic field stimulation potentiates endogenous myelin repair by
recruiting subventricular neural stem cells in an experimental model of white matter
demyelination. J. Mol. Neurosci. 48, 144–53. doi:10.1007/s12031-012-9791-8.
Simon, C., Götz, M., and Dimou, L. (2011). Progenitors in the adult cerebral cortex: Cell
cycle properties and regulation by physiological stimuli and injury. Glia 59, 869–881.
doi:10.1002/glia.21156.
Singh, S., Dallenga, T., Winkler, A., Roemer, S., Maruschak, B., Siebert, H., et al. (2017).
Relationship of acute axonal damage, Wallerian degeneration, and clinical disability in
multiple sclerosis. J. Neuroinflammation 14, 57. doi:10.1186/s12974-017-0831-8.
Snaidero, N., Möbius, W., Czopka, T., Hekking, L. H. P., Mathisen, C., Verkleij, D., et al.
(2014). Myelin membrane wrapping of CNS axons by PI(3,4,5)P3-dependent polarized
growth at the inner tongue. Cell 156, 277–290. doi:10.1016/j.cell.2013.11.044.
Sobottka, B., Ziegler, U., Kaech, A., Becher, B., and Goebels, N. (2011). CNS live imaging
reveals a new mechanism of myelination: The liquid croissant model. Glia 59, 1841–
1849. doi:10.1002/glia.21228.
Sommer, M., Norden, C., Schmack, L., Rothkegel, H., Lang, N., and Paulus, W. (2013).
Opposite optimal current flow directions for induction of neuroplasticity and excitation
threshold in the human motor cortex. Brain Stimul. 6, 363–70.
doi:10.1016/j.brs.2012.07.003.
Soulika, A. M., Lee, E., McCauley, E., Miers, L., Bannerman, P., and Pleasure, D. (2009).
Initiation and progression of axonopathy in experimental autoimmune
encephalomyelitis. J. Neurosci. 29, 14965–79. doi:10.1523/JNEUROSCI.3794-09.2009.
Stadelmann, C., Kerschensteiner, M., Misgeld, T., Brück, W., Hohlfeld, R., and Lassmann, H.
(2002). BDNF and gp145trkB in multiple sclerosis brain lesions: neuroprotective
interactions between immune and neuronal cells? Brain 125, 75–85.
doi:10.1093/brain/awf015.
Stadelmann, C., Wegner, C., and Brück, W. (2011). Inflammation, demyelination, and
degeneration - Recent insights from MS pathology. Biochim. Biophys. Acta - Mol. Basis
Dis. 1812, 275–282. doi:10.1016/j.bbadis.2010.07.007.
Stern, S., Agudelo-Toro, A., Rotem, A., Moses, E., and Neef, A. (2015). Chronaxie
measurements in patterned neuronal cultures from rat hippocampus. PLoS One 10, 1–
23. doi:10.1371/journal.pone.0132577.

Curriculum vitae
~ 135 ~
Stevens, B., Porta, S., Haak, L. L., Gallo, V., and Fields, R. D. (2002). Adenosine: A neuron-
glial transmitter promoting myelination in the CNS in response to action potentials.
Neuron 36, 855–868. doi:10.1016/S0896-6273(02)01067-X.
Stolt, C. C., Schlierf, A., Lommes, P., Hillgärtner, S., Werner, T., Kosian, T., et al. (2006).
SoxD Proteins Influence Multiple Stages of Oligodendrocyte Development and Modulate
SoxE Protein Function. Dev. Cell 11, 697–709. doi:10.1016/j.devcel.2006.08.011.
Suzuki, K. (1969). Giant hepatic mitochondria: production in mice fed with cuprizone.
Science 163, 81–2. doi:10.1126/science.163.3862.81.
Suzuki, K., and Kikkawa, Y. (1969). Status spongiosus of CNS and hepatic changes induced
by cuprizone (biscyclohexanone oxalyldihydrazone). Am. J. Pathol. 54, 307–25.
Available at:
http://www.pubmedcentral.nih.gov/articlerender.fcgi?artid=2013472&tool=pmcentrez&re
ndertype=abstract.
Tagge, I., O’Connor, A., Chaudhary, P., Pollaro, J., Berlow, Y., Chalupsky, M., et al. (2016).
Spatio-temporal patterns of demyelination and remyelination in the cuprizone mouse
model. PLoS One 11, 1–24. doi:10.1371/journal.pone.0152480.
Takahashi, J. L., Giuliani, F., Power, C., Imai, Y., and Yong, V. W. (2003). Interleukin-1β
promotes oligodendrocyte death through glutamate excitotoxicity. Ann. Neurol. 53, 588–
595. doi:10.1002/ana.10519.
Takebayashi, H., Nabeshima, Y., Yoshida, S., Chisaka, O., Ikenaka, K., and Nabeshima, Y.
I. (2002). The basic helix-loop-helix factor Olig2 is essential for the development of
motoneuron and oligodendrocyte lineages. Curr. Biol. 12, 1157–1163.
doi:10.1016/S0960-9822(02)00926-0.
Takeuchi, N., Chuma, T., Matsuo, Y., Watanabe, I., and Ikoma, K. (2005). Repetitive
transcranial magnetic stimulation of contralesional primary motor cortex improves hand
function after stroke. Stroke 36, 2681–2686.
doi:10.1161/01.STR.0000189658.51972.34.
Tallantyre, E. C., Bø, L., Al-Rawashdeh, O., Owens, T., Polman, C. H., Lowe, J. S., et al.
(2010). Clinico-pathological evidence that axonal loss underlies disability in progressive
multiple sclerosis. Mult. Scler. 16, 406–411. doi:10.1177/1352458510364992.

Curriculum vitae
~ 136 ~
Targett, M. P., Sussmant, J., Scoldingt, N., Leary, M. T. O., Compstont, D. A. S., and
Blakemore, W. F. (1996). Failure to achieve remyelination of demyelinated rat axons
following transplantation of glial cells obtained from the adult human brain. Neuropathol.
Appl. Neurobiol. 22, 199–206.
Terney, D., Chaieb, L., Moliadze, V., Antal, A., and Paulus, W. (2008). Increasing Human
Brain Excitability by Transcranial High-Frequency Random Noise Stimulation. J.
Neurosci. 28, 14147–14155. doi:10.1523/JNEUROSCI.4248-08.2008.
Testa-Silva, G., Verhoog, M. B., Linaro, D., de Kock, C. P. J., Baayen, J. C., Meredith, R. M.,
et al. (2014). High Bandwidth Synaptic Communication and Frequency Tracking in
Human Neocortex. PLoS Biol. 12. doi:10.1371/journal.pbio.1002007.
Trebbastoni, A., Pichiorri, F., D’Antonio, F., Campanelli, A., Onesti, E., Ceccanti, M., et al.
(2016). Altered Cortical Synaptic Plasticity in Response to 5-Hz Repetitive Transcranial
Magnetic Stimulation as a New Electrophysiological Finding in Amnestic Mild Cognitive
Impairment Converting to Alzheimer’s Disease: Results from a 4-year Prospective
Cohort S. Front. Aging Neurosci. 7, 1–10. doi:10.3389/fnagi.2015.00253.
Turi, Z., Ambrus, G. G., Janacsek, K., Emmert, K., Hahn, L., Paulus, W., et al. (2013). Both
the cutaneous sensation and phosphene perception are modulated in a frequency-
specific manner during transcranial alternating current stimulation. Restor. Neurol.
Neurosci. 31, 275–85. doi:10.3233/RNN-120297.
Vargas-Leal, V., Bruno, R., Derfuss, T., Krumbholz, M., Hohlfeld, R., and Meinl, E. (2005).
Expression and Function of Glial Cell Line-Derived Neurotrophic Factor Family Ligands
and Their Receptors on Human Immune Cells. J. Immunol. 175, 2301–2308.
doi:10.4049/jimmunol.175.4.2301.
Vlachos, A., Müller-Dahlhaus, F., Rosskopp, J., Lenz, M., Ziemann, U., and Deller, T. (2012).
Repetitive Magnetic Stimulation Induces Functional and Structural Plasticity of
Excitatory Postsynapses in Mouse Organotypic Hippocampal Slice Cultures. J.
Neurosci. 32, 17514–17523. doi:10.1523/JNEUROSCI.0409-12.2012.
Volkmann, J., Albanese, A., Antonini, A., Chaudhuri, K. R., Clarke, C. E., De Bie, R. M. A., et
al. (2013). Selecting deep brain stimulation or infusion therapies in advanced
Parkinson’s disease: An evidence-based review. J. Neurol. 260, 2701–2714.
doi:10.1007/s00415-012-6798-6.

Curriculum vitae
~ 137 ~
Wake, H., Lee, P. R., and Fields, R. D. (2011). Control of local protein synthesis and initial
events in myelination by action potentials. Science 333, 1647–51.
doi:10.1126/science.1206998.
Wan, L., Xia, R., and Ding, W. (2010). Short-term low-frequency electrical stimulation
enhanced remyelination of injured peripheral nerves by inducing the promyelination
effect of brain-derived neurotrophic factor on Schwann cell polarization. J. Neurosci.
Res. 88, 2578–87. doi:10.1002/jnr.22426.
Wang, S., Sdrulla, A. D., DiSibio, G., Bush, G., Nofziger, D., Hicks, C., et al. (1998). Notch
receptor activation inhibits oligodendrocyte differentiation. Neuron 21, 63–75.
doi:10.1016/S0896-6273(00)80515-2.
Wassermann, E. M. (1998). Risk and safety of repetitive transcranial magnetic stimulation :
report and suggested guidelines from the International Workshop on the Safety of
Repetitive Transcranial Magnetic Stimulation , June 5 – 7 , 1996. Electroencephalogr.
Clin. Neurophysiol. 108, 1–16. doi:10.1016/S0168-5597(97)00096-8.
Waxman, S. G. (1997). Axon-glia interactions: building a smart nerve fiber. Curr. Biol. 7,
R406–R410. doi:10.1016/S0960-9822(06)00203-X.
Weiner, H. (2004). Multiple sclerosis is an inflammatory t-cell–mediated autoimmune
disease. Arch. Neurol. 61, 1613–1615. Available at:
http://dx.doi.org/10.1001/archneur.61.10.1613.
Weiner, H. L. (2008). A shift from adaptive to innate immunity: A potential mechanism of
disease progression in multiple sclerosis. J. Neurol. 255, 3–11. doi:10.1007/s00415-
008-1002-8.
Whittaker, E. T. (1910). A history of the theories of aether and electricity : from the age of
Descartes to the close of the nineteenth century.
Wolf, S. D., Dittel, B. N., Hardardottir, F., and Janeway, C. A. (1996). Experimental
autoimmune encephalomyelitis induction in genetically B cell-deficient mice. J. Exp.
Med. 184, 2271–8. doi:10.1084/jem.184.6.2271.
Wolswijk, G. (1998). Chronic stage multiple sclerosis lesions contain a relatively quiescent
population of oligodendrocyte precursor cells. J. Neurosci. 18, 601–9. Available at:
http://www.ncbi.nlm.nih.gov/pubmed/9425002.

Curriculum vitae
~ 138 ~
Wrzos, C., Winkler, A., Metz, I., Kayser, D. M., Thal, D. R., Wegner, C., et al. (2014). Early
loss of oligodendrocytes in human and experimental neuromyelitis optica lesions. Acta
Neuropathol. doi:10.1007/s00401-013-1220-8.
Wu, L. M. N., Williams, A., Delaney, A., Sherman, D. L., and Brophy, P. J. (2012). Increasing
internodal distance in myelinated nerves accelerates nerve conduction to a flat
maximum. Curr. Biol. 22, 1957–1961. doi:10.1016/j.cub.2012.08.025.
Young, K. M., Psachoulia, K., Tripathi, R. B., Dunn, S. J., Cossell, L., Attwell, D., et al.
(2013). Oligodendrocyte dynamics in the healthy adult CNS: Evidence for myelin
remodeling. Neuron 77, 873–885. doi:10.1016/j.neuron.2013.01.006.
Zonta, B., Tait, S., Melrose, S., Anderson, H., Harroch, S., Higginson, J., et al. (2008). Glial
and neuronal isoforms of Neurofascin have distinct roles in the assembly of nodes of
Ranvier in the central nervous system. J. Cell Biol. 181, 1169–1177.
doi:10.1083/jcb.200712154.