modulation of monocyte-derived dendritic cell maturation
TRANSCRIPT

University of South FloridaScholar Commons
Graduate Theses and Dissertations Graduate School
6-27-2008
Modulation of Monocyte-Derived Dendritic CellMaturation and Function by Cigarette SmokeCondensate in a Bronchial Epithelial Cell Co-Culture ModelAlison J. MontpetitUniversity of South Florida
Follow this and additional works at: https://scholarcommons.usf.edu/etd
Part of the American Studies Commons
This Dissertation is brought to you for free and open access by the Graduate School at Scholar Commons. It has been accepted for inclusion inGraduate Theses and Dissertations by an authorized administrator of Scholar Commons. For more information, please [email protected].
Scholar Commons CitationMontpetit, Alison J., "Modulation of Monocyte-Derived Dendritic Cell Maturation and Function by Cigarette Smoke Condensate in aBronchial Epithelial Cell Co-Culture Model" (2008). Graduate Theses and Dissertations.https://scholarcommons.usf.edu/etd/413
Modulation of Monocyte-Derived Dendritic Cell Maturation and Function by
Cigarette Smoke Condensate in a Bronchial Epithelial Cell Co-Culture Model
by
Alison J. Montpetit
A dissertation submitted in partial fulfillment of the requirements of the degree of
Doctor of Philosophy College of Nursing
University of South Florida
Major Professor: Mary E. Evans, Ph.D. Co-Major Professor: Shyam S. Mohapatra, Ph.D.
Maureen Groer, Ph.D. Jason Beckstead, Ph.D.
Stuart Brooks, Ph.D.
Date of Approval: June 27, 2008
Keywords: immune, cytokine, lung, tobacco, pulmonary
© Copyright 2008, Alison J. Montpetit
Dedication
This dissertation is dedicated to my family for their continued support and
sacrifice during my PhD work and to our unborn baby, Weston Louis who unknowingly
motivated me to persevere.

Acknowledgements
I would like to acknowledge my major professor, Dr. Mary Evans who always
supported my ambitions and my co-major professor, Dr. Shyam Mohapatra who gave
me the opportunity to explore the basic sciences. To the committee members, Dr.
Maureen Groer for being a wonderful mentor, Dr. Jason Beckstead for always taking
time and giving great advice and Dr. Stuart Brooks for continued encouragement and
many wonderful articles. I would also like to thank Dr. Richard Lockey and the Joy
McCann Culverhouse Airway Disease Center for the opportunity and wonderful lab
experiences and a special thank you to Shawna Shirley for her mentorship, friendship
and encouragement during many late nights in the lab. I would also like to acknowledge
my family (Doug and Shelia Free, Tony, Andrea, Alex, Tyler and Ashley Jones, Kerry,
Erica, Kulyn and Adley Hubbard, Frances Osborne and Letha Nix) and my friends
(Kristin and Kyle Crawford and Shawna and Karl Gilman) for their love, inspiration,
support, prayers, patience and understanding throughout my time at the University of
South Florida. To my superman husband Marty Montpetit, PhD, we struggled through
our PhD work together and survived. Thank you for your unconditional love,
understanding and words of affirmation. I would also like to acknowledge the National
Institute of Nursing Research (F31 NRSA) and the Joy McCann Culverhouse
endowment for providing fellowship and funding support throughout my pre-doctoral
training.
i
Table of Contents
List of Figures iv List of Tables v List of Abbreviations vi Abstract ix Chapter One - Introduction 1 Chapter Two - Review of Literature 5 Bronchial Epithelial Mucosa as First Line of Defense 5 Dendritic Cells: The Professional Antigen Presenting Cell 6 Epithelial and Dendritic Cell Interaction 9 Cigarette Smoke as an Oxidant Stressor 10 Effects of Cigarette Smoke on Humans in vivo 11 Effects of Cigarette Smoke on Murine Dendritic Cells in vivo 12 Effects of Cigarette Smoke on Human Dendritic Cells in vitro 13 Polyinosinic-Polycytidylic Acid as an Immunological Stimulant 14 Chapter Three - Method 17 Purpose 17 Hypothesis 18 Specific Aims and Research Questions 19 Specific aim 1 20 Specific aim 2 21 Materials 22
ii
Normal human bronchial epithelial cell culture 22 Monocyte-derived dendritic cells culture 23 Co-culture of NHBE and MDDC cells 24 Treatment of cell cultures with CSC 25 Homotypic clustering of DC 26 Quantification of cytokines by multi-plex bead assay 28
Determination of viability and phenotypic maturation of MDDC by immunofluorescence labeling and flow cytometry 30 Determination of functional maturation of MDDC by endocytosis assay 31
Proliferation and polarization of allogeneic CD4+ TC in response to CSC exposed and/or poly I:C stimulated MDDC 32 Data Analysis 34 Chapter Four - Results 36 Characteristics of the Sample 36 Experimental Conditions Do Not Affect DC viability 38 CSC Induces Homotypic Clustering in Non-Stimulated Co-Cultures 39 CSC Reduces Phagocytosis in Non-Stimulated Co-Cultures 41 CSC Induces Maturation-Associated Co-Stimulatory and Adhesion Molecules 42 CSC Failed to Significantly Affect Dendritic Cell Cytokines 46 CSC Failed to Induce TC Proliferation but Enhances Th2 Cytokine Production 48 Chapter Five - Discussion 55 Summary of Findings 55
iii
Limitations 60 Future Directions 61 Significance to Nursing 62 References 63 Appendices 75 Appendix A: Definitions 76 About the Author End Page
iv
List of Figures Figure 1 Structure of poly I:C 16 Figure 2 Conceptual model 18 Figure 3 Working model 19 Figure 4 Aim 1 experimental schema 20 Figure 5 Aim 2 experimental schema 22 Figure 6 Generation of the co-culture model 25 Figure 7 Homotypic cluster scoring 28 Figure 8 Pairwise comparisons for dependent variables 35 Figure 9 Dendritic cell viability 38 Figure 10 Dendritic cell homotypic clustering 40 Figure 11 Dendritic cell phagocytosis 42 Figure 12 Dendritic cell surface markers: Controls, CD11c, HLA-DR 44 Figure 13 Dendritic cell surface markers: CD80, CD83, CD86, CD54 45 Figure 14 Dendritic cell cytokines and chemokines 47 Figure 15 T cell proliferation: Flow cytometry 50 Figure 16 T cell proliferation: Percent proliferation 51 Figure 17 T cell cytokines 52 Figure 18 Summary of findings 59

v
List of Tables
Table 1 Homotypic clustering scoring system 27 Table 2 Cytokine and chemokine analysis 30 Table 3 Dendritic cell surface marker analysis 32 Table 4 Descriptive statistics of all dependent variables 37 Table 5 Dendritic cell viability 38 Table 6 Dendritic cell homotypic clustering 41 Table 7 Dendritic cell phagocytosis 42 Table 8 Dendritic cell surface markers 46 Table 9 Dendritic cell cytokines and chemokines 48 Table 10 T cell proliferation: Percent proliferation 51 Table 11 T cell cytokines 53 Table 12 Th1/Th2 cytokine ratios 54
vi
List of Abbreviations
7-AAD: 7-amino-actinomycin
APC: allophycocyanin
BALF: bronchoalveolar lavage fluid
BDCA: blood dendritic cell antigen
CCL20: C-C motif ligand 20
CFSE: carboxyfluoroscein succinimidyl ester
CSC: cigarette smoke condensate
CSCH: cigarette smoke condensate high dose, 50 μg/ml
CSCL: cigarette smoke condensate low dose, 10 μg/ml
CSE: cigarette smoke extract
CD: cluster of differentiation
COPD: chronic obstructive pulmonary disease
DC: dendritic cells
DEP: diesel exhaust particulate
DMSO: dimethyl sulfoxide:
EC: epithelial cells
eta2: eta squared
ETS: environmental tobacco smoke
FITC: fluorescein isothiocyanate
GMCSF: granulocyte macrophage colony stimulating factor
HLA-DR: human leukocyte derived antigen:
vii
ICAM1: intracellular adhesion molecule 1, also known as CD54
IFNγ: interferon gamma
IP10: interferon-inducing protein 10
IL: interleukin
LN: lymph nodes
Log: logarithm base 10
LPS: lippolysaccharide
μg: microgram
MFI: mean fluorescence intensity
MHC: major histocompatibility complex
ml: milliliter
MLR: mixed lymphocyte reaction
mDC: myeloid dendritic cells
MDDC: monocyte-derived dendritic cells
NHBE: normal human bronchial epithelial cells
OS: oxidant stress:
PBMC: peripheral blood mononuclear cells
pDC: plasmacytoid dendritic cells
PE: phycoerythrin
PFA: paraformaldehyde
pg: picogram
PHA: phytohemmaglutinin
Poly I:C: polyinosinic-polycytidylic acid
SEM: standard error of the mean
siRNA: short interfering ribonucleic acid
viii
TC: T cells
TCR: T cell receptor
TGFβ: transforming growth factor beta
Th0: T helper type 0, T regulatory
Th1: T helper type 1
Th2: T helper type 2
TLR3: toll-like receptor 3
TNFα: tumor necrosis factor alpha
Treg: T regulatory, Th0
TSLP: thymic stromal lymphopoietin
ix
Modulation of Monocyte-Derived Dendritic Cell Maturation and Function by Cigarette
Smoke Condensate in a Bronchial Epithelial Cell Co-Culture Model
Alison J. Montpetit
ABSTRACT Lung airway epithelium is the first line of defense against inhaled particulates
such as cigarette smoke. Subepithelial dendritic cells (DC) survey the airway epithelial
lining and represent the link between innate and adaptive immune response. No study
has investigated the effect of cigarette smoke on DC in the presence of epithelial cells
(EC). The purpose of this 4x2 factorial design study was to co-culture normal human
bronchial epithelial (NHBE) cells with monocyte-derived dendritic cells (MDDC) and
examine the effect of cigarette smoke condensate (CSC) and poly I:C stimulation (TLR3
ligand that mimics viral infection) on MDDC homotypic clustering, phagocytosis ability,
surface marker expression, DC cytokine response, T cell (TC) proliferation and TC
cytokine response. Experiments were performed with MDDC and TC derived from four
individual donors. Two planned comparisons (DMSO vehicle control compared to CSC
high dose in both the no poly I:C and poly I:C stimulated groups) were analyzed. In
MDDC stimulated with CSC, there was a significant increase in homotypic clustering,
reduced phagocytosis, increased CD54, increased CD83 and CD86 maturation marker
expression. Although no significant changes were observed in MDDC cytokine
production, IL10 exhibited a trend to increase with CSC exposure but failed to reach
statistical significance. Despite evidence that CSC exposed MDDC are maturing, there
was no increase in TC proliferation; however in poly I:C stimulated co-cultures, CSC
x
exposure increased IL2, IL5, IL10 and IL13 expression while non-stimulated co-cultures
exhibited an increase in IL10 following CSC exposure. This study indicates that
cigarette smoke has the ability to decrease phagocytosis ability of DC and increases co-
stimulatory maturation markers without inducing TC proliferation and potentiating a Th2
environment. These findings suggest that DC of smokers may be less likely to mount a
normal immune response to invading pathogens thus providing evidence for smoker
susceptibility to infection and how DC of smokers may respond to viral infection. In
addition, these findings are particularly important in patients with allergic airway disease
since increasing Th2 cytokines would increase the risk for disease exacerbation.
1
Chapter One
Introduction
Cigarette smoking has been identified as the most important cause of
preventable morbidity and mortality in the United States. Over 438,000 Americans die
annually from diseases directly related to smoking (American Lung Association, 2006).
In the United States, conservative estimates of the economic burden due to smoking are
$167 billion in direct healthcare costs, $92 billion in lost productivity and $75 billion in
excess medical expenditures (American Lung Association, 2006). Approximately 8.6
million Americans have at least one serious illness caused by smoking (American Lung
Association, 2006).
For people suffering with lung disease, breathing is often a daily challenge.
Symptom management of lung disease is a vital component of therapy. Relieving
dyspnea and breathlessness by encouraging smoking cessation is one of the most
effective strategies. Despite efforts of nurses and other health care professionals to
educate smokers of the risk of pulmonary disease, many continue to smoke and
approximately 15 billion cigarettes are smoked worldwide every day (American Lung
Association, 2003). In addition, over 50% of teenagers aged 13-15 who claim to have
never smoked are exposed to secondhand smoke in the home (Centers for Disease
Control and Prevention, 2007). There is a need to conduct research that explores
immune responses to cigarette smoke and potential use of immune modulating
therapies and their effects on the pulmonary system in smokers and nonsmokers.
2
Lung airway epithelium is the first line of defense against inhaled particulates
such as cigarette smoke and represents a component of the innate immune response.
Dendritic cells (DC) in the respiratory tract are professional antigen presenting cells that
reside within the epithelium, submucosa and lung parenchyma (Lambrecht & Hammad,
2003; Upham & Stick, 2006). One function of the DC is to survey the lung environment
for antigens, microbes and dead or dying cells (Rossi & Young, 2005). DC also link the
innate immune response with the adaptive immune response and play a key role in not
only antigen presentation but also in determining Th1 and Th2 immune responses.
Cigarette smoke has been shown to suppress DC function and lead to an induction of
Th2 immune response thus potentiating the allergic response (Vassallo & Chen, 2004;
Vassallo, Tamada, Lau, Kroening, & Chen, 2005). In addition, the crosstalk between
epithelial cells (EC) and DC has been shown to be especially important in airway
inflammation and asthma (Lambrecht & Hammad, 2003; Upham & Stick, 2006).
Several studies have shown that smokers and people exposed to secondhand
smoke are at increased risk for infections (Carroll et al., 2007) and at high risk for the
development of chronic obstructive pulmonary disease (COPD) and asthma (Goodwin,
2007; Halken, 2004; Teramoto, 2007). Asthmatics who smoke are less responsive to
corticosteroid therapy than non-smoking asthmatics (Thomson, Shepherd, Spears, &
Chaudhuri, 2006), making treatment of patients who smoke quite challenging for health
care providers. In addition, patients with asthma and/or COPD who smoke or are
exposed to secondhand smoke are more prone to disease progression and exacerbation
(Alvarez, Schulzer, Jung, & Fitzgerald, 2005; Eisner & Iribarren, 2007; Eisner et al.,
2005; Kanner, Anthonisen, & Connett, 2001; Koga, Oshita, Kamimura, Koga, & Aizawa,
2006; Wark & Gibson, 2006).
3
Lung disease exacerbation is linked with a decline in lung function, decreased
quality of life and increased morbidity and mortality (Bai, Vonk, Postma, & Boezen, 2007;
Cote, Dordelly, & Celli, 2007; Donaldson, Seemungal, Bhowmik, & Wedzicha, 2002;
Rogers, Adelroth, Hattotuwa, Dewar, & Jeffery, 2007). Studies indicate that cigarette
smoke has the ability to modulate the immune response most likely, dampening the Th1
type immune response and favoring a Th2 type immune response. Despite recent
advances in research related to the immune response to cigarette smoke exposure, the
exact mechanisms of smoker vulnerability remains unclear.
One possible explanation for the increased risk of infection, inflammation and
exacerbation of pulmonary disease in smokers is that smokers have fewer numbers of
DC in the bronchial mucosa. This finding was observed in bronchial biopsies of patients
with COPD who smoke compared with non-smoking normal, asthmatic and COPD
controls (Rogers et al., 2007). In addition, one study reported observing significantly
less CD83+ mature DC in the airways of smoking asthmatics when compared to non-
smoking asthmatics and healthy non-smoking controls (Tsoumakidou et al., 2007). This
phenomenon has also been observed in cord blood from neonates of smoking mothers
(Pachlopnik Schmid et al., 2007). This study reported a significant decrease in all
leukocytes including CD11c+ myeloid and CD123+ lymphoid DC. By decreasing the
number of DC in the airways, the innate immune system's ability to respond is hindered;
however, the potential mechanism requires further inquiry as this observation may
merely be explained by migration of DC to the lymph nodes, other tissues or down-
regulation in surface marker expression.
Despite overwhelming evidence that smoking is harmful, it cannot be ignored that
evidence suggests a protective effect of tobacco smoking against certain diseases
including, but not limited to: Parkinsons' and Alzheimer's disease (Fratiglioni & Wang,
4
2000), sarcoid arthritis (Visser et al., 2002), and ulcerative colitis (Mahid, Minor, Soto,
Hornung, & Galandiuk, 2006). Interestingly, these diseases have an inflammatory or
autoimmune component and particulates in cigarette smoke and/or nicotine may
suppress the immune response and potentially protect against these diseases. Overall,
it is clear that cigarette smoking modulates the immune system by activation and
suppression making research inquiry complex.
People who smoke face often face challenges in the life-dependent act of
breathing. Nursing care is guided toward symptom assessment and management as
well as playing a critical role in educating patients and family regarding symptom
management, smoking cessation, disease pathophysiology and progression, and
prevention of exacerbations.
No study has investigated the effect of cigarette smoke in DC in the presence of
epithelial cells (EC). By specifically studying the interaction of DC and EC exposed to
cigarette smoke particulates, this study will provide focused insight into the immune
effects of smoke and the link between innate and adaptive immunity. This will add to the
body of knowledge regarding smoke immunomodulation enabling nurses and other
health care providers to improve current methods of diagnosis, symptom management
and monitoring in order to prevent disease exacerbation. In chapter two, a review of the
literature will be presented in order to further develop the concepts to be investigated in
this study.
5
Chapter Two
Review of Literature
Bronchial Epithelial Mucosa as First Line of Defense
Bronchial EC play a critical role in protecting submucosal tissue from inhalation
injury by entrapment and removal of particulates by mucous secreting goblet cells,
ciliated cells, and intact tight junctions. Although this is a key function of the bronchial
lining, recent advances in immunology research have indicated that EC play an
important role in linking the innate and adaptive immune systems. This is evident in the
ability of EC to secrete cytokines and chemokines in response to inhaled allergens,
pollutants and chemicals that lead to inflammatory cell recruitment, airway remodeling
and development or potentiation of airway disease such as asthma, emphysema and
chronic bronchitis (Gershwin, 2007; Kato & Schleimer, 2007; Lambrecht & Hammad,
2003; Schleimer, Kato, Kern, Kuperman, & Avila, 2007; Upham & Stick, 2006).
The immune system is composed of two major branches: innate and adaptive
immunity. The innate immune response is the body's first line of defense against
infection and hinges on the ability to recognize self from non-self. EC in the pulmonary
system are heavily equipped with numerous systems that protect the body from
microbial, viral, chemical and particulate invasion. Some of these mechanisms include
but are not limited to the complement system, collectins, mucins, reactive oxygen
species and toll-like receptors (Ezekowitz & Hoffman, 2003; Schleimer et al., 2007). In
addition to the innate immune system, EC play a role in the adaptive immune system.
6
The adaptive immune system response is characterized by antigen
processing/presentation and induction of a memory response to specific antigens and
involves many cells including T and B cells. This review will focus primarily on one type
of antigen presenting cell, DC.
Dendritic Cells: The Professional Antigen Presenting Cell
DC represent 1-2% of peripheral blood mononuclear cells and approximately
0.5% of cells found in bronchoalveolar lavage fluid (BALF) (Donnenberg & Donnenberg,
2003; Tsoumakidou, Tzanakis, Papadaki, Koutala, & Siafakas, 2006; van Haarst et al.,
1994). In humans, there are two major types of DC, myeloid (mDC) and plasmacytoid
(pDC). Myeloid DC express the surface marker CD11c and capture antigen by
phagocytosis and macropinocytosis. Plasmacytoid DC are derived from a lymphoid
lineage, do not express CD11c and are inefficient in phagocytosis (Schuurhuis, Fu,
Ossendorp, & Melief, 2006). Both mDC and pDC have the ability to induce Th1 and Th2
type responses but the response is primarily determined by environmental stimuli such
as pulmonary inflammation.
Both types of DC exist in the lungs; however, mDC are predominate and they are
located in the conducting airway, interstitium and alveoli (de Heer, Hammad, Kool, &
Lambrecht, 2005; Iwasaki, 2007). One study reported 0.06% of pDC in BALF and
0.47% mDC and demonstrated an increase in both pDC and mDC following a segmental
allergen challenge (Bratke et al., 2007). In addition, one study investigated DC in lung
digests and the presence of blood DC antigen (BDCA), a marker used to subtype blood
DC. This study showed four subtypes of DC in the lungs: mDC1 (BDCA1+/HLA-DR+),
mDC2 (BDCA3+/HLA-DR+), pDC (BDCA2+/CD123+) and CD1a+ DC in the conducting
airway epithelium (Demedts, Brusselle, Vermaelen, & Pauwels, 2005). Another study
7
confirmed the presence of the three subtypes (mDC1, mDC2, pDC) in BALF
(Tsoumakidou et al., 2006). It is apparent that with advances in flow cytometry
techniques and identification of surface markers, more pulmonary DC subtypes will be
elucidated.
DC are key in directing immune responses throughout the body, but for the
purposes of this review, only pulmonary DC are examined. In the lungs, DC are located
within the lung epithelium and interstitium and perfectly placed for sampling the bronchial
airway for inhaled antigens and particulates (Grayson, 2006; Lambrecht, Prins, &
Hoogsteden, 2001). Studies have shown that DC that reside underneath and within the
epithelium are able to extend their dendrites through epithelial tight junctions in order to
sample the airway. The DC then migrate to draining lymph nodes where they confer
antigen-specific responses. Pulmonary inflammation plays a key role in the maturation
process and trafficking of DC.
Immature DC phagocytose/endocytose bacteria, allergens, pollutants and
cellular debris in the airway. They then process the antigen and carry immune signals
from the periphery or site of capture to the secondary lymphoid tissue where, after
maturation, they present antigen to TC (Cook & Bottomly, 2007). Pulmonary DC are the
sentinels of the lung and they direct clonal expansion of TC by cross-presentation of
allergens to CD4+ T helper cells, CD8+ cytotoxic TC and are the only cells capable of
priming naïve TC (Cools, Ponsaerts, Van Tendeloo, & Berneman, 2007; Novak &
Bieber, 2008).
The response of naive T helper cells after contact with pathogen-specific, mature
DC is determined by three main signals: 1) antigen specific (by engagement of the TC
receptor by MHC class II), 2) co-stimulation and 3) polarization. Signal 1 is
characterized by antigen specificity. Signal 2 provides protective immunity by co-
8
stimulatory molecules and if signal 2 is not present, it leads to TC anergy and potentially
tolerance. Signal 3 is important in determining the balance of cytokine production from
primed TC. There is a functional difference in DC and TC depending on the micro-
environment of the third signal. It is unclear where all of these third signals originate but
the micro-environment, character of antigen, and the affected tissue all play a critical
role. Since DC are in close proximity to EC, it is hypothesized that polarizing signals
may be driven by EC (Kalinski, Hilkens, Wierenga, & Kapsenberg, 1999; Kapsenberg,
2003; Schuurhuis et al., 2006).
Naïve TC generally have four broad fates including: Th1, Th2, Th17 and Treg.
For the purposes of this review, only CD4+ TC subsets will be discussed. Th1 is
primarily characterized by IFNγ and TNFα release; Th2 is primarily characterized by IL4,
IL5 and IL13 release, Th17 by IL17 and Treg by IL10 and TGFβ. An imbalance towards
one type has been implicated in many diseases for example, Th1 in autoimmune
diseases, Th2 in allergic diseases, Th17 in chronic inflammatory and autoimmune
disorders and Treg in cancer and immunosuppression (Hammad & Lambrecht, 2006;
Romagnani, 2006).
Many antigens induce DC maturation following uptake resulting in TC activation;
however, most antigens fail to induce maturation requiring secondary signals from the
micro-environment (Kalinski et al., 1999; Kapsenberg, 2003). This is a critical balance
since approximately 10,000 L of air circulate through the lungs every day exposing EC
and DC to many particles (Cook & Bottomly, 2007). In fact, the outcome of inhalation of
most harmless antigens results in tolerance. Under steady state conditions, DC remain
in an immature or semi-mature state during which they are continue to phagocytize
antigen and have high expression of receptors for pro-inflammatory chemokines and
cytokines (Novak & Bieber, 2008). This active process is characterized by tolerogenic
9
DC presenting antigen to naïve TC which in turn acquire regulatory TC (Treg) properties
including Foxp3+, production of IL10 and TGFβ, the ability to suppress Th1 and Th2
processes. There is some debate about characteristics of tolerogenic DC but generally
these DC are considered semi-mature, are inefficient at phagocytosis of antigen,
produce IL10 and are less motile but may express maturation/co-stimulatory molecules
(Cook & Bottomly, 2007; Morelli & Thomson, 2007; Reis e Sousa, 2006; Steinman,
Hawiger, & Nussenzweig, 2003).
Epithelial and Dendritic Cell Interaction
EC are the first contact with inhaled particulates and they play a critical role in
regulation of immune responses through interactions with DC, TC and B cells among
others. This review will focus specifically on EC and DC interactions. EC may play a
role in recruitment of DC into the airways via macrophage inflammatory protein 3 alpha
also known as chemokine (C-C motif) ligand 20 (CCL20) and possess the ability to
polarize DC to a Th1 or Th2 directing phenotype (Kao et al., 2005; Thorley, Goldstraw,
Young, & Tetley, 2005). One example, EC-derived thymic stromal lymphopoietin (TSLP)
secretion directs DC to activate naïve TC to Th2 cells that produce IL4, IL3, TNF but not
IL10 or IFNγ (Kato, Favoreto, Avila, & Schleimer, 2007; Lee & Ziegler, 2007; Liu et al.,
2007).
One example of the importance of EC-DC interaction is shown by the effect of
diesel exhaust particulates (DEP) to induce DC maturation marker CD80, CD83, CD86
and TC proliferation when DC and EC are co-cultured and this effect is not observed
when DC are cultured alone (Bleck, Tse, Jaspers, Curotto de Lafaille, & Reibman,
2006). In this study, supernatant from DEP-exposed EC induced DC maturation and
was equivalent to DC cultures with DEP-exposed EC, suggesting that soluble mediators
10
rather than direct cell-to-cell contact are critical for DC maturation and function. In
addition, when a blocking antibody (Ab) and short interfering RNA (siRNA) to the growth
factor, granulocyte-macrophage colony-stimulating factor (GMCSF) was administered to
DEP-exposed EC cultures, DC failed to induce TC proliferation (Bleck et al., 2006). This
finding suggests the critical role of EC-derived GMCSF in DC maturation and function.
This study did not evaluate the cytokine production of TC from the MLR; therefore, it is
unknown if DEP-exposed EC co-cultured with DC induce TC to produce Th1 or Th2
cytokines. Based upon this study, it is reasonable that cigarette smoke-exposed EC
culture may modulate patterns of DC maturation and TC proliferation when cultured with
DC since cigarette smoke and DEP are both pro-inflammatory and potent oxidant
stressors.
Cigarette Smoke as an Oxidant Stressor
The pathogenesis of many lung diseases such as chronic obstructive pulmonary
disease (COPD) and asthma may be a function of free oxygen radicals or oxidant
mediators which can act as immune adjuvants, enhancing the response to inhaled
allergens or antigens (Nouri-Shirazi & Guinet, 2006; Siafakas & Tzortzaki, 2002; Sopori,
2002; Tsoumakidou et al., 2007). A number of environmental stimuli or oxidant
mediators induce cellular oxidative stress (OS) that stimulates several biological effects
such as, increased inflammation and mucous production, decreased cilia function,
impaired surfactant activity, promotion of epithelial permeability, inhibition of
glucocorticoid responses and many others (Repine, Bast, & Lankhorst, 1997). All these
effects compromise the effectiveness of the innate immune system.
Conceptually, OS has been defined as a loss of balance in which oxidation
exceeds the antioxidant systems in the body. One cause of OS in the lungs is cigarette
11
smoke. Cigarette smoke has approximately 1017 oxidants/free radicals and 4,800
chemical compounds which increases the oxidant burden in smokers and the risk of
developing pulmonary disease through chronic inflammatory processes and increasing
airspace permeability (American Lung Association, 2006; MacNee, 2000; Marwick et al.,
2002; Moodie et al., 2004). The respiratory tract is extremely differentiated and its ability
for gas exchange is dependent on thin epithelial cell membranes in the respiratory tract
and are the first contact with air particulates, making them more susceptible to the
environment and cigarette smoke than other tissues; thus, they are more vulnerable to
reactive oxygen species that can cause cellular damage and alter in the immune
response by increased susceptibility to inflammation and infection (Jyonouchi, 1999;
Lambre et al., 1996).
Effects of Cigarette Smoke on Humans in vivo
Several studies have investigated the effect of cigarette smoke in humans.
Smokers have dramatically fewer numbers of DC in the bronchial mucosa which was
observed in bronchial biopsies of patients with COPD who smoke compared with non-
smoking normal, asthmatic and COPD non-smoking controls (Rogers et al., 2007). In
fact, COPD ex-smokers had similar numbers of DC as asthmatics; therefore, the
reduction in DC is not a function of the disease process. The location of these DC were
determined by transmission electron microscopy images which revealed the presence of
DC primarily in the bronchial mucosa epithelium and subepithelium (Rogers, Adelroth,
Hattotuwa, Dewar, & Jeffery, 2008).
One study reported significantly less CD83+ mature DC in the bronchial biopsies
of smoking asthmatics compared to non-smoking asthmatics and healthy non-smoking
controls (Tsoumakidou et al., 2007). However, another study did not find a difference in
12
CD83+ DC in bronchoalveolar lavage fluid (BALF) of smokers versus never smokers.
They did observe a difference in CD80+ and CD86+ DC in smokers. In addition, they
reported decreased expression of CCR7, a lymph node homing receptor that is
important in migration, suggesting that the reduction in DC is not due to DC migration.
In a randomized, placebo-controlled trial, non-smoking allergic subjects were
exposed to two hours of environmental tobacco smoke (ETS) or clean air then subjected
to a nasal challenge with ragweed allergen or saline and nasal lavages were obtained.
Twenty-four hours after ETS exposure with allergen challenge, there was a significant
increase in ragweed-specific IgE, histamine, IL4, IL5 and IL13 and a significant reduction
in IFNγ, when compared with clean air exposure with allergen challenge (Diaz-Sanchez,
Rumold, & Gong, 2006). This study was the first to show evidence in humans that
cigarette smoke can directly exacerbate allergic disease.
Effects of Cigarette Smoke on Murine Dendritic Cells in vivo
Several studies have investigated the effect of smoke in murine models. One
study exposed mice to two cigarettes per day, five days a week for two months. They
reported a significant decrease in the number of CD11c+/MHC-II+ in smoke exposed
mice compared with controls. In addition, this trend preceded emphysematous lesions
in the lungs and was lung specific as there was no reduction in DC in regional lymph
nodes (Robbins et al., 2004). This provides evidence that smoke effects on lung DC are
not merely a result of DC migration.
Another murine study where mice were exposed to 6 cigarettes a day, five days
a week for one month confirmed this reduction in pulmonary CD11c+ DC and reported
that antigen induced migration to draining lymph nodes was not affected by smoke
exposure. In addition, they reported a reduction in MHC-II, CD80 and CD86 but no
13
effect on CD40 in DC within the lymph nodes. They also observed a reduction in TC
proliferation and significantly less CD4+ TC IL2 production from smoke exposed mice
when compared to control (Robbins, Franco, Mouded, Cernadas, & Shapiro, 2008).
Effects of Cigarette Smoke on Human Dendritic Cells in vitro
Clinical evidence described previously suggests that smokers are more prone to
Th2 type response. Since DC have the ability to sample the bronchial airway, take up
smoke particulates and are key mediators of immune response, it is reasoned that DC
function and DC-induced TC response may be affected by cigarette smoke. Only two
studies have evaluated the effects of cigarette smoke on human DC function.
The first study investigated the role of cigarette smoke extract (CSE), the
particulate phase of smoke on DC co-stimulatory markers (CD40, CD80, CD83, CD86),
TC proliferation (BrdU assay) and polarization of TC cytokine response (IL2, IL4, IL10,
IFNγ). This study provided evidence that CSE suppresses maturation markers (CD40,
CD80, CD86) and suppresses IL12 and enhances IL10 production. In addition, CSE-
exposed DC inhibit TC proliferation and promote Th2 (IL4) cytokine release from TC.
Together, this suggests that smoke suppresses DC functions and potentiates a Th2
response (Vassallo et al., 2005).
The second study investigated TC proliferation (CFSE assay) and cytokine
response (IL12p70, IL4, IFNγ) in response to DC cultured with nicotine and matured
under non-polarized or polarized Th1 and Th2 conditions (Nouri-Shirazi & Guinet,
2006). The study provided evidence that nicotine exposed DC are able to induce TC
proliferation but not Th2 differentiation (IL4 secretion) unless under a Th2 polarizing
condition described as exposure to IL1β, TNFα and prostaglandin E2.
14
In these two studies, DC were cultured alone. As discussed previously, DEP-
treated DC did not induce TC proliferation when DC were cultured alone. This is the
same observation with cigarette smoke in the first study but not in the nicotine study.
This discrepancy may be a function of particulates in smoke-exposed EC. It has been
shown that smoke-exposed bronchial EC produce pro-inflammatory cytokines including,
IL6 and IL8; however, it has also been shown that smoke induces downregulation of
GMCSF in lippolysaccaride (LPS)-treated EC (Glader et al., 2006; Li, Xu, & Shen, 2007;
Phillips, Kluss, Richter, & Massey, 2005). GMCSF was shown to have significant effects
on DC maturation in DEP-exposed co-cultures of DC and EC (Bleck et al., 2006).
By culturing DC with smoke-exposed EC, it will take into account the impact of
the tissue micro-environment on environmental exposures. Therefore, the proposed
study will provide insight into EC-DC interactions in smoke exposure and may provide
evidence for disease and infection susceptibility in cigarette smokers.
Polyinosinic-Polycytidylic Acid as an Immunological Stimulant
A major signal for DC priming are toll-like receptors (TLR) which are highly
conserved immune receptors responsible for recognition of pathogen-associated
molecular patterns (PAMP) of bacteria and viruses thereby initiating the immune
response (Duez, Gosset, & Tonnel, 2006; Guillot et al., 2005; Kapsenberg, 2003).
Specifically, TLR3 recognizes double stranded RNA (dsRNA) of viruses such as
influenza and rhinovirus and induces a potent antiviral response (Doyle et al., 2003;
Guillot et al., 2005; Hewson, Jardine, Edwards, Laza-Stanca, & Johnston, 2005). In both
epithelial and monocyte-derived DC, TLR3 is primarily located in the cytoplasm and
endoplasmic vesicles (Ciencewicki, Brighton, Wu, Madden, & Jaspers, 2006; Duez et al.,
2006).
15
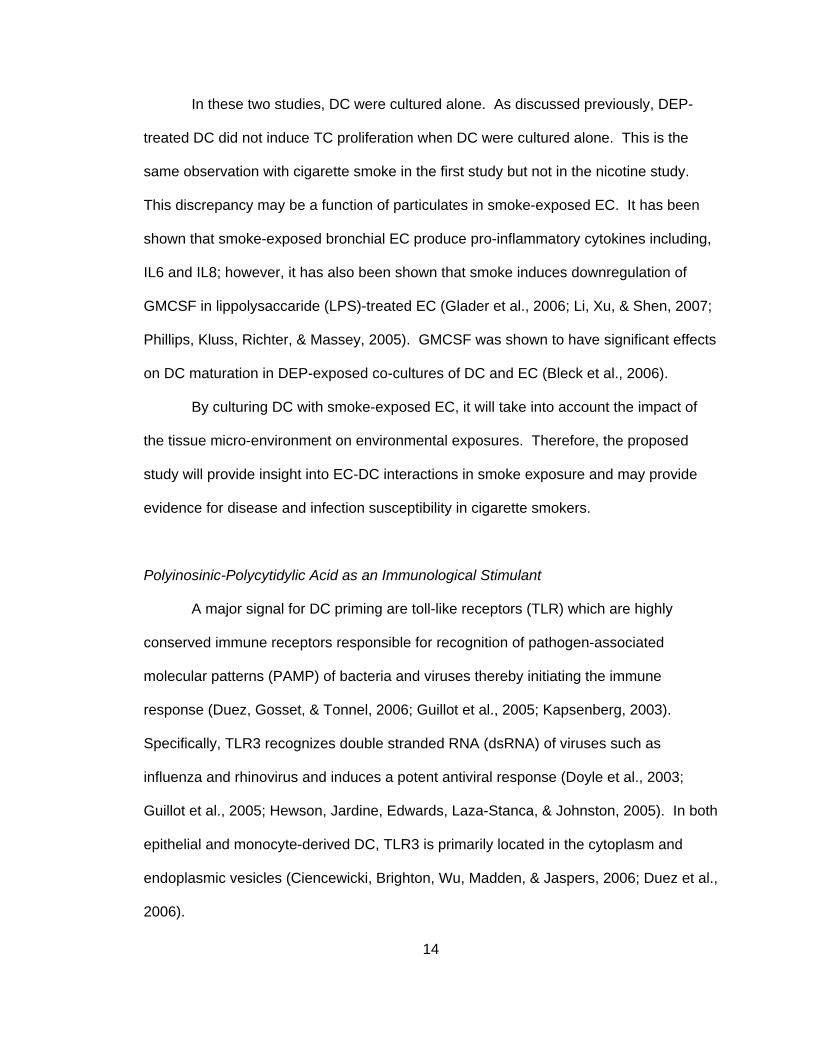
Poly I:C (Figure 1) is a TLR3 ligand and a dsRNA that mimics the effects of viral
infections (Marshall-Clarke et al., 2007). EC stimulated with poly I:C have been shown
to up-regulate numerous pro-inflammatory cytokines (IL1β, IL6), growth factor (GMCSF),
chemokines (IP10, IL8) and adhesion molecules such as ICAM-1 (Matsukura et al.,
2006; Ritter, Mennerich, Weith, & Seither, 2005). DC stimulated with poly I:C exhibit
stable maturation and produce high levels of IL12, low levels of IL10 and a strong TC
proliferative response (Verdijk et al., 1999). In addition, poly I:C-stimulated DC retain the
ability to produce IL12p70 even after the initial maturation stage, thus driving a Th1
response (Rouas et al., 2004; Verdijk et al., 1999).
One study revealed that diesel exhaust enhanced poly I:C-induced expression of
TLR3, interferon beta and IL6 in lung EC providing mechanistic evidence that inhalation
of particulates affect the immune response to viral infection (Ciencewicki et al., 2006).
Dysregulation of the innate immune response could lead to enhancement of
inflammatory cell recruitment, DC activation, adaptive immune response and potentially
an auto-immune or allergic type reaction. No studies have been conducted investinging
modulation of poly I:C effects by cigarette smoke; however, it is important to determine if
smoke down-regulate cytokine production and push the Th2 response despite the Th1
poly I:C effects. This will mimic the clinical scenario of cigarette smokers exposed to
viral infection.
16
Figure 1. Structure of poly I:C. Reprinted from (Chemblink.com, 2007) with permission.
It is evident that smoke modulates the immune response and impacts disease
development and progression. Unfortunately, the exact mechanism by which this occurs
remains unclear. By culturing MDDC with smoke-exposed NHBE, it takes into account
the impact of the tissue micro-environment on the response of MDDC. This study
provides insight into EC-DC interactions in smoke exposure and may provide evidence
for disease and infection susceptibility in cigarette smokers. In addition, by investigating
the effect of smoke in poly I:C stimulated co-cultures, this study also provides insight into
how a smoker may respond to viral infection. In chapter three, the purpose, models and
methods of this study is described.
17
Chapter Three
Method
Purpose
The purpose of this preliminary 4x2 factorial design study was to examine the
effect of cigarette smoke condensate (CSC) on monocyte derived DC (MDDC)
clustering, cytokine response, maturation, endocytosis ability, TC proliferation and
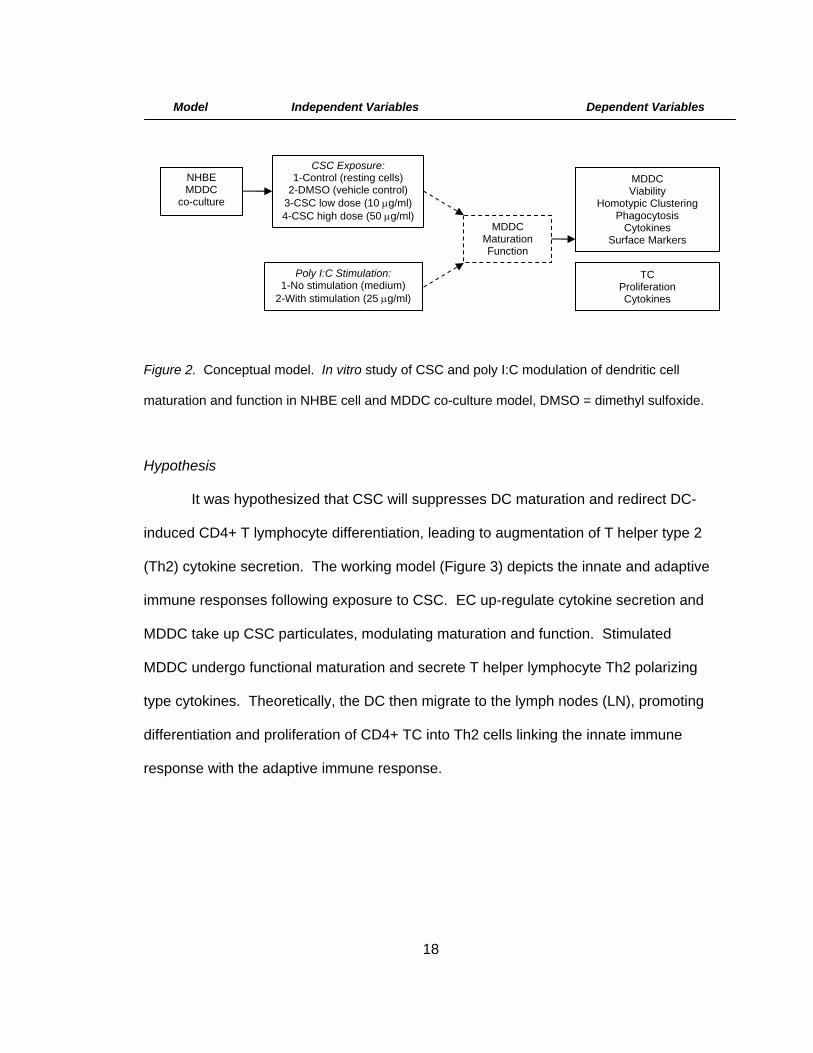
polarization. This study was guided by the conceptual model in Figure 2. This concept
model shows the in vitro model model (NHBE, MDDC co-culture), four levels/doses
(control/resting, DMSO/vehicle control, 10 μg/ml and 50 μg/ml) of cigarette smoke
condensate (CSC) exposure, two levels/doses (0 and 25 μg/ml) of poly I:C stimulation.
The dashed arrows and box, indicates the theoretical concept of DC maturation and
function followed by the categories of dependent variables to be measured.
18
Figure 2. Conceptual model. In vitro study of CSC and poly I:C modulation of dendritic cell
maturation and function in NHBE cell and MDDC co-culture model, DMSO = dimethyl sulfoxide.
Hypothesis
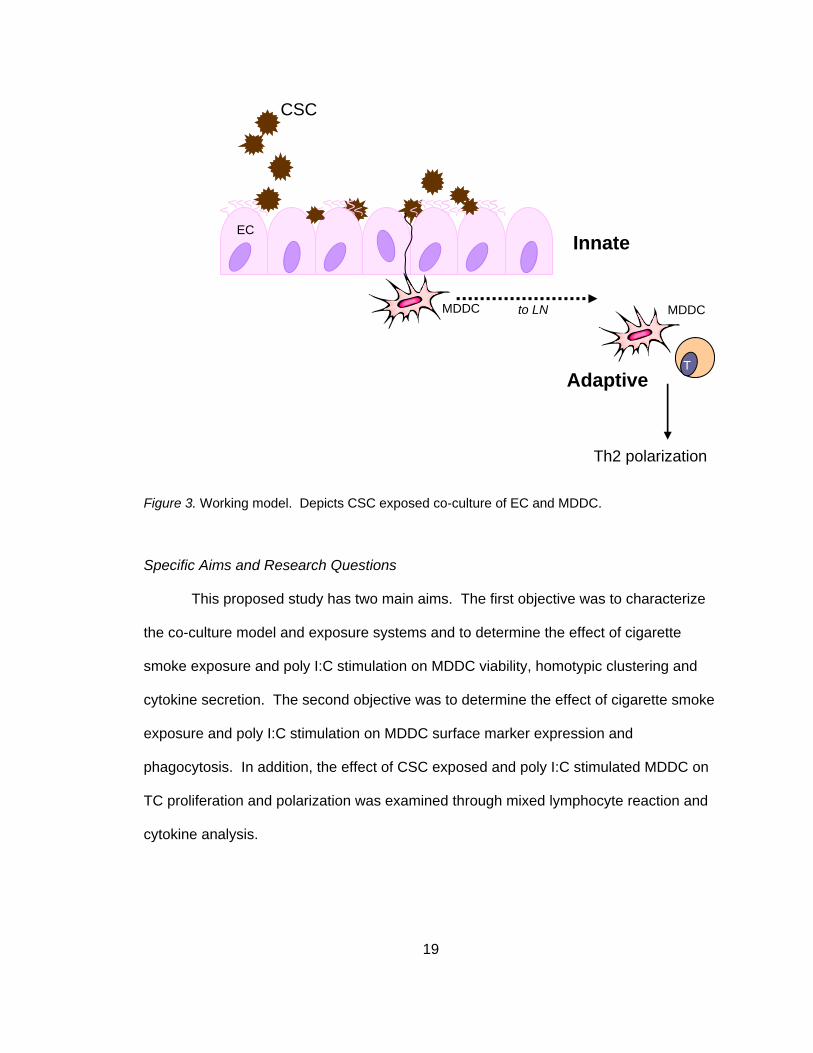
It was hypothesized that CSC will suppresses DC maturation and redirect DC-
induced CD4+ T lymphocyte differentiation, leading to augmentation of T helper type 2
(Th2) cytokine secretion. The working model (Figure 3) depicts the innate and adaptive
immune responses following exposure to CSC. EC up-regulate cytokine secretion and
MDDC take up CSC particulates, modulating maturation and function. Stimulated
MDDC undergo functional maturation and secrete T helper lymphocyte Th2 polarizing
type cytokines. Theoretically, the DC then migrate to the lymph nodes (LN), promoting
differentiation and proliferation of CD4+ TC into Th2 cells linking the innate immune
response with the adaptive immune response.
Dependent VariablesIndependent VariablesModel
CSC Exposure: 1-Control (resting cells)
2-DMSO (vehicle control) 3-CSC low dose (10 μg/ml) 4-CSC high dose (50 μg/ml)
Poly I:C Stimulation: 1-No stimulation (medium)
2-With stimulation (25 μg/ml)
MDDC Viability
Homotypic Clustering Phagocytosis
Cytokines Surface Markers
MDDC Maturation Function
NHBE MDDC
co-culture
TC Proliferation Cytokines
19
Figure 3. Working model. Depicts CSC exposed co-culture of EC and MDDC.
Specific Aims and Research Questions
This proposed study has two main aims. The first objective was to characterize
the co-culture model and exposure systems and to determine the effect of cigarette
smoke exposure and poly I:C stimulation on MDDC viability, homotypic clustering and
cytokine secretion. The second objective was to determine the effect of cigarette smoke
exposure and poly I:C stimulation on MDDC surface marker expression and
phagocytosis. In addition, the effect of CSC exposed and poly I:C stimulated MDDC on
TC proliferation and polarization was examined through mixed lymphocyte reaction and
cytokine analysis.
to LN
Innate
DCMDDC
T
EC
Adaptive
Th2 polarization
MDDC
CSC
20
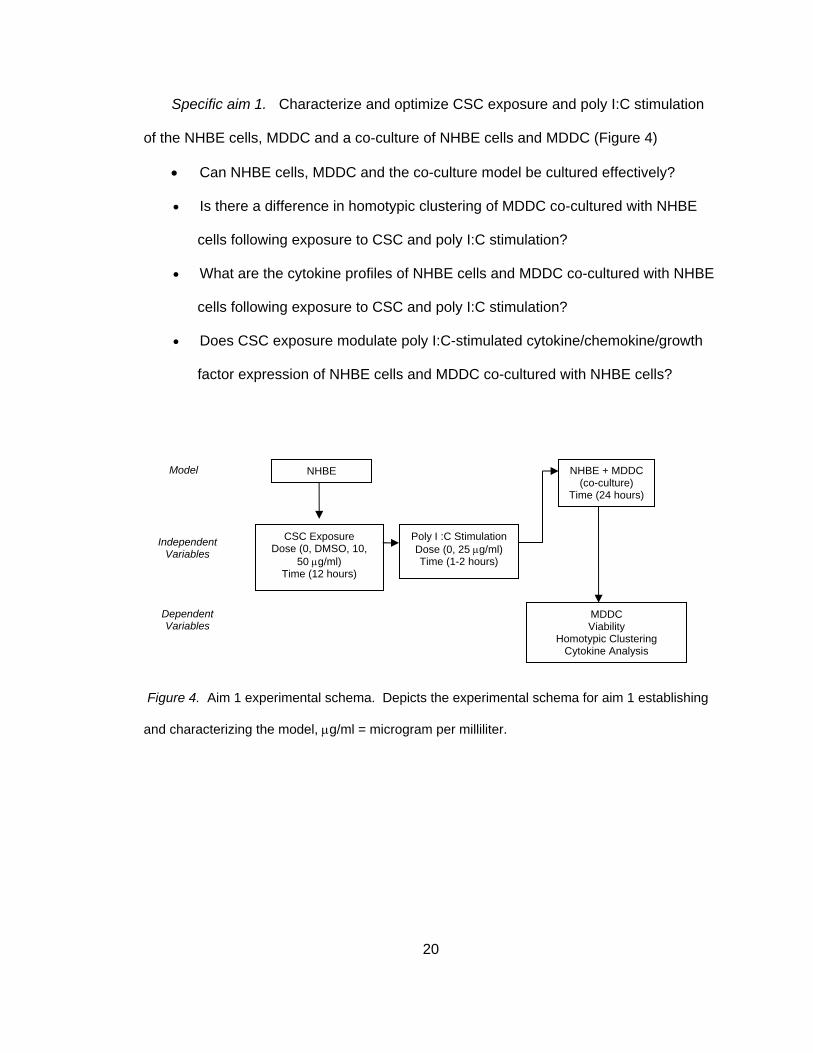
Specific aim 1. Characterize and optimize CSC exposure and poly I:C stimulation
of the NHBE cells, MDDC and a co-culture of NHBE cells and MDDC (Figure 4)
• Can NHBE cells, MDDC and the co-culture model be cultured effectively?
• Is there a difference in homotypic clustering of MDDC co-cultured with NHBE
cells following exposure to CSC and poly I:C stimulation?
• What are the cytokine profiles of NHBE cells and MDDC co-cultured with NHBE
cells following exposure to CSC and poly I:C stimulation?
• Does CSC exposure modulate poly I:C-stimulated cytokine/chemokine/growth
factor expression of NHBE cells and MDDC co-cultured with NHBE cells?
Figure 4. Aim 1 experimental schema. Depicts the experimental schema for aim 1 establishing
and characterizing the model, μg/ml = microgram per milliliter.
MDDC Viability
Homotypic Clustering Cytokine Analysis
NHBE
CSC Exposure Dose (0, DMSO, 10,
50 μg/ml) Time (12 hours)
Model
Poly I :C Stimulation Dose (0, 25 μg/ml) Time (1-2 hours)
NHBE + MDDC (co-culture)
Time (24 hours)
Independent Variables
Dependent Variables
21
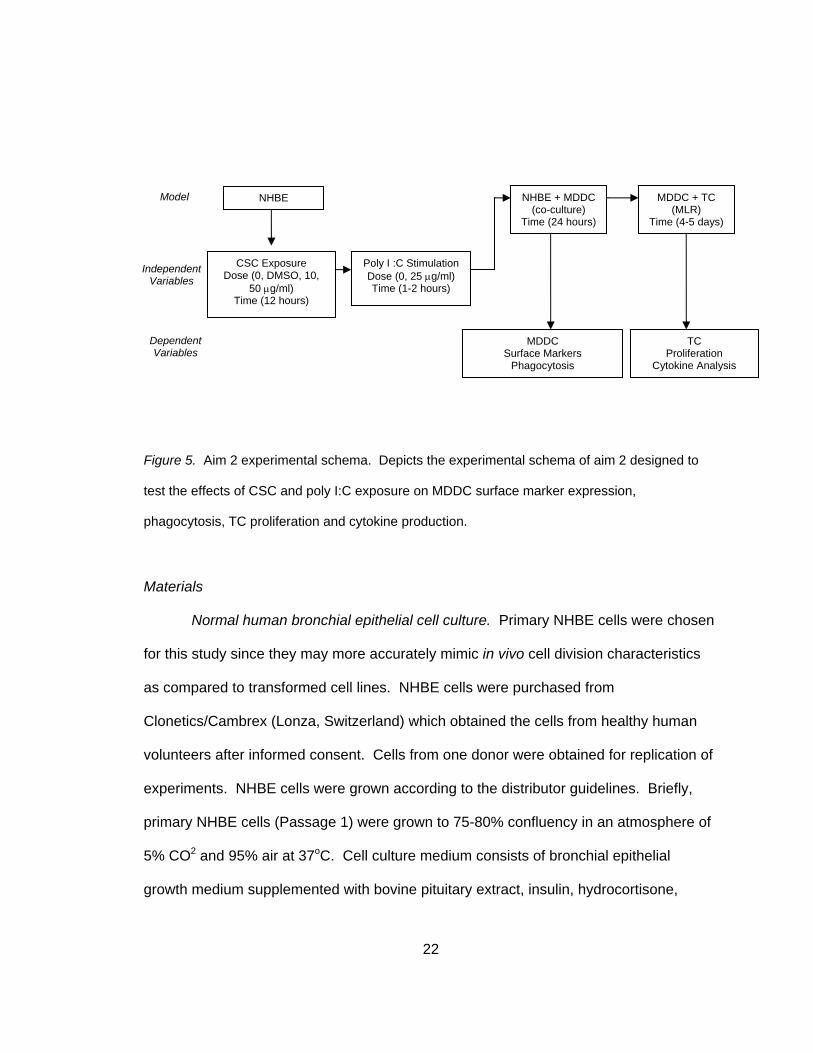
Specific aim 2. Determine the effect of CSC and poly I:C stimulation on DC
maturation, function and the ability of the exposed/stimulated DC to induce TC
proliferation and priming. Compare the response of DC cultured alone or with bronchial
EC (Figure 5).
• Does CSC exposure and poly I:C stimulation induce phenotypic DC maturation
in MDDC co-cultured with NHBE cells as evidenced by maturation markers
(CD80, CD83, CD86, and CD54) within the CD11c+ population?
• Does CSC exposure and poly I:C stimulation induce functional DC maturation in
MDDC co-cultured with NHBE cells as evidenced by a lack of endocytic ability?
• Do CSC-exposed and poly I:C-stimulated MDDC co-cultured with NHBE cells
induce CD4+ TC proliferation in MLR as evidenced by the CFSE proliferation
assay?
• Do CSC-exposed and poly I:C-stimulated MDDC co-cultured with NHBE cells
induce CD4+ cell proliferation towards a Th2 phenotype in the MLR as
evidenced by a decrease in Th1 cytokines and an increase in Th2 cytokines?
22
Figure 5. Aim 2 experimental schema. Depicts the experimental schema of aim 2 designed to
test the effects of CSC and poly I:C exposure on MDDC surface marker expression,
phagocytosis, TC proliferation and cytokine production.
Materials
Normal human bronchial epithelial cell culture. Primary NHBE cells were chosen
for this study since they may more accurately mimic in vivo cell division characteristics
as compared to transformed cell lines. NHBE cells were purchased from
Clonetics/Cambrex (Lonza, Switzerland) which obtained the cells from healthy human
volunteers after informed consent. Cells from one donor were obtained for replication of
experiments. NHBE cells were grown according to the distributor guidelines. Briefly,
primary NHBE cells (Passage 1) were grown to 75-80% confluency in an atmosphere of
5% CO2 and 95% air at 37oC. Cell culture medium consists of bronchial epithelial
growth medium supplemented with bovine pituitary extract, insulin, hydrocortisone,
NHBE
CSC Exposure Dose (0, DMSO, 10,
50 μg/ml) Time (12 hours)
Model
Poly I :C Stimulation Dose (0, 25 μg/ml) Time (1-2 hours)
MDDC + TC (MLR)
Time (4-5 days)
TC Proliferation
Cytokine Analysis
NHBE + MDDC (co-culture)
Time (24 hours)
MDDC Surface Markers
Phagocytosis
Independent Variables
Dependent Variables
23
human epithelial growth factor, epinephrine, transferring, retinoic acid and
triiodothyronine (Lonza, Switzerland). Cells were subcultured, aliquoted into freezing
tubes (50,000 cells/vial), and stored in liquid nitrogen following passage 1. Cells used in
these experiments were at a passage of 2 and 3. For NHBE only experiments, NHBE
cells were seeded onto 12 well plates and grown to confluency. Confluent cultures will
be exposed to CSC depending on experimental group (0, 10 or 50 μg/ml) for 12 hours.
Poly I:C was then be added to CSC-conditioned medium depending on experimental
group (0 or 50 μg/ml) for 1-2 hours. Following CSC exposure and poly I:C stimulation,
DC were added to NHBE cultures. Supernatants were collected for subsequent cytokine
analysis.
Monocyte-derived dendritic cells culture. Peripheral blood monocytes (PBMC)
were isolated from buffy coats obtained from healthy volunteers (Florida Blood Services)
after isolation by Ficoll-Paque (GE Healthcare/Amersham Biosciences, USA) density
gradient centrifugation. CD14+ PBMC were isolated by positive selection using
magnetically labeled CD14 antibodies and a magnetic separator (Miltenyi Biotec).
PBMC can differentiate toward an immature, myeloid DC phenotype, CD11c+, HLA-
DRlo, E-cadherin-, langerin- (de Heer et al., 2005) by an established method of culturing
with IL4 and GMCSF as described previously in the literature (Sallusto & Lanzavecchia,
1994). Briefly, CD14+ PBMC were cultured in RPMI 1640 medium supplemented with
2% L-Glutamin, 1% penicillin/streptomycin and 10% fetal bovine serum, 10 ng/ml IL-4,
20ng/ml GMCSF (Peprotech), 1% nonessential amino acids and 1% sodium pyruvate
(Sigma). Cultures were kept for 5-6 days in an atmosphere of 5% CO2 and 95% air at
37oC. Immature MDDC (iMDDC) were harvested on day 5 or 6 and characterized by
flow cytometry. One study compared the phenotype of DC using this method with lung
24
DC and reported similar phenotypic (low expression of CD40, CD80, CD83, CD86) and
functional patterns (high capacity for the uptake of dextran and the ability to stimulate
TC), making this an appropriate model for the in vitro study of pulmonary DC (Cochand,
Isler, Songeon, & Nicod, 1999).
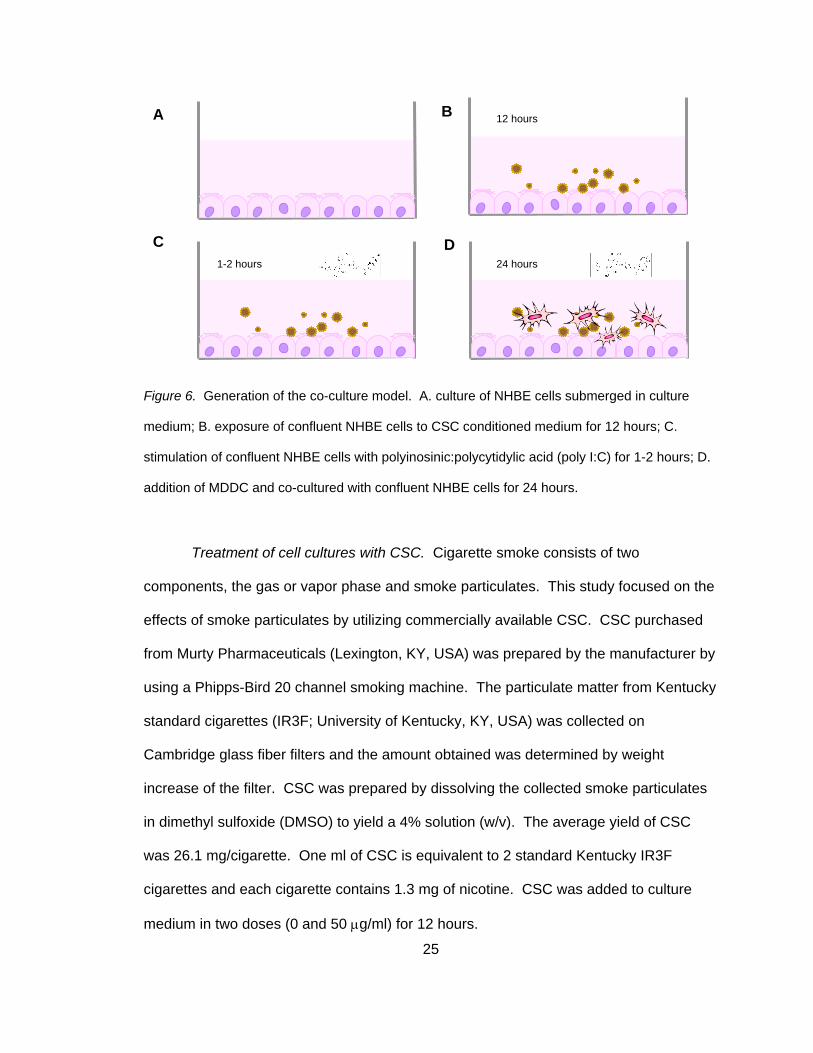
Co-culture of NHBE and MDDC cells. Methods for the co-culture of NHBE cells
and MDDC are based on methods described in the literature (Bleck et al., 2006). Briefly,
NHBE cells at passages 2 or 3 were seeded at a density of 2x10⁴ cells/cm2 on 12-well
culture plates and maintained in an atmosphere of 5% CO2 and 95% air at 37oC
approximately 7 days or until 100% confluency is reached (Figure 6). Day 5 or 6
iMDDC were harvested and re-suspended in complete medium. MDDC (5x10⁵
cells/well) to confluent NHBE cells in 12 well plates and exposed to CSC or poly I:C-
conditioned medium depending on experimental group assigned. Following 24 hours of
culture, light microscope images were taken with a 4x objective for homotypic clustering
analysis and cells were harvested, washed and aliquoted for subsequent flow cytometry,
endocytosis assay and mixed lymphocyte reactions. In addition, supernatants were
collected for cytokine analysis.
25
Figure 6. Generation of the co-culture model. A. culture of NHBE cells submerged in culture
medium; B. exposure of confluent NHBE cells to CSC conditioned medium for 12 hours; C.
stimulation of confluent NHBE cells with polyinosinic:polycytidylic acid (poly I:C) for 1-2 hours; D.
addition of MDDC and co-cultured with confluent NHBE cells for 24 hours.
Treatment of cell cultures with CSC. Cigarette smoke consists of two
components, the gas or vapor phase and smoke particulates. This study focused on the
effects of smoke particulates by utilizing commercially available CSC. CSC purchased
from Murty Pharmaceuticals (Lexington, KY, USA) was prepared by the manufacturer by
using a Phipps-Bird 20 channel smoking machine. The particulate matter from Kentucky
standard cigarettes (IR3F; University of Kentucky, KY, USA) was collected on
Cambridge glass fiber filters and the amount obtained was determined by weight
increase of the filter. CSC was prepared by dissolving the collected smoke particulates
in dimethyl sulfoxide (DMSO) to yield a 4% solution (w/v). The average yield of CSC
was 26.1 mg/cigarette. One ml of CSC is equivalent to 2 standard Kentucky IR3F
cigarettes and each cigarette contains 1.3 mg of nicotine. CSC was added to culture
medium in two doses (0 and 50 μg/ml) for 12 hours.
A
C D
B 12 hours
1-2 hours 24 hours
26
Treatment of cell cultures with poly I:C (Amersham Biosciences, Pittsburgh, PA,
USA) was reconstituted in phosphate buffered saline (PBS) to 2 mg/ml by heating to
50oC to solubilize and allowing to slowly cool to room temperature in order to ensure re-
annealing. Poly I:C was added to cell culture medium at two doses (0 or 50 μg/ml) for 1-
2 hours. Poly I:C stimulated cultures were a positive control from MDDC maturation and
mimic the effects of viral infection.
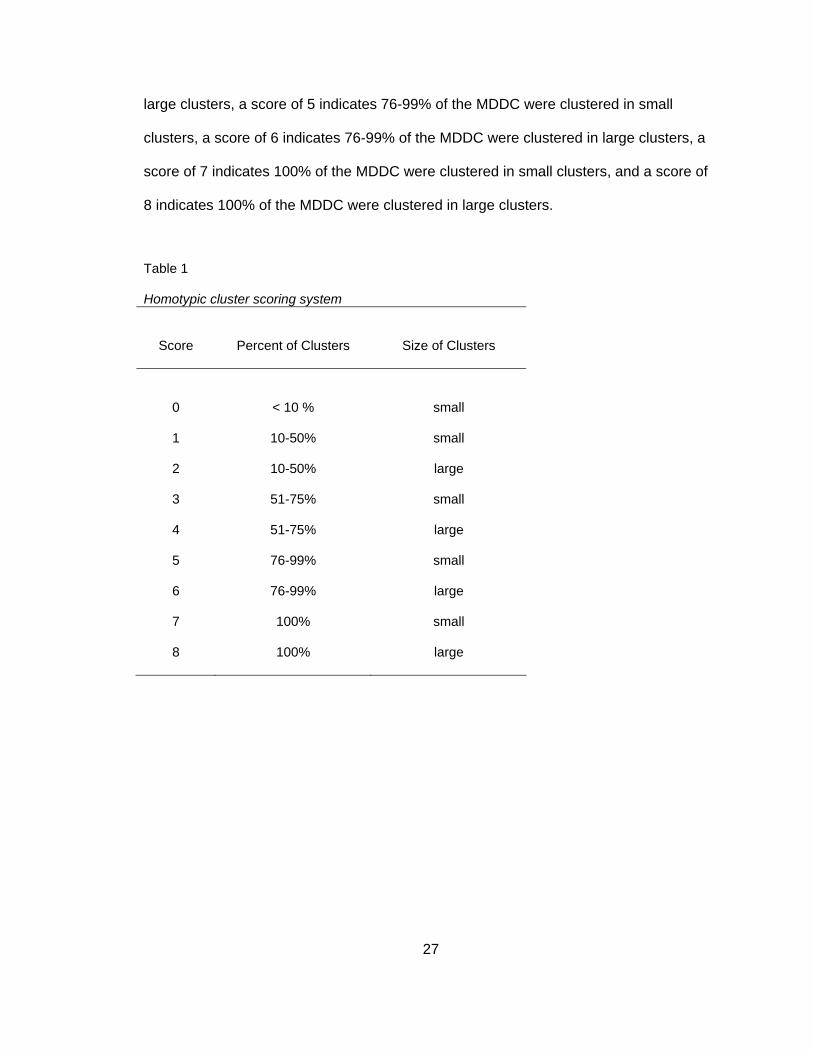
Homotypic clustering of DC. Homotypic and heterotypic clustering of DC, is
critical for antigen presentation and correlates with DC maturation (Delemarre,
Hoogeveen, De Haan-Meulman, Simons, & Drexhage, 2001; Lehner et al., 2003). In
order to assess cluster formation following CSC exposure and poly I:C stimulation, an
aggregation assay was performed prior to supernatant collection and harvesting of cells
for flow cytometry analysis, endocytosis assay and mixed lymphocyte cultures. The
homotypic cluster scoring system (Table 1) is a modification of methods reported
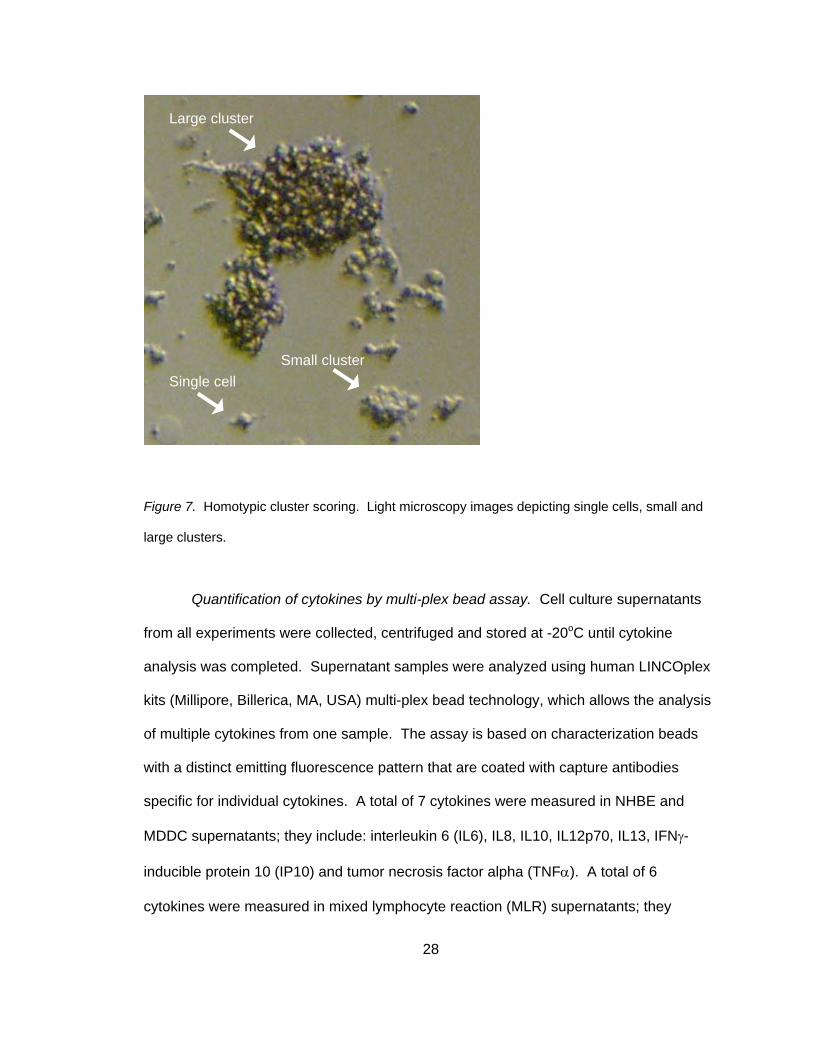
previously (Lehner et al., 2003; Majdic et al., 1994). Figure 7 presents a light
microscopy image of DC is various cluster states: single, small and large. Small and
large clusters were discriminated by the density/darkness and size. In order to be
considered large, over 75% of clusters had to be dark/dense and greater than 10 times
the size of a single DC. Clusters were randomly counted by two blind investigators
utilizing an inverted light microscope with a 4X objective and average scores were
reported. The degree of aggregation or clustering was scored on a scale from 0 to 8
where a score of 0 indicates less than 10% of cells were in small clusters, a score of 1
indicates 10-50% of the MDDC were clustered in small clusters, a score of 2 indicates
10-50% of the MDDC were clustered in large clusters, a score of 3 indicates 51-75% of
the MDDC were in small clusters, a score of 4 indicates 51-75% of the MDDC were in
27
large clusters, a score of 5 indicates 76-99% of the MDDC were clustered in small
clusters, a score of 6 indicates 76-99% of the MDDC were clustered in large clusters, a
score of 7 indicates 100% of the MDDC were clustered in small clusters, and a score of
8 indicates 100% of the MDDC were clustered in large clusters.
Table 1
Homotypic cluster scoring system
Score
Percent of Clusters
Size of Clusters
0
< 10 %
small
1 10-50% small
2 10-50% large
3 51-75% small
4 51-75% large
5 76-99% small
6 76-99% large
7 100% small
8 100% large
28
Figure 7. Homotypic cluster scoring. Light microscopy images depicting single cells, small and
large clusters.
Quantification of cytokines by multi-plex bead assay. Cell culture supernatants
from all experiments were collected, centrifuged and stored at -20oC until cytokine
analysis was completed. Supernatant samples were analyzed using human LINCOplex
kits (Millipore, Billerica, MA, USA) multi-plex bead technology, which allows the analysis
of multiple cytokines from one sample. The assay is based on characterization beads
with a distinct emitting fluorescence pattern that are coated with capture antibodies
specific for individual cytokines. A total of 7 cytokines were measured in NHBE and
MDDC supernatants; they include: interleukin 6 (IL6), IL8, IL10, IL12p70, IL13, IFNγ-
inducible protein 10 (IP10) and tumor necrosis factor alpha (TNFα). A total of 6
cytokines were measured in mixed lymphocyte reaction (MLR) supernatants; they
Large cluster
Small cluster Single cell
29
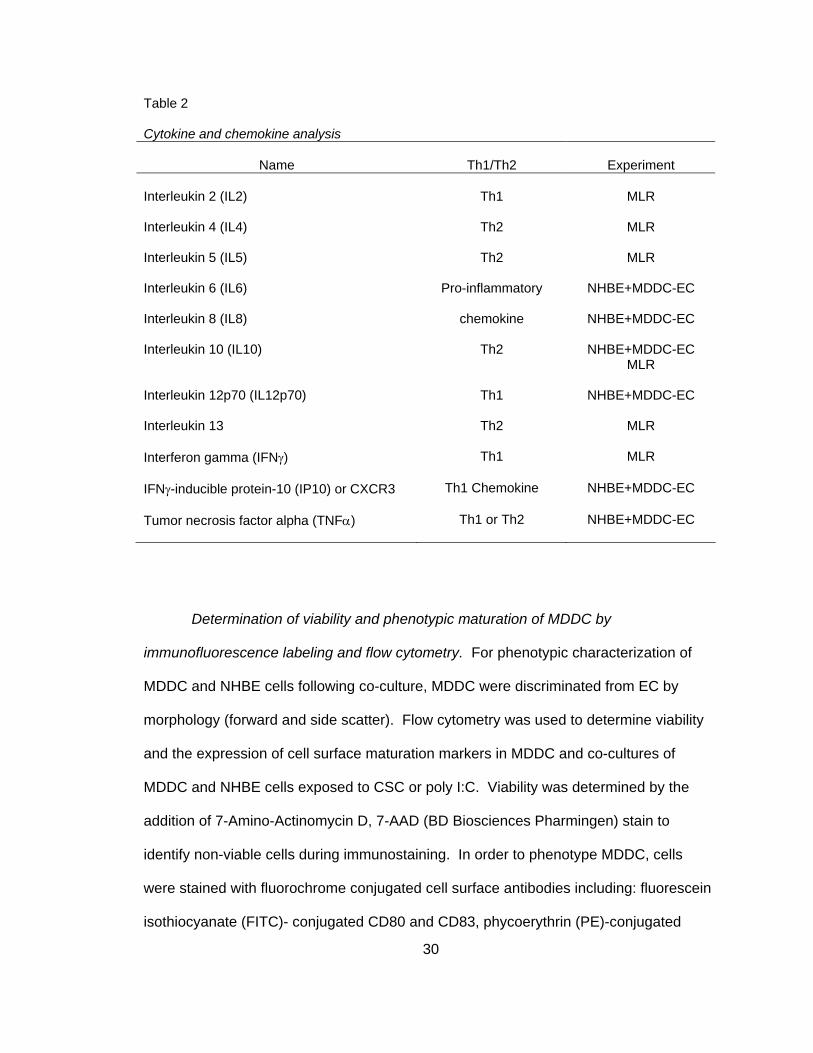
include: IL2, IL4, IL5, IL10, IL13, and IFNγ. Table 2 depicts each cytokine and the
experiment in which it was collected along with the basic functional classification.
Cytokines were measured according to the manufacturer's instructions. Briefly,
25 μL aliquots of medium samples were incubated with antibody coated capture beads
for 1 hour, washed and incubated with biotin-labeled anti-human cytokine antibodies for
2 hours at room temperature followed by incubation with streptavidin-phycoerythin for 30
minutes. Samples were analyzed using Luminex 100 IS System and IS 2.3 software
(Luminex, Austin, TX, USA). Complete culture medium was used as the blank and
added to all standards and quality controls. Each sample was assayed in duplicate and
data were presented as the average. Standard curves of known concentrations of
recombinant human cytokines (provided by the manufacturer) were used to convert
mean fluorescence intensities to cytokine concentration in pg/mL by using 4 or 5
parameter logistic regression.
30
Table 2
Cytokine and chemokine analysis
Name
Th1/Th2
Experiment Interleukin 2 (IL2)
Th1
MLR
Interleukin 4 (IL4)
Th2
MLR
Interleukin 5 (IL5)
Th2
MLR
Interleukin 6 (IL6)
Pro-inflammatory
NHBE+MDDC-EC
Interleukin 8 (IL8)
chemokine
NHBE+MDDC-EC
Interleukin 10 (IL10)
Th2
NHBE+MDDC-EC
MLR Interleukin 12p70 (IL12p70)
Th1
NHBE+MDDC-EC
Interleukin 13
Th2
MLR
Interferon gamma (IFNγ)
Th1
MLR
IFNγ-inducible protein-10 (IP10) or CXCR3
Th1 Chemokine
NHBE+MDDC-EC
Tumor necrosis factor alpha (TNFα)
Th1 or Th2
NHBE+MDDC-EC
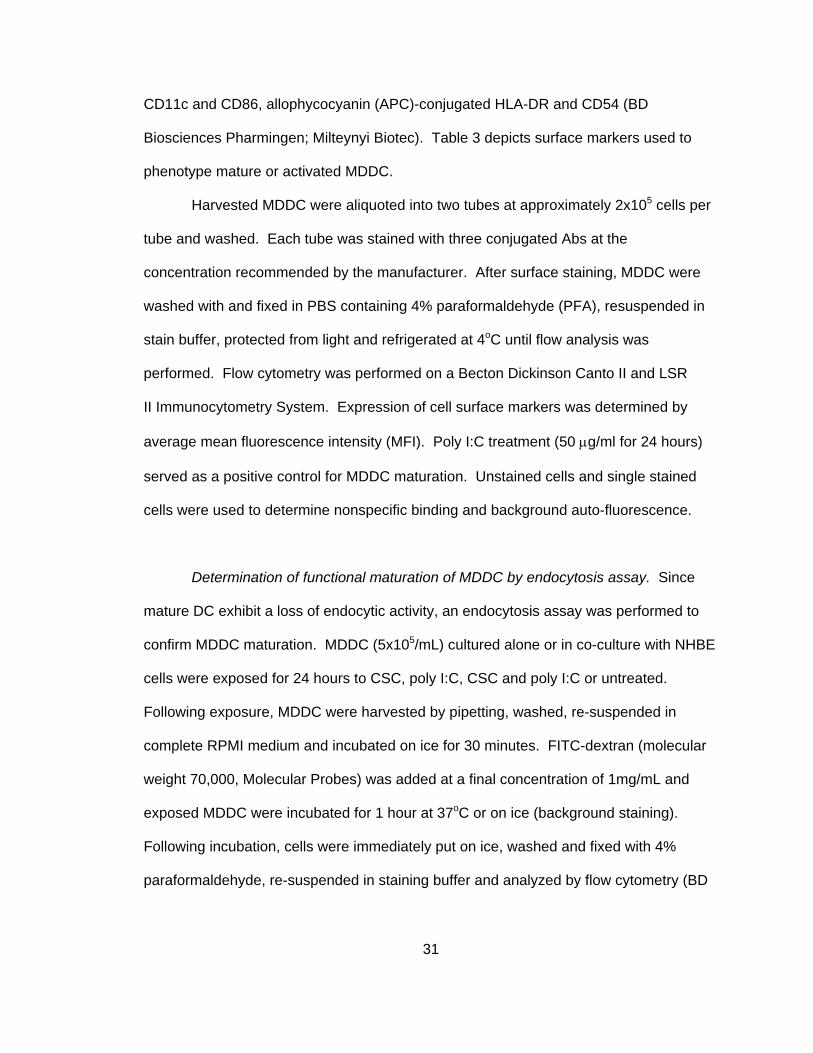
Determination of viability and phenotypic maturation of MDDC by
immunofluorescence labeling and flow cytometry. For phenotypic characterization of
MDDC and NHBE cells following co-culture, MDDC were discriminated from EC by
morphology (forward and side scatter). Flow cytometry was used to determine viability
and the expression of cell surface maturation markers in MDDC and co-cultures of
MDDC and NHBE cells exposed to CSC or poly I:C. Viability was determined by the
addition of 7-Amino-Actinomycin D, 7-AAD (BD Biosciences Pharmingen) stain to
identify non-viable cells during immunostaining. In order to phenotype MDDC, cells
were stained with fluorochrome conjugated cell surface antibodies including: fluorescein
isothiocyanate (FITC)- conjugated CD80 and CD83, phycoerythrin (PE)-conjugated
31
CD11c and CD86, allophycocyanin (APC)-conjugated HLA-DR and CD54 (BD
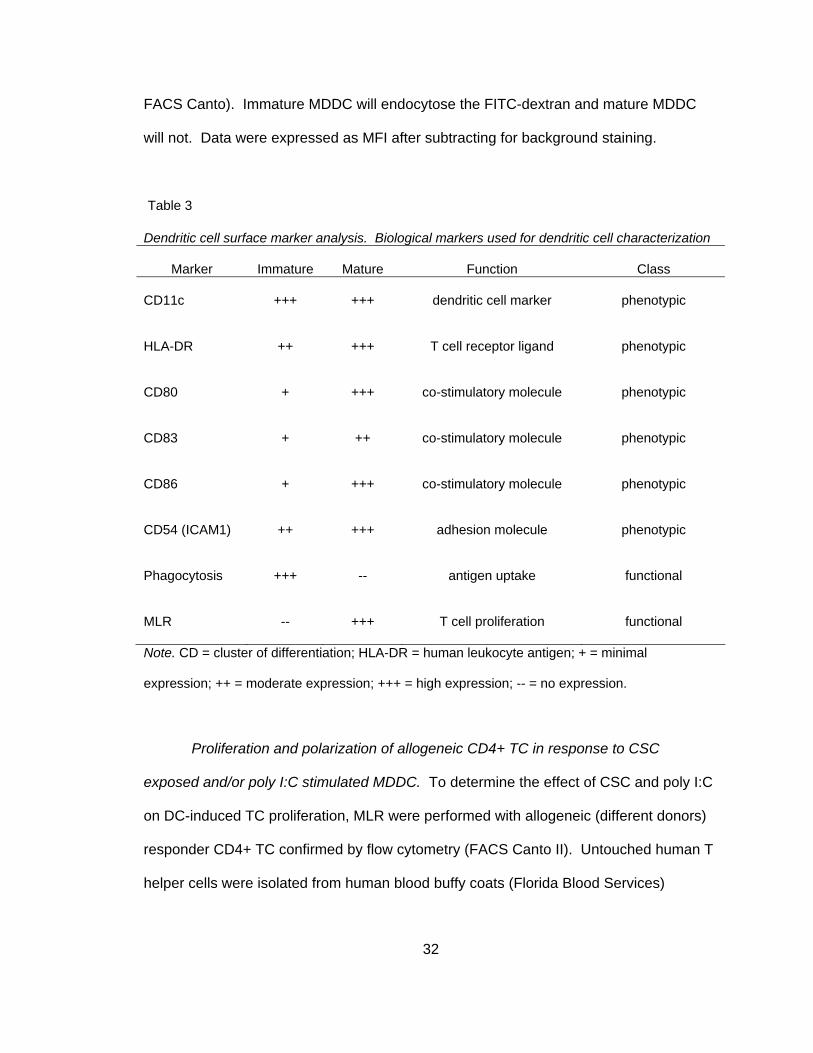
Biosciences Pharmingen; Milteynyi Biotec). Table 3 depicts surface markers used to
phenotype mature or activated MDDC.
Harvested MDDC were aliquoted into two tubes at approximately 2x10⁵ cells per
tube and washed. Each tube was stained with three conjugated Abs at the
concentration recommended by the manufacturer. After surface staining, MDDC were
washed with and fixed in PBS containing 4% paraformaldehyde (PFA), resuspended in
stain buffer, protected from light and refrigerated at 4oC until flow analysis was
performed. Flow cytometry was performed on a Becton Dickinson Canto II and LSR
II Immunocytometry System. Expression of cell surface markers was determined by
average mean fluorescence intensity (MFI). Poly I:C treatment (50 μg/ml for 24 hours)
served as a positive control for MDDC maturation. Unstained cells and single stained
cells were used to determine nonspecific binding and background auto-fluorescence.
Determination of functional maturation of MDDC by endocytosis assay. Since
mature DC exhibit a loss of endocytic activity, an endocytosis assay was performed to
confirm MDDC maturation. MDDC (5x10⁵/mL) cultured alone or in co-culture with NHBE
cells were exposed for 24 hours to CSC, poly I:C, CSC and poly I:C or untreated.
Following exposure, MDDC were harvested by pipetting, washed, re-suspended in
complete RPMI medium and incubated on ice for 30 minutes. FITC-dextran (molecular
weight 70,000, Molecular Probes) was added at a final concentration of 1mg/mL and
exposed MDDC were incubated for 1 hour at 37oC or on ice (background staining).
Following incubation, cells were immediately put on ice, washed and fixed with 4%
paraformaldehyde, re-suspended in staining buffer and analyzed by flow cytometry (BD
32
FACS Canto). Immature MDDC will endocytose the FITC-dextran and mature MDDC
will not. Data were expressed as MFI after subtracting for background staining.
Table 3
Dendritic cell surface marker analysis. Biological markers used for dendritic cell characterization
Marker
Immature
Mature
Function
Class CD11c
+++
+++
dendritic cell marker
phenotypic
HLA-DR
++
+++
T cell receptor ligand
phenotypic
CD80
+
+++
co-stimulatory molecule
phenotypic
CD83
+
++
co-stimulatory molecule
phenotypic
CD86
+
+++
co-stimulatory molecule
phenotypic
CD54 (ICAM1)
++
+++
adhesion molecule
phenotypic
Phagocytosis
+++
--
antigen uptake
functional
MLR
--
+++
T cell proliferation
functional
Note. CD = cluster of differentiation; HLA-DR = human leukocyte antigen; + = minimal
expression; ++ = moderate expression; +++ = high expression; -- = no expression.
Proliferation and polarization of allogeneic CD4+ TC in response to CSC
exposed and/or poly I:C stimulated MDDC. To determine the effect of CSC and poly I:C
on DC-induced TC proliferation, MLR were performed with allogeneic (different donors)
responder CD4+ TC confirmed by flow cytometry (FACS Canto II). Untouched human T
helper cells were isolated from human blood buffy coats (Florida Blood Services)
33
following isolation by Ficoll-Paque and density gradient centrifugation and MACS cell
suspension kit, CD4+ T cell isolation kit II (Miltenyi Biotec). The PBMCs were depleted
of non-CD4+ TC including, CD8+ TC, gamma delta (γ/δ) TC, B cells, natural killer cells,
DC, monocytes, granulocytes, and erythroid cells. In order to deplete these cell types,
PBMCs were indirectly magnetically labeled using a cocktail of biotin-conjugated
antibodies against CD8, CD14, CD16, CD19, CD36, CD56, CD123, TCR γ/δ , and
CD235a (glycophorinA) according to the manufacturer's instructions. The negative
fraction was confirmed as the CD4+ population by double positive staining for CD3 and
CD4 by flow cytometry analysis.
Immature MDDC (5x10⁵) were exposed alone or in co-culture with NHBE cells for
various culture times and doses of CSC and Poly I:C in complete medium supplemented
with IL4 and GMCSF. Exposed MDDC were washed in fresh medium and treated with
mitomycinC (20μg/mL, 45 min at 37oC) to prevent proliferation. TC were treated with
carboxyfluoroscein succinimidyl ester (CFSE; Molecular Probes, Invitrogen) in order to
determine proliferation. The protocol for CFSE staining is based on methods described
previously (Quah, Warren, & Parish, 2007).
In order to determine optimal MDDC to TC ratios, 3 different ratios of MDDC in
100 μL of medium were analyzed while the number of TC remains constant (2x10⁵).
Ratios were assayed in triplicate, including 1:8, 1:16, and 1:32. MDDC were co-cultured
with responder allogenic TC (100 μL of 1x10⁵ cells/mL) for 4-5 days in 96-well round
bottom microplates.
MLR cell culture supernatants were collected for cytokine analysis (as described
previously) in order to determine TC polarization as Th1 (IL2, IFNγ, TNFα) or Th2 (IL4,
IL5, IL10) as described in Table 1. TC were harvested and analyzed by flow cytometry.
34
Controls for this assay included: unstained (no CFSE) treated TC, TC cultured alone,
TC-treated with mitomycin C. The positive control was MDDC cultured with TC and
stimulated with a mitogen, phytohemmaglutinin (PHA) at a concentration of 5μg/mL.
The assay works by CFSE passively diffusing into the TC. The CFSE undergoes
esterase cleavage of the acetate groups and diffuses throughout the cytoplasm where it
reacts with amines forming highly fluorescent conjugates that are well retained. As the
cells divide, the CFSE is split equally between the daughter cells resulting in diminished
CFSE signal detection that occurs with each subsequent cell division allowing for a
quantitative determination of the number of cell divisions.
Data Analysis
In this 4x2 factorial design study, experiments were performed with MDDC and
TC derived from at least four individual donors. Data were reported as mean and
standard error of the mean. Each of the dependent variables were transformed by base
10 logarithm except for DC viability (percent live), homotypic clustering (cluster score 0-
8) and TC proliferation (percent proliferation); in these three cases, raw data was used.
Log transformation was performed in order to normalize data. Each donor exhibited
similar trends in data but a variation in magnitude between donors was observed.
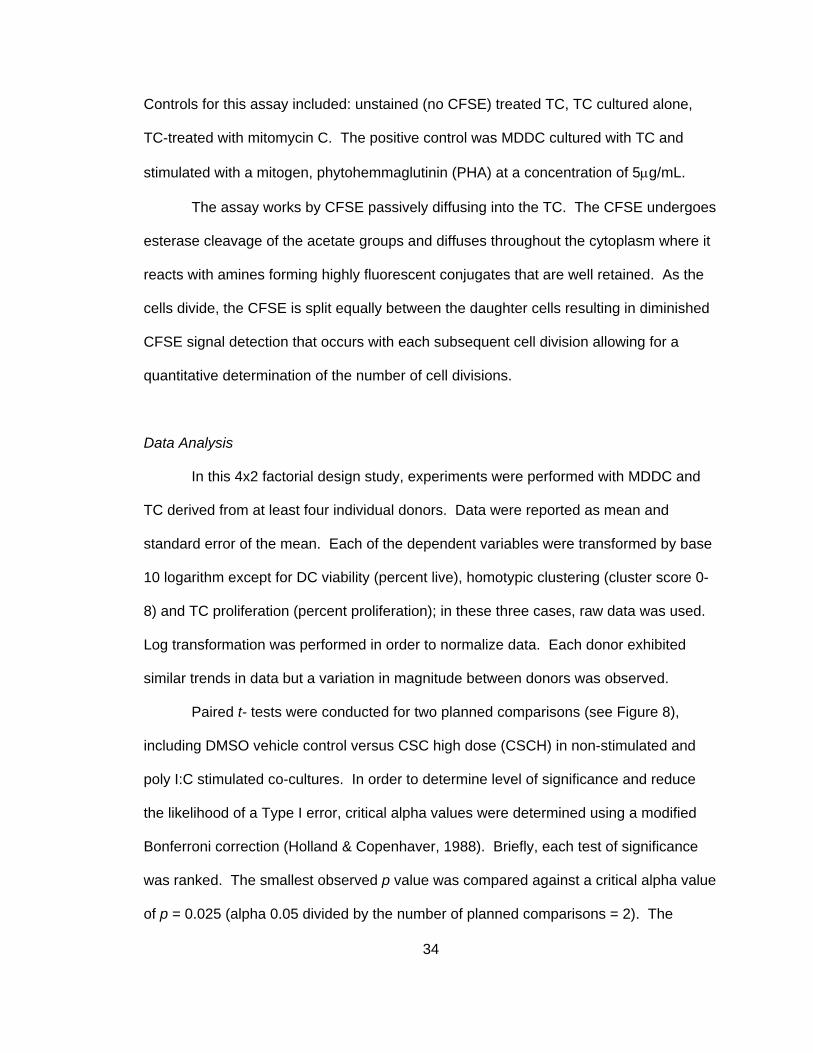
Paired t- tests were conducted for two planned comparisons (see Figure 8),
including DMSO vehicle control versus CSC high dose (CSCH) in non-stimulated and
poly I:C stimulated co-cultures. In order to determine level of significance and reduce
the likelihood of a Type I error, critical alpha values were determined using a modified
Bonferroni correction (Holland & Copenhaver, 1988). Briefly, each test of significance
was ranked. The smallest observed p value was compared against a critical alpha value
of p = 0.025 (alpha 0.05 divided by the number of planned comparisons = 2). The
35
second test was compared against a critical alpha value of p = 0.05. In addition, eta
squared (t2 / t2 + degrees of freedom) values are reported to display the effect size for
each dependent variable. All statistics were performed with the Statistical Package for
Social Sciences (SPSS version 15) and figures constructed with GraphPad Prism
(Version 3.03). In chapter four is a summary of results obtained in this study is
presented.
Pairwise Comparisons
Medium Poly I:C0
1
2ControlDMSOCSCLCSCH
A B
Dep
ende
nt V
aria
ble
Figure 8. Pairwise comparisons for dependent variables.
36
Chapter Four
Results
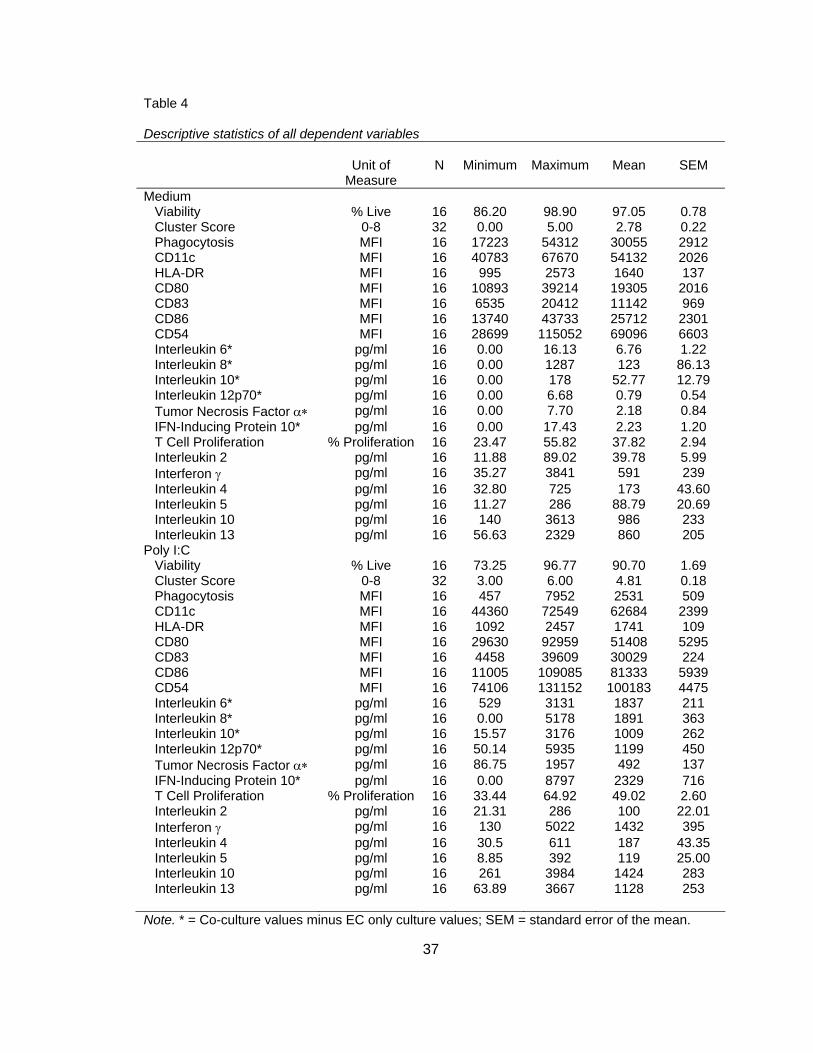
Characteristics of the Sample
Buffy coats from a total of four individual donors were used in this study to isolate
MDDC and TC. Identifying data about each donor was de-identified by Florida Blood
Services and only age and gender were given. Two of the four donors were female and
the average age was 38 and ranged from 21 to 60 years (21, 21, 50 and 60 years).
Identifying data about the NHBE donor was de-identified by Lonza (Walkersville, Inc.)
and only age and gender were given. The NHBE donor was a 2 year old male. Overall
descriptive statistics of the raw data for each dependent variable are displayed in Table
4.
37
Table 4 Descriptive statistics of all dependent variables
Unit of Measure
N
Minimum
Maximum
Mean
SEM
Medium Viability % Live 16 86.20 98.90 97.05 0.78 Cluster Score 0-8 32 0.00 5.00 2.78 0.22 Phagocytosis MFI 16 17223 54312 30055 2912 CD11c MFI 16 40783 67670 54132 2026 HLA-DR MFI 16 995 2573 1640 137 CD80 MFI 16 10893 39214 19305 2016 CD83 MFI 16 6535 20412 11142 969 CD86 MFI 16 13740 43733 25712 2301 CD54 MFI 16 28699 115052 69096 6603 Interleukin 6* pg/ml 16 0.00 16.13 6.76 1.22 Interleukin 8* pg/ml 16 0.00 1287 123 86.13 Interleukin 10* pg/ml 16 0.00 178 52.77 12.79 Interleukin 12p70* pg/ml 16 0.00 6.68 0.79 0.54 Tumor Necrosis Factor α∗ pg/ml 16 0.00 7.70 2.18 0.84 IFN-Inducing Protein 10* pg/ml 16 0.00 17.43 2.23 1.20 T Cell Proliferation % Proliferation 16 23.47 55.82 37.82 2.94 Interleukin 2 pg/ml 16 11.88 89.02 39.78 5.99 Interferon γ pg/ml 16 35.27 3841 591 239 Interleukin 4 pg/ml 16 32.80 725 173 43.60 Interleukin 5 pg/ml 16 11.27 286 88.79 20.69 Interleukin 10 pg/ml 16 140 3613 986 233 Interleukin 13 pg/ml 16 56.63 2329 860 205 Poly I:C Viability % Live 16 73.25 96.77 90.70 1.69 Cluster Score 0-8 32 3.00 6.00 4.81 0.18 Phagocytosis MFI 16 457 7952 2531 509 CD11c MFI 16 44360 72549 62684 2399 HLA-DR MFI 16 1092 2457 1741 109 CD80 MFI 16 29630 92959 51408 5295 CD83 MFI 16 4458 39609 30029 224 CD86 MFI 16 11005 109085 81333 5939 CD54 MFI 16 74106 131152 100183 4475 Interleukin 6* pg/ml 16 529 3131 1837 211 Interleukin 8* pg/ml 16 0.00 5178 1891 363 Interleukin 10* pg/ml 16 15.57 3176 1009 262 Interleukin 12p70* pg/ml 16 50.14 5935 1199 450 Tumor Necrosis Factor α∗ pg/ml 16 86.75 1957 492 137 IFN-Inducing Protein 10* pg/ml 16 0.00 8797 2329 716 T Cell Proliferation % Proliferation 16 33.44 64.92 49.02 2.60 Interleukin 2 pg/ml 16 21.31 286 100 22.01 Interferon γ pg/ml 16 130 5022 1432 395 Interleukin 4 pg/ml 16 30.5 611 187 43.35 Interleukin 5 pg/ml 16 8.85 392 119 25.00 Interleukin 10 pg/ml 16 261 3984 1424 283 Interleukin 13 pg/ml 16 63.89 3667 1128 253
Note. * = Co-culture values minus EC only culture values; SEM = standard error of the mean.
38
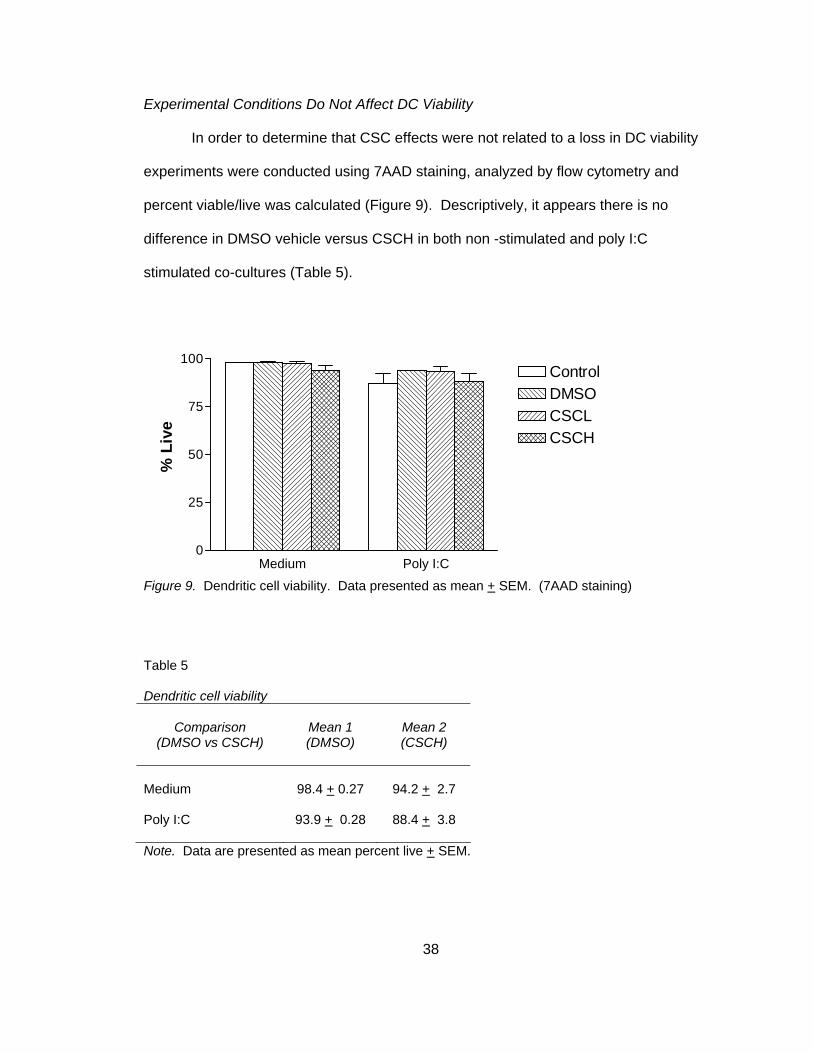
Experimental Conditions Do Not Affect DC Viability
In order to determine that CSC effects were not related to a loss in DC viability
experiments were conducted using 7AAD staining, analyzed by flow cytometry and
percent viable/live was calculated (Figure 9). Descriptively, it appears there is no
difference in DMSO vehicle versus CSCH in both non -stimulated and poly I:C
stimulated co-cultures (Table 5).
Medium Poly I:C0
25
50
75
100ControlDMSOCSCLCSCH
% L
ive
Figure 9. Dendritic cell viability. Data presented as mean + SEM. (7AAD staining)
Table 5 Dendritic cell viability
Comparison
(DMSO vs CSCH)
Mean 1 (DMSO)
Mean 2 (CSCH)
Medium
98.4 + 0.27
94.2 + 2.7
Poly I:C 93.9 + 0.28 88.4 + 3.8
Note. Data are presented as mean percent live + SEM.
39
CSC Induces Homotypic Clustering in Non-Stimulated Co-Cultures
None of the previous human in vitro studies described DC homotypic clustering
following smoke exposure. Homotypic clustering is the ability of DC to up-regulate
adhesion molecules and cluster together and is an indicator of DC maturation
(Delemarre et al., 2001). In order to determine if smoke exposure induced homotypic
clustering, light microscopy images (4x) were obtained following smoke and poly I:C
exposures and scored as previously described. A representative donor was chosen
and typical clustering can be seen in Figure 10B. A total of 8 individual donors were
used to calculate homotypic clustering and two blinded investigators scored each
condition based on a scoring system (Table 1) and scores were averaged. Co-cultures
that were not stimulated with poly I:C had a significant increase in cluster score
secondary to CSC exposure (2.31 + 0.47 versus 3.62 + 0.26), t(3) = -3.19, p<0.025 (two-
tailed) (Figure 10C and Table 6). In poly I:C stimulated co-cultures, clusters were
larger and accounted for a higher percentage of DC compared to no poly I:C stimulation;
however, there was no effect of CSC exposure (4.88 + 0.44 versus 4.75 + 0.37), t(3) =
0.73, p>0.050 (two-tailed), as depicted in Figure 10C and Table 6. A two-tailed test was
performed because it was unknown if CSC or poly I:C would reduce or increase
clustering.

40
Figure 10. Dendritic cell homotypic clustering. Light microscopy images: A. Single dendritic cell
(40x); B. small cluster (20x); C. large cluster (10x); D. Light microscopy images (4X) of all
experimental conditions from a representative donor; E. Cluster score, horizontal bar represents
mean, * = p value < critical alpha, 0.025 (two-tailed), n = 8.
Control
Medium Poly I:C
DMSO
CSCL
CSCH
Medium
Control DMSO CSCL CSCH0
1
2
3
4
5
6
7
8
*
Clu
ster
Sco
re
D E
Poly I:C
Control DMSO CSCL CSCH0
1
2
3
4
5
6
7
8
Clu
ster
Sco
re
A B C
41
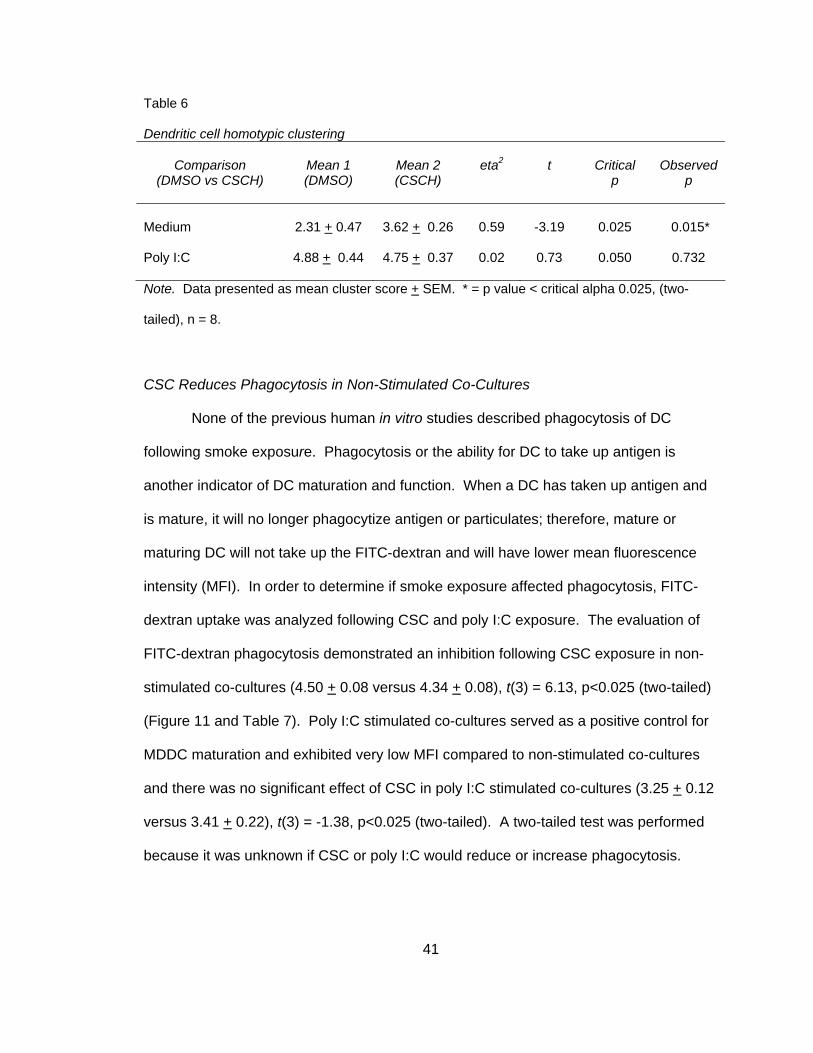
Table 6 Dendritic cell homotypic clustering
Comparison
(DMSO vs CSCH)
Mean 1 (DMSO)
Mean 2 (CSCH)
eta2
t
Critical
p
Observed
p
Medium
2.31 + 0.47
3.62 + 0.26
0.59
-3.19
0.025
0.015*
Poly I:C
4.88 + 0.44
4.75 + 0.37
0.02
0.73
0.050
0.732
Note. Data presented as mean cluster score + SEM. * = p value < critical alpha 0.025, (two-
tailed), n = 8.
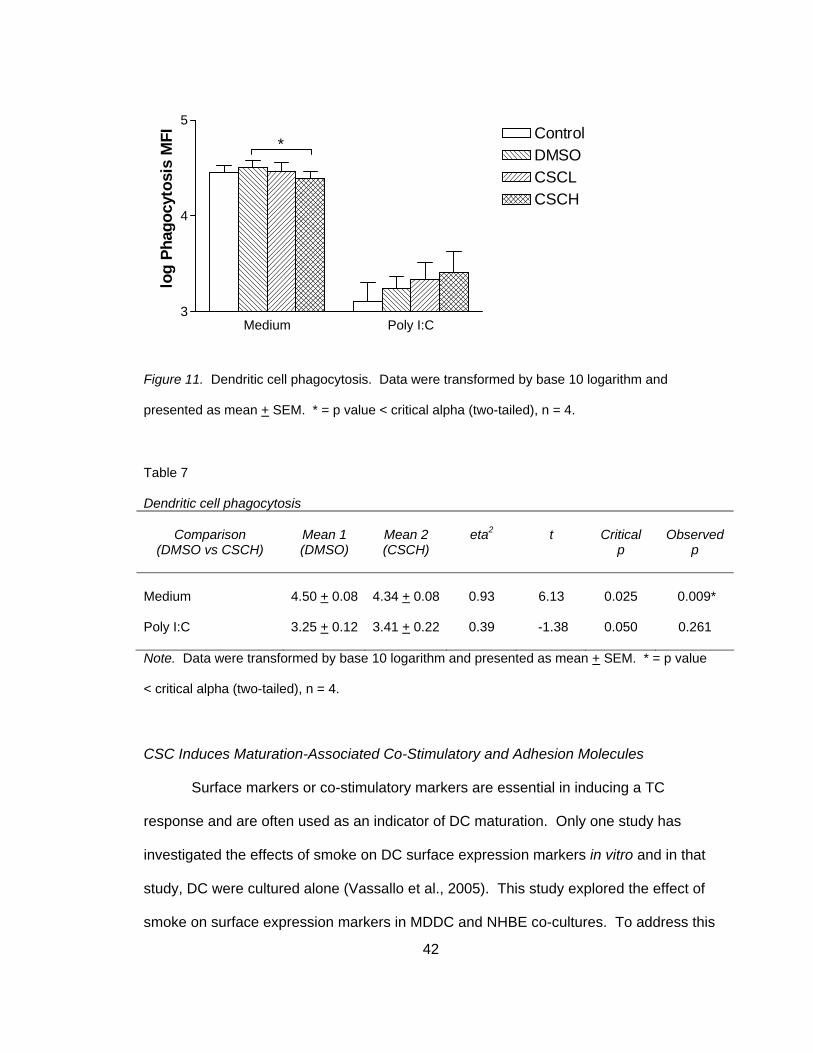
CSC Reduces Phagocytosis in Non-Stimulated Co-Cultures
None of the previous human in vitro studies described phagocytosis of DC
following smoke exposure. Phagocytosis or the ability for DC to take up antigen is
another indicator of DC maturation and function. When a DC has taken up antigen and
is mature, it will no longer phagocytize antigen or particulates; therefore, mature or
maturing DC will not take up the FITC-dextran and will have lower mean fluorescence
intensity (MFI). In order to determine if smoke exposure affected phagocytosis, FITC-
dextran uptake was analyzed following CSC and poly I:C exposure. The evaluation of
FITC-dextran phagocytosis demonstrated an inhibition following CSC exposure in non-
stimulated co-cultures (4.50 + 0.08 versus 4.34 + 0.08), t(3) = 6.13, p<0.025 (two-tailed)
(Figure 11 and Table 7). Poly I:C stimulated co-cultures served as a positive control for
MDDC maturation and exhibited very low MFI compared to non-stimulated co-cultures
and there was no significant effect of CSC in poly I:C stimulated co-cultures (3.25 + 0.12
versus 3.41 + 0.22), t(3) = -1.38, p<0.025 (two-tailed). A two-tailed test was performed
because it was unknown if CSC or poly I:C would reduce or increase phagocytosis.
42
Medium Poly I:C3
4
5ControlDMSOCSCLCSCH
*lo
g Ph
agoc
ytos
is M
FI
Figure 11. Dendritic cell phagocytosis. Data were transformed by base 10 logarithm and
presented as mean + SEM. * = p value < critical alpha (two-tailed), n = 4.
Table 7 Dendritic cell phagocytosis
Comparison
(DMSO vs CSCH)
Mean 1 (DMSO)
Mean 2 (CSCH)
eta2
t
Critical
p
Observed
p
Medium
4.50 + 0.08
4.34 + 0.08
0.93
6.13
0.025
0.009*
Poly I:C
3.25 + 0.12
3.41 + 0.22
0.39
-1.38
0.050
0.261
Note. Data were transformed by base 10 logarithm and presented as mean + SEM. * = p value
< critical alpha (two-tailed), n = 4.
CSC Induces Maturation-Associated Co-Stimulatory and Adhesion Molecules
Surface markers or co-stimulatory markers are essential in inducing a TC
response and are often used as an indicator of DC maturation. Only one study has
investigated the effects of smoke on DC surface expression markers in vitro and in that
study, DC were cultured alone (Vassallo et al., 2005). This study explored the effect of
smoke on surface expression markers in MDDC and NHBE co-cultures. To address this
43
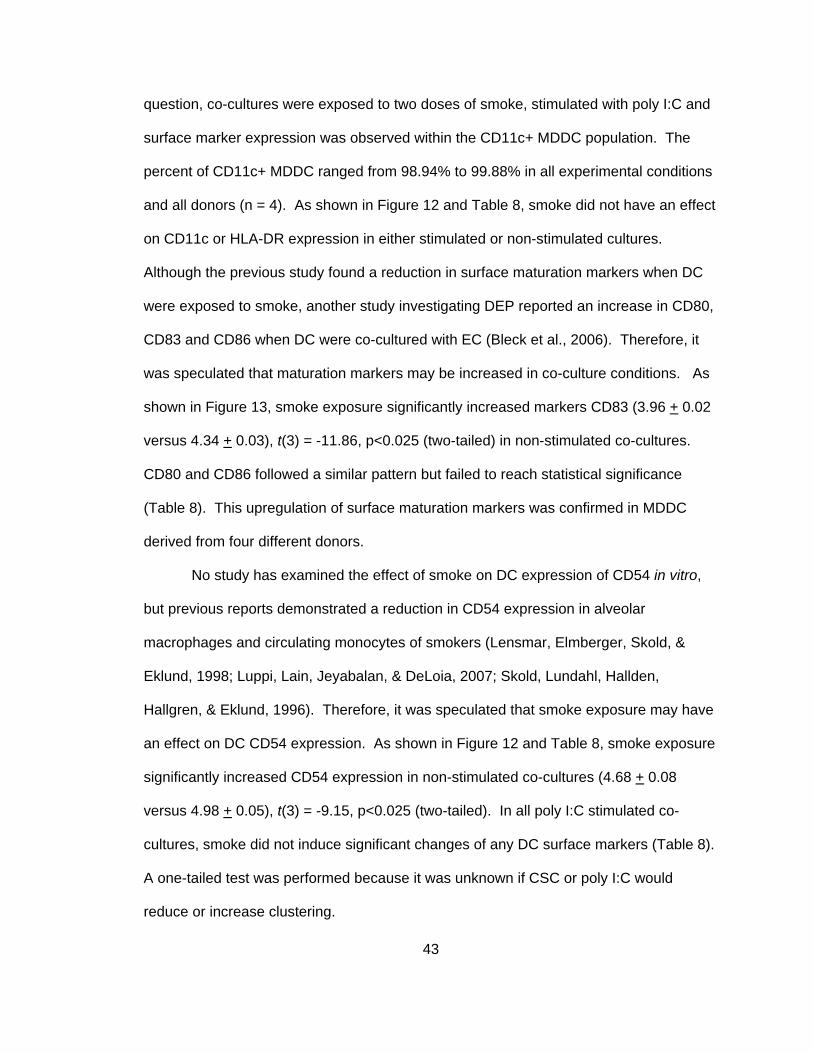
question, co-cultures were exposed to two doses of smoke, stimulated with poly I:C and
surface marker expression was observed within the CD11c+ MDDC population. The
percent of CD11c+ MDDC ranged from 98.94% to 99.88% in all experimental conditions
and all donors (n = 4). As shown in Figure 12 and Table 8, smoke did not have an effect
on CD11c or HLA-DR expression in either stimulated or non-stimulated cultures.
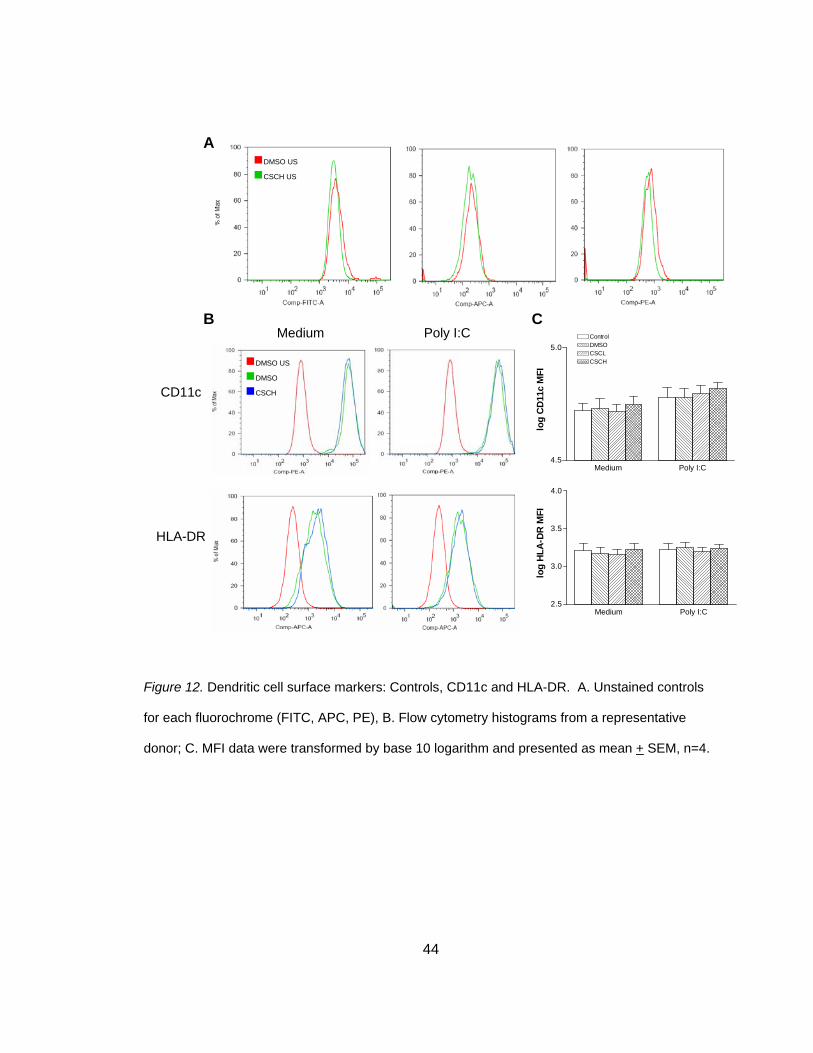
Although the previous study found a reduction in surface maturation markers when DC
were exposed to smoke, another study investigating DEP reported an increase in CD80,
CD83 and CD86 when DC were co-cultured with EC (Bleck et al., 2006). Therefore, it
was speculated that maturation markers may be increased in co-culture conditions. As
shown in Figure 13, smoke exposure significantly increased markers CD83 (3.96 + 0.02
versus 4.34 + 0.03), t(3) = -11.86, p<0.025 (two-tailed) in non-stimulated co-cultures.
CD80 and CD86 followed a similar pattern but failed to reach statistical significance
(Table 8). This upregulation of surface maturation markers was confirmed in MDDC
derived from four different donors.
No study has examined the effect of smoke on DC expression of CD54 in vitro,
but previous reports demonstrated a reduction in CD54 expression in alveolar
macrophages and circulating monocytes of smokers (Lensmar, Elmberger, Skold, &
Eklund, 1998; Luppi, Lain, Jeyabalan, & DeLoia, 2007; Skold, Lundahl, Hallden,
Hallgren, & Eklund, 1996). Therefore, it was speculated that smoke exposure may have
an effect on DC CD54 expression. As shown in Figure 12 and Table 8, smoke exposure
significantly increased CD54 expression in non-stimulated co-cultures (4.68 + 0.08
versus 4.98 + 0.05), t(3) = -9.15, p<0.025 (two-tailed). In all poly I:C stimulated co-
cultures, smoke did not induce significant changes of any DC surface markers (Table 8).
A one-tailed test was performed because it was unknown if CSC or poly I:C would
reduce or increase clustering.
44
Figure 12. Dendritic cell surface markers: Controls, CD11c and HLA-DR. A. Unstained controls
for each fluorochrome (FITC, APC, PE), B. Flow cytometry histograms from a representative
donor; C. MFI data were transformed by base 10 logarithm and presented as mean + SEM, n=4.
Medium Poly I:C
CD11c
HLA-DR
DMSO US
CSCH US
DMSO US
DMSO
CSCH
A
B C
Medium Poly I:C4.5
5.0
log
CD
11c
MFI
Medium Poly I:C2.5
3.0
3.5
4.0
log
HLA
-DR
MFI
ControlDMSOCSCLCSCH
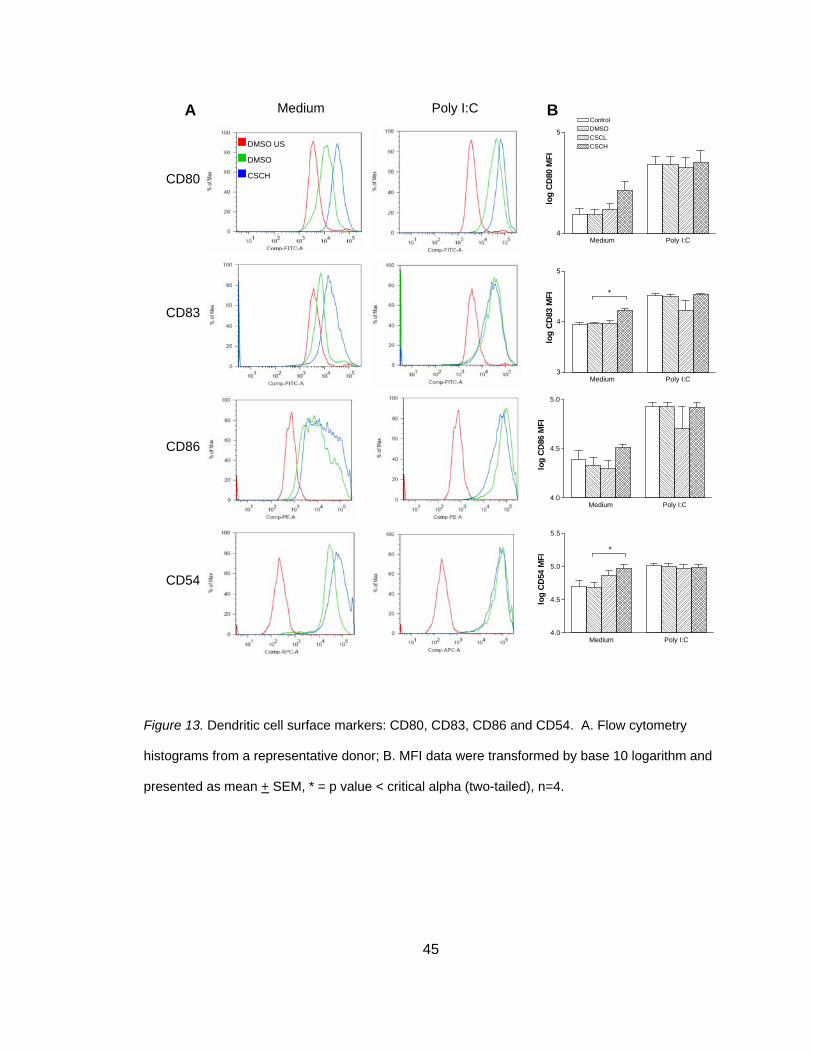
45
Figure 13. Dendritic cell surface markers: CD80, CD83, CD86 and CD54. A. Flow cytometry
histograms from a representative donor; B. MFI data were transformed by base 10 logarithm and
presented as mean + SEM, * = p value < critical alpha (two-tailed), n=4.
CD80
CD83
CD86
CD54
Medium Poly I:C
DMSO US
DMSO
CSCH
A B ControlDMSOCSCLCSCH
Medium Poly I:C4
5
log
CD
80 M
FI
Medium Poly I:C3
4
5
log
CD
83 M
FI *
Medium Poly I:C4.0
4.5
5.0
log
CD
86 M
FI
Medium Poly I:C4.0
4.5
5.0
5.5lo
g C
D54
MFI
*
46
Table 8 Dendritic cell surface markers
Comparison
(DMSO vs CSCH)
Mean 1 (DMSO)
Mean 2 (CSCH)
eta2
t
Critical
p
Observed
p
Medium
CD11c 4.73 + 0.05 4.78 + 0.03 0.38 -1.36 0.050 0.265 HLA-DR 3.17 + 0.04 3.22 + 0.03 0.63 -2.27 0.025 0.108 CD80 4.18 + 0.06 4.42 + 0.09 0.72 -2.78 0.025 0.069 CD83 3.96 + 0.02 4.23 + 0.03 0.98 -11.86 0.025 0.001* CD86 4.33 + 0.08 4.51 + 0.04 0.78 -3.24 0.025 0.048 CD54 4.68 + 0.08 4.98 + 0.05 0.97 -9.15 0.025 0.003* Poly I:C
CD11c 4.78 + 0.09 4.82 + 0.06 0.63 -2.25 0.025 0.110 HLA-DR 3.25 + 0.06 3.23 + 0.06 0.27 1.05 0.050 0.372 CD80 4.68 + 0.08 4.70 + 0.12 0.02 -0.25 0.050 0.819 CD83 4.50 + 0.04 4.53 + 0.05 0.10 -0.60 0.050 0.595 CD86 4.93 + 0.04 4.92 + 0.05 0.02 0.26 0.050 0.815 CD54 5.00 + 0.04 4.99 + 0.05 0.34 1.26 0.050 0.298
Note. MFI data were transformed by base 10 logarithm and presented as mean + SEM. * = p
value < critical alpha (two-tailed), n = 4.
CSC Failed to Significantly Affect Dendritic Cell Cytokines
Poly I:C stimulated co-cultures produced substantial amounts of all cytokines and
chemokines assayed as compared to non-stimulated cultures. Although none of the DC
cytokines were statistically different, two cytokines approached statistical significance,
IL10 in both poly I:C and non-stimulated co-cultures and interferon inducing protein 10
(IP10) in poly I:C stimulated co-cultures (Figure 14 and Table 9). Smoke exposure
increased IL10 suggesting that smoke induces DC Treg polarizing signal that could
contribute to immunosuppressive effects. IP10 was also increased in poly I:C stimulated
cultures which is an important chemoattractant of Th1 lymphocytes and is an appropriate
response to a viral stimulus.
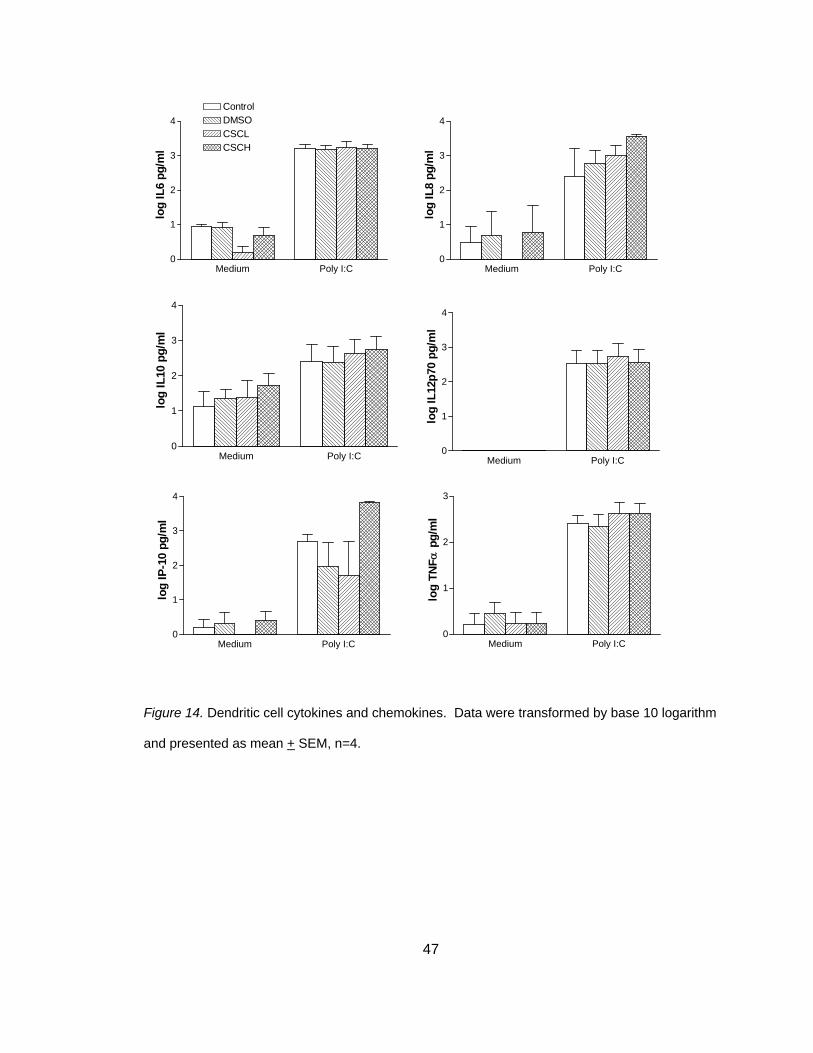
47
Figure 14. Dendritic cell cytokines and chemokines. Data were transformed by base 10 logarithm
and presented as mean + SEM, n=4.
Medium Poly I:C0
1
2
3
4
log
IL6
pg/m
l
Medium Poly I:C0
1
2
3
4
log
IL8
pg/m
l
Medium Poly I:C0
1
2
3
4
log
IL12
p70
pg/m
l
Medium Poly I:C0
1
2
3
4
log
IP-1
0 pg
/ml
Medium Poly I:C0
1
2
3
log
TNFα
pg/
ml
ControlDMSOCSCLCSCH
Medium Poly I:C0
1
2
3
4
log
IL10
pg/
ml

48
Table 9 Dendritic cell cytokines and chemokines
Comparison
(DMSO vs CSCH)
Mean 1 (DMSO)
Mean 2 (CSCH)
eta2
t
Critical
p
Observed
p
Medium
Interleukin 6 0.91 + 0.14 0.98 + 0.09 0.23 -0.95 0.025 0.207 Interleukin 8 0.69 + 0.69 0.78 + 0.78 0.00 -0.07 0.050 0.475 Interleukin 10 1.36 + 0.25 1.71 + 0.35 0.69 -2.61 0.050 0.040 Interleukin 12p70 0.00 + 0.00 0.00 + 0.00 -- -- -- -- Tumor Necrosis Factor α 0.44 + 0.26 0.23 + 0.23 0.23 0.94 0.050 0.208 Interferon-Inducible Protein 10
0.32 + 0.32 0.41 + 0.25 0.07 -0.46 0.050 0.338
Poly I:C
Interleukin 6 3.17 + 0.14 3.21 + 0.11 0.05 -0.43 0.050 0.349 Interleukin 8 2.78 + 0.37 3.54 + 0.08 0.54 -1.88 0.025 0.079 Interleukin 10 2.37 + 0.47 2.74 + 0.39 0.75 -2.97 0.025 0.029 Interleukin 12p70 2.54 + 0.38 2.56 + 0.38 0.03 -0.31 0.025 0.389 Tumor Necrosis Factor α 2.33 + 0.26 2.63 + 0.21 0.37 -1.33 0.025 0.138 Interferon-Inducible Protein 10
1.97 + 0.70 3.82 + 0.04 0.70 -2.62 0.025 0.040
Note. -- = unable to calculate; Data were transformed by base 10 logarithm and presented as
mean + SEM; critical p value (two-tailed).
CSC Failed to Induce TC Proliferation but Enhances Th2 Cytokine Production
TC proliferation is an indicator of DC ability to induce an immune response to
invading pathogens. Smoke exposed and poly I:C stimulated MDDC were co-cultured
with allogeneic, CFSE stained CD4+ TC in mixed lymphocyte reactions (DC:TC ratios of
1:8, 1:16, 1:32) for 4-5 days. Figure 15A shows stained, unstained, non-proliferated and
proliferated (PHA stimulated) controls and Figure 15B displays a representative donor of
TC proliferation (1:16 ratio). This study showed that despite evidence that CSC exposed
DC are maturing (increased clustering, decreased phagocytosis, increased maturation
markers), they do not significantly increase TC proliferation (Figure16). Figure 16 and
Table 10 represent pooled data from four experiments at a ratio of 1:16 (1:8, 1:32 data
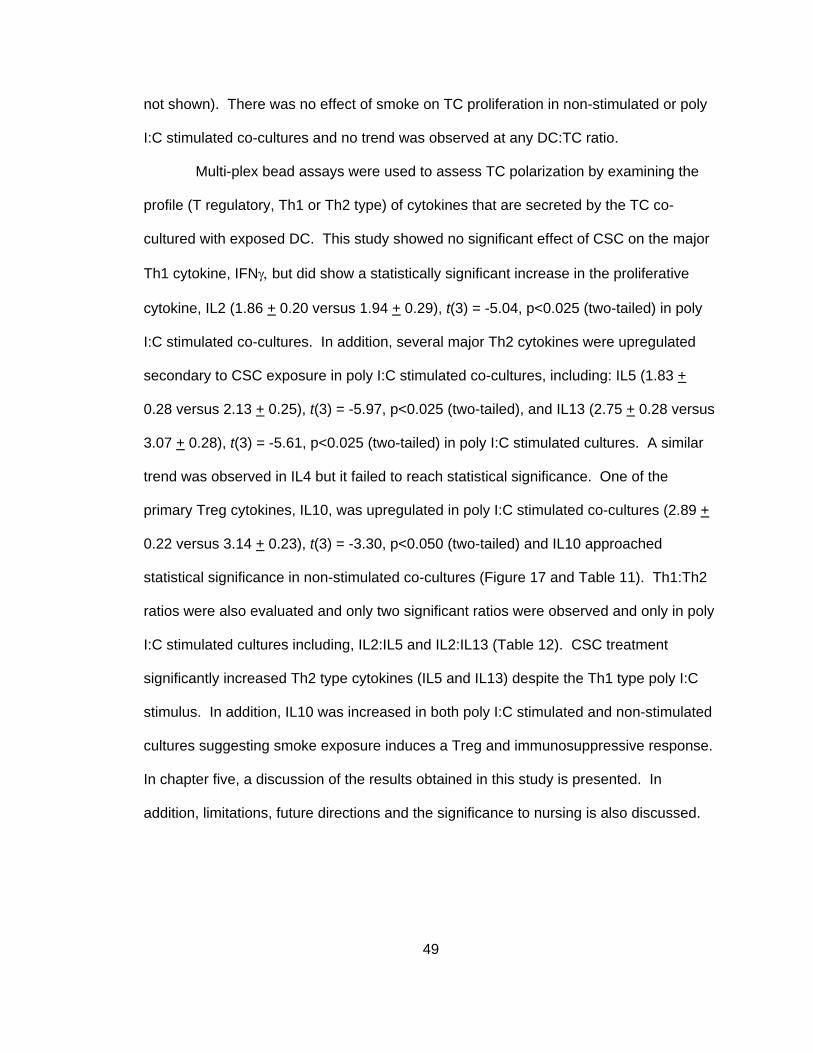
49
not shown). There was no effect of smoke on TC proliferation in non-stimulated or poly
I:C stimulated co-cultures and no trend was observed at any DC:TC ratio.
Multi-plex bead assays were used to assess TC polarization by examining the
profile (T regulatory, Th1 or Th2 type) of cytokines that are secreted by the TC co-
cultured with exposed DC. This study showed no significant effect of CSC on the major
Th1 cytokine, IFNγ, but did show a statistically significant increase in the proliferative
cytokine, IL2 (1.86 + 0.20 versus 1.94 + 0.29), t(3) = -5.04, p<0.025 (two-tailed) in poly
I:C stimulated co-cultures. In addition, several major Th2 cytokines were upregulated
secondary to CSC exposure in poly I:C stimulated co-cultures, including: IL5 (1.83 +
0.28 versus 2.13 + 0.25), t(3) = -5.97, p<0.025 (two-tailed), and IL13 (2.75 + 0.28 versus
3.07 + 0.28), t(3) = -5.61, p<0.025 (two-tailed) in poly I:C stimulated cultures. A similar
trend was observed in IL4 but it failed to reach statistical significance. One of the
primary Treg cytokines, IL10, was upregulated in poly I:C stimulated co-cultures (2.89 +
0.22 versus 3.14 + 0.23), t(3) = -3.30, p<0.050 (two-tailed) and IL10 approached
statistical significance in non-stimulated co-cultures (Figure 17 and Table 11). Th1:Th2
ratios were also evaluated and only two significant ratios were observed and only in poly
I:C stimulated cultures including, IL2:IL5 and IL2:IL13 (Table 12). CSC treatment
significantly increased Th2 type cytokines (IL5 and IL13) despite the Th1 type poly I:C
stimulus. In addition, IL10 was increased in both poly I:C stimulated and non-stimulated
cultures suggesting smoke exposure induces a Treg and immunosuppressive response.
In chapter five, a discussion of the results obtained in this study is presented. In
addition, limitations, future directions and the significance to nursing is also discussed.
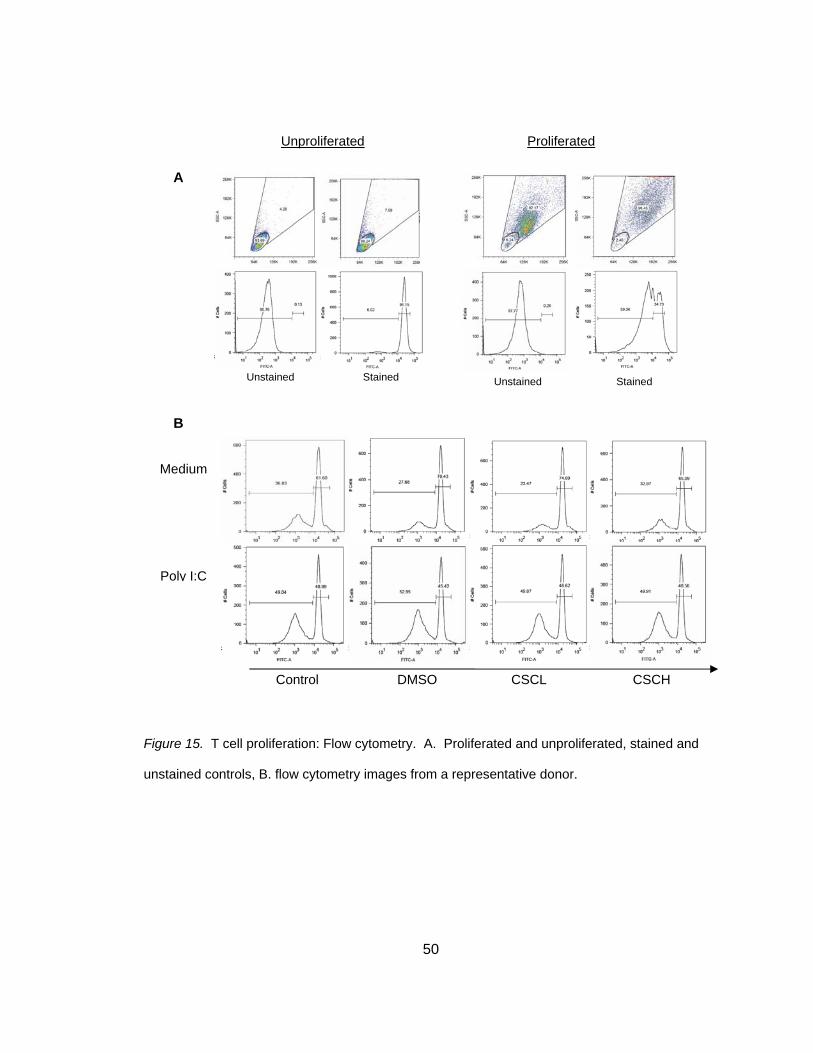
50
Figure 15. T cell proliferation: Flow cytometry. A. Proliferated and unproliferated, stained and
unstained controls, B. flow cytometry images from a representative donor.
Unproliferated Proliferated
Unstained Stained Unstained Stained
A
B
Control DMSO CSCL CSCH
Medium
Poly I:C
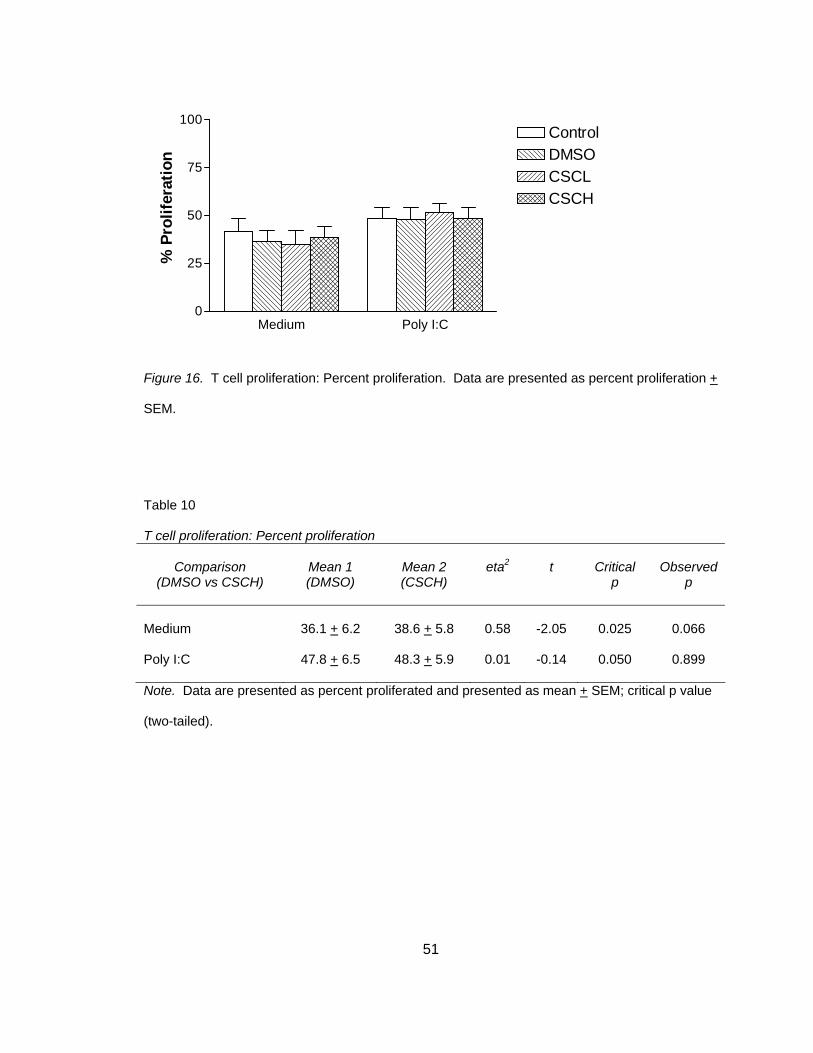
51
Medium Poly I:C0
25
50
75
100ControlDMSOCSCLCSCH
% P
rolif
erat
ion
Figure 16. T cell proliferation: Percent proliferation. Data are presented as percent proliferation +
SEM.
Table 10 T cell proliferation: Percent proliferation
Comparison
(DMSO vs CSCH)
Mean 1 (DMSO)
Mean 2 (CSCH)
eta2
t
Critical
p
Observed
p
Medium
36.1 + 6.2
38.6 + 5.8
0.58
-2.05
0.025
0.066
Poly I:C 47.8 + 6.5 48.3 + 5.9 0.01 -0.14 0.050 0.899
Note. Data are presented as percent proliferated and presented as mean + SEM; critical p value
(two-tailed).
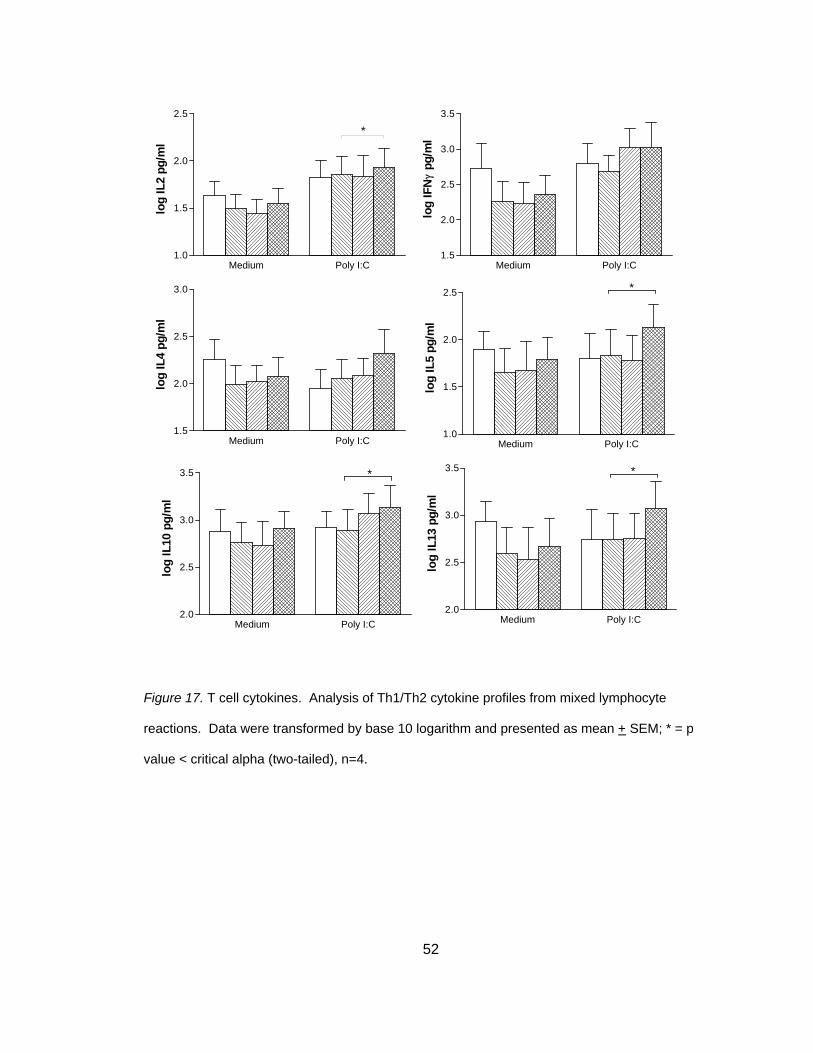
52
Figure 17. T cell cytokines. Analysis of Th1/Th2 cytokine profiles from mixed lymphocyte
reactions. Data were transformed by base 10 logarithm and presented as mean + SEM; * = p
value < critical alpha (two-tailed), n=4.
Medium Poly I:C1.0
1.5
2.0
2.5
*
log
IL2
pg/m
l
Medium Poly I:C1.5
2.0
2.5
3.0
3.5
log
IFN
γpg
/ml
Medium Poly I:C1.5
2.0
2.5
3.0
log
IL4
pg/m
l
Medium Poly I:C1.0
1.5
2.0
2.5
log
IL5
pg/m
l
*
Medium Poly I:C2.0
2.5
3.0
3.5
log
IL10
pg/
ml
*
Medium Poly I:C2.0
2.5
3.0
3.5
log
IL13
pg/
ml
*
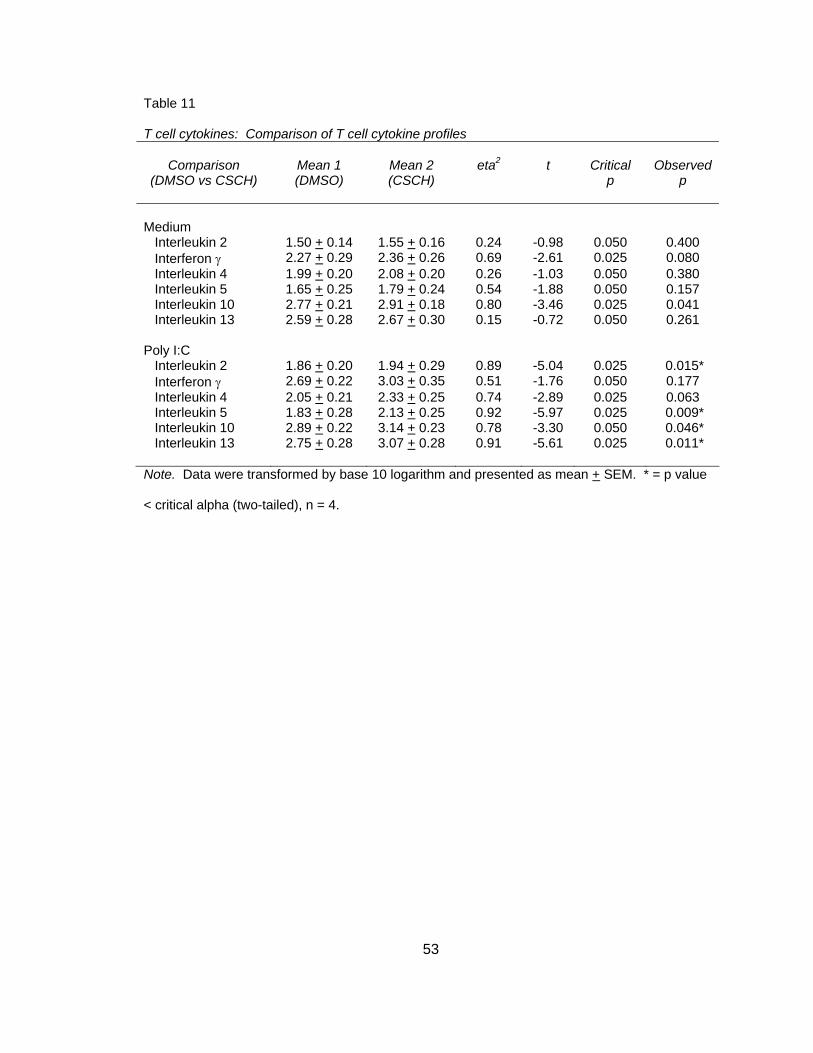
53
Table 11 T cell cytokines: Comparison of T cell cytokine profiles
Comparison
(DMSO vs CSCH)
Mean 1 (DMSO)
Mean 2 (CSCH)
eta2
t
Critical
p
Observed
p
Medium
Interleukin 2 1.50 + 0.14 1.55 + 0.16 0.24 -0.98 0.050 0.400 Interferon γ 2.27 + 0.29 2.36 + 0.26 0.69 -2.61 0.025 0.080 Interleukin 4 1.99 + 0.20 2.08 + 0.20 0.26 -1.03 0.050 0.380 Interleukin 5 1.65 + 0.25 1.79 + 0.24 0.54 -1.88 0.050 0.157 Interleukin 10 2.77 + 0.21 2.91 + 0.18 0.80 -3.46 0.025 0.041 Interleukin 13 2.59 + 0.28 2.67 + 0.30 0.15 -0.72 0.050 0.261 Poly I:C
Interleukin 2 1.86 + 0.20 1.94 + 0.29 0.89 -5.04 0.025 0.015* Interferon γ 2.69 + 0.22 3.03 + 0.35 0.51 -1.76 0.050 0.177 Interleukin 4 2.05 + 0.21 2.33 + 0.25 0.74 -2.89 0.025 0.063 Interleukin 5 1.83 + 0.28 2.13 + 0.25 0.92 -5.97 0.025 0.009* Interleukin 10 2.89 + 0.22 3.14 + 0.23 0.78 -3.30 0.050 0.046* Interleukin 13 2.75 + 0.28 3.07 + 0.28 0.91 -5.61 0.025 0.011*
Note. Data were transformed by base 10 logarithm and presented as mean + SEM. * = p value
< critical alpha (two-tailed), n = 4.
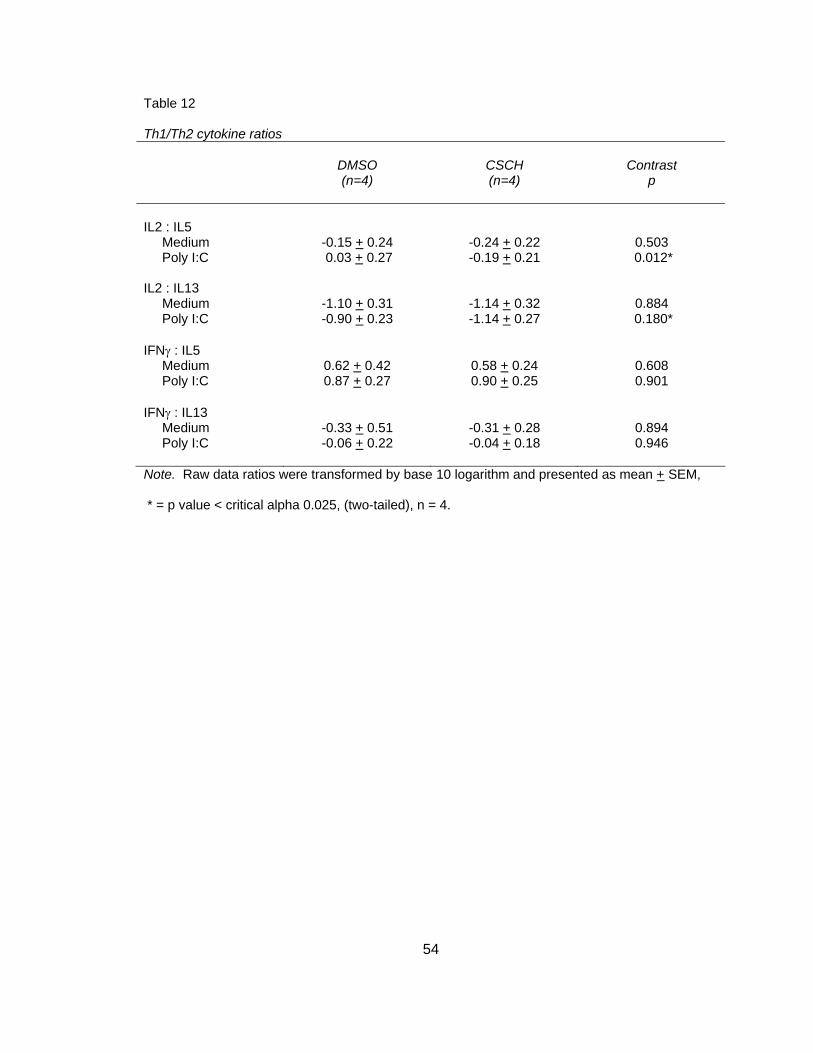
54
Table 12
Th1/Th2 cytokine ratios
DMSO (n=4)
CSCH (n=4)
Contrast
p
IL2 : IL5
Medium -0.15 + 0.24 -0.24 + 0.22 0.503 Poly I:C 0.03 + 0.27 -0.19 + 0.21 0.012* IL2 : IL13
Medium -1.10 + 0.31 -1.14 + 0.32 0.884 Poly I:C -0.90 + 0.23 -1.14 + 0.27 0.180* IFNγ : IL5
Medium 0.62 + 0.42 0.58 + 0.24 0.608 Poly I:C 0.87 + 0.27 0.90 + 0.25 0.901 IFNγ : IL13
Medium -0.33 + 0.51 -0.31 + 0.28 0.894 Poly I:C -0.06 + 0.22 -0.04 + 0.18 0.946
Note. Raw data ratios were transformed by base 10 logarithm and presented as mean + SEM,
* = p value < critical alpha 0.025, (two-tailed), n = 4.
55
Chapter Five
Discussion
Summary of Findings
This is the first study to investigate the effects of cigarette smoke in a
dendritic/bronchial epithelial cell co-culture model. Since DC posses the ability to
sample the bronchial airway, take up smoke particulates and are key mediators of
immune response, it was reasoned that DC function and DC-induced TC response may
be affected by cigarette smoke. Only two studies have evaluated the effects of cigarette
smoke on human DC function. In these two studies, DC were cultured alone. By
culturing DC with smoke-exposed EC, it takes into account the impact of the tissue
micro-environment. Therefore, this study provides insight into EC-DC interactions in
smoke exposure and may provide evidence for disease and infection susceptibility in
cigarette smokers; including how a smoker exposed to viral infection may respond.
In the context of smoke exposure only, this study indicates that cigarette smoke
has the ability to decrease phagocytosis ability of DC and increases co-stimulatory
maturation markers without inducing TC proliferation and inducing a potential Treg
phenotype (Figure 18A). IL8, a potent neutrophil chemokine was predominantly
expressed by EC and was significantly increased in smoke exposed, non-stimulated co-
cultures. This is an important epithelial injury signal that recruits other inflammatory cells
into the airway and critical in vivo.
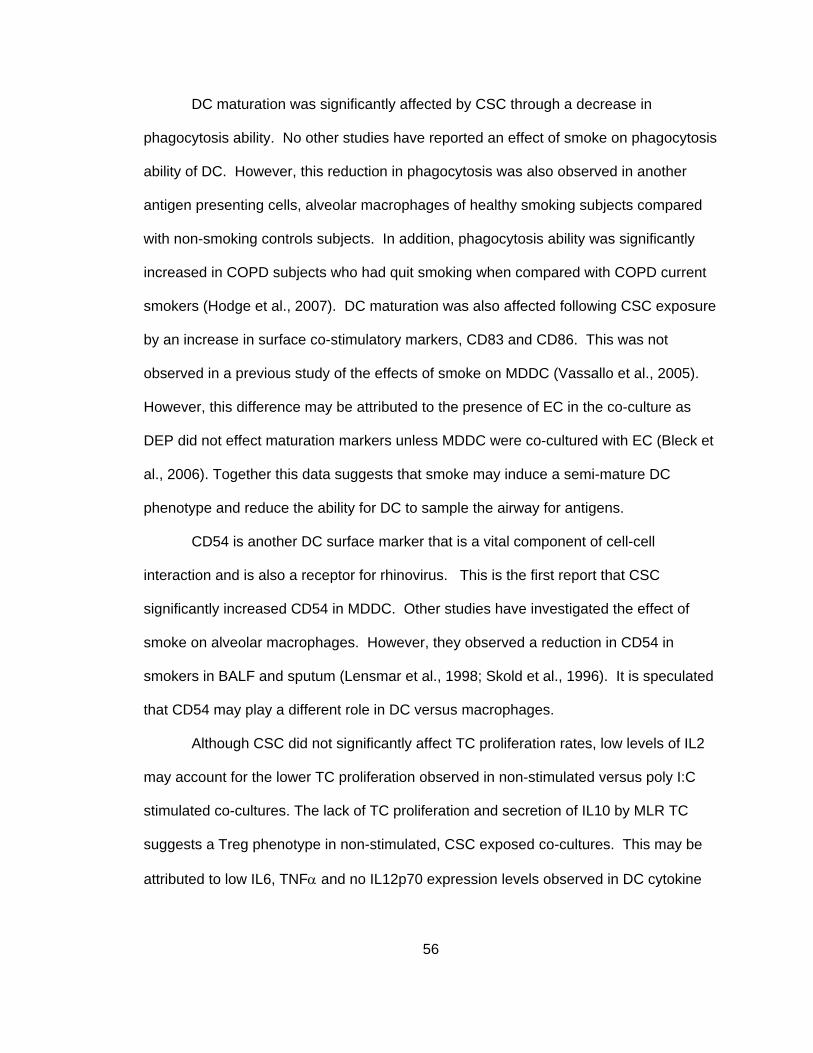
56
DC maturation was significantly affected by CSC through a decrease in
phagocytosis ability. No other studies have reported an effect of smoke on phagocytosis
ability of DC. However, this reduction in phagocytosis was also observed in another
antigen presenting cells, alveolar macrophages of healthy smoking subjects compared
with non-smoking controls subjects. In addition, phagocytosis ability was significantly
increased in COPD subjects who had quit smoking when compared with COPD current
smokers (Hodge et al., 2007). DC maturation was also affected following CSC exposure
by an increase in surface co-stimulatory markers, CD83 and CD86. This was not
observed in a previous study of the effects of smoke on MDDC (Vassallo et al., 2005).
However, this difference may be attributed to the presence of EC in the co-culture as
DEP did not effect maturation markers unless MDDC were co-cultured with EC (Bleck et
al., 2006). Together this data suggests that smoke may induce a semi-mature DC
phenotype and reduce the ability for DC to sample the airway for antigens.
CD54 is another DC surface marker that is a vital component of cell-cell
interaction and is also a receptor for rhinovirus. This is the first report that CSC
significantly increased CD54 in MDDC. Other studies have investigated the effect of
smoke on alveolar macrophages. However, they observed a reduction in CD54 in
smokers in BALF and sputum (Lensmar et al., 1998; Skold et al., 1996). It is speculated
that CD54 may play a different role in DC versus macrophages.
Although CSC did not significantly affect TC proliferation rates, low levels of IL2
may account for the lower TC proliferation observed in non-stimulated versus poly I:C
stimulated co-cultures. The lack of TC proliferation and secretion of IL10 by MLR TC
suggests a Treg phenotype in non-stimulated, CSC exposed co-cultures. This may be
attributed to low IL6, TNFα and no IL12p70 expression levels observed in DC cytokine
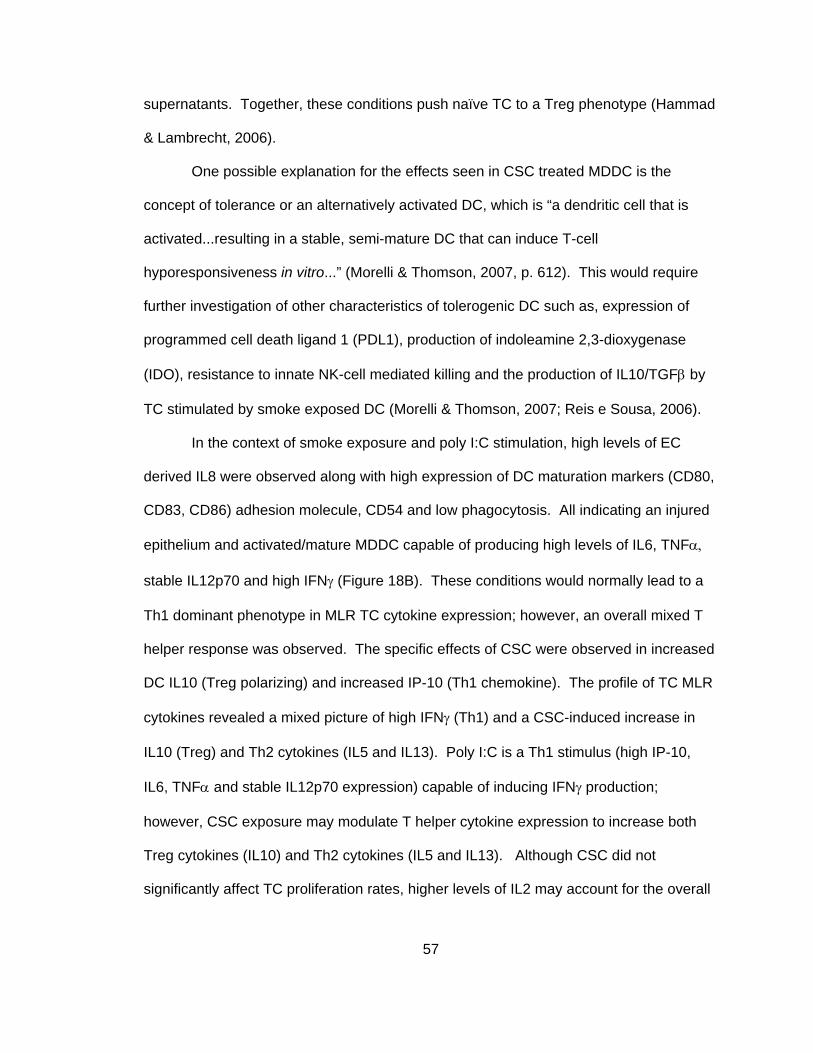
57
supernatants. Together, these conditions push naïve TC to a Treg phenotype (Hammad
& Lambrecht, 2006).
One possible explanation for the effects seen in CSC treated MDDC is the
concept of tolerance or an alternatively activated DC, which is “a dendritic cell that is
activated...resulting in a stable, semi-mature DC that can induce T-cell
hyporesponsiveness in vitro...” (Morelli & Thomson, 2007, p. 612). This would require
further investigation of other characteristics of tolerogenic DC such as, expression of
programmed cell death ligand 1 (PDL1), production of indoleamine 2,3-dioxygenase
(IDO), resistance to innate NK-cell mediated killing and the production of IL10/TGFβ by
TC stimulated by smoke exposed DC (Morelli & Thomson, 2007; Reis e Sousa, 2006).
In the context of smoke exposure and poly I:C stimulation, high levels of EC
derived IL8 were observed along with high expression of DC maturation markers (CD80,
CD83, CD86) adhesion molecule, CD54 and low phagocytosis. All indicating an injured
epithelium and activated/mature MDDC capable of producing high levels of IL6, TNFα,
stable IL12p70 and high IFNγ (Figure 18B). These conditions would normally lead to a
Th1 dominant phenotype in MLR TC cytokine expression; however, an overall mixed T
helper response was observed. The specific effects of CSC were observed in increased
DC IL10 (Treg polarizing) and increased IP-10 (Th1 chemokine). The profile of TC MLR
cytokines revealed a mixed picture of high IFNγ (Th1) and a CSC-induced increase in
IL10 (Treg) and Th2 cytokines (IL5 and IL13). Poly I:C is a Th1 stimulus (high IP-10,
IL6, TNFα and stable IL12p70 expression) capable of inducing IFNγ production;
however, CSC exposure may modulate T helper cytokine expression to increase both
Treg cytokines (IL10) and Th2 cytokines (IL5 and IL13). Although CSC did not
significantly affect TC proliferation rates, higher levels of IL2 may account for the overall
58
higher TC proliferation rate observed in poly I:C stimulated versus non-stimulated co-
cultures.
The mixed presentation in T helper cytokines that was observed in MLR
supernatants may be a function of DC to TC ratios. One study reported that high DC:TC
ratios (1:4), like the ratio used in this study (1:16), resulted in a mixed Th1/Th2 response
while low DC:TC ratios (1:300) resulted in a Th2 phenotype (Tanaka, Demeure, Rubio,
Delespesse, & Sarfati, 2000). In addition, MLR reactions were carried out with CD4+
TC, not naïve therefore a true picture of TC polarization may not be clear due to the
potential presence of all subtypes of T helper cells.
Overall, these findings suggest that DC of smokers may be less likely to mount a
normal immune response to invading pathogens thus providing evidence for smoker
susceptibility to infection. It may also provide insight into how DC of smokers may
respond to viral infection. In addition, these findings are particularly important in patients
with allergic airway disease since increasing Th2 cytokines would increase the risk for
disease exacerbation. Because DC play a critical role in modulating immune response
to environmental agents, they have become a primary target for drug development for
diseases that are largely mediated by environmental triggers, such as asthma and
COPD (Kool & Lambrecht, 2007). This study provides basic information that may be
used in the development of therapeutic agents.
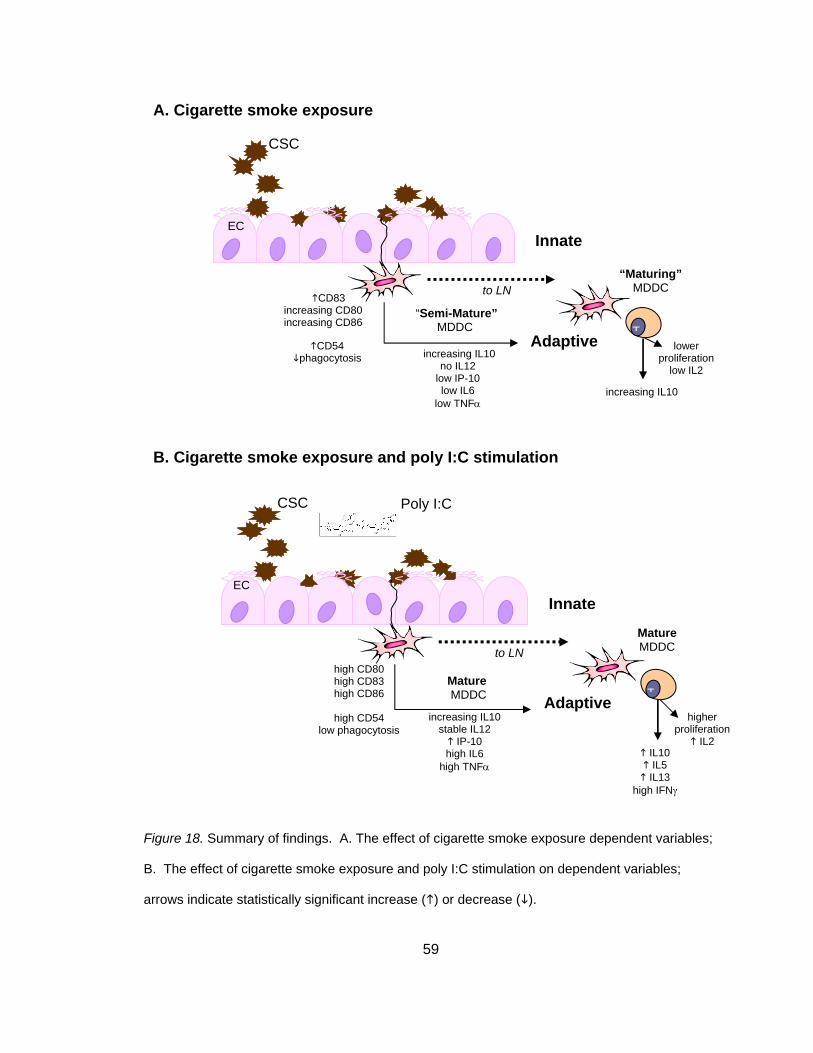
59
Figure 18. Summary of findings. A. The effect of cigarette smoke exposure dependent variables;
B. The effect of cigarette smoke exposure and poly I:C stimulation on dependent variables;
arrows indicate statistically significant increase ( ) or decrease ( ).
to LN
Innate
DC “Semi-Mature”
MDDC T
EC
Adaptive
increasing IL10
“Maturing”MDDC
CSC
increasing IL10 no IL12
low IP-10 low IL6
low TNFα
to LN
Innate
Mature MDDC T
EC
Adaptive
IL10 IL5
IL13 high IFNγ
MatureMDDC
CSC
increasing IL10 stable IL12
IP-10 high IL6
high TNFα
B. Cigarette smoke exposure and poly I:C stimulation
Poly I:C
CD83 increasing CD80 increasing CD86
CD54 phagocytosis
high CD80 high CD83 high CD86
high CD54
low phagocytosis
lower proliferation
low IL2
A. Cigarette smoke exposure
higher proliferation
IL2
60
Limitations
A major strength of this study was the use of cells obtained from human subjects;
however this is also a major limitation due to human subject variability a repeated
measures analysis approach was used in an effort to control for this variability. One of
the perplexing questions regarding COPD is why some smokers develop disease while
others do not. In addition, there are mixed phenotypes including chronic bronchitis,
emphysema and mixed presentations with asthma. Therefore it is not surprising that
some subjects would immunologically respond to smoke while others would not. Also,
all donor information was de-identified and there was no information regarding health
history, medication use or smoking history and due to the limited sample size (n = 4) it is
difficult to make general assumptions regarding the effects of smoke. Gender and age
of the subjects may have also played a role in the immune responses investigated and
the heterogeneous sample may have contributed to the mixed results. However, the
small sample size did not permit investigation of the variation due to these demographic
variables. Another limitation is that the donor of the NHBE cells is different than the
donor of MDDC and TC. This may present an issue of self versus non-self recognition
and result in an artificial immune response.
Another drawback of this study was the dose and time of CSC exposure. This
study used a single acute exposure and NHBE cells were exposed for approximately 36
hours while MDDC were only exposed for 24 hours. Other studies of DEP exposure in
EC-DC co-cultures used a 48 hour time course. Since this study used 24 hours, it may
have been too early to detect late phase changes. In addition, length of poly I:C
exposure may have limited the amount of IFNγ secreted from MDDC. In this study,
MDDC were exposed to poly I:C for 24 hours and a previous study of smoke and poly
I:C exposure in human PBMC showed minimal IFNγ following 24 hours and a significant
61
increase observed at 48 and 72 hours (Mian, Lauzon, Stampfli, Mossman, & Ashkar,
2008). Time course experiments need to be conducted.
Cigarette smoke consists of two components: vapour and particulate phases.
CSC provides a model of the particulate phase of smoke. There is some controversy
that CSC is an appropriate model for smoke exposure and the need for a particle only
control in order to distinguish specific versus non-specific effects of particulates. Most of
the chemicals and nicotine associated with smoke are contained in the particulate phase
of smoke. It is this component of smoke primarily responsible for the
immunosuppressive effects of smoke (Nouri-Shirazi & Guinet, 2006; Sopori, 2002) and
is therefore an appropriate model for in vitro study. One cannot argue the value of
controls but due to the thousands of chemicals, including tar and nicotine contained in
CSC it can be argued that treatment effects observed are most likely due to chemicals
rather than particulates.
Future Directions
Further investigation into the time course effects of cigarette smoke on DC will be
important to understand acute versus late phase immune responses. Other surface
markers such as CCR7, CD40/OX40L and cytokines such as TSLP/TGFβ should also
be explored to elucidate the effects of migration, TC stimulation and Th2/Treg induction,
respectively. In addition, MLR experiments should be conducted with naïve TC at
various responder ratios in order to determine true TC polarization. Findings from this
study can inform clinical research. One example would be to isolate MDDC from
smokers and non-smokers and those isolated cells exposed to cigarette smoke.
EC play a critical role in innate immunity by recognizing invading pathogens and
secreting antimicrobial substances such as defensins and inflammatory/chemotactic
62
mediators such as cytokines, chemokines and leukotrienes (Bals & Hiemstra, 2004).
Further study should focus on how smoke exposed EC not only regulate inflammation
and the immune response but how they interact with DC through cell to cell contact and
soluble mediators (Polito & Proud, 1998; Schleimer et al., 2007; Stick & Holt, 2003).
This knowledge will be critical in understanding the pathophysiology of many lung
diseases and would provide many potential therapeutic targets. Overall, this study
provides a sound basis for future investigation into the complex effect of smoke on DC
and lung disease.
Significance to Nursing
Although this study is based on basic science experiments, much of the
knowledge obtained can be applied to nursing education, research and practice.
Information obtained in nursing and medical research is shared. In nursing education,
one of the foundational courses is pathophysiology which includes immunology concepts
therefore information obtained in this study applies to the foundation of nursing
education. With regards to nursing research, by nurses becoming familiar with
immunology techniques they can incorporate these concepts in to clinical research and
impact the progress of nursing science. Nursing practice is affected by research through
the incorporation of research findings into evidence-based practice. The main goal of all
research is to increase knowledge in order to improve our understanding of disease and
positively affect patient care. By understanding more about the effects of cigarette
smoke not only do we increase pathophysiological knowledge of diseases affected by
smoking but we indirectly impact patient care through improved diagnostics,
therapeutics, interventions and evaluation.
63
References
Alvarez, G. G., Schulzer, M., Jung, D., & Fitzgerald, J. M. (2005). A systematic review of
risk factors associated with near-fatal and fatal asthma. Can Respir J, 12(5), 265-
270.
American Lung Association. (2003). Lung Disease Data 2003 [Electronic Version] from
http://www.lungusa.org/atf/cf/{7A8D42C2-FCCA-4604-8ADE-
7F5D5E762256}/LUNG_DISEASE_DATA2003.PDF.
American Lung Association. (2006). Lung Disease Data: 2006 [Electronic Version].
Retrieved October 25, 2007 from http://www.lungusa.org/atf/cf/%7B7A8D42C2-
FCCA-4604-8ADE-7F5D5E762256%7D/LDD2006.PDF.
Bai, T. R., Vonk, J. M., Postma, D. S., & Boezen, H. M. (2007). Severe exacerbations
predict excess lung function decline in asthma. Eur Respir J.
Bals, R., & Hiemstra, P. S. (2004). Innate immunity in the lung: how epithelial cells fight
against respiratory pathogens. Eur Respir J, 23(2), 327-333.
Bleck, B., Tse, D. B., Jaspers, I., Curotto de Lafaille, M. A., & Reibman, J. (2006). Diesel
exhaust particle-exposed human bronchial epithelial cells induce dendritic cell
maturation. J Immunol, 176(12), 7431-7437.
Bratke, K., Lommatzsch, M., Julius, P., Kuepper, M., Kleine, H. D., Luttmann, W., et al.
(2007). Dendritic cell subsets in human bronchoalveolar lavage fluid after
segmental allergen challenge. Thorax, 62(2), 168-175.
Carroll, K. N., Gebretsadik, T., Griffin, M. R., Dupont, W. D., Mitchel, E. F., Wu, P., et al.
(2007). Maternal asthma and maternal smoking are associated with increased
risk of bronchiolitis during infancy. Pediatrics, 119(6), 1104-1112.
64
Centers for Disease Control and Prevention. (2007). Exposure to secondhand smoke
among students aged 13-15 years--worldwide, 2000-2007. MMWR Morb Mortal
Wkly Rep, 56(20), 497-500.
Chemblink.com. (2007). Polyinosinic-polycytidylic acid image. In
http://www.chemblink.com/structures/24939-03-5.gif (Ed.).
Ciencewicki, J., Brighton, L., Wu, W. D., Madden, M., & Jaspers, I. (2006). Diesel
exhaust enhances virus- and poly(I:C)-induced Toll-like receptor 3 expression
and signaling in respiratory epithelial cells. Am J Physiol Lung Cell Mol Physiol,
290(6), L1154-1163.
Cochand, L., Isler, P., Songeon, F., & Nicod, L. P. (1999). Human lung dendritic cells
have an immature phenotype with efficient mannose receptors. Am J Respir Cell
Mol Biol, 21(5), 547-554.
Cook, D. N., & Bottomly, K. (2007). Innate immune control of pulmonary dendritic cell
trafficking. Proc Am Thorac Soc, 4(3), 234-239.
Cools, N., Ponsaerts, P., Van Tendeloo, V. F., & Berneman, Z. N. (2007). Regulatory T
cells and human disease. Clin Dev Immunol, 2007, 89195.
Cote, C. G., Dordelly, L. J., & Celli, B. R. (2007). Impact of COPD exacerbations on
patient-centered outcomes. Chest, 131(3), 696-704.
de Heer, H. J., Hammad, H., Kool, M., & Lambrecht, B. N. (2005). Dendritic cell subsets
and immune regulation in the lung. Semin Immunol, 17(4), 295-303.
Delemarre, F. G., Hoogeveen, P. G., De Haan-Meulman, M., Simons, P. J., & Drexhage,
H. A. (2001). Homotypic cluster formation of dendritic cells, a close correlate of
their state of maturation. Defects in the biobreeding diabetes-prone rat. J Leukoc
Biol, 69(3), 373-380.
65
Demedts, I. K., Brusselle, G. G., Vermaelen, K. Y., & Pauwels, R. A. (2005).
Identification and characterization of human pulmonary dendritic cells. Am J
Respir Cell Mol Biol, 32(3), 177-184.
Diaz-Sanchez, D., Rumold, R., & Gong, H., Jr. (2006). Challenge with environmental
tobacco smoke exacerbates allergic airway disease in human beings. J Allergy
Clin Immunol, 118(2), 441-446.
Donaldson, G. C., Seemungal, T. A., Bhowmik, A., & Wedzicha, J. A. (2002).
Relationship between exacerbation frequency and lung function decline in
chronic obstructive pulmonary disease. Thorax, 57(10), 847-852.
Donnenberg, V. S., & Donnenberg, A. D. (2003). Identification, rare-event detection and
analysis of dendritic cell subsets in broncho-alveolar lavage fluid and peripheral
blood by flow cytometry. Front Biosci, 8, s1175-1180.
Doyle, S. E., O'Connell, R., Vaidya, S. A., Chow, E. K., Yee, K., & Cheng, G. (2003).
Toll-like receptor 3 mediates a more potent antiviral response than Toll-like
receptor 4. J Immunol, 170(7), 3565-3571.
Duez, C., Gosset, P., & Tonnel, A. B. (2006). Dendritic cells and toll-like receptors in
allergy and asthma. Eur J Dermatol, 16(1), 12-16.
Eisner, M. D., & Iribarren, C. (2007). The influence of cigarette smoking on adult asthma
outcomes. Nicotine Tob Res, 9(1), 53-56.
Eisner, M. D., Klein, J., Hammond, S. K., Koren, G., Lactao, G., & Iribarren, C. (2005).
Directly measured second hand smoke exposure and asthma health outcomes.
Thorax, 60(10), 814-821.
Ezekowitz, A. B., & Hoffman, J. A. (2003). Innate immunity In A. B. Ezekowitz & J. A.
Hoffman (Eds.): Humana Press, Totowa, NJ.
66
Fratiglioni, L., & Wang, H. X. (2000). Smoking and Parkinson's and Alzheimer's disease:
review of the epidemiological studies. Behav Brain Res, 113(1-2), 117-120.
Gershwin, L. J. (2007). Effects of allergenic extracts on airway epithelium. Curr Allergy
Asthma Rep, 7(5), 357-362.
Glader, P., Moller, S., Lilja, J., Wieslander, E., Lofdahl, C. G., & von Wachenfeldt, K.
(2006). Cigarette smoke extract modulates respiratory defence mechanisms
through effects on T-cells and airway epithelial cells. Respir Med, 100(5), 818-
827.
Goodwin, R. D. (2007). Environmental tobacco smoke and the epidemic of asthma in
children: the role of cigarette use. Ann Allergy Asthma Immunol, 98(5), 447-454.
Grayson, M. H. (2006). Lung dendritic cells and the inflammatory response. Ann Allergy
Asthma Immunol, 96(5), 643-651; quiz 652-643, 678.
Guillot, L., Le Goffic, R., Bloch, S., Escriou, N., Akira, S., Chignard, M., et al. (2005).
Involvement of toll-like receptor 3 in the immune response of lung epithelial cells
to double-stranded RNA and influenza A virus. J Biol Chem, 280(7), 5571-5580.
Halken, S. (2004). Prevention of allergic disease in childhood: clinical and
epidemiological aspects of primary and secondary allergy prevention. Pediatr
Allergy Immunol, 15 Suppl 16, 4-5, 9-32.
Hammad, H., & Lambrecht, B. N. (2006). Recent progress in the biology of airway
dendritic cells and implications for understanding the regulation of asthmatic
inflammation. J Allergy Clin Immunol, 118(2), 331-336.
Hewson, C. A., Jardine, A., Edwards, M. R., Laza-Stanca, V., & Johnston, S. L. (2005).
Toll-like receptor 3 is induced by and mediates antiviral activity against rhinovirus
infection of human bronchial epithelial cells. J Virol, 79(19), 12273-12279.
67
Hodge, S., Hodge, G., Ahern, J., Jersmann, H., Holmes, M., & Reynolds, P. N. (2007).
Smoking alters alveolar macrophage recognition and phagocytic ability:
implications in chronic obstructive pulmonary disease. Am J Respir Cell Mol Biol,
37(6), 748-755.
Holland, B. S., & Copenhaver, M. D. (1988). Improved Bonferroni-type multiple testing
procedures. Psychological Bulletin, 104(1), 145-149.
Iwasaki, A. (2007). Mucosal dendritic cells. Annu Rev Immunol, 25, 381-418.
Jyonouchi, H. (1999). Airway epithelium and apoptosis. Apoptosis, 4(6), 407-417.
Kalinski, P., Hilkens, C. M., Wierenga, E. A., & Kapsenberg, M. L. (1999). T-cell priming
by type-1 and type-2 polarized dendritic cells: the concept of a third signal.
Immunol Today, 20(12), 561-567.
Kanner, R. E., Anthonisen, N. R., & Connett, J. E. (2001). Lower respiratory illnesses
promote FEV(1) decline in current smokers but not ex-smokers with mild chronic
obstructive pulmonary disease: results from the lung health study. Am J Respir
Crit Care Med, 164(3), 358-364.
Kao, C. Y., Huang, F., Chen, Y., Thai, P., Wachi, S., Kim, C., et al. (2005). Up-regulation
of CC chemokine ligand 20 expression in human airway epithelium by IL-17
through a JAK-independent but MEK/NF-kappaB-dependent signaling pathway. J
Immunol, 175(10), 6676-6685.
Kapsenberg, M. L. (2003). Dendritic-cell control of pathogen-driven T-cell polarization.
Nat Rev Immunol, 3(12), 984-993.
Kato, A., Favoreto, S., Jr., Avila, P. C., & Schleimer, R. P. (2007). TLR3- and Th2
cytokine-dependent production of thymic stromal lymphopoietin in human airway
epithelial cells. J Immunol, 179(2), 1080-1087.
68
Kato, A., & Schleimer, R. P. (2007). Beyond inflammation: airway epithelial cells are at
the interface of innate and adaptive immunity. Curr Opin Immunol.
Koga, T., Oshita, Y., Kamimura, T., Koga, H., & Aizawa, H. (2006). Characterisation of
patients with frequent exacerbation of asthma. Respir Med, 100(2), 273-278.
Kool, M., & Lambrecht, B. N. (2007). Dendritic cells in asthma and COPD: opportunities
for drug development. Curr Opin Immunol, 19(6), 701-710.
Lambre, C. R., Aufderheide, M., Bolton, R. E., Bice, F., Haagsman, H. P., Hext, P. M., et
al. (1996). In Vitro Tests for Respiratory Toxicity: The Report and
Recommendations of ECVAM Workshop 18. Alternatives to Laboratory Animals,
24, 671-681.
Lambrecht, B. N., & Hammad, H. (2003). The other cells in asthma: dendritic cell and
epithelial cell crosstalk. Curr Opin Pulm Med, 9(1), 34-41.
Lambrecht, B. N., Prins, J. B., & Hoogsteden, H. C. (2001). Lung dendritic cells and host
immunity to infection. Eur Respir J, 18(4), 692-704.
Lee, H. C., & Ziegler, S. F. (2007). Inducible expression of the proallergic cytokine
thymic stromal lymphopoietin in airway epithelial cells is controlled by NFkappaB.
Proc Natl Acad Sci U S A, 104(3), 914-919.
Lehner, M., Stockl, J., Majdic, O., Knapp, W., Huttner, K., Felzmann, T., et al. (2003).
MHC class II antigen signaling induces homotypic and heterotypic cluster
formation of human mature monocyte derived dendritic cells in the absence of
cell death. Hum Immunol, 64(8), 762-770.
Lensmar, C., Elmberger, G., Skold, M., & Eklund, A. (1998). Smoking alters the
phenotype of macrophages in induced sputum. Respir Med, 92(3), 415-420.
69
Li, W., Xu, Y. J., & Shen, H. H. (2007). Effect of cigarette smoke extract on
lipopolysaccha-ride-activated mitogen-activated protein kinase signal
transduction pathway in cultured cells. Chin Med J (Engl), 120(12), 1075-1081.
Liu, Y. J., Soumelis, V., Watanabe, N., Ito, T., Wang, Y. H., Malefyt Rde, W., et al.
(2007). TSLP: an epithelial cell cytokine that regulates T cell differentiation by
conditioning dendritic cell maturation. Annu Rev Immunol, 25, 193-219.
Luppi, P., Lain, K. Y., Jeyabalan, A., & DeLoia, J. A. (2007). The effects of cigarette
smoking on circulating maternal leukocytes during pregnancy. Clin Immunol,
122(2), 214-219.
MacNee, W. (2000). Oxidants/antioxidants and COPD. Chest, 117(5 Suppl 1), 303S-
317S.
Mahid, S. S., Minor, K. S., Soto, R. E., Hornung, C. A., & Galandiuk, S. (2006). Smoking
and inflammatory bowel disease: a meta-analysis. Mayo Clin Proc, 81(11), 1462-
1471.
Majdic, O., Stockl, J., Pickl, W. F., Bohuslav, J., Strobl, H., Scheinecker, C., et al. (1994).
Signaling and induction of enhanced cytoadhesiveness via the hematopoietic
progenitor cell surface molecule CD34. Blood, 83(5), 1226-1234.
Marshall-Clarke, S., Downes, J. E., Haga, I. R., Bowie, A. G., Borrow, P., Pennock, J. L.,
et al. (2007). Polyinosinic acid is a ligand for toll-like receptor 3. J Biol Chem,
282(34), 24759-24766.
Marwick, J. A., Kirkham, P., Gilmour, P. S., Donaldson, K., Mac, N. W., & Rahman, I.
(2002). Cigarette smoke-induced oxidative stress and TGF-beta1 increase
p21waf1/cip1 expression in alveolar epithelial cells. Ann N Y Acad Sci, 973, 278-
283.
70
Matsukura, S., Kokubu, F., Kurokawa, M., Kawaguchi, M., Ieki, K., Kuga, H., et al.
(2006). Synthetic double-stranded RNA induces multiple genes related to
inflammation through Toll-like receptor 3 depending on NF-kappaB and/or IRF-3
in airway epithelial cells. Clin Exp Allergy, 36(8), 1049-1062.
Mian, M. F., Lauzon, N. M., Stampfli, M. R., Mossman, K. L., & Ashkar, A. A. (2008).
Impairment of human NK cell cytotoxic activity and cytokine release by cigarette
smoke. J Leukoc Biol, 83(3), 774-784.
Moodie, F. M., Marwick, J. A., Anderson, C. S., Szulakowski, P., Biswas, S. K., Bauter,
M. R., et al. (2004). Oxidative stress and cigarette smoke alter chromatin
remodeling but differentially regulate NF-kappaB activation and proinflammatory
cytokine release in alveolar epithelial cells. Faseb J.
Morelli, A. E., & Thomson, A. W. (2007). Tolerogenic dendritic cells and the quest for
transplant tolerance. Nat Rev Immunol, 7(8), 610-621.
Nouri-Shirazi, M., & Guinet, E. (2006). A possible mechanism linking cigarette smoke to
higher incidence of respiratory infection and asthma. Immunol Lett, 103(2), 167-
176.
Novak, N., & Bieber, T. (2008). 2. Dendritic cells as regulators of immunity and
tolerance. J Allergy Clin Immunol, 121(2 Suppl), S370-374; quiz S413.
Pachlopnik Schmid, J. M., Kuehni, C. E., Strippoli, M. P., Roiha, H. L., Pavlovic, R.,
Latzin, P., et al. (2007). Maternal tobacco smoking and decreased leukocytes,
including dendritic cells, in neonates. Pediatr Res, 61(4), 462-466.
Phillips, J., Kluss, B., Richter, A., & Massey, E. (2005). Exposure of bronchial epithelial
cells to whole cigarette smoke: assessment of cellular responses. Altern Lab
Anim, 33(3), 239-248.
71
Polito, A. J., & Proud, D. (1998). Epithelial cells as regulators of airway inflammation. J
Allergy Clin Immunol, 102(5), 714-718.
Quah, B. J., Warren, H. S., & Parish, C. R. (2007). Monitoring lymphocyte proliferation in
vitro and in vivo with the intracellular fluorescent dye carboxyfluorescein
diacetate succinimidyl ester. Nat Protoc, 2(9), 2049-2056.
Reis e Sousa, C. (2006). Dendritic cells in a mature age. Nat Rev Immunol, 6(6), 476-
483.
Repine, J. E., Bast, A., & Lankhorst, I. (1997). Oxidative stress in chronic obstructive
pulmonary disease. Oxidative Stress Study Group. Am J Respir Crit Care Med,
156(2 Pt 1), 341-357.
Ritter, M., Mennerich, D., Weith, A., & Seither, P. (2005). Characterization of Toll-like
receptors in primary lung epithelial cells: strong impact of the TLR3 ligand
poly(I:C) on the regulation of Toll-like receptors, adaptor proteins and
inflammatory response. J Inflamm (Lond), 2, 16.
Robbins, C. S., Dawe, D. E., Goncharova, S. I., Pouladi, M. A., Drannik, A. G., Swirski,
F. K., et al. (2004). Cigarette smoke decreases pulmonary dendritic cells and
impacts antiviral immune responsiveness. Am J Respir Cell Mol Biol, 30(2), 202-
211.
Robbins, C. S., Franco, F., Mouded, M., Cernadas, M., & Shapiro, S. D. (2008).
Cigarette smoke exposure impairs dendritic cell maturation and T cell
proliferation in thoracic lymph nodes of mice. J Immunol, 180(10), 6623-6628.
Rogers, A. V., Adelroth, E., Hattotuwa, K., Dewar, A., & Jeffery, P. K. (2007). Bronchial
mucosal dendritic cells in smokers and ex-smokers with COPD: an electron
microscopic study. Thorax.
72
Rogers, A. V., Adelroth, E., Hattotuwa, K., Dewar, A., & Jeffery, P. K. (2008). Bronchial
mucosal dendritic cells in smokers and ex-smokers with COPD: an electron
microscopic study. Thorax, 63(2), 108-114.
Romagnani, S. (2006). Regulation of the T cell response. Clin Exp Allergy, 36(11), 1357-
1366.
Rossi, M., & Young, J. W. (2005). Human dendritic cells: potent antigen-presenting cells
at the crossroads of innate and adaptive immunity. J Immunol, 175(3), 1373-
1381.
Rouas, R., Lewalle, P., El Ouriaghli, F., Nowak, B., Duvillier, H., & Martiat, P. (2004).
Poly(I:C) used for human dendritic cell maturation preserves their ability to
secondarily secrete bioactive IL-12. Int Immunol, 16(5), 767-773.
Sallusto, F., & Lanzavecchia, A. (1994). Efficient presentation of soluble antigen by
cultured human dendritic cells is maintained by granulocyte/macrophage colony-
stimulating factor plus interleukin 4 and downregulated by tumor necrosis factor
alpha. J Exp Med, 179(4), 1109-1118.
Schleimer, R. P., Kato, A., Kern, R., Kuperman, D., & Avila, P. C. (2007). Epithelium: At
the interface of innate and adaptive immune responses. J Allergy Clin Immunol.
Schuurhuis, D. H., Fu, N., Ossendorp, F., & Melief, C. J. (2006). Ins and outs of dendritic
cells. Int Arch Allergy Immunol, 140(1), 53-72.
Siafakas, N. M., & Tzortzaki, E. G. (2002). Few smokers develop COPD. Why? Respir
Med, 96(8), 615-624.
Skold, C. M., Lundahl, J., Hallden, G., Hallgren, M., & Eklund, A. (1996). Chronic smoke
exposure alters the phenotype pattern and the metabolic response in human
alveolar macrophages. Clin Exp Immunol, 106(1), 108-113.
73
Sopori, M. (2002). Effects of cigarette smoke on the immune system. Nat Rev Immunol,
2(5), 372-377.
Steinman, R. M., Hawiger, D., & Nussenzweig, M. C. (2003). Tolerogenic dendritic cells.
Annu Rev Immunol, 21, 685-711.
Stick, S. M., & Holt, P. G. (2003). The airway epithelium as immune modulator: the
LARC ascending. Am J Respir Cell Mol Biol, 28(6), 641-644.
Tanaka, H., Demeure, C. E., Rubio, M., Delespesse, G., & Sarfati, M. (2000). Human
monocyte-derived dendritic cells induce naive T cell differentiation into T helpher
cell type 2 (Th2) or Th1/Th2 effectors: Role of stimulator/responder ratio. Journal
of Experimental Medicine, 192(3), 405-411.
Teramoto, S. (2007). 1. COPD pathogenesis from the viewpoint of risk factors. Intern
Med, 46(2), 77-79.
Thomson, N. C., Shepherd, M., Spears, M., & Chaudhuri, R. (2006). Corticosteroid
insensitivity in smokers with asthma : clinical evidence, mechanisms, and
management. Treat Respir Med, 5(6), 467-481.
Thorley, A. J., Goldstraw, P., Young, A., & Tetley, T. D. (2005). Primary human alveolar
type II epithelial cell CCL20 (macrophage inflammatory protein-3alpha)-induced
dendritic cell migration. Am J Respir Cell Mol Biol, 32(4), 262-267.
Tsoumakidou, M., Elston, W., Zhu, J., Wang, Z., Gamble, E., Siafakas, N. M., et al.
(2007). Cigarette smoking alters bronchial mucosal immunity in asthma. Am J
Respir Crit Care Med, 175(9), 919-925.
Tsoumakidou, M., Tzanakis, N., Papadaki, H. A., Koutala, H., & Siafakas, N. M. (2006).
Isolation of myeloid and plasmacytoid dendritic cells from human bronchoalveolar
lavage fluid. Immunol Cell Biol, 84(3), 267-273.
74
Upham, J. W., & Stick, S. M. (2006). Interactions between airway epithelial cells and
dendritic cells: implications for the regulation of airway inflammation. Curr Drug
Targets, 7(5), 541-545.
van Haarst, J. M., Hoogsteden, H. C., de Wit, H. J., Verhoeven, G. T., Havenith, C. E., &
Drexhage, H. A. (1994). Dendritic cells and their precursors isolated from human
bronchoalveolar lavage: immunocytologic and functional properties. Am J Respir
Cell Mol Biol, 11(3), 344-350.
Vassallo, R., & Chen, L. (2004). Selective suppression of dendritic cell functions by
cigarette smoke extract. Chest, 125(5 Suppl), 107S.
Vassallo, R., Tamada, K., Lau, J. S., Kroening, P. R., & Chen, L. (2005). Cigarette
smoke extract suppresses human dendritic cell function leading to preferential
induction of Th-2 priming. J Immunol, 175(4), 2684-2691.
Verdijk, R. M., Mutis, T., Esendam, B., Kamp, J., Melief, C. J., Brand, A., et al. (1999).
Polyriboinosinic polyribocytidylic acid (poly(I:C)) induces stable maturation of
functionally active human dendritic cells. J Immunol, 163(1), 57-61.
Visser, H., Vos, K., Zanelli, E., Verduyn, W., Schreuder, G. M., Speyer, I., et al. (2002).
Sarcoid arthritis: clinical characteristics, diagnostic aspects, and risk factors. Ann
Rheum Dis, 61(6), 499-504.
Wark, P. A., & Gibson, P. G. (2006). Asthma exacerbations . 3: Pathogenesis. Thorax,
61(10), 909-915.

75
Appendices
76
Appendix A: Definitions
Adaptive immunity: the ability of an antigen to induce antigen-specific responses in
lymphocytes. Adaptive immunity is characterized by an increase in response
with exposure, memory and clonal selection of lymphocytes.
Allergen: an antigen that has the ability to induce a hypersensitivity or allergic reaction.
Allogeneic: different individuals of the same species.
Antigen: any molecule that can bind to an antibody. Some have the ability to stimulate
antibody production.
Chemokine: small proteins that induce the migration and/or activation of cells.
Cigarette smoke condensate (CSC): commercially available particulates obtained from
burned cigarettes that are dissolved in dimethyl sulfoxide and contains many
chemicals including nicotine and tar. In this study, CSC was used to mimic the
particulate phase of smoke.
CD4: cluster of differentiation 4 is present on thymocytes, monocytes, macrophages
and is a co-receptor of MHC Class II. In this study, T cells used in mixed
lymphocyte reactions were CD4 positive.
CD11c: cluster of differentiation 11c is present on myeloid cells and binds fibrinogen. In
this study, CD11c was used to identify dendritic cells in flow cytometry
experiments.
CD80: cluster of differentiation 80 is present on dendritic cells and is a ligand for CD28
on T cells. It is important in the activation of naïve T cells through co-stimulation
(signal 2).
CD83: cluster of differentiation 83 is present on dendritic, B and Langerhans’ cells. It is
a marker for activated dendritic cells and may assist in antigen presentation or
cellular interactions that follow lymphocyte activation
77
CD86: cluster of differentiation 86 is present on dendritic, monocytes and activated B
cells and it is a ligand for CD28 on T cells. It is important in the activation of
naïve T through co-stimulation (signal 2).
CD54: cluster of differentiation 54 is present on hematopoietic and non-hematopoietic
cells. Also known as intercellular adhesion molecule (ICAM-1) and is involved in
adhesion of neutrophils and is a receptor for rhinovirus.
Cluster of differentiation (CD): a monocolonal antibody that identifies surface molecules,
used to identify various immune cells.
Cytokine: proteins made by cells that affect the function of other cells or the cell itself.
Dendritic cell (DC): professional antigen presenting cell and the most potent activator of
T and B cells. They are involved in linking the innate and adaptive immune
systems and located in tissues exposed to the external environment such as the
skin, lungs and intestines. In this study, monocyte-derived dendritic cells isolated
from human peripheral blood were used in all experiments.
Dimethyl sulfoxide (DMSO): a chemical compound that is a polar aprotic solvent. It is
an excellent solvent and cryoprotectant. In this study, CSC is dissolved in DMSO
therefore DMSO is used as a vehicle control in all experiments.
Flow cytometry: a research method that uses the principles of light scattering, light
excitation, and emission of fluorochrome molecules to generate specific multi-
parameter data from particles and cells. It is a technique for counting and
examining cells or particles based on size, granularity and fluorescence.
Homotypic cluster score: clustering of dendritic cells with each other that is an indicator
of upregulation of adhesion molecules and chemokines/chemokine receptors. In
this study, the scoring of homotypic clustering is a semi-quantitative score of 0-8.
78
Human leukocyte antigen DR (HLA-DR): human leukocyte antigen encoded major
histocompatibility complex, MHC class II, cell surface receptor ligand for T cell
receptor. It is present on antigen presenting cells with the primary function to
present peptide antigens to the immune system for the purpose of eliciting an
immune response.
Innate immunity: earliest host response to invading pathogens such as bacteria, virus
and allergens that includes various recognition systems such as toll-like
receptors. The innate immune response does not increase with repeated
exposure.
Interferon gamma (IFNγ): cytokine that can induce cells to resist viral replication. It is
produced by CD4+ Th1 cells and is a type II interferon and has antiviral,
immunoregulatory, and anti-tumour properties.
Interferon-inducing protein 10 (IP10): chemokine that selectively attracts Th1
lymphocytes and monocytes, and inhibits cytokine-stimulated hematopoietic
progenitor cell proliferation.
Interleukin 2 (IL2): a T cell derived cytokine that stimulates growth and differentiation of
T cells, B cells, NK cells, monocytes, macrophages. A central cytokine in the
development of an adaptive immune response.
Interleukin 4 (IL4): a cytokine that is secreted by Th2 cells. It enhances both secretion
and cell surface expression of IgE and IgG1. An important cytokine in allergic
disease and has overlapping functions with IL13.
Interleukin 5 (IL5): secreted by Th2 and mast cells that is a key mediator in eosinophil
activation. An important cytokine in allergic disease.
Interleukin 6 (IL6): both a pro-inflammatory and anti-inflammatory cytokineimportant
mediators of fever and of the acute phase response and secreted in response to
79
activation of the innate immune system. High IL6 It is associated with both Th1
and Th2 responses and low IL6 is associated with Treg responses.
Interleukin 8 (IL8): inflammatory chemokine produced by many cell types. Mainly
functions as a neutrophil chemoattractant.
Interleukin 10 (IL10): secreted by Th0 cells blocks cytokine synthesis by Th1 cells
Interleukin 12p70 (IL12p70): Th1 polarizing type cytokine secreted mainly by dendritic
cells. Induces IFNγ production and proliferation/differentiation of Th1 cells.
Interleukin 13 (IL13): secreted by Th2 cells, involved in the upregulation of IgE secretion
by B cells. An important cytokine in allergic disease.
Ligand: general term for a molecule recognized by another structure such as a receptor.
MHC Class II: major histocompatibility complex class II present on antigen presenting
cells with the primary function to present peptide antigens, both self and non-self,
to lymphocytes for the purpose of eliciting an immune response. Specifically,
MHC class II presents antigen fragments to T-helper cells by binding to the CD4
receptor on the T-helper cells.
Mixed lymphocyte reaction (MLR): When lymphocytes for two different individuals are
cultured together. In this study, CSC/poly I:C exposed dendritic cells were co-
cultured with allogeneic CD4+ T cells for 4-5 days.
Monocyte-derived dendritic cells (MDDC): dendritic cells obtained by culturing CD14+
monocytes with granulocyte-macrophage colony-stimulating factor (GM-CSF)
and interleukin 4 (IL4). Used in this study as the dendritic cell model.
Normal human bronchial epithelial cells (NHBE): commercially available primary cell
culture of bronchial epithelial cells from human donors. Used in this study as the
bronchial epithelial cell model.
80
Phagocytosis: the engulfment of particles, bacteria, cell debris, etc. by cells. A
characteristic function of cells such as macrophages and dendritic cells. In this
study, phagocytosis is assessed by FITC-dextran uptake by dendritic cells and
analyzed by flow cytometry. Data is presented as mean fluorescence intensity
(MFI). A low MFI is associated with a mature dendritic cell and a high MFI is
associated with an immature dendritic cell.
Polyinosinic-polycytidylic acid (Poly I:C): a commercially available synthetic double
stranded RNA. A toll-like receptor 3 ligand that mimics viral infection and
induces a Th1 response. In this study, poly I:C is used as a positive control for
dendritic cell maturation
Polarizing cytokine: a cytokine that induces a specific phenotype in the target cell.
T cells (TC): thymic lymphocytes that developed in the thymus.
T cell proliferation: In this study, TC proliferation is assessed by CFSE staining and
analyzed by flow cytometry. Data are presented as percent proliferated.
Naïve T helper lymphocyte (Th0): T lymphocytes that have never engaged a specific
antigen. They are different from effector and memory T cells.
T helper type 1 lymphocyte (Th1): T lymphocyte characterized by the cytokines they
produce (IFNγ). An increase in Th1 cytokines are associated with autoimmune
diseases.
T helper type 2 lymphocyte (Th2): T lymphocyte characterized by the cytokines they
produce (IL4, IL5, IL13). An increase in Th2 cytokines are associated with
allergic diseases.
T helper type 17 lymphocyte (Th17): T lymphocyte characterized by the cytokines they
produce (IL17).
81
Toll-like receptor 3 (TLR3): one of the innate immune systems recognitions systems. It
is one of the toll-like receptors that recognizes double stranded RNA of viruses.
T regulatory lymphocyte (Treg): T lymphocyte characterized by the cytokines they
produce (IL10, TGFβ). They have the ability to inhibit T cell responses and
induce tolerance.
Tumor necrosis factor alpha (TNFα): a pleiotropic inflammatory cytokine involved in
apoptotic cell death/proliferation, differentiation, inflammation, tumor growth, and
viral replication. It is important in both Th1 and Th2 polarization, acute phase
reactions and fever.
Viability: to be alive. In this study, viability was assessed by 7-AAD staining and
analyzed by flow cytometry. Data are presented at percent live.

About the Author
Alison Jones Montpetit was born and raised in Decatur, Alabama. She attended
the University of North Carolina at Wilmington where she obtained a Bachelor’s degree
in nursing in 2001. She practiced nursing in the Medical Intensive Care Unit at New
Hanover Regional Medical Center. In 2002, she moved to Tampa, Florida to pursue the
BS-PhD program at the University of South Florida. During her tenure, she completed a
Master’s in nursing (2004) and attended the Summer Genetics Institute at the National
Institute of Nursing Research (2004). She is married to Marty Louis Montpetit, PhD and
expects her first child in August of 2008.