modulation of enzymatic activity case study for lytic...
TRANSCRIPT

Department of Biology and Biological Engineering CHALMERS UNIVERSITY OF TECHNOLOGY Gothenburg, Sweden 2017
Modulation of enzymatic activity – case study for lytic polysaccharide monooxygenases Master’s thesis in
VASILIS DIAMADOPOULOS

ii

iii

iv
Preface
This project was initiated in 21st of February 2017 and finished in 31st of July 2017
and it took place through Erasmus Programme of the summer semester of 2017 between
the National Technical University of Athnes (NTUA) as home university and Chalmers
University of Technology. The project was carried out under the supervision of Doctor
Ausra Peciulyte, Chalmers University of Technology. Doctor Katja S. Johansen, a
visiting researcher at Chalmers University of Technology was a co-supervisor and
Professor Lisbeth Olsson, Chalmers University of Technology was the examiner.
Examiner at the NTUA was Professor Evangelos Topakas. The project was funded by
the Swedish Energy Agency (Energimyndigheten) under the grant № 41259-1.
Enzymes were provided by Novozymes A/S. Chalmers Student number is
19940226C151 and NTUA student number is 05112702.

v
Abstract
Lignocellulosic biomass is one of the most promising alternative resources for
production of biofuels and added valued products. Conversion of lignocellulosic
biomass into fermentable sugars is a very important step in lignocellulosic ethanol
production. Saccharification of biomass using enzymes, called cellulases, is an
attractive process but still, there is a great deal of scope for research to improve the
enzymatic conversion efficiency. The efficiency of the saccharification is based on
advances in the enzymatic cocktail ingredients, of which one of the most significant is
the recent inclusion of Lytic polysaccharide monooxygenases (LPMOs). LPMOs are of
increased biotechnological and scientific interest due to their implication in
lignocellulosic biomass decomposition as they are the first enzymes that act to the
crystalline cellulose making the substrate easier accessible to the other enzymes for the
complete decomposition. Through the years, after the discovery of LPMOs,
information about them that they have been published are about their classification,
their structure, the identification of cooper as the metal in their active site, their
mechanism, and what activates them. In this project, the effect of a plant extract that
comes for a persimmon fruit to fungal LPMOs and to beta-glycosidase was
investigated. The overall aim was the search of a modulator, which can be either an
inhibitor or an activator, with the plant extract as a source for modulators. For this
purpose, saccharification experiments were done using cellulose as substrate and
LPMO and beta-glucosidase as enzymes. Also, fractionation of the plant extract took
place using liquid-liquid extraction. With the saccharification experiments the effect of
the plant extract and the fractions of it were tested on these two enzymes. Last the effect
on tannins on these two enzymes was tested using dilutions of tannic acid in the
saccharification experiments. It is concluded that the plant extract and the tannic acid
has an inhibitory effect to the LPMOs and beta-glucosidase, with higher effect to
LPMOs.
Key words: Cellulose, cellulases, LPMOs, PASC, plant extract, liquid-liquid
extraction, tannic acid

vi
Table of Contents
1. Introduction........................................................................................................................ 1
1.1. Aim of the project..................................................................................................................................... 3
2. Theoretical part .................................................................................................................. 4
2.1. Lignocellulosic biomass ............................................................................................................................ 4
2.1.1. Cellulose.......................................................................................................................... 5
2.2. Bioethanol from biomass ......................................................................................................................... 8
2.3. Cellulolytic enzymes ............................................................................................................................... 10
2.3.1. Lytic Polysaccharide Monooxygenases enzymes (LPMO) ............................................ 12
2.3.2. Activation of LPMO ....................................................................................................... 14
2.4. Saccharification of Cellulose................................................................................................................... 16
2.5. Factors that affect Cellulase’s activity .................................................................................................... 18
2.6. Liquid-liquid Extraction .......................................................................................................................... 19
2.7. Folin-Ciocalteu method .......................................................................................................................... 21
2.8. Tannins ................................................................................................................................................... 21
3. Experimental part ............................................................................................................. 23
3.1. Chemicals and Enzymes ......................................................................................................................... 24
3.2. Production of phosphoric acid swollen cellulose (PASC) ....................................................................... 25
3.3. Enzymatic saccharification of PASC ........................................................................................................ 26
3.3.1. Saccharification experiments adding tannic acid ......................................................... 28
3.4. Liquid-liquid extraction experiment ....................................................................................................... 30
3.5. Isolation of tannins ................................................................................................................................. 32
3.6. Folin-Ciocalteu assay .............................................................................................................................. 33
3.7. High Performance Liquid Chromatography (HPLC) ................................................................................ 34
4. Results and discussion ...................................................................................................... 35
4.1. Effect of PE on saccharification by LPMO and BG .................................................................................. 35
4.2. Effect of filtrated and centrifugated PE on saccharification by TaAA9A and BG ................................... 42
4.3. Effect of thermal treatment of the PE on saccharification by TaAA9A and BG ..................................... 43
4.4. Effect of the fractions after Liquid-liquid extraction on saccharification by TaAA9A and BG ............... 47
4.4.1. Ethyl acetate fractions .................................................................................................. 49
4.4.2. Diethylamine fractions ................................................................................................. 51
4.4.3. 1-Butanol fractions ....................................................................................................... 54
4.4.4. Dichloromethane Fractions .......................................................................................... 56
4.5. Effect of the isolated from tannins PE on saccharification by TAAA9A and BG..................................... 57
4.6. Quantification of phenolic content on the PE and its fractions ............................................................. 59
4.7. Effect on tannic acid on TAAA9A and BG ............................................................................................... 61
5. Conclusions....................................................................................................................... 64
5.1. Future outlook ........................................................................................................................................ 65
6. Appendix .......................................................................................................................... 67

vii
7. Acknowledgements .......................................................................................................... 71
8. References ........................................................................................................................ 72
List of Abbreviations
AA Auxiliary activity
BG β-glucosidase
CBH cellobiohydrolase
CBM Carbohydrate binding module
CD Catalytic Domain
CDH cellobiose dehydrogenases
FC Folin-Ciocalteu
HPLC High-performance liquid chromatography
LLE Liquid-liquid extraction
LPMO Lytic Polysaccharide Monooxygenases
PASC Phosphoric Acid Swollen Cellulose
PE Plant Extract
PVPP Polyvinyl PolyPyrrolidone
PVP Polyvinylpyrrolidone
TaAA9A Fungal LPMOs that used in the project
1
1. Introduction
Nowadays the population produces about 1.3 billion tons of solid waste per year and
this could be increased up to 2.2 billion per year by 2025 (1). It is therefore
understandable that the world must change the production and consumption model that
the global economy is being using. After the Industrial Revolution, the global economy
developed the Linear Economy – the ‘take-make-use-dispose’ model of consumption
and now we can see that this model is not sustainable. Over the last decade the Circular
Economy, an alternative model for production and consumption, has drawn attention
worldwide which is a model based on continuous growth and proper resource
management (2). The Circular Economy is the model that instead of the ‘take-make-
use-dispose’ model aims to keep products, components, and materials at their highest
utility and value at all times, distinguishing between technical and biological cycles (3).
Industrial biotechnology is one of the most promising new approaches to pollution
prevention, resource conservation, and cost reduction. So, Biotechnology is a field that
can offer to the Circular Economy major help. Specifically, Industrial biotechnology
creates smart, sustainable products and processes based on renewable raw materials,
enabling carbon to be re-cycled at the end of the product’s life. One example of the
industrial biotechnology aims, is to provide a sustainable and economical feasible
process for conversion of biomass to biofuels for energy or bioproducts such as
biochemicals with high added value using enzymes. Those processes which improved
the conversion of biomass into biofuel are being developed and the market for enzymes
for biofuels production is expected to become larger. The global market for enzymes
was estimated at about $4.5 billion in 2012 and it is expected to grow at almost $8
billion in 2020. Europe is the world leader in key industrial biotechnologies such as
enzyme technologies, with Novozymes A/S from Denmark holding a market share of
47% worldwide (4). There are more than 3000 known enzymes, of which about 150 are
used commercially (5). As a term, enzymes are biologically produced proteins that
catalyze chemical processes and speed up chemical reactions (up to millions of times
faster), with many applications in food industry, chemicals, biofuels etc (6).
2
Lignocellulosic biomass, such as plants, is one of the most promising renewable
resources that has the potential for meeting a significant portion of the demand for
energy (7). Oil has been overused all these years as the main resource for energy and
transportation so the need for an alternative and more environmentally friendly resource
for fuel is becoming necessary. There is when industrial biotechnology comes and
creates a fully developed and sustainable process for bioconversion of plant biomass to
biofuels and added value products using enzymes and microorganisms or what is
defined as biorefinery (8; 9). Biorefinery as an idea is analogous to an oil refinery except
that the raw material is biomass. In general terms, the production of biofuels such as
bioethanol from lignocellulosic biomass involves a degradation of the polymeric
compounds, primarily cellulose and hemicellulose, to sugars, which are then fermented
by microorganisms to ethanol. This process can be performed in a number of different
ways (10).
One important step in this whole bioconversion, is called enzymatic hydrolysis and it
is the conversion of the lignocellulosic biomass, after being firstly pretreated, to sugars.
Utility cost of this process is low compared to acid or alkaline hydrolysis because
enzymes work in mild conditions (pH 4,8-5 and temperature 45-50oC) and it is more
environmental friendly as a process (11). However, the cost of the enzymes is high and
their reduction in cost is very important for their commercial use in biorefineries (12).
For the conversion different enzymes, are acting with synergistically in order to
complete the decomposition of the cellulose and hemicellulose, the two components of
lignocellulosic biomass that can be hydrolyze to sugars. Two categories of enzymes are
called cellulases and hemicellulases and each one category has different enzymes that
they act differently to complete this process (13). As their name implies cellulases are
the category of enzymes that can catalyze the hydrolysis process of cellulose while
hemicellulases the category of enzymes that they can catalyze the hydrolysis process of
hemicellulose. This project is going to be focused on cellulases, which their synergistic
action is known almost 60 years ago as a system of two groups of enzymes, one enzyme
known as ‘’C1’’ and one mixture of enzymes known as ‘’Cx’’ (14). C1 was the enzyme
that acting first on the cellulose and the Cx were the enzymes, which hydrolyze the
cellulose to sugars. Nowadays, the actual picture for the cellulases is different and the
knowledge for them increases through the years.

3
The last decade, a new class of enzymes has been discovered that are called Lytic
Polysaccharide MonoOxygenases (LPMOs) and they are the unknown ‘’C1’’ enzyme
from the early 50s. LPMOs have significant economic benefits to the hydrolysis
process, due to the fact that they can boost the activity of the other enzymes, because
they provide access to parts of cellulose that are not easy to be hydrolyze from them.
After this discovery, a lot of research has been conducted about finding LPMOs
structure and classification. It has been found that LPMOs are oxidative enzymes,
which means that use a different mechanism than the rest of cellulases and in order to
act they require molecular oxygen and electron donation (15; 16; 17). However, there
are still things that they are unclear about LPMO so research and new information about
them are always useful in the academic community.
1.1. Aim of the project
This project is focused on the enzymatic hydrolysis process of cellulose and more
specifically on fungal LPMO enzymes. The overall aim of the project is to look for a
modulator for those LPMO enzymes which can be either an activator or an inhibitor for
their activity. For this purpose, a plant extract that comes from astringent persimmon
fruit has been examined on the saccharification of cellulose and used as a source to
search for a modulator. This plant extract is a persimmon juice which is called
Kakishibu and throughout the thesis from now on it will be called PE.
The project aims to answer the following research questions:
a) How the saccharification of cellulose by LPMO is affected by addition of PE?
b) Can the PE be fractionated using Liquid-liquid extraction and create modulators,
either inhibitors or activators for LPMO?
c) In case presence of tannins have an inhibitory effect on LPMOs and BG, is there
any different effect on them?

4
2. Theoretical part
2.1. Lignocellulosic biomass
Generally, biomass is any material derived from living organisms, such as plants.
Biomass has potential to be a major resource in the future, because is the only renewable
organic resource and is also one of the most abundant resources on Earth (8).
Lignocellulosic biomass, which is the term that describes the biomass that comes from
plants, can be used as a resource not only for biofuels but also for chemical compounds
with high added value.
Lignocellulosic biomass contains three main components: cellulose, hemicellulose and
lignin. These components are present in biomass at varying amounts, depending on the
plant species. Cellulose, the main structural component of plant cell walls, is a long
chain of glucose molecules, linked to one another primarily by glycosidic bonds.
Cellulose was the substrate for the enzymes in this project and it will be described more
detailed in the section 2.2.1. Hemicellulose, the second most abundant constituent of
lignocellulosic biomass, is not a chemically well-defined compound but rather a family
of polysaccharides, composed of different 5- and 6-carbon monosaccharide units, that
link cellulose fibres and cross-links with lignin, creating a complex network of bonds
that provide structural strength. Hemicellulose also contains acids, such as acetic acid,
but generally its composition is depending on the source of the plant biomass. Finally,
lignin, a three-dimensional complex phenolic polymer, can be considered as the cellular
glue providing the plant tissue and the cellulose fibres with compressive strength and
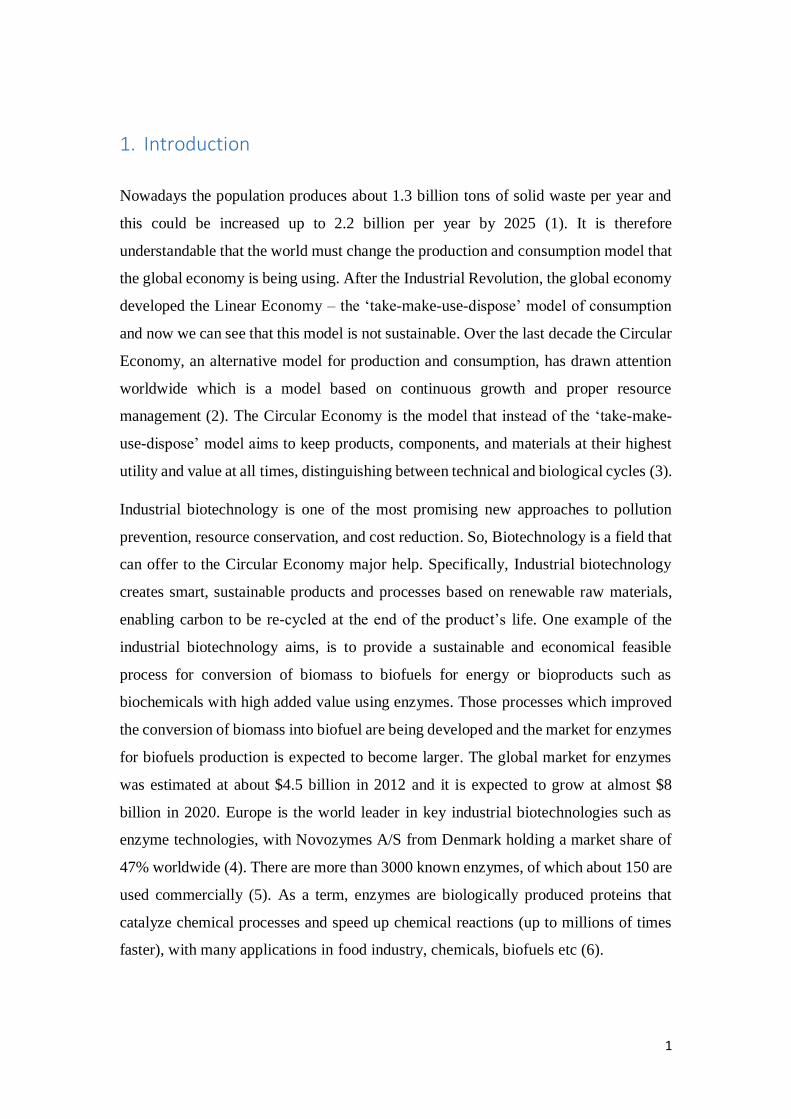
the cell wall with stiffness (18; 19; 20). Those three components together create
structures called microfibrils, which their aggregates are forming a matrix known as
macrofibrils (Figure 1). Macrofibrils exists in the cell walls, they can be visible using
emission electron microscopy or scanning electron microscopy and their size is varying
amongst cell wall types (21).
5
Figure 1. The structure of lignocellulose (22)
2.1.1. Cellulose
Cellulose is one of the most abundant organic biopolymers on Earth, representing
around 1,5 x 10¹² tons of the total annual biomass production (23) and it is the main
component in lignocellulose. In plant cells cellulose has the form of fibres and between
the cellulose fibres and the lignin there is the adhesive layer comprising hemicelluloses.
Cellulose microfibrils are formed from glucose molecules linked together with
glycosidic bonds. Chemically, cellulose it is a linear biopolymer composed of β-1,4-
linked D-glucose chains (Figure 2).

6
Figure 2. Glucose molecules forming the cellulose linear chain i), repeating unit of cellulose,
called cellobiose formed of two β (1-4) linked D-gucose monomers ii), (24) D-Glucose
monomer with its with 6 carbon atoms iii)
Cellulose recalcitrant structure is inherently resistant to hydrolysis making cellulose
very stable biopolymer. It has been calculated that the uncatalyzed half-life of cellulose
is approximately 5 million years (25). Although cellulose has a simple chemical
structure, the spatial organization of these polymer chains makes the structure of
cellulose very complex. Generally, the structure of cellulose can be determined on the
macro-, micro- and nano-scale. Regions in the micro scale, within the microfibrils with
high order are termed crystalline and regions with less order are termed amorphous.
One of the suggested molecular architecture of crystalline and amorphous cellulose is
that cellulose is semi-crystalline, with regions of high crystallinity (ordered),
approximately 200 glucose monomers length separated by amorphous regions
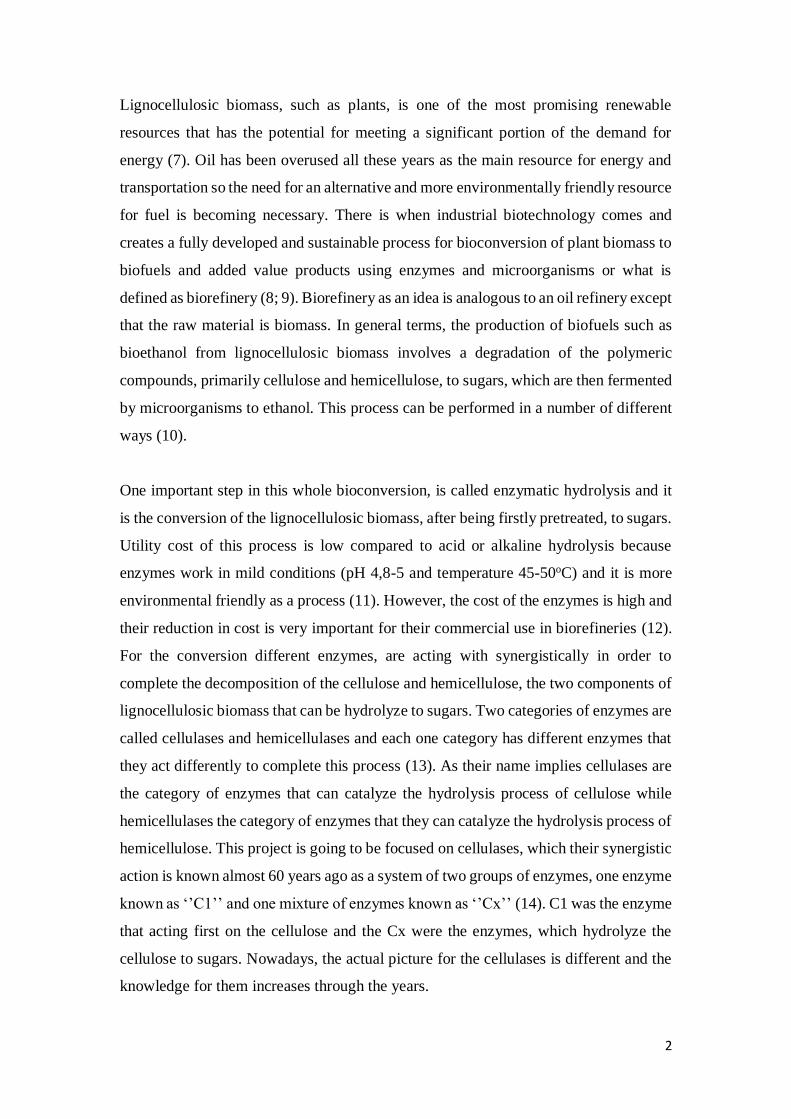
(disordered) (26; 27) (Figure 3).
7
Figure 3. Crystalline and amorphous regions are being repeated in horizontal dimension
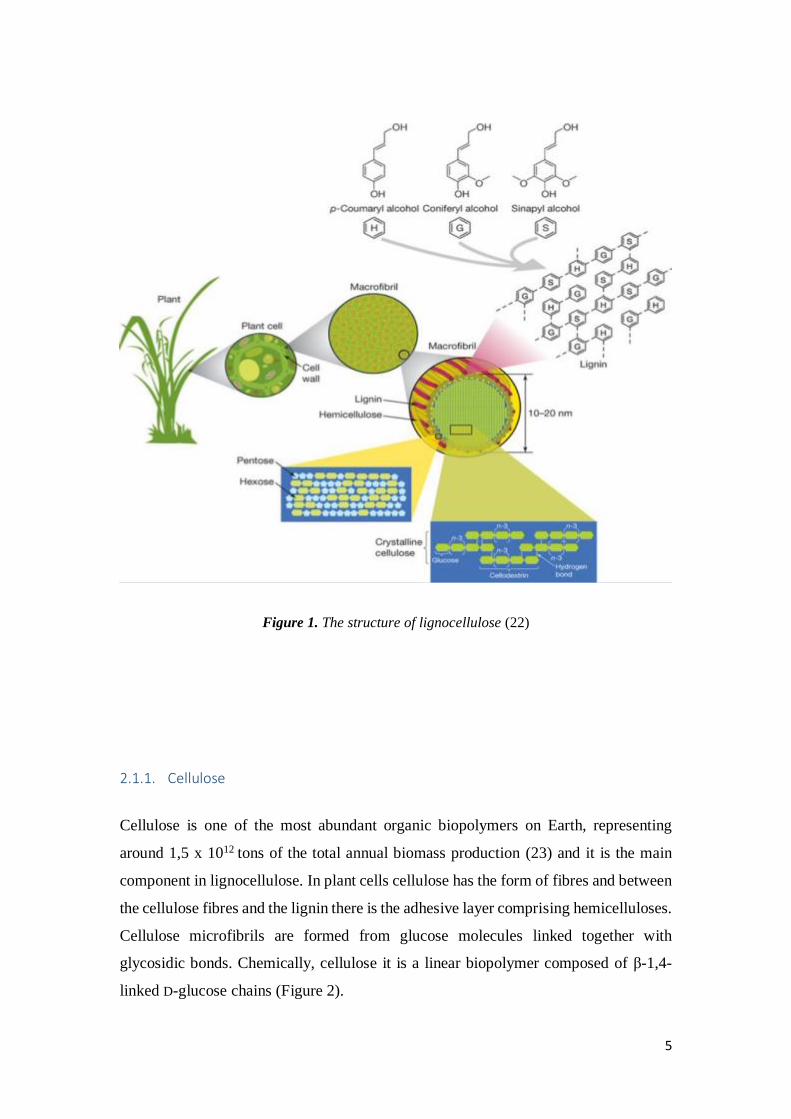
Cellulose degree of polymerization and degree of crystallinity are varying with the
origin and the treatment of the raw material (28; 29). Native cellulose has
approximately a degree of polymerization from 300-1700 such as wood pulp and from
800-10000 for cotton (23). Degree of crystallinity can be measured with different
techniques usually is measured with X-ray diffraction method (XRD) and Nuclear
Magnetic Resonance (29; 30). For cellulose, there are many model substrates such as
Avicel, cotton, Wahtman No.1 filter paper, Phosphoric acid swollen cellulose (PASC),
Valonia cellulose, Sigmacel, Solka Floc, (31; 32). In this project, the substrate that has
been used is PASC which has been produced from Avicel. Avicel is a white, dry powder
with particle size from 20-180 μm and it is derived by acid hydrolysis of wood or cotton
and it is considered to be a crystalline substrate. Unlike Avicel, PASC is considered to
be a representative of amorphous cellulose (33) and it is a viscous, white-cloudy liquid.
Below the table summarizes some physical properties of those two model substrates.
Table 1: Summary of some physical properties of cellulosic model substrates Avicel and
PASC (34)
Substrate Degree of
polymerization
MW (g/mol) Crystallinity
index
Specific
surface area
(m2/g)
PASC 96 15,570 0.00-0.04 240
Avicel 150 24,320 0.5-0.6 20

8
PASC has become one of the most common cellulose substrates for cellulase activity
assays due to the fact that is an easy substrate to be hydrolyzed by the enzymes (35).
That happens because of the large disordered surface area that can provide for them.
PASC can be produced from Avicel after phosphoric acid treatment as it is described
in the section 3.2. As the Table 1 shows, PASC has lower degree of polymerization
from Avicel showing that the treatment with phosphoric acid decreased the degree of
polymerization of the substrate by more than one third. It is also known that properties
of PASC are very dependent on the method was used to produce it such as acid
concentration, incubation and mixing time, source of cellulose (35; 32). Furthermore,
these results showed that phosphoric acid treatment resulted in generation of more
reducing ends in PASC so more attackable sites for the enzymes that they act there (34).
2.2. Bioethanol from biomass
Biofuel production from biomass involves collection of biomass, physicochemical
pretreatment, deconstruction of cell wall polymers into component sugars via
enzymatic process and conversion of the sugars to biofuels (via fermentation) for
example bioethanol (8; 18). Generally, as a definition, biofuels are the fuels for which
the resource is biomass and not petrochemical resources and their chemical structure is
not different with the fuels that can come from oil. Based on the source of biomass,
biofuels are classified broadly into two major categories, first and second-generation
biofuels. First can be derived from different sources such as sugarcane or starch. Sugars
present in this biomass are fermented to produce bioethanol, an alcohol fuel which can
be used directly in a fuel cell to produce electricity or serve as an additive to gasoline.
Second-generation biofuels, on the other hand, utilize non-food-based biomass sources
such as agriculture waste. This biomass mostly consists of lignocellulosic material,
which is not edible and is a low-value waste for many industries (36; 37). The derivation
of second-generation biofuels from non-edible woody plant biomass through
biorefinery processes is therefore viewed as crucial (38; 39). The process from the
lignocellulosic biomass to bioethanol is quite complex with many different individual
steps and also there are different variations of the overall process (Figure 4) (40). After
the pretreatment, the deconstruction of biomass can be thermochemical (41) and

9
biochemical (42). Biochemical approach relies on enzymes. There has therefore been
much interest in understanding enzymatic degradation of cellulose (43) and similar
polysaccharides, such as chitin (44). Those enzymes known as cellulases or cellulolytic
enzymes have received considerable attention in the biotechnology area for their
activity (43).
Figure 4. Process flow for the production of bioethanol from lignocellulosic biomass using
separate hydrolysis and fermentation (SHF) (40).

10
2.3. Cellulolytic enzymes
Enzymes are produced by the microorganisms and they can produce a multiplicity of
enzymes. For examples microorganisms that are efficient degraders polysaccharides in
plant cell walls, such as Trichoderma reesei (teleomorph Hypocrea jecorina) (a soft-
root fungus) can produce a variety of enzymes which take different roles during
degradation of the cellulose (45). These enzymes are called cellulases or cellulolytic
enzymes. To degrade cellulose and hemicellulose cellulases and hemicellulases are
required. In this project, the discussion will be focused on the cellulases since the
substrate that was consists only of cellulose. However, it should be mention that enzyme
systems that can degrade cellulose can also degrade (not fully) hemicellulose and
hemicellulases show also activity on cellulose (46).
Enzyme system is very complex consisting from a few to even 100 enzymes (47) and
the system consists of several enzyme classes based on their role during the hydrolysis
process (31). In addition, most of the enzymes are complex molecules as individual
modular proteins making the characterization of them not an easy work. Specifically,
cellulases are composed of discrete units, referred to as either domains or modules.
Commonly, cellulases consist of one catalytic domain (CD) and one carbohydrate
binding module (CBM) usually linked together with a linker peptide (30-44 amino
acids) (46) (Fig 5). The main role of CBM is helping the binding of the catalytic domain
on the polymer of cellulose, although CBMs might also participate in the initial
disruption of cellulose fibers (48).

11
Figure 5. Hydrolysis of cellulose by modular exo-cellulase (cellobiohydrolase, CBH). The
figure shows the enzyme carbohydrate binding module (left); its linker peptide (middle) with
attached polysaccharides (yellow) and the catalytic domain (right) linked to polysaccharides.
Green is the cellulose chain and in dark blue is the disaccharide cellobiose which is a
product released during enzymatic hydrolysis of cellulose (49)
The enzymatic cellulase system exhibit higher collective activity than the sum of the
activities of individual cellulase enzymes, a phenomenon described as synergism. Four
forms of synergism for the degradation of cellulose to sugars have been reported (46):
(i) endo-exo synergy between endoglucanases and exoglucanases
(ii) exo-exo synergybetween exoglucanases processing from the reducing andnon-
reducing ends of cellulose chains
(iii) synergy between exoglucanases and beta-glucosidases (BGs) that remove
cellobiose (andcellodextrins) as end products of the first two enzymes
(iv) Intramolecular synergy between catalytic domains and CBMs
As it is being mentioned before, the enzymatic system consists of different enzymes
more specifically β-1,4-endoglucanases, exoglucanases (including D-cellodextranases
and CBH) and BGs. Their role in the hydrolysis process will be explained in section
2.4. For the proper archiving of glycoside hydrolases there is the carbohydrate-active
enzyme database (CAZy, www.cazy.org). CAZy is a classification system which is
based on amino acid sequence similarities, protein folds and enzymatic mechanisms.

12
This classification has been integrated and updated in the CAZy database since 1998.
CAZy currently incorporates more than 300 sequence families subdivided into the
following classes: glycoside hydrolases, glycosyl transferases, polysaccharide lyases,
carbohydrate esterases, and auxiliary activities (AA) (50).
Generally, cellulase achieve the decomposition of cellulose by using a hydrolytic
mechanism that involves conserved carboxylic acid residues within either channel- or
cleft-type substrate loading sites (51). However, there are other enzymes that can cleave
cellulose chains by using an oxidative mechanism at their planar active site and they
are called Lytic Polysaccharide Monooxygenases enzymes (LPMO).
2.3.1. Lytic Polysaccharide Monooxygenases enzymes (LPMO)
As it been mentioned, different types of enzymes are required for the decomposition of
cellulose to glucose and each one of them is doing different work in the hydrolysis
process but they all act synergistically in order to achieve this decomposition. The
enzymes thought to act first on the cellulose, making the substrate accessible for
hydrolysis by other cellulases, remained unknown for 50 years (52). Now it is
acknowledged that these enzymes are the metalloenzymes with copper as metal at their
active site and they called LPMO. As it was mentioned in the introduction almost 60
years ago, two categories of enzymes were described by the pioneer work of Reese et
al (1950), one unknown enzyme called ‘’C1’’ and one group of enzymes called ‘’Cx’’
and that unknown enzyme (‘’C1’’-enzyme) it was shown that has a major role in the
decomposition of cellulose (14). Later Eriksson et al (1974) published that there are not
only hydrolytic enzymes that involved in the decomposition of cellulose but also
oxidative enzymes (53). In the late 2000s, it was reported that fungal LPMOs, which
then were known as glycosyl hydrolase family 61 (GH61), have the ability to boost
biomass degradation (54). In 2010, it was discovered that LPMOs have an oxidative
mode of action (55). A year later Quinlan et al (2011) (56) were the first ones to
determine that the metal in their active site is copper and specifically the active site can
be best described as a type II copper site. Now LPMOs are classified into four Auxiliary
Activity (AA) enzyme families (AA9, AA10, AA11 and AA13) of the CAZy database
(57; 58). This project is focusing on AA9 LPMOs, which are exclusively found in fungi
and act preferentially in cellulose (59).

13
Specifically, LPMOs are enzymes that catalyze oxidative cleavage of glycosidic bonds
after being activated by an electron donor that they can find in their environment.
During the cleavage LPMOs oxidize C1, C4 or both of carbon atoms of glucose.
LPMOs, besides cellulose, can also depolymerize other polysaccharides such as chitin
(15), starch (60) and hemicellulose (61). It is therefore understandable that LPMOs
offer great promise for further improvements in biomass deconstruction processes.
LPMOs are found widespread in fungal (62) and bacterial organisms (15), as well as in
viruses (63). Quinlan et al (2011) using electron paramagnetic resonance spectroscopy
LPMO was shown to contain a single type 2 copper center, with a t-shaped coordination
sphere termed the histidine brace, where two histidines provide three nitrogen ligands,
two from N-His and one from the terminal amine (64) (Figure 6). There is also tyrosine
involved together with those two histidines in the coordination of copper (65). In fungal
LPMOs N-histidine is methylated, which is makes them special amongst the LPMOs
and it is unknown why they have this difference (56).
Figure 6. Illustrations of the surface structure (left) and the copper active site (right) of the
AA9 LPMO. The flat surface binds crystalline cellulose, and the metal center catalyzes
oxidative cleavage of glycosidic bond (66)
In order for LPMO to complete their catalytic cycle they need an extracellular electron
donation from either proteins or plant-derived molecules plus they require oxygen
molecules that is necessary for their activity (15). One major advantage that LPMO can
offer is the reduction of the enzyme loading in the hydrolysis process (52). Less enzyme
loading has financially benefits for the whole process but also environmental benefits
due to the fact that the enzyme production has one of the highest contributions to the

14
Global Warming Potential and to the Photochemical Ozone Creation Potential
including other processes such as fermentation, pretreatment and cultivation and
harvesting of straw (67). However, LPMOs have a disadvantage which is that they
release reactive oxygen species after the redox reaction. Reactive oxygen species are
chemically reactive molecules containing oxygen, for example hydrogen peroxide and
superoxide radical (68; 69) and they are harmful for the cell and for the enzymes and
for LPMO itself.
2.3.2. Activation of LPMO
As it been mentioned, LPMOs need molecular oxygen and an external electron donor
for their proper function and for completion of their catalytic cycle. However, the types
of electron donors and the mechanism of electron transfer are still not completely clear
(64). First, diphenols derived from plants showed that they can initiate LPMO activity
on cellulose (70). Then Kracher et al. (71) using biochemical methods and genome data
has characterize and compare different electron sources for LPMOs and both proteins
and plant-derived molecules have been found to serve as electron donors (Figure 7).
Figure 7. Scheme of several natural electron sources that have been identified as activators
to LPMOs, including enzymes (cellobiose dehydrogenases and glucose dehydrogenase),
phenolic compounds and light-activated photosynthetic pigments (16).

15
One protein electron donor for LPMOs is cellobiose dehydrogenases (CDHs) which
has been reported that can act as an activator to LPMOs (72; 73). CDH are enzymes
from the family oxidoreductases and they oxidize oligosaccharides and disaccharides,
for example lactose and cellobiose using electron acceptors (74). About CDH-LPMO
system it has been suggested that CDH transfer electron to LPMO from its catalytic
dehydrogenase domain via its mobile cytochrome domain (75). Kracher et al. using
stopped-flow spectroscopy showed that different combinations of LPMOs and CDHs
can have high rates of electron transfers. They suggested that preferences of LPMOs
for specific CDHs, which could be figured out by the different rates of electron
transfers, can be due to variation in surface complementarity at the protein/protein
interface. Another enzymatic source of electron to LPMOs are the enzymes glucose
dehydrogenase, which belongs in the same family with CDH but they act differently as
electron donors to LPMOs than CDH. That is because they do not act as direct electron
donors but plant-derived or fungal diphenols and/or quinones serve as redox mediators
between them and LPMO creating an efficient electron transfer system (71).
Non-enzymatic source for electrons to LPMOs can be natural reductants like phenolic
compounds such as ascorbic acid, gallic acid, phenols from lignin (76; 56). In literature,
ascorbic acid has often been used as electron donor in experiments but in our
experiments gallic acid was used as an electron donor because it is more stable than the
ascorbic acid. Another interesting source for electron are photosynthetic pigments, once
activated by light. Specifically, Canella et al (2016) (64) they investigated the effect of
chlorophyll pigments, once activated by light, to LPMOs and they report that the
catalytic activity of LPMOs can be driven by light and it can reach in some cases 100
faster than with standard reductants such as extracted lignin.

16
2.4. Saccharification of Cellulose
The efficient enzymatic hydrolysis or degradation of plant biomass is one of the major
industrial challenges of the 21st century. In order to obtain the constituent sugars from
lignocellulosic biomass, the cellulosic and hemicellulosic portions of biomass should
be separated from the lignin and depolymerized (77). When it comes to cellulose
portion two important difficulties exist. Firstly, it is known that the structure of cellulose
is resistant to hydrolysis attack and second is that the cellulose chains forming extensive
intrachain hydrogen bonding. These two problems amplify each other, making cellulose
degradation quite challenging. Furthermore, it is rational that multiple enzymatic
activities are required in cellulose hydrolysis leading to soluble sugars that can then be
metabolized by fermenting microorganisms. Briefly, Endoglucanases randomly cut
internal sites on amorphous cellulose surfaces, generating and release new chain ends.
CBH has two types, I and II and despite the basic functional similarity, their action
appears to be little different (78). CBH I is suggested to start its action from the reducing
end of the cellulose chain, while the CBH II prefers the opposite direction. Generally,
CBHs act in a processive manner on the reducing or nonreducing ends of cellulose and
liberate cellobiose as major products. β-Glucosidases hydrolyze soluble cyclodextrins
and cellobiose to D-glucose and thus relieve the system from end product inhibition
(79).
The term hydrolysis of cellulose is similar to the saccharification of cellulose but when
it comes for LPMOs the term hydrolysis is not the proper one to describe their activity.
That is because hydrolysis does not represent the action of LPMOs as they use an
oxidative mechanism which is different from the classical hydrolytic mechanism that
the cellulases use. LPMOs have emerged as key enzymes for the degradation of
cellulose as they are the first enzymes that react with the crystalline cellulose, making
the substrate easier accessible for the rest of cellulases boosting their activity. This
boosting effect is from the creation of new chain breaks in crystalline regions of the
substrate by LPMO activity (80). This chain breaks are creating when LPMOs use their
single active-site copper ion to activate molecular oxygen and hydroxylate the
polysaccharide backbone (73). This oxygen activation depends on external electron
donors that LPMO can found in their environment. So, practically LPMOs provide a
solution to the problem of accessing the active site of cellulases to crystalline regions
of cellulose. In LPMOs, the active site is located on a planar surface of approximately

17
1200 Å to facilitate the metal dependent oxidative cleavage of the glycan chains, which
help cellulase components to access cellulose fibers by producing nicks in between the
chain (66). Therefore, the action of the LPMO together with EGs can help cellulase
components such as CBHs to access cellulose fibers by producing nicks in between the
chain (Figure 8).
Figure 8. Illustration of the enzymatic degradation of cellulose including AA9 LPMOs,
endoglucanases (EG I, II and III), cellobiohydrolases (CBH I and II) and β-glucosidases. At
the left side is the non-reducing end (NR) and at the right side is the reducing end (R) of the
cellulose chain. The blue triangles that are connected with some of the cellulases are their
cellulose-binding modules (52).
First information about the mechanism of fungal LPMOs are from Harris et al (2010)
that they showed the importance of the metal in the active site and that their mechanism
is unlikely to be a classic hydrolytic one (81). Then more information about the
mechanism of LPMO that can degrade chitin, which back their family was called
CBM33 and nowadays AA10, is from Vaaje-Kolstad et al (2010), where they used
isotopically labelled dioxygen to confirm overall monooxygenase activity on chitin
(15). The chain cleavage of chitin was observed at the C1 carbon atom and it was
revealed through the addition of a chitinase to release detectable products. Another
isotope labelling study (82), used AA9 enzymes on PASC, show that LPMO-catalysed
hydrogen atom abstraction at either C1 and/or C4 carbon atom positions followed by
cleavage of the glycosidic C–O bond.

18
2.5. Factors that affect Cellulase’s activity
Enzymatic hydrolysis is a complex process that can be affected by many parameters.
We can divide the factors that affect the enzymatic degradation in two categories: the
enzyme related factors and the substrate related factors. The first category contains
many different factors such as:
• Enzyme system composition and concentration
• Adsorption
• End-product inhibition
• Reaction conditions of hydrolysis
Each one has different effect on the process but is difficult to quantify the influence
individually. About the enzyme system the origin of the enzymes plays role, given the
fact that enzymes can be produced from different sources such as bacteria, fungi and
virus. The composition of the enzymatic mixture is also important due to the fact the
right loading analogies of the different enzymes have major effect at the extent of the
synergism of the system. About loading and concentration there is a general rule that
the conversion of the substrate increases with higher dosage and concentration,
however the increase conversion is not proportional with the increase of enzyme dosage
(83). Adsorption on the enzymes on the substrate surface plays an important role in the
efficiency of the decomposition of cellulose to glucose and as a general rule ‘’the better
the adsorption the better the catalysis’’ (84). There is also unproductive adsorption and
this is when enzymes are not recovered and it is being reported that cellulases can have
unproductive binding to lignin surface (85) or even to cellulose surface (86; 87). End
product inhibition is considered an important enzyme factor related with the decrease
of the conversion at the end of the process. Cellulases can be inhibited by cellobiose,
also by glucose but to a lesser extent, which are the products of the hydrolysis. (88; 89).
Continuous and fed batch processes are often adopted to cope with the inhibitory effect
of such compounds (90). For example, in batch processes an additional quantity of BGs
is added during the reaction in order the BGs to covert the inhibitory cellobiose to the
less inhibitory glucose. Last the conditions of the process are very important for the
hydrolysis and they should be related with the conditions that the enzymes are working
more effective. Typical industrial hydrolysis process has temperature at 50οC, pH

19
around 5 (11). The adsorption activities beyond 60o C decreased, possibly because of
the loss of enzyme configuration leading to denaturation of enzyme activity.
The second category is also important for the efficient action of the enzymes and it is
about substrate related factors. Composition of cellulose, hemicellulose and lignin is
very important for the final yield and the initial rate of hydrolysis, for example removal
of lignin can increase dramatically the hydrolysis rate (91). When the substrate consists
of cellulose, parameters such as concentration, crystallinity, surface area, degree of
polymerization are affecting the final yield and the initial rate of cellulases. About
concentration at low substrate levels, an increase of substrate concentration leads to an
increase of the yield and the reaction rate. However, when high substrate concentration
exists and depending on the ratio of the total substrate to total enzyme, there can be
substrate inhibition, which substantially lowers the rate of hydrolysis (87; 92).
Structural features of substrate are important and generally and they are related for
example the degree of polymerization is related with the degree of crystallinity. The
surface area is a very important characteristic of the substrate and declares the
accessibility of the substrate from the enzymes. The higher the surface area means more
adsorption sites for the enzymes to act (93). Therefore, substrate pretreatment methods
often include cutting, that is, reduction in size, of the lignocellulosic material to increase
the surface area.
2.6. Liquid-liquid Extraction
The Liquid-liquid extraction (LLE) is method that is used as a separation process for
substances in liquid samples. In LLE, there are two immiscible liquids forming two
phases with the denser phase on the bottom. One phase is an aqueous phase and the
other phase is an organic solvent and solutes from the aqueous phase are extracted to
the solvent phase. The solute is initially present in one of the two phases; after the
extraction, it is present in both phases. Extraction efficiency which is the percentage of
solute moving from one phase to the other, can be determined by the equilibrium
constant for the solute’s partitioning between the phases and any other reactions
involving the solute. A solute’s partitioning between two phases is described by a
partition coefficient, KD. The KD is defined by the ratio of the concentration of solute

20
at the organic phase to the concentration of the solute to the aqueous phase. The larger
value of KD means that the extraction of solute into the organic phase is favorable. The
partition coefficient is an equilibrium constant and has a fixed value for the solute’s
partitioning between the phases (94; 95; 96).
Number of extractions is an important factor for the efficiency of the method and
instead of using one big quantity of solvent for one extraction, it can be used several
extractions using smaller portions of solvent each time. Interaction between the two
phases is also important for the extraction. Examples of reactions affecting extraction
efficiency include acid–base reactions and complexation reactions (97). The solvents
that are used in this method are based on their polarity and the immiscibility with the
liquid sample. For example, ethers and ketones are among the most employed solvents
for removing phenolics from water, whereas ethyl acetate and diethyl ether have been
used for extracting low molecular weight phenolics from oak wood (98). Another case
is that the different solvents can extract different concentration of compounds. For
example, pentane, hexane, methylcyclohexane and iso-octane were used to extract
different concentrations of trihalomethanes from water (99). LLE can be used as a
method for the recovery of aromatic substances (100; 101) and also it can be used for
the isolation of phenolic compounds in juices or fruit/plant extracts (102; 103; 104). In
order for substances to be collected after the extraction the isolation of the solvent is
taking place. Most common isolation methods of the organic solvent are freeze-drying
and vacuum evaporation (95) and in this project the method vacuum evaporation was
chosen.
21
2.7. Folin-Ciocalteu method
Folin-Ciocalteu (FC) is a spectrophotometric assay applied to determine the total
phenolic content in liquid samples This assay relies on the colorimetric redox reaction
which determines the total amount of phenolics without separating monomeric, dimeric
and larger size components (105). Basically, provides a convenient and simple
estimation of the phenolic content in liquid samples such as plant extracts, juices,
mixtures using a specific reagent. This reagent is a solution of complex polymeric ions
formed by Phospholomolybdenum and Phospho-tungsten heteropolymeric acids and it
is called FC reagent. More specifically phenolic ions are oxidized by simultaneous
reduction of heteropolymeric acids and the product is a complex of tungsten and
molybdenum in blue which can be determined spectroscopically at 765 nm (106). The
absorbance is proportional to the number of aromatic phenolic groups and for their
determination gallic acid, which is a type of phenolic acid, is the most common
chemical as standard (107). Generally, the method has been proposed as a standardized
method for use in the routine quality control and measurement of antioxidant capacity
of food products (108), because it is known that polyphenolic compounds can act as
antioxidants in fruits and vegetables (109). One disadvantage of this method is that
tends to overestimate the total phenolic content of the sample compare to the other
methods such as chromatographic methods (HPLC) and solid-phase extraction (110).
2.8. Tannins
Tannins are described as a water-soluble, complex polyphenolic biomolecule with high
molecular weight with great structural diversity and wide phylogenetic distribution
(111; 112) . Sources of tannins can be fruits, leaves, tea, coffee, wine (112; 113). It is
known that the more astringent a fruit is the more tannic content the fruit has (113). In
this project, the PE that is being used comes from astringent persimmon fruit, so it
should contein tannins. Tannins can be classified in three main categories based on their
structures, such as hydrolysable tannins, non-hydrolysable tannins (condensed tannins)
and pseudo tannins (114). Each category consists of many different tannins making the
identification of tannins in extracts quite difficult. Tannic acid (Figure 9) is one

22
representative tannin for the hydrolysable tannins and it was used in this project. One
of the properties that tannins have is that they can cross link and precipitate proteins
with hydrogen bonds as well as ionic bonds (113). Given the fact that enzymes are
proteins it is interesting to evaluate the effect that tannins have on the enzymes, which
is known that tannins have inhibitory effect to enzymes (115; 116). Kawamoto et al
(117) showed that tannins interact with proteins and they can decrease the BGs activity
due to irreversible protein denaturation. Tannin-enzyme interaction is not only
depended on the source of tannin, but also on the nature and source of the enzyme (118).
In literature has been found (119; 120) that there is an insoluble matrix that called
Polyvinyl PolyPyrrolidone (PVPP) and has the ability to bind tannins and impurities
from solutions. It is also used in wine treatment in order to reduce phenolic content and
organic acids in wine (121; 122). PVPP is a highly cross-linked solid co-particle
material, it is insoluble in water and swells very rapidly generating a swelling force
(123). Therefore, it can be used as an disintegrant in pharmaceutical tablets. It is a
modification of polyvinylpyrrolidone (PVP), which is also known for binding tannins.
Like PVP, PVPP can bind phenolic content, especially big polyphenolic molecules,
such as tannins, by forming hydrogen bonds with them (124). Polyethylene glycol is
also known for binding tannins but in this project only the effect of PVPP was evaluated
(123).
Figure 9. Chemical structure of tannic acid. Tannic acid is composed of a central glucose
molecule esterified at five hydroxyl moieties with two gallic acid molecules each. The shaded
circle highlights pentagalloylglucose and the core structure of tannic acid (125).
23
3. Experimental part
In order to find modulators for LPMO enzymes, an experimental procedure has been
followed that shows the activity of LPMOs and BGs on their saccharification process.
BG were chosen as a representative hydrolytic enzyme in the experiments in order to
observe if there are different effects on LPMO and BG. Also, LPMOs release relatively
small amount of products which are oxidized compounds. Detection and identification
of those oxidized compounds is quite laborious. So, by addition of BG it is easier the
detection of glucose as the final product. BG without addition of LPMOs is releasing
low values of glucose. So, combining LPMO and BG it is possible to observe the action
of LPMO.
As a source for modulators a PE was added to the mixture in order to observe a
difference on the saccharification results from samples without addition of it. This PE
comes from an astringent persimmon fruit and it is based on literature (126) which
shows that immature persimmon has an inhibitory effect to the C1 enzymes, that now
we know them as LPMOs. This PE alone is quite complex to be analyzed so
fractionation of this took place in order to create different and simpler fractions of it
with different effects to be tested in enzymatic saccharification experiments. Therefore,
LLE was used as a fractionation method to the PE. In general, plant extracts that come
from fruit contain a variety of phenolic acids, flavonoids, tannins and carotenes (127;
124). Persimmon fruit especially is known that has high content of tannins (128; 129).
For that reason, isolation of tannins from the PE took place using PVPP. Also, the effect
on temperature was tested on the PE with the aim to evaluate if there is a protein nature
compound that has the inhibitory effect to the enzymes and can be precipitated in those
temperatures. The total phenolic content on the PE and the fractions of it was measured
using the FC method. Last concentration of tannic acid was added in the
saccharification system in order to evaluate the inhibitory effect of tannins to LPMOs
and BGs.

24
3.1. Chemicals and Enzymes
Different chemicals and enzymes were used in the experimental part of this project. All
enzymes were kindly provided by Novozymes A/S and prepared as described by Scott
et al. (130) . The enzymes were purified BGs with concentration 34 g/L and fungal AA9
purified LPMO enzymes with concentration 73 g/L, with name TaAA9A and from now
on throughout the thesis they will be called like this. Ta stands for the name of the
microorganism of origin, which is Thermoascus aurantiacus, AA9, a fungal class of
LPMOs and the last A shows that it is the first LPMO reported from that particular
organism.
For PASC production the chemicals that they have been used were Avicell PH-101
(from cotton linters Cellulose powder 50 μm particle size), Phosphoric acid 85 wt % in
H2O, Sodium Carbonate and double distillated water (miliq water) was used. Sodium
Carbonate and Phosphoric acid were purchased from Sigma-Aldrich and Avicel from
Fluka Analytical. The solution of sodium carbonate was made by adding 5,3 g of
sodium carbonate in 250 ml of water.
For the saccharification experiments the chemicals that they were used were gallic acid
with concentration 40 mM and triethylammonium acetate with concentration 0,1 M and
pH 5,5 which from now on will be called buffer. Gallic acid and buffer were purchased
from Sigma-Aldrich. The solution of gallic acid was made by adding 340.6 g of solid
gallic acid in 50 mL of miliq water in order to have the requested concentration of 40
mM. Then the solution of 50 mL it was pippeted in 25 2-mL Eppendorf tubes and then
it was storage in the freezer at -20oC in a box for light protection. The buffer was
produced after ten times dilution of commercial triethylammonium acetate (1 M) with
miliq water and then adding solution of acetic acid of 1 M concentration till the pH of
buffer became 5,5. Then the solution was added in a glass bottle and it was stored in
the fridge at 4oC which is the solution of buffer that was used in the saccharification
experiments. For the fractionation experiments the four solvents ethyl acetate,
dichloromethane, diethylamine ,1-butanol were all purchased from Sigma-Aldrich.
About the isolation of tannins commercial PVPP (110 μm particle size) was used, which
was purchased from Sigma-Aldrich. Tannic acid and FC reagent also used in parts in
the experiment process and they were purchased from Sigma-Aldrich.

25
3.2. Production of phosphoric acid swollen cellulose (PASC)
PASC has been chosen as a model substrate for the enzymes because it is an amorphous
form of cellulose with low degree of crystallinity (Table 1). That makes PASC more
accessible for the enzymes than other forms of cellulose such as Avicel or cotton. Also,
after the hydrolysis process from the variety of simple sugars only glucose is being
produced and that makes the system simpler where it is easier to screen many conditions
and to have a robust and quick experimental set-up. In case we had a lignocellulosic
substrate, more simple sugars would have been produced such as xylose, mannose. In
addition, the major issue in case of lignocellulosic substrate would have been the
production of complex oxidized products by LPMOs (131; 64). Those oxidized
products would have made the quantification of final products more difficult task since
standards for them are not available for purchase and they do not produce much amount
of those which would have made the results more complicated.
The experimental procedure for PASC production was based on the reference (35).
Firstly, 1,4 g of Avicell were mixed with 4,2 ml of water and then 70 ml ice cold
Phosphoric acid was slowly added (10 ml each time) to the mixture. The mixture stayed
on ice for one hour with occasional stirring. After one hour, 280 ml of ice cold water
were added to the mixture slowly with stirring at the same time. Then the mixture of
water, Avicel and phosphoric acid was centrifuged for 20 minutes at 5000 rpm and 4oC.
After centrifugation, the supernatant was discarded and ice-cold miliq water was added
till approximately 350 ml for the pellet in order to wash away the phosphoric acid from
PASC. Then the second centrifugation was performed and the same procedure of
removal of liquid and addition new ice-cold water was repeated three more times, so
five times in total. After the last centrifugation, solution of sodium carbonate with
concentration 2 M was added till the pH reaches values between 5-7. Then three more
times of centrifugation was performed with the same conditions as before. At the end,
the white slurry part (Figure 3.1) was transferred in a glass bottle and some small
portion of miliq water was added in order for the PASC to became less viscous.

26
Figure 3.1. PASC solution
To measure the concentration of PASC triplicates were taken from the PASC solution
and they were dried in the oven at 105oC for approximately 10-15 hours. After, the
weight of the dried samples was measured and the concentration of the solution of
PASC was calculated in g/L. For the saccharification experiment, which is going to be
described in section 3.3 the initial concentration of PASC should be 10 g/L. So, after
the calculation of the concentration from the dry weight measurement, which was
usually around 12-15 g/L, the stock solution was diluted in 10 g/L and it was stored in
the fridge at 4oC.
3.3. Enzymatic saccharification of PASC
The procedure that was followed in the saccharification experiments was based on the
reference (56). In these experiments, all the samples were putted in in 2 mL Eppendorf
tubes and they have constant final reaction volume of 1 mL. First 500 μL of stored
PASC was added in the Eppendorf tubes so the final concentration of PASC was 5 g/L.
Then buffer with initial concentration 0,1 M and pH =5,5 was added to each sample
with different volumes, depending the sample. These differences were based on the
volumes of the other reactants in order to have final reaction volume 1 mL. The final
concentration of buffer in the mixture for these experiments was between 0.0359-
0.0372 M. Then solution 125 μL of gallic acid with concentration 40 mM were added
to each sample so the final concentration of gallic acid in the reaction volume was 5
mM. At the end, 15 μL of TaAA9A and 15 μL BG were added after they got diluted
with buffer 5 times. As it been mentioned the initial concentration of the enzymes were
34 g/L for the BGs and 73 g/L for the TaAA9A so after the 5 times dilution the final

27
concentration for the enzymes in the reaction volume were 0,219 g/L for TaAA9A and
0.102 g/L for BGs. The pH was tested in samples and it was always between 4.85-5,35
which is in the range of pH that the enzymes can work (56) and the values of pH from
representative samples is given at the Appendix (Table 6.3). Last in some samples
dilutions of the PE were added to the mixtures. The PE was always diluted first 20 times
with buffer and based on the volume that it was added in the mixture, it got different
final dilutions. Specifically, four different final dilutions were tested: 1000x, 500x
,100x, 50x. Below (Table 3.1) are the volumes of representative samples that have been
used and for every different condition triplicates were made.
Table 3.1. Reactants volumes at representative samples at the saccharification experiments.
In this table, the samples with the PE have 100 times final dilution from the initial PE.
Samples PASC
(10 g/L)
Buffer
(0,1 M)
Gallic acid
(40 mM)
Enzymes PE
(20x diluted in
buffer) LPMOs
(5x diluted
with buffer)
BGs
(5x diluted
with buffer)
1 500 μL 345 μL 125 μL 15 μL 15 μL -
2 500 μL 360 μL 125 μL 15 μL - -
3 500 μL 360 μL 125 μL - 15 μL -
4 500 μL 145 μL 125 μL 15 μL 15 μL 200 μL
5 500 μL 160μL 125 μL 15 μL - 200 μL
6 500 μL 160μL 125 μL - 15 μL 200 μL
After adding all the reactants in the 2 mL Eppendorf tubes then incubation took place
in thermomixer for three days at 50οC and 1000 rpm. After three days, the samples were
centrifuged (Figure 3.2) at 10000 rpm and then the supernatant was collected and it was
filtrated with 0,2 nm Nylon filters. Finally, the filtrated supernatant of each sample it
was putted in freezer (-20oC) in 1,5 mL Eppendorf tubes for storage and then it was
measured for its glucose concentration by HPLC as it is being explained in the section
3.6. There were also samples taken out every day out of the three days reaction in order
to do a time course saccharification experiment.

28
Figure 3.2. Samples after three days saccharification reaction and after centrifugation. The
left sample in photo is without adding PE and on the right sample is by adding the 100x
dilution of PE.
3.3.1. Saccharification experiments adding tannic acid
In order to test the effect of tannins on LPMOs and BG and evaluate if there is a
different effect on them, tannic acid was added in the saccharification mixtures at
different concentrations. Initially commercial tannic acid was dissolved in water and
not in buffer due to the fact that tannic acid was precipitated in buffer. At table 3.2 are
given the volumes of reactants at representative samples at the saccharification
experiments. Two different saccharification experiments were made adding different
range of tannic acid concentrations. Every different dilution of tannic acid was added
in the same volume of 200 μL at the mixture. The dilutions that were made were 6, 2.9
,1.44, 0.36 mM at the first experiment and 1, 0.75, 0.5, 0.36 mM at the second one.
Final dilutions of the tannic acid in the mixtures are given in the Table 3.3. In these
experiments, the final concentration of buffer for the samples with addition of tannic
acid was 0.0169 M for samples with both enzymes (Sample 4 Table 3.2) and 0.0172 M
for samples with one of the two enzymes (Samples 5,6 Table 3.2). For the Blank
samples (Samples 1,2,3 Table 3.2) the final concentration of buffer was 0.0369 M for
the samples with both enzymes (Sample 1 Table 3.2), 0.0372 M for the samples with
one of the two enzymes (Samples 1,2 Table 3.2) and they have the same final
concentrations with the Blank samples from Table 3.1 (Samples 1,2,3).

29
Table 3.2. Reactants volumes at representative samples at the saccharification experiments
adding dilutions of tannic acid to the mixture.
Samples PASC
(10 g/L)
Buffer
(0,1 M)
Gallic acid
(40 mM)
Enzymes Tannic acid
(diluted with in
water) LPMOs
(5x diluted
with buffer)
BGs
(5x diluted
with buffer)
1 500 μL 345 μL 125 μL 15 μL 15 μL -
2 500 μL 360 μL 125 μL 15 μL - -
3 500 μL 360 μL 125 μL - 15 μL -
4 500 μL 145 μL 125 μL 15 μL 15 μL 200 μL
5 500 μL 160μL 125 μL 15 μL - 200 μL
6 500 μL 160μL 125 μL - 15 μL 200 μL
Table 3.3. Initial and final concentrations of tannic acid at the saccharification experiments.
Tannic acid initial concentration
diluted in water
(mM)
Tannic acid final
concentration in the mixture
(mM)
0.36 0.072
0.5 0.1
0.75 0.15
1 0.2
1.44 0.288
2.9 0.58
6 1.2

30
3.4. Liquid-liquid extraction experiment
In order to create fractions from the PE, LLE was performed, using different organic
solvents. The solvents were diethylamine, ethyl acetate, dichloromethane and 1-
butanol. Those solvents were chosen for their properties such their polarity, miscibility
and solubility with the PE and based on literature (103; 132). In the Appendix,
polarities, boiling points and pH of those solvent are given (Table 6.1).
At the beginning a trial set of experiment took place in order to evaluate if this method
can create fractions with modulatory effect on the LPMOs and BGs. The experimental
process is represented in the Figure 3.3. First, 8 mL of PE were mixed with 32 mL of
the solvent in 50 mL plastic tubes (Figure 3.4.i). The volume ratio was chosen based
on the reference (132) and afterwards the tubes were mixed thoroughly for
approximately 4-5 minutes (Figure 3.4.ii). Then centrifugation took place for 5 minutes
at 5000 rpm and room temperature. After centrifugation, the two immiscible liquids
which were the solvent layer and the PE layer (F1) (Figure 3.4.iii) were separated using
a separation funnel. After the separation, the organic solvent layer was evaporated till
dryness in a vacuum evaporator between 30-45oC. The differences in the temperature
were because of the differences in volatility of each solvent. At the end, after the
isolation of solvent, the respective residue was dissolved in 1 mL of buffer that was
used for the saccharification experiments. Then this mixture of the residue and buffer,
which is a fraction of the PE (F2), was used in the saccharification experiments instead
of buffer like the sample 1 (Table 3.1). The PE after mixing and centrifugation (F1)
was tested in the saccharification experiments as samples 4,5,6 (Table 3.1).
Figure 3.3. Fractionation experimental process scheme

31
Results from this trial experiment are given in the Figure 4.4.1. Then the whole process
was repeated in order to achieve higher concentrations of the fractions (F2) and in order
to collect more volume of it. The procedure of mixing solvent and PE was repeated 4
more times using each time new solvent and new PE so in total 32 mL of PE were
mixed with 160 mL of solvent but for convenience reasons the mixing was done in five
different 50 mL plastic tubes. Then the 5 solvent layers were mixed and they were
evaporated till dryness to the vacuum evaporator. The final residue was diluted in 5,7
mL of buffer and this mixture of buffer and residue was stored covered with aluminum
foil to protect from light at 4oC temperature. The same procedure was done for all four
solvents.
Figure 3.4. Extraction snapshots using ethyl acetate as solvent. After adding ethyl acetate to
the PE (i), right after mixing (ii), after centrifugation (iii)
Finally, the four mixtures that were stored they were used in the saccharification
experiments as the samples 1,2,3 (Table 3.1) but instead of buffer, these mixtures were
added in different dilutions. Three dilutions of every mixture were made and were used
in the saccharification experiments. The most concentrated mixtures were those in
which the remaining residues (Figure 3.5) after the evaporations of the solvents were
dissolved in 5.7 mL of buffer (Fraction 1x). Then two and four times dilution of this
mixture with buffer took place (Fraction 2x, Fraction 4x). The pH values of the mixtures
are given in the Appendix (Table 6.2). Results from these experiments are given to the
Figures 4.4.2, 4.4.3, 4.4.5, 4.4.7.

32
Figure 3.5. Remaining residue after the evaporation of ethyl acetate at the vacuum
evaporator (i) Remaining residue after the evaporation of diethylamine (ii)
3.5. Isolation of tannins
In order to test if tannins from the PE have an effect on the enzymes an experiment was
performed that includes the isolation of them from the PE. First, 1,5 mL of PE was
mixed 3 different amounts of commercial PVPP (0,15 g, 0.095 g, 0.04 g) in 2 mL
Eppendorf tubes. Then the mixture was putted in the thermomixer (model) for 30
minutes at 20oC and 1400 rpm. After 30 minutes of incubation and mixing the PE and
the PVPP were separated after centrifugation in 20oC and 14000 rpm (Figure 3.6.i ,
Figure 3.6.ii). Then the supernatant was centrifuged again in the same conditions, in
case of remains of PVPP in the supernatant. Final the supernatant was added as the
sample 4,5,6 from the table 3.1 in the saccharification experiments. Then the
experiments were repeated but this time 1,5 mL of PE were mixed with 0,2 g of PVPP
and the mixing time was 60 minutes. The rest of the procedure was the same.

33
Figure 3.6. PE and PVPP after mixing and before centrifugation (i). PE and PVPP after
centrifugation (ii).
3.6. Folin-Ciocalteu assay
For the quantification of the total phenolic content of the PE and the fractions after
LLE, FC method was applied. Τhe following experimental procedure was based on the
reference (106). First, dilutions of PE samples and fractions from LLE were made.
Specifically, the all the samples were diluted 200 times in water and one sample of PE
was diluted 300 times in water to test the different values between different dilutions.
Then 0.1 mL of the diluted sample were pipetted into a 2 mL Eppendorf tube. After 0.2
mL of FC reagent 10 times diluted with miliq water were added and then intensively
mixing for 1 minute took place in a Vortex spinning machine. When those two get
mixed if the sample contains phenolics then blue color appears and the more phenolic
content exists the bluer color the mixture gets. Afterwards 0.8 mL of 70 mM sodium
carbonate solution was added in the mixture, and then incubation took place for two
hours in a dark place at room temperature. With the sodium carbonate the alkalinity is
adjusted which also does not disturb the stability of FC reagent. After the incubation
0,2 mL of each sample were transferred in a 96-well plate. Finally, the absorbance of
blue coloration was measured at 765 nm against a blank sample in microplate reader.
The samples were compared to a standard curve of prepared gallic acid solutions which

34
is given in the Appendix (Figure 6.2). The final concentrations of gallic acid that were
used in the standard curve were 0 mM, 0.0125 mM, 0.025 mM, 0,05 mM and 0.1 mM.
Since the total volume of the mixture is 1100 μL and the initial volume of the sample
is 100 μL the final dilutions of the PE and fractions samples that were tested in the final
mixtures were 2200 times and 3300 times.
3.7. High Performance Liquid Chromatography (HPLC)
In order to measure the glucose concentration of samples after the three days reaction
and after 1 and 2 days in the time course saccharification experiments HPLC as method
was applied. HPLC is one of the most used and accurate methods for separation,
identification and quantification for each component in a mixture. Identification and
quantification of the components depends on the column used and standards available.
HPLC is based on the different interaction of each component with adsorbent material
that exists in the column, causing different flow rates for the different components and
leading to the separation of the components as they flow out the column (133). As it
was mentioned in section 3.3, after the three days reaction from the saccharification
experiments centrifugation took place at 10000 rpm, 5 minutes and 20oC and then
supernatant from the samples was filtrated with 0,2 nm Nylon filters. Then the filtrated
supernatants were tested for their glucose concentration. As a standard for glucose
concentration, glucose solution was used. Specifically, 5 different concentration of
glucose were used 10, 5, 2.5, 0.5 and 0.25 g/L in order to create a calibration curve for
the quantification of glucose for the samples. The HPLC analysis was performed using
a Rezex ROA Organic Acid H+ (300 mm x 7.8 mm) column with 0.8 mL/min flow at
80°C and a program time of 18 min. The eluent used will be a 5 mM solution of sulfuric
acid and the wash buffer is a 5% methanol solution. Data analysis will be performed
using Chromeleon software. Figure from HPLC from one representative sample is
given in the Appendix (Figure 6.1).

35
4. Results and discussion
4.1. Effect of PE on saccharification by LPMO and BG
To evaluate the effect that the PE from persimmon fruit has on the enzymes, 4 different
dilutions of the PE were added in the saccharification samples (Figure 4.1.1). The
different dilutions of the PE were made based on different reaction volumes of the
initial 20x diluted PE in the total reaction volume. Most of the results in this section are
represented as the graph at the Figure 4.1.1. It is important to mention that in every
series of experiments, there were samples without addition of the PE, which from now
will be called on Blanks. Blanks are the samples 1,2,3 as they are described in Table
3.1 and they represent the glucose concentration that can be released when there is no
addition of PE or something with modulatory effect on the enzymes. New Blank
samples were prepared every time when new series of experiments were performed,
due to the fact that in the whole experimental period four PASC were produced and it
is known that every PASC that is produced is different from each other (35; 32). That
is because properties of PASC are very dependent on the procedure that was used to
produce it, such as incubation time and mixing. Also in most of the experiments the
existing PASC was diluted from its original concentration to 5 g/L, so differences at
the glucose release in Blank samples might exists due to errors in dilutions of PASC in
addition with errors from the dry-weight measurement of the PASC concentration.
Giving an idea about the total saccharification at these experiments about the blank
samples, there were always between 34-38%. That conversion number is calculated
based on the final concentration of PASC (5 g/L) in the reaction volume and the average
amount of glucose titer from all the blank samples, which was around 1.7-2.1 g/L. The
factor to take into account for the increase in molecular mass when cellulose is
converted to glucose is 1.111, because glucose molecular mass is 180 g/mol and
glucosyl unit in cellulose molecular mass is 162 g/mol. These conversion values are not
in line with the percent conversion number of the Quillan et al (56) where with the same
enzymes and similar amounts of concentrations of PASC, gallic acid and enzymes they
got a conversion of substrate around 14%. This difference could not easily be explained
since the quantification of glucose from HPLC was correct and the calculations for the
PASC concentration were correct. It might be explained with the fact every PASC that

36
is produced is different from another one as it was mentioned before. So even though
the concentration of PASC was similar is possible that the surfaces of PASC are not
similar accessible to the enzymes due to differences in properties and structure of
PASC. In addition, there were some parameters at the saccharification experiments that
is uncertain if were done with the same way with Quillans et al and they can affect the
saccharification such as the final pH of the reaction samples, the difference of buffer
pH and the mixing speed.
Figure 4.1.1. Glucose titers after three days of reaction. The columns with dark grey
represents the samples that they are loaded with both TaAA9A and BG, while white color
columns represents the glucose titers when sample are loaded with TaAA9A and last with less
darker grey are the samples loaded with BG. The bars represent average values of three
replicates and the error bars show standard deviation of the average.
0
0.1
0.2
0.3
0.4
0.5
0.6
0.7
0.8
0.9
1
1.1
1.2
1.3
1.4
1.5
1.6
1.7
1.8
1.9
Blank 1000x diluted PE 500x diluted PE 100x diluted PE 50x diluted PE
Glu
cose
co
nce
ntr
atio
n (g
/L)
TaAA9A+BG TaAA9A BG

37
Table 4.1. Reduction of glucose release at the saccharification experiments after adding
different dilutions of PE. The values are based on the average glucose release of the samples
from the Figure 4.1.1.
Samples TaAA9A + BG TaAA9A BG
Reduction in glucose release (%)
Blank 0 0 0
1000x dilution of PE 2.5 13.7 0.1
500x dilution of PE 11.6 41.9 35.5
100x dilution of PE 42.1 85.1 73.2
50x dilution of PE 97.3 98.4 80.1
From the graph and the table, we can clearly observe that with all the dilutions tested
there a decrease in glucose release, so there is an inhibitory effect on both of the
enzymes. It is clear from both Figure 4.1.1 and the Table 4.1 that the PE has higher
effect on the TaAA9A than the BG, which makes the PE more interested to be further
tested for the overall aim of this project, which is to find a modulator for the TaAA9A.
Specifically in every dilution that was tested the reduction of the glucose release was
always higher than the glucose release from BGs and the most concentrated dilution of
the PE, the 50 times dilution, had almost complete inactivation of the TaAA9A unlike
the BGs.
In order to understand what are the inhibitory compounds in the PE, it is necessary to
think the source that this PE came from. As it mentioned the PE comes from an
astringent persimmon fruit and it is basically a fermented tannin juice from an unripe
persimmon. Persimmon juice like any fruit juice contain a huge variety of phenolic
compounds such as flavonoids, organic acids and tannins (113; 134; 135) and most of
these compounds of these compounds can have an inhibitory effect at cellulases (116;
136). Gorinstein, Shela, et al (1994) found using analytical methods in persimmon
extracts that p-coumaric acid was a main component and also, they measured gallic
acid, p-coumaric acid and protocatechuic in persimmon fruit-ethanol extracts (137).
However, when it comes to TaAA9A, phenolic compounds that might exists in the PE,
like gallic acid, can possible act as an electron donor to them (16). For this reason,
samples without gallic acid, but with and without addition of the PE were tested, in
order to test if the PE can act as an electron donor (Figure 4.1.2.).

38
Figure 4.1.2. Glucose titers after three days of reaction. The first triad are Blank samples and
the second triad represents samples without adding gallic acid but adding 100x diluted PE.
The bars represent average values of three replicates and the error bars show standard
deviation of the average.
It can be observed that the PE can act as an electron donor to LPMO. That proves the
complexity and the variety of compounds that exists in the PE that can work either as
activators or as inhibitors for the LPMO.
Something else that was interesting about the PE was the difference of the effect on
TaAA9A and BG that two PE have (Figure 4.1.3), which they have been purchased on
different times. Specifically, one PE has been purchased almost a year ago and the other
one about 4 months ago. From now on the first one will be called Old PE and the other
one New PE.
0
0.1
0.2
0.3
0.4
0.5
0.6
0.7
0.8
0.9
1
1.1
1.2
1.3
1.4
1.5
1.6
1.7
1.8
1.9
2
Blank No gallic acid 100x diluted P.E/No gallic acid
Glu
cose
co
nce
ntr
atio
n (
g/L)
TaAA9A +BG TaAA9A BG

39
Figure 4.1.3 Glucose titers after three days of reaction. The bars represent average values of
two replicates and the error bars show standard deviation of the average.
It can be observed that the Old PE has less inhibitory effect than the New PE to
TaAA9A. This means that the inhibitory substances can be affected by storage time
and/or by atmosphere conditions, such as oxygen or light, due to the openings of the
receptacle. That is a useful information about what might be the inhibitory compound,
which as it seems it can be affected by time and it can be oxidized. Substances that are
known that can be oxidized and they are affected by time storage and they exist in the
PE are phenolic compounds and organic acids such as vitamins. Klimczak et .al have
tested the effect of storage for 6 months in three different temperatures on the content
of polyphenolics in orange juice using F-C method and HPLC and their results show
that the total polyphenols are decreasing over time (110). Interesting also is that the Old
PE was precipitated from buffer when it was diluted in it. Photos of this precipitation
are shown in the Appendix (Figure 6.3.). After observing the results from the previous
graph most of the saccharification experiments were repeated using the New PE.
0
0.1
0.2
0.3
0.4
0.5
0.6
0.7
0.8
0.9
1
1.1
1.2
1.3
1.4
1.5
1.6
1.7
1.8
Blanks Old PE 100x New PE 100X
Glu
cose
co
nce
ntr
atio
n (
g/L)
TaAA9A+BG TaAA9A BG

40
Something else that was also plotted to a graph was the release of glucose concentration
during a time course experiment of the 3 days reaction in two cases, one for the Blanks
and one adding 100x diluted PE. Specifically, out of the three days reaction, triplicates
of samples were taken out every day (Figure 4.1.4, 4.1.5).
Figure 4.1.4. Increase of glucose concentration from Blanks samples at the three days
saccharification reaction. Samples were taken out every day and triplicates were made.
Figure 4.1.5. Increase of glucose concentration from samples with 100x PE at the three days
saccharification reaction. Samples were taken every day and triplicates were made.
0
0.1
0.2
0.3
0.4
0.5
0.6
0.7
0.8
0.9
1
1.1
1.2
1.3
1.4
1.5
1.6
1.7
1.8
0 0.5 1 1.5 2 2.5 3 3.5
Glu
cose
co
nce
ntr
ati
on
(g/L
)
TaAA9A+BG TaAA9A BG
0
0.05
0.1
0.15
0.2
0.25
0.3
0.35
0.4
0.45
0.5
0.55
0.6
0.65
0.7
0.75
0.8
0 0.5 1 1.5 2 2.5 3 3.5
Glu
cose
co
nce
tra
tio
n (g
/L)
TaAA9A+BG TaAA9A BG

41
From these two graphs, it can be observed that in case of the PE (Figure 4.1.5) the
increase of the glucose concentration for TaAA9A is not similar with the increase in
case of the blank samples (Figure 4.1.4). It seems that the PE affect the TaAA9A from
the beginning of the reaction in contrast with the BG which from the first day the
produce 98% of their total glucose release when PE is added. In case of the blank
samples, TaAA9A produce similar amount of glucose with BG but that does not happen
when PE is added where TaAA9A reach the similar amount of glucose the second day.
Also at the end of the experiment the difference between the TaAA9A and BG final
glucose release is different in the two cases. At the Blank samples TaAA9A have 71%
difference with BG samples, while when PE is added they have 43%. For the BG the
increase stays similar, the first day there is 70% increase from the total glucose release
in case of the blank samples and when PE is added the glucose release is 98% of the
total which means that the glucose release almost stops from the first day when PE is
added. Their synergism seems to be no affected how the glucose release is increasing
over the days, but the amount of glucose is changed as in every case when PE is added.
Specifically, the glucose release has been reduced about 51.7 %, close to the number of
reduction of glucose release at the Table 4.1, which is 46.9 %.
From all of the previous figures and results in this section it can be summarized that the
PE has different and more significant effect on TaAA9A than on BG. It is possible that
the PE is blocking the surface of the PASC without interacts or inactivates the TaAA9A.
This blocking is probably more intense in case of the TaAA9As, because they are about
6 times smaller than BGs, so they might need more time to overcome the potential
barrier that the PE is creating to PASCs surface, than BGs. That blocking can be more
significant if the PE binds with PASC external surface, creating areas that are no
accessible for both enzymes and especially for TaAA9A. However, it seems that there
might be potential deactivation of TaAA9A, due to the fact that the most diluted PE
(50x) clearly deactivates them, which can be observed also from the values of glucose,
when both enzymes are loaded. It can be seen that the glucose release in case of 50x
dilution, when both of the enzymes are loaded, is mostly because of the BGs action,
due to the fact that they have similar values with the samples were only BGs are loaded.
That is something that does not happened in all the other dilutions. However, maybe
the rest of the concentrations were not enough to deactivate all of the molecules of
TaAA9A so that is why there is still activity from TaAA9A. But from the Figure 4.1.2

42
it can be observed that there is increase of the activity in case where no electron donor
is added (no gallic acid) so if there are substances that deactivates the TaAA9A, it is
clear that there are other substances that can activate them. Nevertheless, it is not clear
and certain if PE deactivates the TaAA9A or is just blocking surfaces of the substrate.
4.2. Effect of filtrated and centrifugated PE on saccharification by TaAA9A
and BG
It could be seen that the receptacle of the juice had solid residues on its cap and also in
the description of the PE by the providers it is mentioned that it should be shaken
periodically and last when the PE was being centrifuged, small amount of residues
exists at the bottom. In order to evaluate if after isolation of small solid particles from
the PE there is a different effect on the enzymes, two treatments of the PE were made.
One filtration with 0,45 nm Nylon filters and the other was centrifugation. The results
are shown in the Figure 4.2.1.
Figure 4.2.1. Glucose titers after three days reaction with addition of PE with and without
filtration with 0,45 nm Nylon filters. For all the samples triplicates were made and the error
bars show standard deviation of the average.
0
0.1
0.2
0.3
0.4
0.5
0.6
0.7
0.8
0.9
1
1.1
1.2
1.3
1.4
1.5
1.6
1.7
1.8
1.9
2
Blank 100x PE 100x filtrated PE 100x Centrifugated PE
Glu
cose
co
nce
ntr
ati
on
(g/L
)
TaAA9 +BG TaAA9A BG
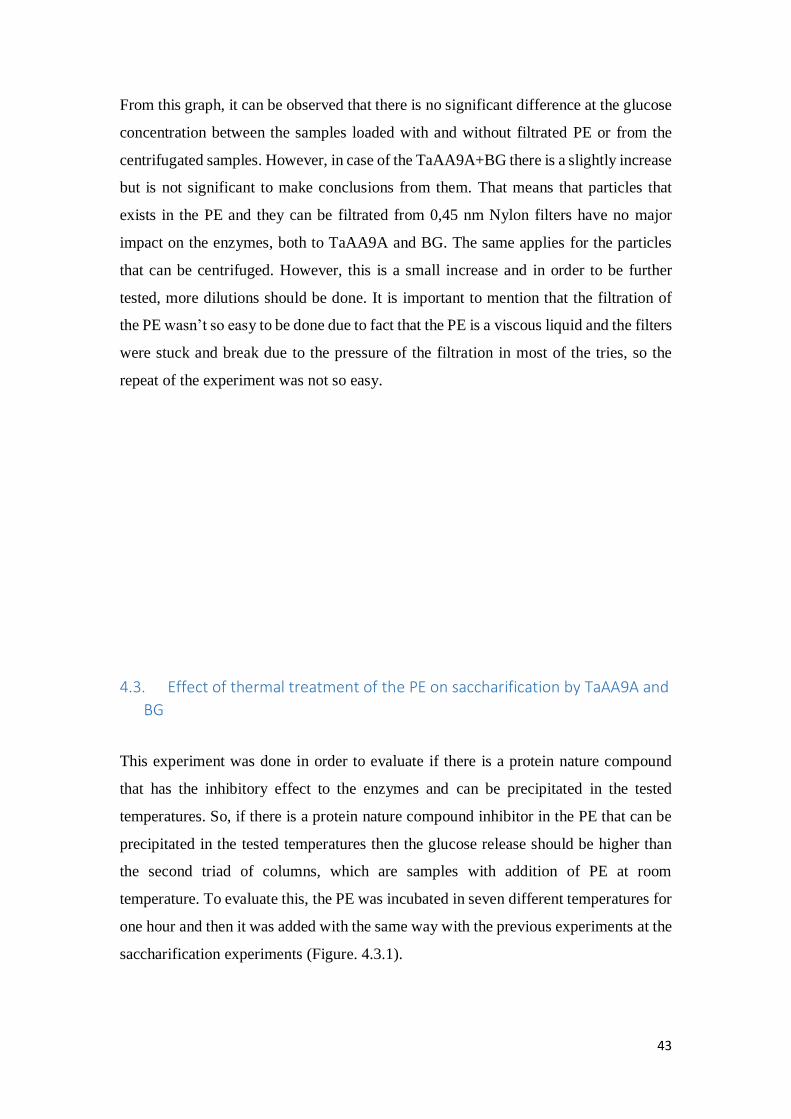
43
From this graph, it can be observed that there is no significant difference at the glucose
concentration between the samples loaded with and without filtrated PE or from the
centrifugated samples. However, in case of the TaAA9A+BG there is a slightly increase
but is not significant to make conclusions from them. That means that particles that
exists in the PE and they can be filtrated from 0,45 nm Nylon filters have no major
impact on the enzymes, both to TaAA9A and BG. The same applies for the particles
that can be centrifuged. However, this is a small increase and in order to be further
tested, more dilutions should be done. It is important to mention that the filtration of
the PE wasn’t so easy to be done due to fact that the PE is a viscous liquid and the filters
were stuck and break due to the pressure of the filtration in most of the tries, so the
repeat of the experiment was not so easy.
4.3. Effect of thermal treatment of the PE on saccharification by TaAA9A and
BG
This experiment was done in order to evaluate if there is a protein nature compound
that has the inhibitory effect to the enzymes and can be precipitated in the tested
temperatures. So, if there is a protein nature compound inhibitor in the PE that can be
precipitated in the tested temperatures then the glucose release should be higher than
the second triad of columns, which are samples with addition of PE at room
temperature. To evaluate this, the PE was incubated in seven different temperatures for
one hour and then it was added with the same way with the previous experiments at the
saccharification experiments (Figure. 4.3.1).

44
Figure 4.3.1. Glucose titers after three days reaction with addition of PE after being
incubated in seven different temperatures for one hour. The second triad was the PE at room
temperature. Each column represents an average of three replicates and the error bars show
the standard deviation of the average.
It can be observed that there is no serial increase or decrease in the glucose
concentration with the increase of the temperature. Also, some of the differences in the
columns are in the range of the error bars, so it cannot be said confidently that there is
difference. In all of the temperatures tested there is no difference between the BG
samples. The temperature that seems to have no effect in any enzyme is the 70. The
most interesting columns seem to be the 80 and 90 where the glucose concentration was
increased in TaAA9A samples. However, the samples with both TaAA9A and BG in
0
0.1
0.2
0.3
0.4
0.5
0.6
0.7
0.8
0.9
1
1.1
1.2
1.3
1.4
1.5
1.6
1.7
1.8
1.9
2
2.1
Blank 100x PE/20oC
100x PE/70oC
100x PE/80oC
100x PE/90oC
100x PE/100oC
100x PE/110oC
100x PE/120oC
Glu
cose
co
nce
ntr
atio
n (
g/L) TaAA9A+BG TaAA9A BG

45
those temperatures have decreased glucose concentration compared to the samples at
the second triad. That is not rational due to the fact that if in those temperatures
TaAA9A alone can work better and they can release more glucose then the samples
with TaAA9A and BG should also release more glucose. This could be explained due
to mistakes from pipetting errors in the experimental process. Important to mention is
that in this experiment the Old PE was used which means that the experiment should
be repeated. However due lack of time for this project two temperatures, the experiment
was repeated using the New PE (Figure 4.3.2).
Figure 4.3.2. Glucose titers after three days reaction with addition of PE after being
incubated in two different temperatures for one hour. For all the samples duplicates were
made and the error bars show the standard deviation of the average.
0
0.1
0.2
0.3
0.4
0.5
0.6
0.7
0.8
0.9
1
1.1
1.2
1.3
1.4
1.5
1.6
1.7
1.8
Blanks 100x PE 20oC 100x PE 80oC 100x PE 90oC
Glu
cose
co
nce
ntr
ati
on
(g/L
)
TaAA9A+BG TaAA9A BG
46
It can be observed that there is no increase in any temperature in those two temperatures,
meaning that if the inhibitory compound is a protein nature cannot be precipitated from
these temperatures and this incubation time. BGs seem again to be no affected by the
different treatment temperatures to PE. However, there is a decrease in the TaAA9A
samples which is not in line with the results from the previous graph about these
temperatures, meaning that is likely that errors in the experimental process took place
in the experiment at the Figure 4.3.1. This decrease is not high enough to conclude
information from it but it could be probable due to the fact that compounds in the PE
got deconstructed from the temperatures and after the deconstruction could have more
inhibitory effect on TaAA9A.
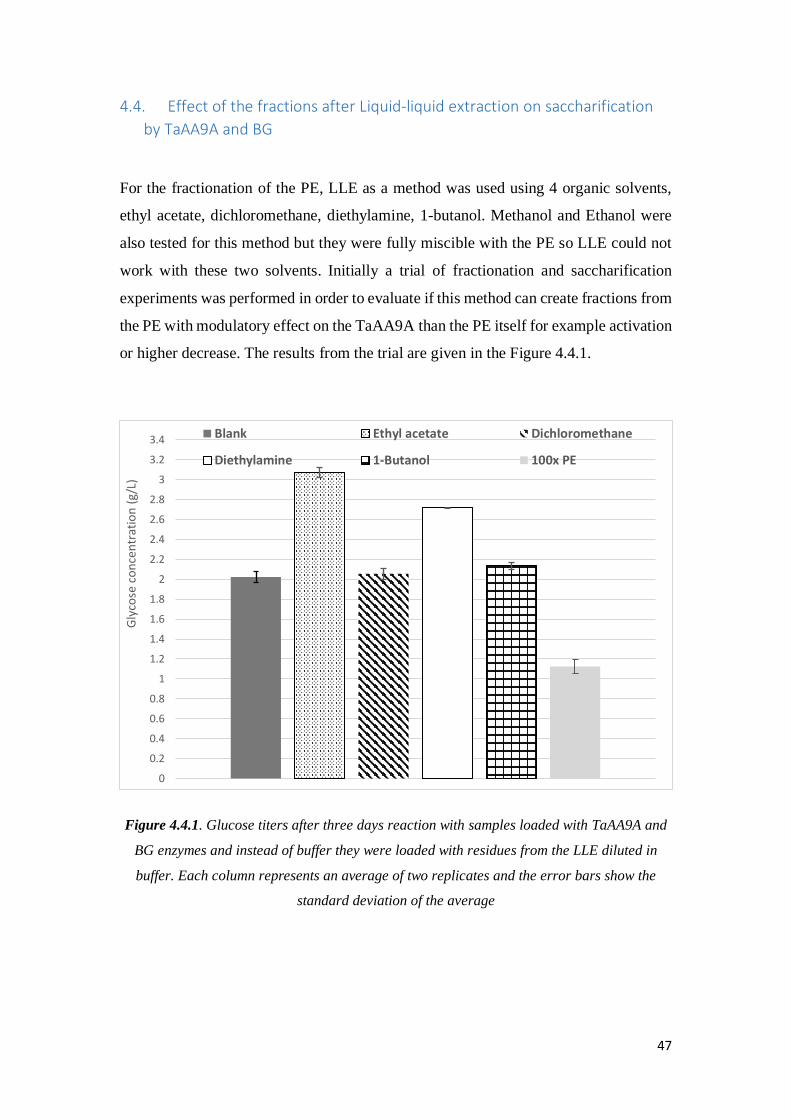
47
4.4. Effect of the fractions after Liquid-liquid extraction on saccharification
by TaAA9A and BG
For the fractionation of the PE, LLE as a method was used using 4 organic solvents,
ethyl acetate, dichloromethane, diethylamine, 1-butanol. Methanol and Ethanol were
also tested for this method but they were fully miscible with the PE so LLE could not
work with these two solvents. Initially a trial of fractionation and saccharification
experiments was performed in order to evaluate if this method can create fractions from
the PE with modulatory effect on the TaAA9A than the PE itself for example activation
or higher decrease. The results from the trial are given in the Figure 4.4.1.
Figure 4.4.1. Glucose titers after three days reaction with samples loaded with TaAA9A and
BG enzymes and instead of buffer they were loaded with residues from the LLE diluted in
buffer. Each column represents an average of two replicates and the error bars show the
standard deviation of the average
0
0.2
0.4
0.6
0.8
1
1.2
1.4
1.6
1.8
2
2.2
2.4
2.6
2.8
3
3.2
3.4
Gly
cose
co
nce
ntr
atio
n (
g/L)
Blank Ethyl acetate Dichloromethane
Diethylamine 1-Butanol 100x PE

48
From the Figure 4.4.1, it can be observed that this method created fractions with
different effect from the original PE. In particular, it is clear from the graph that the
fractions from the ethyl acetate and the diethylamine have an activatory effect to the
enzymes. For 1-butanol the glucose release is a little higher than the blank column and
for dichloromethane there is no difference. Especially for the samples with the ethyl
acetate fraction there was an increase about 33% from the Blank samples. Furthermore,
three of the solvents managed to extract substances from the PE which they can increase
the glucose release at the saccharification experiments, while for dichloromethane is
not certain if the fraction was not enough concentrated to have an effect on the enzymes.
In the case of the ethyl acetate and dichloromethane the PE after the mixing and
centrifugation with the solvents (F1) was tested in the saccharification experiments as
the samples 4,5,6 Table 3.1 and the results are shown in the Appendix Figure 6.4. It can
be observed that there are no significant differences with the values from the original
PE. As it is going to be described in the next sections the F1 from the diethylamine and
1-butanol solvent could not be tested at the saccharification experiments because after
the mixing with these two solvent the PE was precipitated.
In order to test different concentrations of the fractions and in order to test the effect of
the fractions on samples loaded with TaAA9A and samples loaded with BG the
experiments were repeated. This time the fractions were collected using different
quantities of PE and solvent as it was described in the section 3.4 and the results are
shown in the Figures 4.4.2, 4.4.3 ,4.4.5 and 4.4.7.

49
4.4.1. Ethyl acetate fractions
Figure 4.4.2 Glucose titers after three days reactions. The first triad of columns is the blank
samples while the other three triads have instead of buffer the dissolved residue in buffer from
the LLE using the ethyl acetate solvent. Three dilutions of the fraction were investigated. First
one is the residue after the evaporation of ethyl acetate adding 5,7 m L of buffer and the third
triad is two times dilution with buffer of the first one and last triad is four times diluted.
It can be observed from the Figure 4.4.2 that the ethyl acetate does not have activatory
effect on the enzymes in any of the three dilutions, which is not related with the results
from the trial experiment (Fig 4.4.1), where the ethyl acetate fraction had the highest
increase from all the fractions that have been created from the LLE. Samples with BG
seem to be unaffected from the fraction. However, it can be observed that the more
concentrated the fraction is, the more glucose concentration we get. In representative
samples with the fractions, the pH was tested and it was around 4.9-5.1 (Table 6.3).
Generally, it can be summarized from this that the fraction with higher concentrations
has positive effect to the glucose concentration. Having different results from the trial
00.10.20.30.40.50.60.70.80.9
11.11.21.31.41.51.61.71.81.9
22.12.22.32.42.5
Blank 1x diluted Fraction 2x diluted Fraction 4x diluted Fraction
Glu
cose
co
nce
ntr
atio
n (
g/L)
TaAA9A+BG TaAA9A BG

50
experiments can be explained with the fact that the residue from the ethyl acetate
evaporation (Figure 3.4.i) was not easily dissolved in the buffer. The amount of buffer,
that was chosen for the dissolving of every residue in those experiments was 5.7 μL.
As it was mention at the section 3.4 that number was based on the amount of the fraction
needed for the those experiments and for getting similar but a slightly higher
concentration of the fractions from the trial experiments. However, in the case of the
residue from the ethyl acetate that could not be easily achieved due to the fact that the
dissolving part was not easy to be controlled. Specifically, the residue was mixing the
buffer for over an hour and still there was amount of the residue that it could not be
dissolved in the buffer. So, for the two experiments, it can be assumed that they did not
have similar concentrations of the fraction and in case of the trial experiment the
fraction was more concentrated which explains the higher than the blank glucose
release. That is in line with the results of the Figure 4.4.2 where the more concentrated
fraction is, the more glucose release we get. In literature ethyl acetate is a solvent that
can extract substances such as alkaloids, for example caffeine from coffee (138) or
furanocoumarins from grapefruit juice (132) but there is no information about
extraction from persimmon fruit or juice using this solvent. Some observations from
this solvent were that during the mixing with the PE, no chemical interaction took place
and the color of the residue was dark orange.

51
4.4.2. Diethylamine fractions
Figure 4.4.3. Glucose titers after three days saccharification reactions. The first triad of
columns is the blank samples while the other three triads have instead of buffer the dissolved
residue in buffer from the LLE using the diethylamine solvent. Like the samples the Figure
4.4.2 three concentrations of the fraction were made. For all the samples duplicates were
made.
It can be observed from the Figure 4.4.3. that the fraction that have been created from
the diethylamine solvent, based on its concentration has different effect on TaAA9A.
The fraction does not affect the BG as much as the TaAA9As. For TaAA9A and for
TaAA9A+BG samples, the most concentrated fraction, which are the samples from the
second triad of columns has a clearly inhibitory effect. However, when the fraction gets
two times diluted with buffer the inhibitory seems to not exist anymore. The big
standard deviation that exists in the column loaded with both enzymes is because only
one out of the two samples had a lower glucose concentration than the blank one, while
00.10.20.30.40.50.60.70.80.9
11.11.21.31.41.51.61.71.81.9
22.12.22.32.42.52.62.72.82.9
33.13.23.33.43.5
Blank 1x diluted Fraction 2x diluted Fraction 4x diluted Fraction
Glu
cose
co
nce
ntr
atio
n (
g/L) TaAA9A+BG TaAA9A BG

52
the other one sample of the duplicate had a higher glucose concentration. All TaAA9As
samples seems to be still effected in all concentrations of the fraction. The least
concentrated fraction (last triad of columns) is the one with the clearest activatory effect
to the TaAA9A+BG and TaAA9As samples. Specifically, in that case the increase of
the glucose concentration from the blank samples is 39% which is the highest increase
in all the samples at the saccharification experiments. In representative samples, the pH
was tested and it was around 5.2-5.35 (Table 6.3). Only in case of the most concentrated
fraction was about 5.35 which cannot explain that decrease at the glucose concentration.
Concluded for the diethylamine fraction is that the concentration of it seems to have a
major effect to the TaAA9As. Is also in line with the results from the trial experiment
(Fig 4.4.1) that show that there is an activatory effect. In comparison with the ethyl
acetate fraction the fraction from diethylamine was easily dissolved in buffer. Also, this
time the fraction had a yellow color. Concluded this fraction seems to work both as an
inhibitor and an activator and that could be explained from the fact that the fraction is
still a complex mixture with both activators and inhibitors to TaAA9A, which they act
competitive. It is also important to mention the effect of mixing the PE with
dethylamine. The moment that those two liquids were mixed the PE became much
darker and solidified to some extent, plus heat also was released so the tube become
warmer. So, it seems that there is a chemical interaction between the PE and the
diethylamine. This could be acid-base reactions, which there are exothermic reactions
and they can create solids. The PE is a slightly acid liquid (pH = 4,4-4,5) and the
diethylamine is a strong base chemical (pH= 12,3-12,4) so it is rational for acid-base
reaction to take place when those two liquids are mixed.
To test the activatory effect of the 4 times diluted fractions saccharification experiments
were done this time without gallic acid, which is the electron donor in our experiment,
in order to evaluate if it can still act as an activator. The results are shown in the Figure
4.4.4 and it can be observed that the fraction has a activatory effect to TaAA9A,
however it cannot reach the values of Blanks samples but the activatory. Observing the
figures 4.1.2 and the 4.4.4, which were experiments where we add the PE and the 4x
fraction from diethylamine without the electron donor (gallic acid) seems that the 4
times diluted fraction can activate the TaAA9A more than the PE. It can be seen that
the glucose release in the case of samples loaded with both enzymes is the same in both
figures.

53
Figure 4.4.4. Glucose titers after three days saccharification experiments. The first triad of
columns is blank samples, the second are samples without adding gallic acid (NO G.A) which
is the electron donor for TaAA9A and the last triad are samples adding the 4x times diluted
fraction from diethylamine LLE, which in the Figure 4.4.3 showed the most activatory effect.
For all the samples duplicates were made and the error bars show the standard deviation of
the average.
0
0.1
0.2
0.3
0.4
0.5
0.6
0.7
0.8
0.9
1
1.1
1.2
1.3
1.4
1.5
1.6
1.7
1.8
1.9
2
BLANKS NO G.A NO G.A + 4x fraction
Glu
cose
co
nce
ntr
atio
n (
g/L)
TaAA9A+BG TaAA9A BG

54
4.4.3. 1-Butanol fractions
Figure 4.4.5. Glucose titers after the three days saccharification reactions. The first triad of
columns is the blank samples while the other three triads have instead of buffer the dissolved
residue in buffer from the LLE using the 1-butanol solvent. Like the samples from the figure
4.4.2. three concentrations were made.
It can be observed from the Figure 4.4.5 that the butanol fraction has similar effects
with the diethylamine fractions. However, the effects are not same as the previous case,
for example the increase in the least diluted fraction is not so high as the diethylamine
case. One important difference is that in butanol case the BG is also effected by the
fraction. Briefly the less concentrated the fraction with is the more glucose
concentration but only for to TaAA9A and TaAA9A+BG samples. Observations from
the extraction using this solvent were that the butanol has similar effect when it was
mixed with the PE but in lesser extent. That means after mixing the PE became darker
again and solidified but not as much as in the case of diethylamine and the heat that
released was not too much. Also, the fraction was a dark orange fraction. Columns are
missing from the graph due to the fact that HPLC had weird peaks that did not gave
glucose peaks. That might be explained from remains of butanol in the fraction, since
the fraction had a slightly smell of butanol, which indicates the existence of butanol in
00.10.20.30.40.50.60.70.80.9
11.11.21.31.41.51.61.71.81.9
22.12.22.32.4
Blanks 1x diluted Fraction 2x diluted Fraction 4x diluted Fraction
Glu
cose
co
nce
ntr
atio
n (g
/L)
TaAA9A+BG TaAA9A BG

55
it. For that reason, samples were made adding representative amount of 1-butanol that
might exists still in the fraction. Specifically, the volume of 1-butanol that was mixed
with buffer was 15% of the volume of buffer and the saccharification experiments were
repeated (Figure 4.4.6). It can be observed that there is a decrease in the glucose release
that can explain the decrease in the most concentrated fractions. However different
amounts of 1-butanol should have tested and also it is not certain how much of 1-
butanol remained in the fraction. It is important to mention that the fraction from the 1-
butanol during the storage got precipitated from the buffer and it could not be tested
again for repeats of saccharification experiments the repeat of the LLE using 1-butanol
did not took place due to lack of time. The fractions from this solvent have pH from
5.3-5.2 (Table 6.3).
Figure 4.4.6. Glucose titers after the three days saccharification reactions. The first triad of
columns is the blank samples while the other triad is samples loaded with 1-Butanol with
volume 15% of the volume of buffer. For all the samples duplicates were made.
0
0.2
0.4
0.6
0.8
1
1.2
1.4
1.6
1.8
2
2.2
Blanks 15 % Butanol in buffer
Glu
cose
co
nce
ntr
atio
n (
g/L)
TaAA9A+BG TaAA9 BG

56
4.4.4. Dichloromethane Fractions
Figure 4.4.7. Glucose titers after the three days saccharification reactions. The first triad of
columns is the blank samples while the other three triads have instead of buffer the dissolved
residue in buffer from the LLE using the dichloromethane solvent. Like the samples from the
figure 4.4.2. three concentrations were made. For all the samples duplicates were made.
As it can be observed from the graph, that none of the concentrations of this fraction
had any remarkable difference with the blank samples. Also, all the differences in the
columns are between the error bars so we can exclude any conclusions from them. So,
dichloromethane as a solvent didn’t extract substances which have effect to the
enzymes. It should also be mentioned that the Dichloromethane was the only
chlorinated solvent that was used and seems to be least ineffective from all the solvents.
Also, this solvent can be characterized as the solvent with the least solubility with PE
than the three others, meaning that the solvent could not be easily mixed with the PE
and after mixing it was almost immediately separated. The solubility characteristics of
the solvent appears to be an important in determining its ability to fractionate liquids
and it is being suggested that highly insoluble solvents have less activity at the
extraction (139). The residue after the evaporation of the solvent had a light grey and
orange color. The fractions from this solvent have pH from 4.9-5.1 (Table 6.3).
0
0.1
0.2
0.3
0.4
0.5
0.6
0.7
0.8
0.9
1
1.1
1.2
1.3
1.4
1.5
1.6
1.7
1.8
1.9
2
Blank 1x diluted Fraction 2x diluted Fraction 4x diluted Fraction
Glu
cose
co
nce
ntr
atio
n (
g/L)
TaAA9A+BG
TaAA9A
BG

57
4.5. Effect of the isolated from tannins PE on saccharification by TAAA9A and
BG
As it was described in the section a method for the isolation of tannins in the PE was
used. This method was used in order to evaluate if the PE after being treated with PVPP
will have a different effect on the enzymes. If we observe less inhibitory effect after it
would mean that the tannins are important compound to this inhibition. Briefly the PE
was mixed and incubated with 0,2 g of PVPP for one hour. Then after two rounds of
centrifugation supernatant, which was the treated PE with PVPP was used in the
saccharification experiments like the samples 4,5,6 from the Table 3.1. The results are
given in the Figure 4.5.1 when three PE were tested, one with no treatment with PVPP,
one with treatment and one being centrifugated in order to evaluate if the centrifugation
that took place in the PVPP treatment had an effect on PE.
Figure 4.5.1. Glucose titers after three days saccharification. For all the samples duplicates
were made expect from the Blank ones where triplicates were made and the error bars show
the standard deviation of the average.
0
0.1
0.2
0.3
0.4
0.5
0.6
0.7
0.8
0.9
1
1.1
1.2
1.3
1.4
1.5
1.6
1.7
1.8
Blanks 100x PE 100x centrifugated 100x PE/PVPP
Glu
cose
co
nce
ntr
atio
n (g
/L)
TaAA9A+BG TaAA9A BG

58
It can be observed that with this amount of PVPP and this incubation time that was
tested the difference in the glucose concentration is not significant. Maybe the amount
of tannins that the PVPP binds from the PE are not enough to change the inhibitory
effect on the enzymes or maybe the compounds that the PVPP binds are not the ones
that are creting this inhibitory effect. However, with the same conditions of treatment
the FC showed decrease in the total phenolic content of the treated PE (Figure 4.6.1)
meaning that this method had an effect to the PE. The other amounts of PVPP and the
half an hour incubation time did not have effect either on the enzymes and the glucose
release was the same with blank samples.
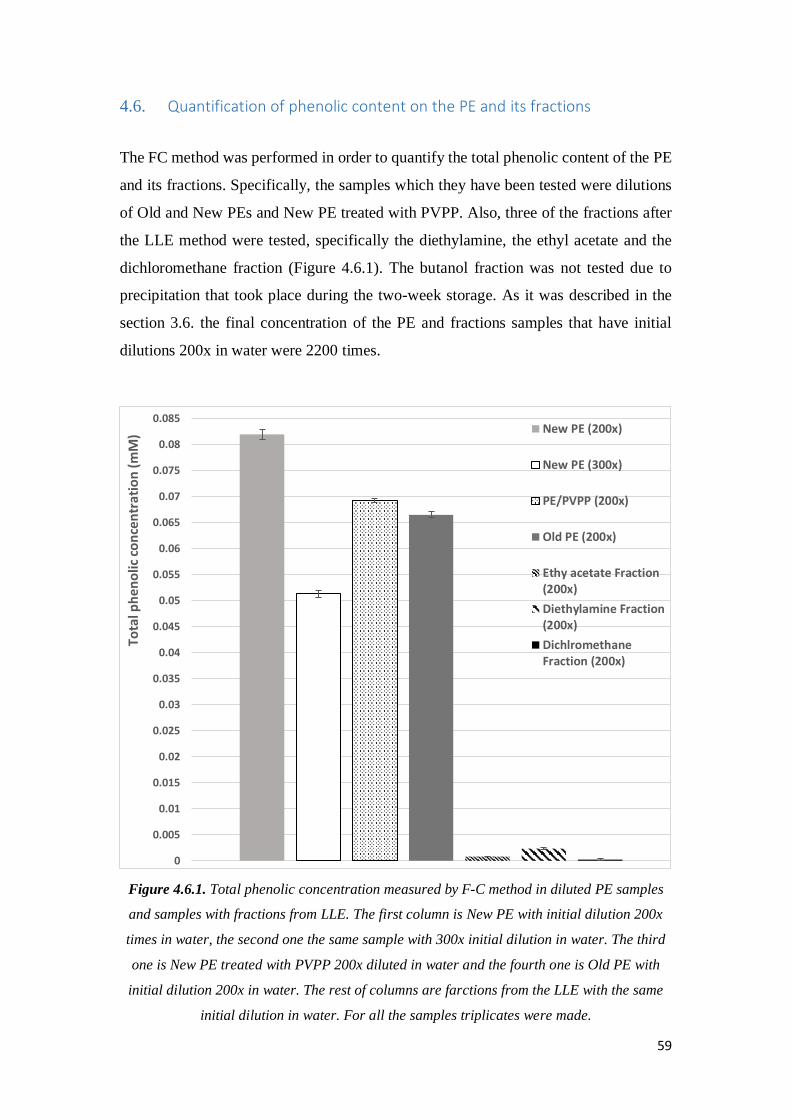
59
4.6. Quantification of phenolic content on the PE and its fractions
The FC method was performed in order to quantify the total phenolic content of the PE
and its fractions. Specifically, the samples which they have been tested were dilutions
of Old and New PEs and New PE treated with PVPP. Also, three of the fractions after
the LLE method were tested, specifically the diethylamine, the ethyl acetate and the
dichloromethane fraction (Figure 4.6.1). The butanol fraction was not tested due to
precipitation that took place during the two-week storage. As it was described in the
section 3.6. the final concentration of the PE and fractions samples that have initial
dilutions 200x in water were 2200 times.
Figure 4.6.1. Total phenolic concentration measured by F-C method in diluted PE samples
and samples with fractions from LLE. The first column is New PE with initial dilution 200x
times in water, the second one the same sample with 300x initial dilution in water. The third
one is New PE treated with PVPP 200x diluted in water and the fourth one is Old PE with
initial dilution 200x in water. The rest of columns are farctions from the LLE with the same
initial dilution in water. For all the samples triplicates were made.
0
0.005
0.01
0.015
0.02
0.025
0.03
0.035
0.04
0.045
0.05
0.055
0.06
0.065
0.07
0.075
0.08
0.085
Tota
l ph
eno
lic c
on
cen
trat
ion
(m
M) New PE (200x)
New PE (300x)
PE/PVPP (200x)
Old PE (200x)
Ethy acetate Fraction(200x)
Diethylamine Fraction(200x)
DichlromethaneFraction (200x)

60
First from the graph it can be observed that there are differences in the total phenolic
content between the New and the Old PE. It was expecting that the old PE it would
have less phenolics, because time of storage has an effect on the total phenolic content.
As it is mentioned in the section 4.1 Klimczak et al (110) have tested the effect of
storage using FC and HPLC method for different storage times and temperatures.
Specifically, in the case of 18oC which is the closest temperature in our case, because
the PE was stored in room temperature, they showed with both methods that after 4
months of storage there is a decrease in the total phenolic content. Interesting results
from the method is the reduction in the total phenolic in case of the PE when is treated
with PVPP. Specifically, we observe a difference of 0,013 mM of concentration, which
could be the isolated tannins since PVPP was used for this reason, which was the
isolation of tannins. This difference is almost half of the difference in the concentration
between the 200x and 300x diluted PE. The fractions that the have been created from
the LLE they do have phenolic compounds. It can be observed that the diethylamine
fraction has the highest concentration and the dichloromethane has the lowest one.
Based on the final concentration of the samples and the values that were measured from
the FC it is possible to quantify the total phenolic content of the PE. Specifically, based
on the values from the two New PE samples (200x, 300x) it was calculated that the PE
has an average value of concentration of total phenolics 174.8 ± 5,52 mM.

61
4.7. Effect on tannic acid on TAAA9A and BG
In order to test the effect of tannins on TaAA9A and BG and evaluate if there is a
different effect on them, tannic acid was added in the saccharification mixtures at
different concentrations. Tannin acid was interesting to be evaluated as an inhibitory
compound due to the fact that the PE had tannin content, which is one potential group
of compounds that have the inhibitory effect on the enzymes. Two different range of
concentrations of tannic acid were tested. In the Figure 4.7.1 results from the first range
of final concentrations of tannic acid are shown.
Figure 4.7.1. Glucose titers after the three days saccharification reaction using Blanks and
samples adding different concentrations of Tannic acid (TA). For all the samples triplicates
were made and the error bars showed the standard deviation of the average.
It can be observed that the tannic acid has a clear inhibitory effect to both enzymes.
However, the effect on the TaAA9A appeared to be more inhibibitory than on BGs.
Interesting is that between the concentrations 0,072 and 0.288 mM the inhibitory effect
on TaAA9A is becoming quite significant and the tannin acid with concentration of
00.10.20.30.40.50.60.70.80.9
11.11.21.31.41.51.61.71.81.9
22.1
Blank 0,072 mM T.A 0,288 mM T.A 0,58 mM T.A 1,2 mM T.A
Glu
cose
co
nce
ntr
atio
n (
g/L)
TaAA9A +BG TaAA9A BG

62
0.288 mM and after almost completely deactivates the TaAA9A. However, their
synergism levels are not deactivating meaning that the TaAA9A can still act with the
BGs but not alone when tannins are existing in the mixture. The concentrations of tannic
acid that were tested were based on the difference at the concentration of the total
phenolics that was observed from the FC method when the PE was treated with PVPP.
When the PE was incubated in a thermomixer with PVPP for one hour, room
temperature and mixing at 14000 rpm had a reduction of phenolic about 0.013 mM
(Figure 4.6.1). From the Figure 4.5.1 it can be seen that when the PE is treated with the
same way with PVPP there is no difference at the glucose release from the non-treated
PE. For that reason, the less concentrated tannic acid that was tested was about 5 times
more concentrated than the difference of the concentration that was measured in the FC
method between the treated and untreated PE with PVPP. So, the range of final
concentrations of tannic that was tested 0.072-1.2 mM. To test which concentration is
the one that has this change in the inhibitory effect on TaAA9A the experiments were
repeated using 3 more concentrations of tannic acid between the 0,072 mM and the
0.288 mM (Figure 4.7.2).
Figure 4.7.2. Glucose titers after the three days saccharification reaction using Blanks and
different concentrations of Tannic acid (T.A). For all the samples triplicates were made and
the error bars showed the standard deviation of the average.
0
0.1
0.2
0.3
0.4
0.5
0.6
0.7
0.8
0.9
1
1.1
1.2
1.3
1.4
1.5
1.6
1.7
1.8
Blanks 0,072 mM T.A 0,1 Mm T.A 0,15 Mm T.A 0,2 Mm T.A
Glu
cose
co
nce
ntr
atio
n (g
/L)
TaAA9A+BG TaAA9A BG

63
It can be observed from the graph that the glucose release from TaAA9A becomes less
than the value of BG samples between 0.072 and 0.1 mM of tannic acid. Like the Figure
4.7.1 it can be seen that tannin acid has more significant inhibitory effect on TaAA9A.
Specifically, at 0.2 mM the TaAA9A they seem to be completely inactivate but BG
produce almost 40% of the glucose than the Blank samples. However still their
synergism seems to be no affected so much as TaAA9A between those concentrations.
Generally, the inhibition that was observed in the Figures it is rational since it is known
that tannins have an inhibitory effect on cellulases (140; 141) . As it has been mentioned
in section 2.8. tannins are a group of complex polyphenolic compounds and one of their
characteristics is that they are able to bind simultaneously at several sites on a protein
surface. This inhibitory effect can be different in different enzymes like in the case of
TaAA9A and BGs and depends on the source and the type of the enzymes (140). Tannic
acid has been used as standard for hydrolysable tannins and it has been shown that it
can affect negatively all the major cellulases, CBHs, EGs and BG and that tannic acid
inhibition seemed to be independent of cellulose types (141). Since BGs and TaAA9A
are quite different protein molecules with differences such as their size and their type
of active site, it is not irrational that tannin acid has different effect on each enzyme.
BGs active site is a pocket or crater type (142) unlike the TaAA9A which has an
extended flat face active site about 40 Å x 30 Å (143). So, it is possible that tannic acid
binds to the active site of TaAA9A and blocking them to bind to several glucose units
in the cellulose chain. Tejirian and Feng Xu (2011) (141) suggest that when tannic acid
was added in cellulase mix the reduction of product release was mainly by inactivation
of endoglucanases. Endoglucanases have cleft or groove shape of actives site which
they are not very different from the shape of LPMOs active site. Their action is also
similar since they both can help cellulase such as CBHs to access cellulose fibers by
producing nicks in between the chain. However, TaAA9A have cooper in their active
unlike endoglucanases and the metal in their active site it is also possible that can
interact with tannins. Tannins and metals interactions can form complex compounds
called chelates (144). Chelation is a type of bonding of ions and molecules to metal ions
and tannins are known molecules that can form chelates with metal ions such as Iron
and Copper (145; 144). So, one possible explanation about the higher inhibition of
TaAA9A than BG, it is that tannic acid is forming chelates with the cooper in the active
site of TaAA9A and leading to inactivation.

64
5. Conclusions
The focus of this project was an investigation of the effect of a PE which comes from
persimmon fruit on TaAA9As with the overall aim to search for modulators for
TaAA9As. The saccharification experiments after three days reaction using PASC as a
substrate showed that the glucose titers decreased when different dilutions of PE were
added in the system, meaning that this PE has an inhibitory effect both to TaAA9As
and BGs. It was observed that the effect was more significant inhibitory on the
TaAA9As than the BGs in all of the dilutions that were tested. It was also observed that
an old purchased PE had less inhibitory effect than a more recently purchased one
meaning that storage time had an effect on PE. The PE was incubated for one hour in
different temperatures, from 70 to 120 to test if the inhibitory compound is a protein
nature compound and if it can be precipitated in the tested temperatures. The results
showed no significant differences in glucose titers from the PE that was stored in room
temperature, meaning that there might be no protein nature inhibitor compound that can
be precipitated in these temperatures and incubation time. Physical treatments of the
PE such as filtration and centrifugation had also no significant differences in the glucose
titers from the non-treated PE which means that the inhibitory effect does not come
from residues or small particles bigger than 0,45 nm.
The LLE as a fractionation method to PE was used and it created 4 different fractions
using ethyl acetate, dichloromethane, diethylamine and 1-butanol as solvents and the
fractions were tested for their effect on TaAA9A and BG. The fraction from
dichloromethane solvent, did not have any effect in the tested conditions so it is not
recommended for extraction of substances from the PE. The ethyl acetate as solvent
created a fraction that in the trial experiments had an activatory effect and the repeat of
the experiments showed that the fraction could not act again like in the trial as an
activator but the concentration of it seem to have an important role. The fraction from
the diethylamine solvent, in the trial experiment showed activatory effect, and when it
was tested again in different concentrations only the least concentrated fraction showed
clear activatory effect, while the other two showed inhibitory effect. That means that
the concentration of this fraction can affect its modulation effect to the TaAA9A
fraction. Also, the fraction with the activatory effect was tested without addition of
gallic acid, which was the electron donor to the experiments, and there was still
65
activation to TaAA9A. Last the 1-Butanol fraction show no clear results but seems like
the fraction of it in least concentration that were tested had activatory effect and in the
most concentrated ones had inhibitory effect. The order of the solvents with fractions
with the most modulatory effect on TaAA9A in those experiments is diethylamine >1-
butanol > ethyl acetate > dichloromethane.
Treatment of PE with PVPP, with the aim of binding tannins from PE, in two different
conditions showed no differences in the glucose titers from the Blank samples. That
means that the content of tannins or phenolics that was bind in the PVPP could not
make a difference in the inhibitory effect. However, with FC method the quantification
of total phenolic content of PE took place and showed that the treatment with PVPP
could reduce the total phenolic content of PE, proving that this method did have an
effect on the total phenolic content of PE. The FC also showed that fractions from the
LLE contain phenolics. Based on the amount of reduction at total phenolic content that
the PVPP treatment create there was an investigation of the inhibitory effect of tannins
to the enzymes using different concentration of tannic acid. Tannin acid was interesting
to be evaluated as an inhibitory compound due to the fact that the PE has tannin content.
The results showed that tannic acid can act as an inhibitor to both enzymes but more
significant to TaAA9A than to BGs. That is also in line with the results from the
dilutions of PE where the PE had more significant inhibitory effect on TaAA9 in more
of the dilutions that were tested. That means that tannins from the PE could be one
potential group of compounds that have inhibitory effect on TaAA9A.
5.1. Future outlook
From this study, the PE that was tested seem to have a higher inhibitory effect on
TaAA9A than BGs making this natural PE interesting for further research for
discovering a modulator for TaAA9A. Having more time for this project something that
is interesting to be searched is what is the type of inhibitor is this PE, which can be
either competitive, uncompetitive, non-competitive or mixed inhibitor. Then it could
be also searched with the same experiments what type of inhibitor is the tannic acid to
TaAA9A and BGs and to compare the results with the PE inhibition and evaluate if the
inhibition type is the same or different in these two cases. More concentrations also of
tannic acid should be tested in order to evaluate where the inhibitory effect starts for
both enzymes. In addition, different group of tannins could be also tested, such as

66
condensed tannins, to those two enzymes in order to test if different group of tannins
has different effect on the enzymes. It is important cellulases which have not been tested
in this project and are used in cellulases mixtures to be tested like endoglucanases and
cellobiohydrolases. Something also interested to be tested is to use methods for
extraction of compounds, such as tannins, from astringent and non-astringent
persimmon fruit. Then the extracts could be tested in saccharification experiments
aiming to evaluate if the extract that comes from the fruit has different effect than the
PE that was used and can it also identify if astringency in fruits plays a role in the
inhibition effect. Having more time, it would be also interested to test the effect from
other liquid plant extracts coming from high tannin content fruits, for example grapes,
combined also with information that can be found in literature about the fruit.
About identification of group of compounds in the PE and in fractions of it, absorption
spectroscopy can be used measure the absorption of radiation, as a function of
frequency or wavelength, due to its interaction with the sample. Due to trials that were
done in this project with this technique in a wavelength range of 300-1000 nm, is
suggested that the wavelength range should be between 1000 and less than 300 for
having bigger range of wavelength. In addition, with the absorption spectroscopy,
Fourier Transformation infrared spectroscopy (FTIR) can be used. It is an analytical
method that has been used for identification and characterization of compounds in
samples, like plant extracts. Interesting fractionation technique for the PE and its
fractions could be the Thin-layer Chromatography (TLC) which is a method for identify
compounds present in a given mixture. Another fractionation technique for the PE that
can be done is the supercritical carbon dioxide extraction, which is based on the
solubility of extracted compounds in carbon dioxide. This method, permits selective
extractions because the solubility of extracted compounds varies with pressure that is
implied. This method that does not use solvents, which means that there is no chemical
interaction with the PE and it is used in food industry so it can be used also for juices.
After fractionation, Gas chromatography–mass spectrometry (GC-MS) is an analytical
method for identification of substances in the fractions or in the PE itself but it might
be quite complex for this method. About the isolation of tannins something that was not
tested in this project was the treatment of PE with other tannin-binding agents like
polyethylene Glycol and PVP, which they might have different effect on isolated
tannins from the PE.

67
6. Appendix
Figure 6.1. Representative HPLC peaks from Blank samples loaded with TaAA9A and BG.
The first peak is glucose and second small peak is xylose which was released always when
BG were in the sample. The third peak is the buffer, which is acetate, and the last peak might
be oligomers that are creating from the hydrolysis process and they were always in the results
in these amounts.
Table 6.1. Some properties of the solvent that they were used in the LLE experiments (146)
Solvents Relative
polarity
Boiling
point
pH Density
(g/mL)
Ethyl acetate 0.228 77 9.2-9.3 0.894
Dichloromethane 0.309 39.8 9.4-9.5 1.326
1-Butanol 0.586 117.6 8.3-8.4 0.81
Diethylamine 0.145 56.3 12.4-12.5 0.706

68
Figure 6.2. Calibration curve using gallic acid as standard for the FC method. Final
concentrations that were chosen are 0 mM, 0.0125 mM, 0.025 mM, 0,05 mM and 0.1 mM.
Table 6.2. pH values for the mixtures of residue and buffer (fractions) made from the LLE
Samples pH Samples pH
Ethyl acetate Fraction 1x 5.3-5.4 1-Butanol Fraction 1x 5.6-5.7
Ethyl acetate Fraction 2x 5.4 1-Butanol Fraction 2x 5.6
Ethyl acetate Fraction 4x 5.4-5.45 1-Butanol Fraction 4x 5.5-5.6
Dichloromethane Fraction 1x 5.4 Diethylamine Fraction 1x 5.7-5.8
Dichloromethane Fraction 2x 5.45-5.5 Diethylamine Fraction 2x 5.7
Dichloromethane Fraction 4x 5.45-5.5 Diethylamine Fraction 4x 5.6-5.65
Figure 6.3. PE after was diluted in buffer, specifically 20x times in both. Right after mixing
New PE to the left, Old PE to the right (i), after some time from mixing, Old PE to the left and
New PE to the right (ii).
y = 21.868x + 0.1496R² = 0.9896
0
0.5
1
1.5
2
2.5
0 0.01 0.02 0.03 0.04 0.05 0.06 0.07 0.08 0.09 0.1
Ab
sorv
ance
(A
BS)
Concentration (mM)

69
Figure 6.4 Glucose titers after three days saccharification experiments adding PE after being
mixed and centrifuged with ethyl acetate and dichloromethane. Values from adding F1 from
ethyl acetate are compared with Blank 1 and 100x PE 1 and F1 from dichloromethane are
compared with Blank 2 and 100x PE 2. For the samples triplicates and duplicates were made
and error bars show the standard deviation of the average.
00.10.20.30.40.50.60.70.80.9
11.11.21.31.41.51.61.71.81.9
22.12.22.32.42.5
Blank 1 100x PE 1 100x PE after
mixed with ethyl
acetate (F1)
Blank 2 100x PE 2 100x PE after
mixed with
dichlormethane
(F1)
TaAA9A+BG TaAA9A BG

70
Table 6.3. pH values from representative samples from the saccharification experiments
before the reaction. After the reaction, the pH was did not changed much.
Number Samples pH values
1 Blank 5.0-5.25
2 Samples with addition of 1000x diluted plant extract 5.1-5.2
3 Samples with addition of 500x diluted plant extract 5.0-5.1
4 Samples with addition of 100x diluted plant extract 5.0-5.25
5 Samples with addition of 50x diluted plant extract 4.9-5.0
6 Samples with addition of 1x Fraction after ethyl acetate LLE 4.9-5.0
7 Samples with addition of 2x Fraction after ethyl acetate LLE 4.9-5.0
8 Samples with addition of 4x Fraction after ethyl acetate LLE 5.0-5.1
9 Samples with addition of 1x Fraction after diethylamine LLE 5.3-5.35
10 Samples with addition of 2x Fraction after diethylamine LLE 5.25-5.3
11 Samples with addition of 4x Fraction after diethylamine LLE 5.2-5.25
12 Samples with addition of 1x Fraction after 1-butanol LLE 5.25-5.3
13 Samples with addition of 2x Fraction after 1-butanol LLE 5.2-5.25
14 Samples with addition of 4x Fraction after 1-butanol LLE 5.2-5.22
15 Samples with addition of 1x Fraction after dichloromethane LLE 5.1-5.2
16 Samples with addition of 2x Fraction after dichloromethane LLE 5.1-5.2
17 Samples with addition of 4x Fraction after dichloromethane LLE 5.1-5.2
18 Samples with addition of 0.36 mM Tannic acid 5.0-5.15
19 Samples with addition of 0.5 mM Tannic acid 5.0-5.1
20 Samples with addition of 0.75 mM Tannic acid 4.95-5.05
21 Samples with addition of 1 mM Tannic acid 4.9-4.95
22 Samples with addition of 1.44 mM Tannic acid 4.9-4.95
23 Samples with addition of 2.9 mM Tannic acid 4.9-4.95
24 Samples with addition of 6 mM Tannic acid 4.85-4.9
25 Samples with addition of 15% in buffer 1-butanol 5.0-5.1

71
7. Acknowledgements
First and the foremost, I would like to offer my sincere gratitude to my master thesis
daily supervisor, Ausra Peciulyte, PhD at Chalmers University, for her being
consistently available whenever I needed her and for her help during my stay in
Chalmers. Her support was catalytic in the completion of my project and I am really
glad that I had her as my supervisor.
I would like to express my warmest thanks and gratitude to Professor Lisbeth Olsson
for accepting my application and giving me the opportunity to do my thesis in Chalmers
University. Then I would like to thank Katja Salomon Johansen, co-supervisor of this
project, for her advises and her guidance throughout the whole period. Also, I wish to
profoundly acknowledge the contribution of my professor at my home university,
Evangelos Topakas, who promoted me as an exchange student. I am also thankful to
the support staff of the Biology and Biological Engineering apartment for their constant
help whenever I needed it.
Last but not the least, I would like to thank with all my heart my family and especially
my parents Nikitas and Eleni for their constant support all these years.
Vasilis Diamadopoulos
16th of July 2017

72
8. References
1. Andrews, Deborah. The circular economy, design thinking and education for
sustainability. Local Economy. 2015, Vol. 30, 3, pp. 305-315.
2. Ghisellini, Patrizia, Catia Cialani, and Sergio Ulgiati. A review on circular economy: the
expected transition to a balanced interplay of environmental and economic systems.
Journal of Cleaner Production. 2016, pp. 11-32.
3. eliademy.com. [Online]
https://eliademy.com/catalog/catalog/product/view/sku/9163e61afe.
4. Scarlat, Nicolae, et al. The role of biomass and bioenergy in a future bioeconomy:
policies and facts. Environmental Development. 2015, Vol. 15, pp. 3-34.
5. Leisola, Matti, et al. Industrial use of enzymes. Oxfrod : Eolss Publishers, 2001.
6. Alberts, Bruce, et al. Essential cell biology. s.l. : Garland Science, 2013.
7. Butterman, Heidi C., and Marco J. Castaldi. Biomass to fuels: impact of reaction medium
and heating rate. Environmental Engineering Science. 2010, pp. 539-555.
8. Demirbas, M. Fatih. Biorefineries for biofuel upgrading: a critical review. Applied
Energy. 2009, Vol. 86, pp. 151-161.
9. Kamm, Birgit, Patrick R. Gruber, and Michael Kamm. Biorefineries-industrial processes
and products. Ullmann's Encyclopedia of Industrial Chemistry. 2006, pp. 659-688.
10. Olsson, Lisbeth, et al. Bioethanol production from lignocellulosic material.
Polysaccharides. s.l. : Marcel Dekker Incorporated, 2004, pp. 957-993.
11. Sun, Ye, and Jiayang Cheng. Hydrolysis of lignocellulosic materials for ethanol
production: a review. Bioresource technology. 2002, Vol. 83, 1, pp. 1-11.
12. Zhang, Y-H. Percival, Michael E. Himmel, and Jonathan R. Mielenz. Outlook for
cellulase improvement: screening and selection strategies. Biotechnology advances. 2006,
Vol. 24, 5, pp. 452-481.
13. Topakas, Evangelos, Gianni Panagiotou, and Paul Christakopoulos. Xylanases:
characteristics, sources, production, and applications. Bioprocessing Technologies in
Biorefinery for Sustainable Production of Fuels, Chemicals, and Polymers. 2013, pp. 147-
166.
14. Reese, Elwyn T., Ralph GH Siu, and Hillel S. Levinson. The biological degradation of
soluble cellulose derivatives and its relationship to the mechanism of cellulose hydrolysis.
Journal of Bacteriology. 4, 1950, Vol. 59, p. 485.
15. Vaaje-Kolstad, Gustav. An oxidative enzyme boosting the enzymatic conversion of
recalcitrant polysaccharides. Science. 2010, Vol. 330, 6001, pp. 219-222.
16. Martínez, Angel T. How to break down crystalline cellulose.How to break down
crystalline cellulose. Science. 2016, Vol. 352, 6289, pp. 1050-1051.

73
17. Harris, Paul V. New enzyme insights drive advances in commercial ethanol production.
Current opinion in chemical biology. 2014, Vol. 19, pp. 162-170.
18. Li, Quanzi. Plant biotechnology for lignocellulosic biofuel production. Plant
biotechnology journal. 9, 2014, Vol. 12, pp. 1174-1192.
19. Ramos, Luiz Pereira. The chemistry involved in the steam treatment of lignocellulosic
materials. Química Nova. 6, 2003, Vol. 26, pp. 863-871.
20. Rubin, Edward M. Genomics of cellulosic biofuels. Nature. August 14, 2008, Vol. 454,
pp. 841-845.
21. Donaldson, Lloyd. Cellulose microfibril aggregates and their size variation with cell wall
type. Wood science and technology. 2007, Vol. 41, 5, p. 443.
22. Potters, G., D. Van Goethem, and F. Schutte. Promising biofuel resources:
lignocellulose and algae. Nature Education. 2010, Vol. 3, 9, p. 14.
23. Klemm, Dieter, et al. Cellulose: fascinating biopolymer and sustainable raw material.
Angewandte Chemie International Edition. 2005, pp. 3358-3393.
24. Updegraff, David M. Semimicro determination of cellulose inbiological materials.
Analytical biochemistry. 1969, pp. 420-424.
25. Wolfenden, Richard, Xiangdong Lu, and Gregory Young. Spontaneous hydrolysis of
glycosides. Journal of the American Chemical Society. 1998, pp. 6814-6815.
26. Mosier, Nathan S., et al. Reaction kinetics, molecular action, and mechanisms of
cellulolytic proteins. Recent Progress in Bioconversion of Lignocellulosics. 1999, pp. 23-40.
27. Brown Jr, R. Malcolm. The biosynthesis of cellulose. Journal of Macromolecular
Science, Part A: Pure and Applied Chemistry. 1996, pp. 1345-1373.
28. Hallac, Bassem B., and Arthur J. Ragauskas. Analyzing cellulose degree of
polymerization and its relevancy to cellulosic ethanol. Biofuels, Bioproducts and
Biorefining. 2011, pp. 215-225.
29. Park, Sunkyu, et al. Cellulose crystallinity index: measurement techniques and their
impact on interpreting cellulase performance. Biotechnology for biofuels. 2010, p. 10.
30. Thygesen, Anders, et al. On the determination of crystallinity and cellulose content in
plant fibres. Cellulose. 2005, p. 563.
31. Andersen, Natalija. Enzymatic hydrolysis of cellulose. Bio Centrum, Technical University
of Denmark. 2007.
32. Wood, Thomas M. Preparation of crystalline, amorphous, and dyed cellulase
substrates. Methods in enzymology. 1988, Vol. 160, pp. 19-25.
33. Schülein, Martin. Enzymatic properties of cellulases from Humicola insolens. Journal of
biotechnology. 1997, pp. 71-81.
34. Andersen, Natalija, et al. Hydrolysis of cellulose using mono-component enzymes
shows synergy during hydrolysis of phosphoric acid swollen cellulose (PASC), but
competition on Avicel. Enzyme and Microbial Technology. 2008, pp. 362-370.

74
35. Zhang, Y-H. Percival, et al. A transition from cellulose swelling to cellulose dissolution
by o-phosphoric acid: evidence from enzymatic hydrolysis and supramolecular structure.
Biomacromolecules. 2, 2006, Vol. 7, pp. 644-648.
36. Sims, Ralph EH. An overview of second generation biofuel technologies. Bioresource
technology. 6, 2010, Vol. 101, pp. 1570-1580.
37. Naik, S. Nꎬ. Production of first and second generation biofuels: a comprehensive
review. Renewable and Sustainable Energy Reviews. 2, 2010, Vol. 14, pp. 578-597.
38. Himmel, Michael E. Biomass recalcitrance: engineering plants and enzymes for biofuels
production. Science. 5813, 2007, Vol. 315, pp. 804-807.
39. Cherubini, Francesco. The biorefinery concept: using biomass instead of oil for
producing energy and chemicals. Energy Conversion and Management. 2010, Vol. 51, pp.
1412-1421.
40. Choudhary, Jairam, Surender Singh, and Lata Nain. Thermotolerant fermenting yeasts
for simultaneous saccharification fermentation of lignocellulosic biomass. Electronic
Journal of Biotechnology. 2016, Vol. 21, pp. 82-92.
41. Nanda, Sonil. Pathways of lignocellulosic biomass conversion to renewable fuels.
Biomass Conversion and Biorefinery. 2, 2014, Vol. 4, pp. 157-191.
42. Jordan, D.B. et al. Plant cell walls to ethanol. Biochemical Journal. 2, 2012, Vol. 442, pp.
241-252.
43. Payne, Christina M. Fungal cellulases. Chemical reviews. 3, 2015, Vol. 115, pp. 1308-
1448.
44. Eijsink, Vincent GH. Towards new enzymes for biofuels: lessons from chitinase
research. Trends in biotechnology. 5, 2008, Vol. 26, pp. 228-235.
45. Reese, E. T. History of the cellulase program at the US Army Natick Development
Center. Biotechnol. Bioeng. Symp. 1976, pp. 9-20.
46. Lynd, Lee R., et al. Microbial cellulose utilization: fundamentals and biotechnology.
Microbiology and molecular biology reviews. 2002, pp. 506-577.
47. Warren, R. A. J. Microbial hydrolysis of polysaccharides. Annual Reviews in
Microbiology. 1996, pp. 183-212.
48. Shoseyov, Oded, Ziv Shani, and Ilan Levy. Carbohydrate binding modules: biochemical
properties and novel applications. Microbiology and Molecular Biology Reviews. 2, 2006,
Vol. 70, pp. 283-295.
49. Guerriero, Gea, et al. Lignocellulosic biomass: Biosynthesis, degradation, and industrial
utilization. Engineering in Life Sciences. 2016, Vol. 16, 1, pp. 1-16.
50. Levasseur, Anthony, et al. Expansion of the enzymatic repertoire of the CAZy database
to integrate auxiliary redox enzymes. Biotechnology for biofuels. 2013, Vol. 6, 1, p. 41.
51. Dutta, Saikat, and Kevin C-W. Wu. Enzymatic breakdown of biomass: enzyme active
sites, immobilization, and biofuel production. Green Chemistry. 2014, Vol. 16, 11, pp.
4615-4626.

75
52. Johansen, Katja Salomon. Lytic Polysaccharide Monooxygenases: The Microbial Power
Tool for Lignocellulose Degradation. Trends in Plant Science. 11, 2016, Vol. 21, pp. 926-936.
53. Eriksson, Karl-Erik, Bert Pettersson, and Ulla Westermark. Oxidation: an important
enzyme reaction in fungal degradation of cellulose. FEBS letters. 1974, Vol. 49, 2, pp. 282-
285.
54. Merino, Sandra, and Joel Cherry. Progress and challenges in enzyme development for
biomass utilization. Biofuels. 2007, pp. 95-120.
55. Vaaje-Kolstad, Gustav, et al. An oxidative enzyme boosting the enzymatic conversion
of recalcitrant polysaccharides. Science. 2010, Vol. 330, 6001, pp. 219-222.
56. Quinlan, R. Jason, et al. Insights into the oxidative degradation of cellulose by a copper
metalloenzyme that exploits biomass components. Proceedings of the National Academy
of Sciences. 37, 2011, Vol. 108, pp. 15079-15084.
57. Levasseur, A., Drula, E., Lombard, V., Coutinho, P. M. & Henrissat, B. Expansion of the
enzymatic repertoire of the CAZy database. Expansion of the enzymatic repertoire of the
CAZy database to integrate auxiliary redox enzymes. Biotechnology for biofuels. 1, 2013,
Vol. 6, p. 41.
58. Busk, Peter K., and Lene Lange. Classification of fungal and bacterial lytic
polysaccharide monooxygenases. BMC genomics. 1, 2015, Vol. 16, p. 368.
59. Hemsworth, Glyn R., et al. Discovery and characterization of a new family of lytic
polysaccharide monooxygenases. Nature chemical biology. 2, 2014, Vol. 10, pp. 122-126.
60. Leggio, Leila Lo. Structure and boosting activity of a starch-degrading lytic
polysaccharide monooxygenase. Nature communications. January 22, 2015.
61. Agger, Jane W., et al. Discovery of LPMO activity on hemicelluloses shows the
importance of oxidative processes in plant cell wall degradation. Proceedings of the
National Academy of Sciences. 2014, Vol. 111, 17, pp. 6287-6292.
62. Kohler, Annegret. Convergent losses of decay mechanisms and rapid turnover of
symbiosis genes in mycorrhizal mutualists. Nature genetics. 4, 2015, Vol. 47, pp. 410-415.
63. Chiu, Elaine. Structural basis for the enhancement of virulence by viral spindles and
their in vivo crystallization. Proceedings of the National Academy of Sciences. 1, 2015, Vol.
112, pp. 3973-3978.
64. Cannella, David, et al. Light-driven oxidation of polysaccharides by photosynthetic
pigments and a metalloenzyme. Nature communications. 2016, Vol. 7, p. 11134.
65. Gudmundsson, Mikael, et al. Structural and electronic snapshots during the transition
from a Cu (II) to Cu (I) metal center of a lytic polysaccharide monooxygenase by X-ray
photoreduction. Journal of Biological Chemistry. 2014, Vol. 289, 27, pp. 18782-18792.
66. Fushinobu, Shinya. Metalloproteins: a new face for biomass breakdown. Nature
chemical biology. Vol. 10, 2, pp. 88-89.
67. Xiros, Charilaos, et al. Toward a sustainable biorefinery using high‐gravity technology.
Biofuels, Bioproducts and Biorefining. 2017, Vol. 11, 1, pp. 15-27.

76
68. Hayyan, Maan, Mohd Ali Hashim, and Inas M. AlNashef. Superoxide ion: generation
and chemical implications. Chemical reviews. 2016, Vol. 116, 5, pp. 3029-3085.
69. Faure, Audrey M., Julia Werder, and Laura Nyström. Reactive oxygen species
responsible for beta-glucan degradation. Food chemistry. 2013, Vol. 141, 1, pp. 589-596.
70. Xu F., Sweeney M., Quinlan J., Johansen K.S. Aqueous composition useful for degrading
or converting a cellulosic material, producing a fermentation product, and fermenting a
cellulosic material comprises a polypeptide having cellulolytic enhancing activity and an
organic compound. 2012.
71. Kracher, Daniel, et al. Extracellular electron transfer systems fuel cellulose oxidative
degradation. Science. 2016, Vol. 352, 6289, pp. 1098-1101.
72. Langston, James A., et al. Oxidoreductive cellulose depolymerization by the enzymes
cellobiose dehydrogenase and glycoside hydrolase 61. Applied and environmental
microbiology. 2011, Vol. 77, 19, pp. 7007-7015.
73. Phillips, Christopher M., et al. Cellobiose dehydrogenase and a copper-dependent
polysaccharide monooxygenase potentiate cellulose degradation by Neurospora crassa.
ACS chemical biology. 2011, Vol. 6, 12, pp. 1399-1406.
74. Henriksson, Gunnar, Gunnar Johansson, and Göran Pettersson. A critical review of
cellobiose dehydrogenases. Journal of Biotechnology. 2000, Vol. 78, 2, pp. 93-113.
75. Tan, Tien-Chye, et al. Structural basis for cellobiose dehydrogenase action during
oxidative cellulose degradation. Nature communications. 2015, Vol. 6, p. 7542.
76. Rodríguez-Zúñiga, Ursula Fabiola, et al. Lignocellulose pretreatment technologies
affect the level of enzymatic cellulose oxidation by LPMO. Green Chemistry. 2015, Vol. 17,
5, pp. 2896-2903.
77. Lopes, Mateus Schreiner Garcez. Engineering biological systems toward a sustainable
bioeconomy. Journal of industrial microbiology & biotechnology. 2015, Vol. 42, 6, pp. 813-
838.
78. Väljamäe, Priit, et al. The initial kinetics of hydrolysis by cellobiohydrolases I and II is
consistent with a cellulose surface− erosion model. The FEBS Journal. 1998, Vol. 253, 2.
79. Himmel, Michael E., et al. Biomass recalcitrance: engineering plants and enzymes for
biofuels production. Science. 5813, 2007, Vol. 315, pp. 804-807.
80. Horn, Svein Jarle, et al. Novel enzymes for the degradation of cellulose. Biotechnology
for biofuels. 2012, Vol. 5, 1, p. 45.
81. Harris, Paul V., et al. Stimulation of lignocellulosic biomass hydrolysis by proteins of
glycoside hydrolase family 61: structure and function of a large, enigmatic family.
Biochemistry. 2010, Vol. 49, 15, pp. 3305-3316.
82. Beeson, William T., et al. Oxidative cleavage of cellulose by fungal copper-dependent
polysaccharide monooxygenases. Journal of the American Chemical Society. 2011, Vol.
134, 2, pp. 890-892.

77
83. The application of enzymes in industry. Godfrey, T., and S. West. New York : s.n., 1996,
The Nature Press, New York, p. 512.
84. Klyosov, Anatole A. Trends in biochemistry and enzymology of cellulose degradation.
Biochemistry. 1990, Vol. 29, 47, pp. 10577-10585.
85. Eriksson, Torny, Johan Börjesson, and Folke Tjerneld. Mechanism of surfactant effect in
enzymatic hydrolysis of lignocellulose. Enzyme and Microbial Technology. 2002, Vol. 31, 3,
p. 353+364.
86. Tomme, Peter, et al. Studies of the cellulolytic system of Trichoderma reesei QM 9414.
The FEBS Journal. 1988, Vol. 170, 3, pp. 575-581.
87. Huang, Xiaolin, and Michael H. Penner. Apparent substrate inhibition of the
Trichoderma reesei cellulase system. Journal of Agricultural and Food Chemistry. 1991,
Vol. 39, 11, pp. 2096-2100.
88. Zhao, Yue, et al. Mechanism of cellobiose inhibition in cellulose hydrolysis by
cellobiohydrolase. Science in China Series C: Life Sciences. 2004, Vol. 47, 1, pp. 18-24.
89. Holtzapple, Mark, et al. Inhibition of Trichoderma reesei cellulase by sugars and
solvents. Biotechnology and Bioengineering. 1990, Vol. 36, 3, pp. 257-287.
90. Xiros, Charilaos, Evangelos Topakas, and Paul Christakopoulos. Hydrolysis and
fermentation for cellulosic ethanol production. Wiley Interdisciplinary Reviews: Energy
and Environment. 2013, Vol. 2, 6, pp. 633-654.
91. Wi, Seung Gon, et al. Lignocellulose conversion for biofuel: a new pretreatment greatly
improves downstream biocatalytic hydrolysis of various lignocellulosic materials.
Biotechnology for biofuels. 2015, Vol. 8, 1, p. 228.
92. Penner, Michael H., and Ean-Tun Liaw. Kinetic consequences of high ratios of substrate
to enzyme saccharification systems based on Trichoderma cellulase. Enzymatic Conversion
of Biomass for Fuels Production. 1994, pp. 363-371.
93. Converse, A. O., H. Ooshima, and D. S. Burns. Kinetics of enzymatic hydrolysis of
lignocellulosic materials based on surface area of cellulose accessible to enzyme and
enzyme adsorption on lignin and cellulose. 1990. Vol. 24, 1, pp. 67-73.
94. Müller, Eckart, et al. Liquid–liquid extraction. s.l. : Ullmann's Encyclopedia of Industrial
Chemistry , 1985.
95. King, C. Judson. Separation Processes. s.l. : Courier Corporation, 2013.
96. Rydberg, Jan, ed. Solvent extraction principles and practice, revised and expanded. s.l. :
CRC Press, 2004.
97. Sherwood, Thomas, and James Wei. Interfacial phenomena in liquid extraction.
Industrial & Engineering Chemistry. 1957, Vol. 49, 6, pp. 1030-1034.
98. Cruz, Jose M. Solvent extraction of hemicellulosic wood hydrolysates: a procedure
useful for obtaining both detoxified fermentation media and polyphenols with antioxidant
activity. Food Chemistry. 2, 1999, Vol. 67, pp. 147-153.

78
99. Mehran, Mehrzad F., R. A. Slifker, and W. J. Cooper. Mehran, Mehrzad F., R. A. Slifker,
and W. J. Cooper. Journal of chromatographic science. 1984, Vol. 22, 6, pp. 241-243.
100. Lo, T. C. Handbook of separations techniques for chemical engineers. New York :
McGraw-Hill, 1996.
101. Seader, Junior D., Ernest J. Henley, and D. Keith Roper. Separation process principles.
1998.
102. Venskutonis, P. R., G. Miliauskas, and B. Sivik. Extraction and Fractionation of
Bioactive Compounds from Aromatic Plants. ournal of Liquid Chromatography & Related
Technology. 2009, Vol. 25, p. 317.
103. Bray, Walter J., and Catherine Humphries. Solvent fractionation of leaf juice to
prepare green and white protein products. Journal of the Science of Food and Agriculture.
1978, Vol. 29, 10, pp. 839-846.
104. Lundquist, Knut, Brita Ohlsson, and Rune Simonson. Isolation of lignin by means of
liquid-liquid extraction. Svensk Papperstidning. Vol. 80, 5, pp. 143-144.
105. Singleton, V. L., and Joseph A. Rossi. Colorimetry of total phenolics with
phosphomolybdic-phosphotungstic acid reagents. American journal of Enology and
Viticulture. 3, 1965, Vol. 16, pp. 144-158.
106. Ainsworth, Elizabeth A., and Kelly M. Gillespie. Estimation of total phenolic content
and other oxidation substrates in plant tissues using Folin–Ciocalteu reagent. Nature
protocols. 4, 2007, Vol. 2, pp. 875-877.
107. Singleton, Vernon L., Rudolf Orthofer, and Rosa M. Lamuela-Raventós. Analysis of
total phenols and other oxidation substrates and antioxidants by means of folin-ciocalteu
reagent. Methods in enzymology. 1999, Vol. 299, pp. 152-178.
108. Prior, Ronald L., Xianli Wu, and Karen Schaich. Standardized methods for the
determination of antioxidant capacity and phenolics in foods and dietary supplements.
Journal of agricultural and food chemistry. 10, 2005, Vol. 53, pp. 4290-4302.
109. Schieber, Andreas, Petra Keller, and Reinhold Carle. Determination of phenolic acids
and flavonoids of apple and pear by high-performance liquid chromatography. Journal of
Chromatography A. 2001, Vol. 910, 2, pp. 265-273.
110. Klimczak, Inga, et al. Effect of storage on the content of polyphenols, vitamin C and
the antioxidant activity of orange juices. Journal of Food Composition and Analysis. 3,
2007, Vol. 20, pp. 313-322.
111. Makkar, Harinder PS, et al. Gravimetric determination of tannins and their
correlations with chemical and protein precipitation methods. Journal of the Science of
Food and Agriculture. 2, 1993, Vol. 61, pp. 161-165.
112. Cieslak, Adam, et al. Effects of tannins source (Vaccinium vitis idaea L.) on rumen
microbial fermentation in vivo. Animal feed science and technology. 2, 2012, Vol. 176, pp.
102-106.
113. Joslyn, M. A., and Judith L. Goldstein. Astringency of fruits and fruit products in
relation to phenolic content. Advances in food research. 1964, Vol. 13, pp. 179-217.

79
114. Makkar, Harinder PS. Quantification of tannins in tree and shrub foliage: a laboratory
manual. s.l. : Springer Science & Business Media,, 2003.
115. Mullins, J. T., and J. H. Lee. Interactions of tannins with enzymes: a potential role in
the reduced rate of ethanol fermentation from high-tannin biomass. Biomass and
Bioenergy. 1991, Vol. 1, 6, pp. 355-361.
116. Goldstein, Judith L., and T. Swain. The inhibition of enzymes by tannins.
Phytochemistry. 1965, Vol. 4, 1, pp. 185-192.
117. Kawamoto, Haruo, Kayo Mizutani, and Fumiaki Nakatsubo. Binding nature and
denaturation of protein during interaction with galloylglucose. Phytochemistry. 1997, Vol.
46, 3, pp. 473-478.
118. Ximenes, Eduardo, et al. Deactivation of cellulases by phenols. Enzyme and microbial
technology. 2010, Vol. 48, 1, pp. 54-60.
119. Andersen, R. A., and J. A. Sowers. Optimum conditions for bonding of plant phenols
to insoluble polyvinylpyrrolidone. Phytochemistry. 2, 1968, Vol. 7, pp. 293-301.
120. Doner, Landis W., Guillaume Becard, and Peter L. Irwin. Binding of flavonoids by
polyvinylpolypyrrolidone. ournal of Agricultural and Food Chemistry. 5, 1993, Vol. 41, pp.
753-757.
121. Lisanti, Maria Tiziana, et al. Treatment by fining agents of red wine affected by
phenolic off-odour. European Food Research and Technology. 2017, Vol. 243, 3, pp. 501-
510.
122. Pérez-Lamela, C., et al. Influence of grape variety, vine system and enological
treatments on the colour stability of young red wines. Food Chemistry. 2007, Vol. 101, 2,
pp. 601-606.
123. Makkar, H. P. S., M. Blümmel, and K. Becker. Formation of complexes between
polyvinyl pyrrolidones or polyethylene glycols and tannins, and their implication in gas
production and true digestibility in in vitro techniques. British Journal of Nutrition. 06,
1965, Vol. 73, pp. 897-913.
124. Glenn, J. L., et al. Use of insoluble polyvinylpyrrolidone for purification of plant
extracts and chromatography of plant hormones. Phytochemistry. 1, 1972, Vol. 11, pp.
345-351.
125. Gülçin, İlhami, et al. Radical scavenging and antioxidant activity of tannic acid.
Arabian Journal of Chemistry. 2010, Vol. 3, 1, pp. 43-53.
126. Mandels, M. a. E. T. R. Inhibition of Cellulases. Annual review of Phytopathology.
1965, Vol. 3, pp. 85-102.
127. Cseke, Leland J., et al. Natural products from plants. s.l. : CRC press, 2016.
128. Taira, S. Astringency in persimmon. Fruit analysis. s.l. : Springer Berlin Heidelberg,
1996, pp. 97-110.

80
129. Oh, Eun Kyoung, Youngsook Ahn, and Oran Kwon. Persimmon Tannin Regulates Gene
Expressions Important for Lipogenesis And Cholesterol Efflux in HepG2 Cells. The FASEB
Journal. 1 Supplement, 2017, Vol. 31, pp. lb218-lb218.
130. B. R. Scott, H. Z. Huang, J. Frickman, et al. Catalase improves saccharification of
lignocellulose by reducing lytic polysaccharide monooxygenase-associated enzyme
inactivation. Biotechnology letters. 2016, Vol. 38, 3, pp. 425-434.
131. Westereng, Bjørge, et al. Efficient separation of oxidized cello-oligosaccharides
generated by cellulose degrading lytic polysaccharide monooxygenases. Journal of
Chromatography A. 2013, Vol. 1271, 1, pp. 144-152.
132. Takanaga, Hitomi, et al. Inhibition of vinblastine efflux mediated by P-glycoprotein by
grapefruit juice components in caco-2 cells. Biological and Pharmaceutical Bulletin. 10,
1998, Vol. 21, pp. 1062-1066.
133. Karger, Barry L. HPLC: Early and Recent Perspectives. Journal of Chemical Education.
1, 1997, Vol. 74, p. 45.
134. Kanzaki, Shinya, et al. Identification of molecular markers linked to the trait of natural
astringency loss of Japanese persimmon (Diospyros kaki) fruit. ournal of the American
Society for Horticultural Science. 2001, Vol. 126, 1, pp. 51-55.
135. Kameda, Kenji, et al. Inhibitory effects of various flavonoids isolated from leaves of
persimmon on angiotensin-converting enzyme activity. Journal of Natural Products. 1987,
Vol. 50, 4, pp. 680-683.
136. Gamble, Gary R., et al. Phenolic constituents in flax bast tissue and inhibition of
cellulase and pectinase. Biotechnology letters. 2000, Vol. 22, 9, pp. 741-746.
137. Gorinstein, Shela, et al. Fluorometric analysis of phenolics in persimmons. Bioscience,
biotechnology, and biochemistry. 1994, Vol. 58, 6, pp. 1087-1092.
138. Weigel, Stefan, et al. Determination of selected pharmaceuticals and caffeine in
sewage and seawater from Tromsø/Norway with emphasis on ibuprofen and its
metabolites. Chemosphere. 2004, Vol. 56, 2, pp. 583-592.
139. Hove, E. L., and R. W. Bailey. Towards a leaf protein concentrate industry in New
Zealand (A memorial to Dr Russell M. Allison). New Zealand Journal of Experimental
Agriculture. 1975, Vol. 3, 3, pp. 193-198.
140. Ximenes, Eduardo, et al. Deactivation of cellulases by phenols. Enzyme and microbial
technology. 2010, Vol. 48, 1, pp. 54-60.
141. Tejirian, Ani, and Feng Xu. Inhibition of enzymatic cellulolysis by phenolic compounds.
Enzyme and microbial technology. 2011, Vol. 48, 3, pp. 239-247.
142. Davies, Gideon, and Bernard Henrissat. Structures and mechanisms of glycosyl
hydrolases. Structure. 1995, Vol. 3, 9, pp. 853-859.
143. Hemsworth, Glyn R., Gideon J. Davies, and Paul H. Walton. Recent insights into
copper-containing lytic polysaccharide mono-oxygenases. Current opinion in structural
biology. 2013, Vol. 23, 5, pp. 660-668.

81
144. Cruz, Boris H., et al. Multivariate curve resolution of polarographic data applied to the
study of the copper-binding ability of tannic acid. Analytica chimica acta. 2000, Vol. 424, 2,
pp. 203-209.
145. Karamać, Magdalena. Chelation of Cu (II), Zn (II), and Fe (II) by tannin constituents of
selected edible nuts. International journal of molecular sciences. 2009, Vol. 10, 12, pp.
5485-5497.
146. [Online] https://sites.google.com/site/miller00828/in/solvent-polarity-table.
147. Martin, Marshall A. First generation biofuels compete. New biotechnology. 2010, Vol.
27, pp. 596-608.
148. Singhania, Reeta Rani, et al. Genetic modification: a tool for enhancing beta-
glucosidase production for biofuel application. Bioresource Technology . 2017.
149. Vinson, Joe A., et al. Phenol antioxidant quantity and quality in foods: fruits. Journal
of Agricultural and Food Chemistry. 2001, Vol. 49, 11, pp. 5315-5321.