modularity in the design of complex engineering - people hbs
TRANSCRIPT

Copyright © Carliss Y. Baldwin and Kim B. Clark, January 2004.
Working papers are in draft form. This working paper is distributed for purposes of comment and discussion only. Itmay not be reproduced without permission of the copyright holder. Copies of working papers are available from the author.
Modularity in the Design ofComplex EngineeringSystems
Carliss Y. BaldwinKim B. Clark
January, 2004
Our thanks to Datta Kulkarni and Robin Stevenson for many conversations that have informed our workover the past several years, as well as comments and suggestions that greatly improved this paper.Thanks also to Barbara Feinberg, who over many years and countless discussions helped us to developand refine our ideas.An earlier verion of this talk was prepared as the keynote address for the Opening Conference of theResearch Institute of Economy, Trade and Industry (RIETI), “Modularity—Impacts to Japan’s Industry,”Tokyo, Japan, July 12-13, 2001. Our thanks to the sponsors and participants of the conference, especiallyMasahiko Aoki and Sozaburo Okamatsu, Nobuo Ikeda, Takahiro Fujimoto, Hiroyuki Chuma, JiroKokuryo, Noriyuki Yanagawa, Nobuo Okubo, Shuzo Fujimura, Hiroshi Hashimoto, Hiroshi Kuwahara,and Keiichi Enoki for extremely stimulating discussion and pertinent critiques.Finally we would like to thank Sarah Woolverton, Joanne Lim and James Schorr for their assistance incompiling our industry database.We alone are responsible for errors, oversights and faulty reasoning.

Modularity in the Design of Complex Engineering Systems © Carliss Y. Baldwin and Kim B. Clark, 2004
1
Introduction
In the last decade, the concept of modularity has caught the attention of engineers, management
researchers and corporate strategists in a number of industries. When a product or process is
“modularized,” the elements of its design are split up and assigned to modules according to a formal
architecture or plan. From an engineering perspective, a modularization generally has three purposes:
• To make complexity manageable;• To enable parallel work; and• To accommodate future uncertainty.
Modularity accommodates uncertainty because the particular elements of a modular design may be
changed after the fact and in unforeseen ways as long as the design rules are obeyed. Thus, within a
modular architecture, new module designs may be substituted for older ones easily and at low cost.
This paper will make three basic points. First, we will show that modularity is a financial force that
can change the structure of an industry. Then, we will explore the value and costs that are associated with
constructing and exploiting a modular design. Finally we will examine the ways in which modularity
shapes organizations and the risks that it poses for particular firms.1
The Financial Power of Modularity
To demonstrate the financial power of modularity, let us begin by looking at some data from the
computer industry. Figure 1 is a graph of the market values (in 2002 constant US dollars) of substantially
all the U.S. based public corporations in the computer industry from 1950 to 2002. The firms are
aggregated into sixteen subsectors by primary SIC code. The SIC codes included in the database and their
definitions are listed in Table 1. IBM, Intel and Microsoft are shown separately.
1 Some of the arguments and figures in this paper are taken from Baldwin and Clark, 2000. The figures are reprintedby permission.

Modularity in the Design of Complex Engineering Systems © Carliss Y. Baldwin and Kim B. Clark, 2004
2
Figure 1The Market Value of the U. S. Computer IndustryBy sector, 1950-2002 in constant 2002 US dollars
Table 1SIC Codes Included in the Database
SICCode Category Definition Start Date (1)
3570 Computer and Office Equipment 19603670 Electronic Components and Accessories 19603674 Semiconductors and Related Devices 19603577 Computer Peripheral Devices, n.e.c. 19623678 Electronic Connectors 19657374 Computer Processing, Data Preparation and Processing 19683571 Electronic Computers 19703575 Computer Terminals 19707373 Computer Integrated Systems Design 19703572 Computer Storage Devices 19717372 Prepackaged Software (2) 19733576 Computer Communication Equipment 19743672 Printed Circuit Boards 19747370 Computer Programming, Data Processing, and Other
Services1974
7371 Computer Programming Services 19747377 Computer Leasing 1974
(1) Start date is the first year in which six or more are present in the category.(2) This category had six firms in 1971, dipped to five in 1972, and back to
six in 1973.
5054
5862
6670
7478
8286
9094
9802
7377
7374
7373
7372
ex
Mic
roso
ft
Mic
roso
ft
7371
7370
3678
3674
ex
Inte
l
Inte
l
3672
3670
3577
3576
3575
3572
3571
3570
ex
IBMIBM
0
100
200
300
400
500
600
700
800$
billi
on

Modularity in the Design of Complex Engineering Systems © Carliss Y. Baldwin and Kim B. Clark, 2004
3
Figure 1 tells a story of industry evolution that runs counter to conventional wisdom. In
economics the dominant theories of industry evolution describe a process of pre-emptive investment by
large, well-capitalized firms, leading to stable market structures and high levels of concentration over
long periods of time.2 These theories are backed up by a great deal of supporting empirical evidence
going back to the late 19th Century. The data in Figure 1, by contrast, show that while IBM dominated the
industry in the 1950s and 1960s, in the 1970s and 1980s the computer industry “got away” from IBM.
(IBM’s market value is the blue “mountain range” at the far left of the chart.) In 1969, 71% of the market
value of the computer industry was tied up in IBM stock. By 2002, IBM was no longer dominant, and the
largest firm (Microsoft) accounted for less than 20% of the total value of the industry.
Underlying Figure 1 is a pattern of extreme turbulence at the level of firms. The entire database
spanning the years 1950 to 2002 contains about 2,700 firms. Of these, only about 1,100 survived in 2002.
Thus around 1,600 or 60% of the firms that entered the computer industry over five decades no longer
exist: they went bankrupt, were acquired, or moved out of the industry. Not surprisingly (for those who
lived through it), much of this turnover occurred between 1997 and 2002, the years of the Internet Bubble
and Crash. Around 1,200 firms entered during these six years, while 1,100 failed or were acquired.
The figure also shows that market values were initially concentrated in a few firms, but are now
spread out over across sixteen industrial categories. Whole industries have come and gone. For example,
the original computer category, SIC 3570, “Office and Computer Equipment”, once included firms like
Digital Equipment Corporation, Sperry Corporation, Data General and NCR, as well as IBM. This
category has virtually disappeared: IBM has been reclassified into SIC 7370, “Computer Programming
and Data Processing,” and the other firms mentioned have failed or been acquired. By 2002, Hewlett
Packard was the only firm of any size remaining in this once-pre-eminent category. Conversely, in 1970,
2 The original theory of pre-emptive investment leading to industry concentration, with supporting historicalevidence, was put forward by Alfred Chandler (1962, 1977). A complementary theory of concentration following theemergence of a “dominant design” was put forward by William Abernathy and James Utterback (1978). Modernformulations of these theories and some large-scale empirical tests have been developed by John Sutton(1992) andSteven Klepper (1996). Oliver Williamson (1985, Ch. 11) has interpreted the structures of modern corporations(unified and multi-divisional) as responses to potential opportunism (the hazards of market contracting). It is ourposition that the basic “task structures” and the economic incentives of modular design (and production) systems aredifferent from the task structures and incentives of classic large-volume, high-flow-through production anddistribution systems. Therefore the organizational forms that arise to coordinate modular design (and production)may not ressemble the classic structures of the modern corporation.
Modularity in the Design of Complex Engineering Systems © Carliss Y. Baldwin and Kim B. Clark, 2004
4
SIC 7372, “Packaged Software,” included only 7 firms with a combined market capitalization of just over
$1 billion. In 2002, this category had grown to 408 firms with a combined market cap of almost half a
trillion dollars ($490 billion).
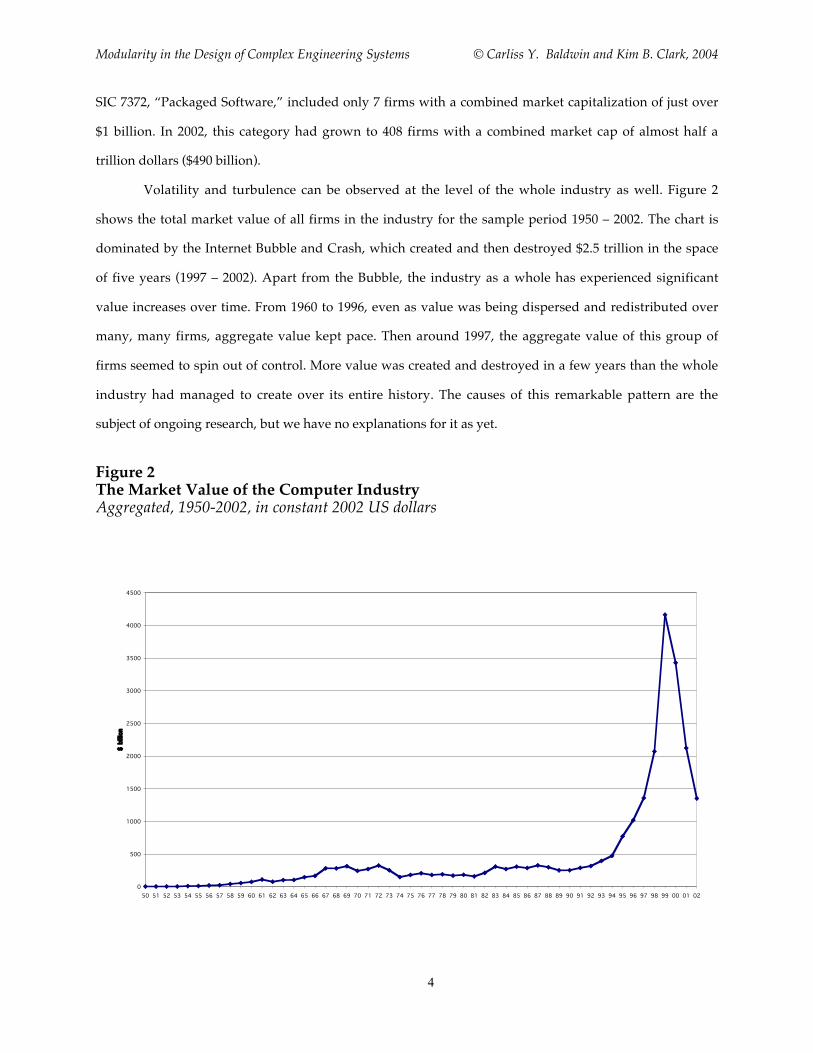
Volatility and turbulence can be observed at the level of the whole industry as well. Figure 2
shows the total market value of all firms in the industry for the sample period 1950 – 2002. The chart is
dominated by the Internet Bubble and Crash, which created and then destroyed $2.5 trillion in the space
of five years (1997 – 2002). Apart from the Bubble, the industry as a whole has experienced significant
value increases over time. From 1960 to 1996, even as value was being dispersed and redistributed over
many, many firms, aggregate value kept pace. Then around 1997, the aggregate value of this group of
firms seemed to spin out of control. More value was created and destroyed in a few years than the whole
industry had managed to create over its entire history. The causes of this remarkable pattern are the
subject of ongoing research, but we have no explanations for it as yet.
Figure 2The Market Value of the Computer IndustryAggregated, 1950-2002, in constant 2002 US dollars
0
500
1000
1500
2000
2500
3000
3500
4000
4500
50 51 52 53 54 55 56 57 58 59 60 61 62 63 64 65 66 67 68 69 70 71 72 73 74 75 76 77 78 79 80 81 82 83 84 85 86 87 88 89 90 91 92 93 94 95 96 97 98 99 00 01 02
$ bi
llion

Modularity in the Design of Complex Engineering Systems © Carliss Y. Baldwin and Kim B. Clark, 2004
5
In summary, the computer industry presents us with a pattern of industry evolution involving
more firms, more products, and (mostly) increasing value created over time. As a result of this pattern,
the computer industry today consists of a large cluster of over 1,000 firms, no one of which is very large
relative to the whole. In addition, the total market value of the industry is now spread widely but very
unevenly across the sixteen sub-industries. (See Figure 3.) We contend that modularity in the design of
complex computer systems is what allowed this creation of value, the dispersion of value across so many
firms, and finally new concentrations of value to take place. We will expand on this argument in the
sections that follow.
Figure 3The Distribution of Market Value in the U. S. Computer Industry as of 2002By sector, in constant 2002 US dollars
$133
$49
$86
$26
$0
$110
$16$5
$10
$102
$138
$8
$75
$1
$293
$197
$28
$76
$0$0
$50
$100
$150
$200
$250
$300
IBM
3570
ex IB
M35
7135
7235
7535
7635
7736
7036
72 Intel
3674
ex In
tel36
7873
7073
71
Microso
ft
7372
ex M
icroso
ft73
7373
7473
77
$ b
illio
n

Modularity in the Design of Complex Engineering Systems © Carliss Y. Baldwin and Kim B. Clark, 2004
6
The Modularity of Computer Designs
Modularity-in-design is one of the things that has caused the computer industry to evolve to its
present form. In brief, modularity in computer designs was first envisioned by pioneering computer
scientists like Maurice Wilkes in the 1950s. Later the goal of a modular architecture was realized by
architects like Fred Brook and Gerrit Blaauw, Gordon Bell and Allen Newell, and Carver Mead and Lynn
Conway in the 1960s and 1970s.3 Modular architectures in turn enabled the computer industry to evolve
to its present form, which we call a “modular cluster”.
The computer industry became a cluster in approximately 1980. This cluster has been extremely
dynamic, displaying high rates of entry, growth and turnover in the population of firms over time. In
addition, the connections among products and companies are quite complicated in the cluster. Firms do
not design or make whole computer systems; instead, they design and/or make modules that are parts of
larger systems. These modules include hardware components like computers, microprocessors and disk
drives; software components like operating systems and application programs; as well as process
components like fabrication, assembly, systems integration, and testing.
Modules, in fact, are always distinct parts of a larger system. They are designed and produced
independently of one another, but must function together as a whole. Modularity allows tasks—both
design tasks and production tasks—to be divided among groups, which can work independently and do
not have to be part of the same firm. Compatibility among modules is ensured by “design rules” that
govern the architecture, the interfaces, and the standardized tests of the system. Thus “modularizing” a
system involves specifying its architecture, that is, what its modules are; specifying its interfaces, i.e., how
the modules interact; and specifying tests which establish that the modules will work together and how
well each module performs its job.
From an engineering perspective, modularity does many things. First, it makes the complexity of
the system manageable by providing an effective “division of cognitive labor.”4 It also makes possible the
graceful evolution of knowledge about the system.5 In this way, modular systems are “cognitively
economic.” Second, modularity organizes and enables parallel work. Work on or in modules can go on
3 See Baldwin and Clark, 2000, Chapters 6-7 on the origins of modularity in early computer designs.4 O.E. Williamson, 1999, “Human Action and Economic Organization,” mimeo, University of California, Berkeley;quoted in M. Aoki, Towards a Comparative Institutional Analysis, 2001, MIT Press, Chapter 4.5Garud and Kumarswamy, 1995.
Modularity in the Design of Complex Engineering Systems © Carliss Y. Baldwin and Kim B. Clark, 2004
7
simultaneously, hence the start-to-finish time needed to complete the job decreases. Thus modular
systems are “temporally economic.” Finally, modularity in the design of a complex system allows modules
to be changed and improved over time without undercutting the functionality of the system as a whole.
In this sense, as we indicated above, the modular design of a complex system is “tolerant of uncertainty”
and “welcomes experimentation” in the modules.
Modularity in Design, Production and Use
Humans interact with artifacts in three basic ways: they design them; produce them; and use
them. There are, as a result, three basic types of modularity: modularity-in-design, modularity-in-
production, and modularity-in-use. We will discuss these “modularities” in reverse order.
A system of goods is modular-in-use if consumers can mix and match elements to come up with a
final product that suits their taste and needs. For example, consumers often buy bed frames, mattresses,
pillows, linens, and covers made by different manufacturers and distributed through different retailers.
The parts all fit together because different manufacturers make the goods in standard sizes. These
standard dimensions constitute design rules that are binding on manufacturers, wholesalers, retailers,
and users. Modularity-in-use thus supports customization of the system to suit the needs and tastes of the
end-user.
Manufacturers have used modularity-in-production for a century or more. Car makers, for example,
routinely arrange to manufacture the components of an automobile at different sites and bring them
together for final assembly. They can do so because they have completely and precisely specified how the
parts will interact with the vehicle. The engineering specifications of a component (its dimensions,
tolerances, functionality, etc.) constitute a set of design rules for the factories that supply the parts. Such
process modularity is fundamental to mass production.
However, the fact that, in a complex system, the elements of use or the tasks of production have
been split up and assigned to separate modules does not mean that the design of the system is modular.
Indeed systems that are modular-in-use or modular-in-production may rest on designs that are tightly
coupled and centrally controlled. For example, Intel Corporation famously imposes a “copy exactly” rule
on its fabrication plants. The production of chips can go on independently at separate sites because the
layout of the plants and the work processes within the plants are the same. Thus Intel’s “copy exactly”

Modularity in the Design of Complex Engineering Systems © Carliss Y. Baldwin and Kim B. Clark, 2004
8
plants are modular-in-production but not modular-in-design. In a similar vein, a sectional sofa is a suite
of furniture that is modular-in-use. Purchasers can combine and recombine the elements of the suite at
will. But those elements must be designed as one interdependent whole, or the patterns and shapes will
not form a pleasing ensemble. Thus the sectional sofa suite is modular-in-use, but not modular-in-design.
A complex engineering system is modular-in-design if (and only if) the process of designing it can
be split up and distributed across separate modules, that are coordinated by design rules, not by ongoing
consultations amongst the designers. Of all the “modularities”, modularity-in-design is the least well
understood and has the most interesting economic consequences. This is because new designs are
fundamentally options with associated economic option value. Modularity-in-design multiplies the options
inherent in a complex system. This in turn both increases the total economic value of the system and
changes the ways in which the system can evolve. In the rest of this paper, we will explain how to map
and measure the option value of modularity-in-design.
Designs as Options
A fundamental property of designs is that at the start of any design process, the final outcome is
uncertain. Once the full design has been specified and is certain, then the development process for that design
is over.
Uncertainty about the final design translates into uncertainty about the design’s eventual value.
How well will the end-product of the design process perform its intended functions? And what will it be
worth to users? These questions can never be answered with certainty at the beginning of any substantive
development process. Thus the ultimate value of a design is unknown when the development process
begins.
Uncertainty about final value in turn causes new designs to have “option-like” properties. In
finance, an option is “the right but not the obligation” to choose a course of action and obtain an
associated payoff. In engineering, a new design creates the ability but not the necessity—the right but not
the obligation—to do something in a different way. In general (if the designers are rational), the new
design will be adopted only if it is better that its alternatives. Thus the economic value of a new design is
properly modeled as an option using the methods of modern finance theory.
Modularity in the Design of Complex Engineering Systems © Carliss Y. Baldwin and Kim B. Clark, 2004
9
The option-like structure of designs has three important but counterintuitive consequences. In the
first place, when payoffs take the form of options, taking more risk creates more value.6 Risk here is
defined as the ex ante dispersion of potential outcomes. Intuitively, a risky design is one with high
technical potential but no guarantee of success. “Taking more risk” means accepting the prospect of a
greater ex ante dispersion. Thus a risky design process is one that has a very high potential value
conditional on success but, symmetrically, a very low, perhaps negative, value conditional on failure.
What makes the design an option, however, is that the low-valued outcomes do not have to be
passively accepted. As we said, the new design does not have to be adopted; rationally, it will be adopted
only if it is better than the alternatives, including the status quo alternative. In effect, then, the downside
potential of a risky design is limited by the option to reject it after the fact. This means that “risk” creates
only upside potential. More risk, in turn, means more upside potential, hence more value.7
The second counterintuitive result is that when payoffs take the form of options, seemingly
redundant efforts may be value-increasing. Two attempts to create a new design may arrive at different
endpoints. In that case, the designers will have the option to take the better of the two. The option to take
the better of two or best of several outcomes is valuable.8 Thus when faced with a risky design process,
which has a wide range of potential outcomes, it is often desirable to run multiple “design experiments”
with the same functional goal. These experiments may take place in parallel or in sequence, or in a
combination of both modes.9 But whatever the mode, more risk calls for more experimentation.
The third result is that options interact with modularity in a powerful way. By definition, a modular
architecture allows module designs to be changed and improved over time without undercutting the
functionality of the system as a whole. This is what it means to be “tolerant of uncertainty” and to
“welcome experiments” in the design of modules. As a result, modules and design experiments are
6 This is a basic property of options. See Merton, 1973.7 It follows, of course, that if a risky design is “hardwired” into a system so that it must be implemented regardless ofits value, then the design process loses its option-like properties. In such cases, “taking more risk” in the sensedefined above, will not increase, and may decrease value.8 Stulz, 1982, first analyzed the option to take the higher-valued of two risky assets. Sanchez (1991) worked out thereal option value of parallel design effort in product development.9 Loch, Terwiesch and Thomke, 2001.

Modularity in the Design of Complex Engineering Systems © Carliss Y. Baldwin and Kim B. Clark, 2004
10
economic complements: an increase in one makes the other more valuable.10 (Below we will derive this
result in the context of a formal model.)
The effect of modularity-in-design on options and option value is depicted in Figure 4. Here we
envision a system that is making the transition from being one interdependent whole to being a set of
modules governed by design rules. The system goes from having one large design option (i.e., to take the
whole design or leave it) to having many smaller options—one per module. Thus the act of splitting a
complex engineering system into modules multiplies the valuable design options in the system. At the
same time, this modularization moves decisions from a central point of control to the individual modules.
The newly decentralized system can then evolve in new ways.
Notice, however, that by modularizing, one barrier to entry by competitors, the high costs of
developing an entire complex engineering system (like an automobile, a computer, or a large software
package) are reduced to the costs of developing individual modules. Thus the modularization of a large,
complex system, even as it creates options and option value, also sows the seeds of increased competition
focused on the modules. We shall revisit this issue at the end of the paper.
Figure 4Modularity Creates Design Options
System Before Modularization System after Modularization
System DesignOption Rules
Option Option
Option Option
Option Option
Option
10 This is the definition of economic complementarity used by Milgrom and Roberts (1990) and Topkis (1998, p. 43).The complementarity of modularity and experimentation was first demonstrated by Baldwin and Clark (1992; 2000,Chapter 10).

Modularity in the Design of Complex Engineering Systems © Carliss Y. Baldwin and Kim B. Clark, 2004
11
Mapping the Design of a Complex Engineering System
We will now look at modularity-in-design more carefully. To help us do so, we will represent the
design of a complex system using the methods of Design Structure Matrix (DSM) Mapping. In this
mapping technique, the system is first characterized by listing a set of design parameters for the system.
The design parameters are then arrayed along the rows and columns of a square matrix. The matrix is
filled in by checking—for each parameter—which other parameters affect it and which are affected by it.
For example, if Parameter A affects the choice of Parameter B, then we will put a mark “x” in the cell
where the column of A and the row of B intersect. We repeat this process until we have recorded all
parameter interactions. The result is a map of the dependencies that affect the detailed structure of the
artifact. For example, Figure 5 is a DSM map of the dependencies in the design for a laptop computer
system circa 1993.11
DSM maps are well known in the engineering professions. They can be constructed for any
artifact or complex system, whether it is tangible or intangible. Thus there are DSM maps of products,
like computers and automobiles, and DSM maps of both production processes and design processes.
Many such maps have been constructed by Steven Eppinger and his colleagues at MIT.
The DSM map in Figure 5 indicates that the laptop computer design has four blocks of very
tightly interrelated design parameters corresponding to the (Disk) Drive System, the Main Board, the
LCD Screen, and the Packaging of the machine. There is also a scattering of dependencies (“x’s”) outside
the blocks. The dependencies arise both above and below the main diagonal blocks, thus the blocks are
interdependent.
11 The DSM methodology was invented by Donald Steward. The DSM map shown in Figure 5 was prepared by KentMcCord and published in McCord and Eppinger, 1993. Reprinted by permission.

Modularity in the Design of Complex Engineering Systems © Carliss Y. Baldwin and Kim B. Clark, 2004
12
Figure 5Design Structure Matrix Map of a Laptop Computer
. x x x x xx . x x x x x x x x x
Drive x x . x x xSystem x x x . x x x x x x x x
x x . xx x x x . x x x
x x x . x xx x x . x x x x
x x x . x x x x xMain x x x . x x xBoard x x x x x x x x . x x x x x
x x x x x . x xx x x x x x . x x x
x x x . xx x x . x x x
x x x x . x x x xLCD x x x . x xScreen x x x x . x x x
x x x x x x x . x x xx x x . x
x x x x . x x x xx x x . x x x x
x x x x x . x x xPackaging x x x x . x x
x x x x x . x xx x x x . x x
x x x x x .x x x x x .
Graphics controller on Main Board or not?If yes, screen specifications change;If no, CPU must process more; adopt different interrupt protocols
Cycling and iteration are needed to resolve design interdependencies. For example, as shown in
the figure, the location of the computer’s graphics controller creates dependencies between the Main
Board and the LCD Screen and vice versa. Because of these dependencies, there will be ramifications of

Modularity in the Design of Complex Engineering Systems © Carliss Y. Baldwin and Kim B. Clark, 2004
13
any choice made at this particular point: these are indicated by the arrows in the diagram. If two teams
were working on the different components, they would have to confer about the location of the graphics
controller in order to coordinate their design choices. But unforeseen consequences might arise later,
causing the initial choice to be revisited. There would then be further consequences: new arrows would
arise, which, through the chain of dependencies, might wander all over the map. Such cycling is the
inevitable consequence of an interdependent design structure.
However, it is important to note that the DSM map for a product or process need not be set in
stone forever. Dependencies and interdependencies can be modified by a process of design
rationalization, which works in the following way. Suppose that the designers of the laptop computer
system wished to eliminate the interdependencies between the Main Board and the Screen that were due
to the graphics controller location. They could do so by setting a design rule that located the graphics
controller on the Board (for example). By this action the two design teams would have restricted their
alternatives, but they would also have eliminated a source of cycling between two of the blocks of the
design.
Figure 6 shows the new DSM map obtained by turning the graphics control location into a design
rule. Two dependencies, one above the diagonal and one below, which were present before, now do not
exist: they are absent from the circled areas in the map. Instead there is a design rule that is known (hence
“visible”) to both sets of designers, which they must obey.

Modularity in the Design of Complex Engineering Systems © Carliss Y. Baldwin and Kim B. Clark, 2004
14
Figure 6Eliminating Interdependencies by Creating a Design Rule
DesignRules . Graphics Controller - Yes/no
. x x x x xx . x x x x x x x x x
Drive x x . x x xSystem x x x . x x x x x x x x
x x . xx x x x . x x x
x x x . x xx x x . x x x x
x x x . x x x x xMain x x x x . x x xBoard x x x x x x x x x . x x x x
x x x x x . x xx x x x x x . x x x
x x x . xx x x . x x x
x x x x . x x x xLCD x x x . x xScreen x x x x . x x x
x x x x x x x . x x xx x x . x
x x x x . x x x xx x x . x x x x
x x x x x . x x xPackaging x x x x . x x
x x x x x . x xx x x x . x x
x x x x x .x x x x x .
Carrying this process through to its logical conclusion results in a radically different structure: a
modular structure as shown in Figure 7. Here we have the same highly interdependent blocks as before:
the Drive System, the Main Board, the LCD Screen, and Packaging. And within those blocks essentially
nothing has changed, the pattern of interdependency is the same. But the out-of-block dependencies both
above and below the main diagonal have all disappeared.

Modularity in the Design of Complex Engineering Systems © Carliss Y. Baldwin and Kim B. Clark, 2004
15
Figure 7Modularization of a Laptop Computer Design
. x x x xx . x x
Design x . x x Design Rules Task GroupRules x x . x
x x x .x . x x x
x x . x x xDrive x x x x . xSystem x x x x x . x x Hidden Modules
x x x . x many Task groupsx x x x .
x . x xx x x x x . x x
x x . x x x xMain x x x x x . x xBoard x x x x x x x . x x
x x x x x . xx x x x x x . x
x x x x x .x x . x x x
x x x . x x xLCD x x x . xScreen x x x x x . x x
x x x x x . xx x x x x x .
x x . x x x xx x x . x x x x
x x x . x x xPack- x x x x x x . x xaging x x x . x x
x x x x x . x xx x x x x .
x x x x x x .x x x x x x . x x x x
System x x x x x x x x . x xTesting x x x x x x x x x . x x x& Integ- x x x x x x x x x x x xration x x x x x x x x . x
x x x x x x x x x x x .
System Integration and TestingTask Group
How does that happen? First, in the new structure, each of the former out-of-block dependencies
has been addressed by a design rule. Thus, there is now a new “Design Rules” block (not drawn to scale),
whose parameters affect many of the parameters in the component blocks. Those dependencies are
indicated by the “x”s in the vertical column below the Design Rules block. (Design rule parameters are
often called “standards.”)

Modularity in the Design of Complex Engineering Systems © Carliss Y. Baldwin and Kim B. Clark, 2004
16
By obeying the design rules, teams working on the designs of each of the component
blocks—which are now modules—can maintain conformity with the other parts of the system. But note
that there has been another, earlier stage in the process in which the design rules were established.
Furthermore, the new process, as shown in Figure 7, delivers four separate items, which must still
be integrated into a functioning whole system. No set of design rules is perfect, and unforeseen
compatibility problems are often revealed in the latter stages of a modular design process. For these
reasons, a “System Integration and Testing” (SIT) block appears in the lower right corner of the modular
DSM. This block is affected by the design rules and by some parameters of the hidden modules. But
decisions taken in the SIT block, by definition, will not affect choices in the prior blocks. (If they do, then
the structure is no longer modular).
Therefore, a modular design structure has three characteristic parts:
• design rules, which are known and obeyed by teams responsible for individual modules;
• so-called hidden modules that “look to” the design rules, but are independent of oneanother as work is proceeding; and
• a systems integration and testing module in which the hidden modules are assembled into asystem, and any remaining, minor problems of incompatibility are resolved.
A complex system design may go from being interdependent to being modular in the following
way. The “architects” of the system must first identify the dependencies between the distinct
components and address them via a set of design rules. Second, they must create encapsulated or
“hidden” modules corresponding to the components of the system. And third, they must establish a
separate system integration and testing activity that will assemble the modular components and resolve
unforeseen incompatibilities.
The Design Hierarchy Representation
A DSM map is one way to represent a modular system: a design hierarchy is another.12 A design
hierarchy shows which modules are affected by which other modules. (See Figure 8.) At the very top of
the design hierarchy are the system-wide design rules: these must be obeyed (hence “are visible to”) all
modules in the system.
12Marples 1961; Clark, 1985.

Modularity in the Design of Complex Engineering Systems © Carliss Y. Baldwin and Kim B. Clark, 2004
17
Figure 8A Two-level Modular Design Hierarchy
Global Design Rules
Module A Module B Module C Module D SystemIntegration & Testing
The system comprises four "hidden" modules and a "System Integration and Testing" stage. From the standpoint of the designers of A B, C, and D (the hidden modules), system integration and testing is simply another module: they do not need to know the details of what goes on in that phase as long as they adhere to the global design rules. Obviously, the converse is not true: the integrators and testers have to know something about the hidden modules in order to do their work. How much they need to know depends on the completeness of the design rules. Over time, as knowledge accumulates, more testing will occur within the modules, and the amount of information passed to theintegrators will decrease. The special, time-dependent role of integration and testingis noted by the heavy black border around and gray shading within the "module."
Below the system-wide design rules, there may be “architectural modules,” which establish
design rules for certain subsystems. There are no architectural modules in Figure 8, but in most complex
engineering systems there are one or two layers of architectural modules. For example, operating systems
like Microsoft Windows and Unix are architectural modules in a computer system.
Finally, at the bottom of the design hierarchy are the hidden modules of the system: these must
obey the design rules, hence “look to” them. But the hidden modules’ own parameters are
“encapsulated”: they do not affect, and hence do not need to be known to those working on other
modules. Hidden modules are thus the primary source of option value in a modular system. (Even so,
depending on the rules governing intellectual property, much of the value created in the hidden modules
may be captured by the companies that control architectural modules and/or design rules.)

Modularity in the Design of Complex Engineering Systems © Carliss Y. Baldwin and Kim B. Clark, 2004
18
Modular Organizations
The “modularized” architectures depicted in Figures 7 and 8 lead naturally to a “modularized”
organizational structures.13 In a recent paper which addressed the nature of transactions we postulated
that the activities represented by the x’s in Figures 5 and 6 naturally map onto organizations since each
interaction captured on the DSM represents a transfer of material or information or both.14 In this way it
is natural to look at Figure 6 and see a ‘traditional’ organization structured around specific technologies
or disciplines. The within-block interactions represent interactions that are internal to each
organizational unit while the out-of-block interactions can be viewed as interactions that require
coordination across units. In this system, each organizational unit would have liaison personnel whose
function was to assure that activities in each unit of the overall endeavor remained synchronized and
coordinated.
In the modularized design of Figures 7 and 8 however, many of the cross-unit liaison and
coordination functions have been eliminated. This is done in two ways: through design rules and through
encapsulation. Design rules (standards) ensure that decisions that affect multiple units are fixed and
communicated ahead of time, and not changed along the way. Encapsulation means that all activities
associated with specific aspects of the product are conducted within one organizational unit – even if that
organizational unit embodies multiple skillsets, disciplines or activities. This may lead to duplication of
skillsets – for example the Main Board and Packaging groups may both need people who are skilled in
understanding interconnections – but, if they are to be encapsulated, these groups must be scaled and
staffed to their own needs without calling on shared resources, and without requiring extensive cross-
unit coordination activities.
Similarly note that the transfers of material and information between groups have been
simplified to a simple handoff from each module task group to a final systems integration and testing
group. If these handoffs as well as the design rules can be standardized and codified, then there is no
need for the various groups to reside in the same company: armslength transactions betweens several
firms can cost-effectively replace complex coordinating flows of information within a single firm.
13 Sanchez and Mahoney, 1996.14 Baldwin and Clark, 2002.

Modularity in the Design of Complex Engineering Systems © Carliss Y. Baldwin and Kim B. Clark, 2004
19
An educational analogy might be useful here. Instead of a laptop computer, Figure 6 might as
easily represent the traditional departmental or discipline-based organizational structure of a university
(like Harvard). A discipline-based organizational structure is well-suited to teaching courses, but it is ill-
suited to carrying out broadly-based research initiatives that cut across many disciplines. Indeed, in order
to conduct interdisciplinary research, the traditional departmental structure requires many cross-unit
interactions as shown in Figure 6. These interactions are generally time-consuming and prone to cycling.
In addition, many task-relevant interactions may get lost in the shuffle and not take place at all.
By contrast, a center-based or project-based collaborative structure gathers participants from
multiple disciplines and organizes them into self-contained teams as in Figure 7. Even though some
interactions are lost, and there may be duplication of resources across centers, the new organizational
structure imposes a much smaller coordination burden on the overall research endeavor. The reduced
coordination costs in turn can offset the opportunity losses and costs of implementing the more modular,
team-based structure. If the coordination cost savings are large, then a “more modular” organization is a
good idea. But there is always a tradeoff—some things are lost while other things are gained.
Modular Operators
A key benefit of systems with modular designs is that, especially at the lower levels of the design
hierarchy, such systems can evolve. The information that is encapsulated in the hidden modules can
change, as long as the design rules are obeyed. Therefore, as we said earlier, modular systems are
“tolerant of uncertainty” and “welcome experimentation” in their modules. In contrast, the design rules of
a modular system, once established, tend to be both rigid and long lasting.
There are certain generic design actions one can apply to a modular system. Following the lead of
John Holland of the University of Michigan,15 we have labeled such actions “operators.” In our prior
work, we identified six modular operators, and analyzed the sources of their economic value. In
particular, given a modular structure, one can:
• split any module;
• substitute a newer module design for an older one;
15 Holland, 1992.

Modularity in the Design of Complex Engineering Systems © Carliss Y. Baldwin and Kim B. Clark, 2004
20
• exclude a module;
• augment the system by adding a module that was not there before;
• collect common elements across several modules and organize them as a new level in thehierarchy (modular inversion); and
• create a “shell” around a module so that it works in systems other than one for which it wasinitially designed (modular porting).
Figure 9 shows how each of these operators affects the structure of a modular system.
We must emphasize that we regard our list of six operators as the beginning of a useful
taxonomy. The list is by no means exhaustive. Indeed three other operators have been identified in
empirical investigations of design evolution. These are:
• the linking of two pre-existing modules;16
• the recombining of two previously separate modules (this is the opposite of splitting); and
• embracing and extending a pre-existing module (this operator was famously used byMicrosoft on Sun’s version of Java).
The important thing to understand is that operators correspond to search paths in the design space of a
complex engineering system. These search paths in turn are options in the so-called “value landscape” of the
complex system. As options, the operator/search paths can be valued using fairly standard analytic
techniques from finance. Thus, for example, the decision to split a complex system (or subsystem) into
several modules can be valued. The decision to augment the system by designing several variants of a
module customized for different users or purchasers can also be valued. In the next section, we will
describe the economic structure of option values for the modules of a complex engineering system.
16 Bala Iyer, 2003, private communication.

Modularity in the Design of Complex Engineering Systems © Carliss Y. Baldwin and Kim B. Clark, 2004
21
Figure 9The Effect of the Six Operators on a Modular System
System I Global Design Rules Module F System II Design RulesDesign Rules
System Module C System I F - 1 System IIIntegration Module F Module F& Testing D-E Design Rules T rans l a to r F - 2 Trans l a to r System II Modules ...
Module GModule A F - 3Design Rules Module D Module E Arch i tectu ra l
Module
A - 1 A - 2 A - 3
Sp l i t t i ng Subst itut ion Exc l u s i on Augmenting I n ve r s i o n Po r t i ng
We started with a generic two-level modular design structure, as shown in Figure 5-3, but with six modules (A, B, C, D, E, F) instead of four. (To displaythe porting operator, we moved the "System Integration & Testing Module" to the left-hand side of the figure.) We then applied each operator to a different set of modules.
Module A was S p l i t into three sub-modules.Three different Substitutes were developed for Module B.Module C was Excluded.A new Module G was created to Augment the system.Common elements of Modules D and E were Inverted. Subsystem design rules and an architectural module were developed to allow the inversion.Module F was Ported.First it was split; then its "interior" modules were grouped within a shell; then translator modules were developed.
The ending system is a three-level system, with two modular subsystems performing the functions of Modules A, D and E in the old system.In addition to the standard hidden modules, there are three kinds of special modules, which are indicated by heavy black borders and shaded interiors:
System Integration & Testing ModuleArchitectural ModuleTranslator Module(s)
Module BModule B

Modularity in the Design of Complex Engineering Systems © Carliss Y. Baldwin and Kim B. Clark, 2004
22
Option Values in a Complex Engineering System
We begin this section by introducing some notation. We assume that the total economic value of
a complex engineering system can be expressed as the sum of a minimal system value, S0, plus the
incremental value added by the performance of each of J modules. Equation 1 thus denotes the ex post
value that will be realized once the system’s design is complete:
JEconomic Value of the System = S0 + S Xj
1 ; (1) j=1
At the beginning of our analysis, we assume that the minimal system exists and its economic value is
known. Without loss of generality, we normalize that value to zero. At the same time, we assume that the
modules of the system have not yet been realized, hence their eventual economic payoffs (the Xj1) are
uncertain.
As long as economic payoffs can be expressed in terms of money (e.g., a present value), module
values can be modeled as one-dimensional random variables. We use superscripts to denote the
realizations of random variables, and subscripts to denote the distributions of random variables with
different distributions. Thus Xj1 should be read as “the economic value of a single realization of the
random variable Xj”. Total system value is a sum of realizations over a set of J random variables, with
different distributions, indexed by j.
The realization of a module design is the outcome of a development effort targeted at that
module. The realization in turn can have positive or negative value. A design with negative value is not
worth incorporating into the system: it subtracts more functionality than it adds. At the end of a design
interval, the developers can observe the realization for each module and compare that value to zero. If the
new module design has positive value, it will be added to the system, and the system’s value will
increase by that amount. If the new module design has zero or negative value, it can be discarded, and
the developers can try again. In this fashion, the developers can mix and match old and new module
designs. The ability to accept or reject a particular realization is the developers’ basic option and the focus
of our analysis.
For simplicity, we assume that the firm or firms developing the complex system are risk-neutral
expected-value maximizers, and that design intervals are short enough that we can ignore the time value

Modularity in the Design of Complex Engineering Systems © Carliss Y. Baldwin and Kim B. Clark, 2004
23
of money. In that case, the ex ante economic value of the entire system (whose ex post value is given by
equation 1) can be expressed as follows:
VJ = S0 + Emax(X11, 0) + Emax(X2
1, 0) + ... + Emax(XJ1, 0) ; (2)
Equation 2 indicates that each module's realized value will be compared to a benchmark equal to zero. If
the new module design has value greater than the benchmark, the new design will be incorporated into
the system, otherwise it will be rejected. Thus the expectation of the value of the new design is the
maximum of its realization and zero. The expectation of the maximum of a random variable and a scalar is
larger than the expectation of the random variable alone, thus the option to reject module designs adds to
the economic value of the system.
Equation 2 is very general. We can gain further insight by specializing the assumptions. For
example, as a thought experiment, consider a system with a total of N design parameters, and think of
allocating the parameters into J distinct modules of different sizes. Let Xa denote the economic value of a
module of size aN where a is less than (or equal to) one and the set of as sums to one:
JS aj = 1 .j=1
For purposes of illustration, assume that Xa is a normally distributed random variable with mean zero
and variance s2aN: Xa ~ N(0, s2aN). In this case, the variance of a module’s value will be proportional to
the number of design parameters in the module. Roughly speaking, the dispersion of outcomes increases
as a module’s “complexity” measured by aN goes up.
Define za as:
za = Xa . s (aN)1/2
za is a standard normal variant with mean zero and variance one: za ~ N(0, 1).
Substituting for the Xs in terms of z in equation 2, suppressing S0, and collecting terms, we have:
Va = V(a1, …, aJ ; s, N) = s N1/2 ( a11/2 + a2
1/2 + … + aJ 1/2) Emax(z, 0) . (3)
Here Emax(z, 0) is the expectation of the right half of a truncated standard normal distribution and
equals .3989. Note that the system value depends on the elements of the vector of (a1, …, aJ) as well as the

Modularity in the Design of Complex Engineering Systems © Carliss Y. Baldwin and Kim B. Clark, 2004
24
system parameters s and N. This underscores the fact that impact of modularity cannot be captured by a
single summary measure or statistic (e.g., the average degree of modularity). The details of the modular
structure (i.e., the elements of the vector a) affect the system’s option value in important and nonlinear
ways.
Several results follow directly from equation 3. For example, we can compare the value of a
modularized system to the value of the corresponding unmodularized system:
Proposition 1. Under the assumptions given above, let an engineering system of complexity N be
partitioned into J independent modules of complexity (a1N, a2N, ... , aJN) respectively. The modularized
system has value:
Va = ( a11/2 + a2
1/2 + … + aJ1/2) V1 ; (4)
relative to V1, the value of the corresponding unmodularized system.
Proof.
By definition, a one-module design has both J and aJ equal to one. Thus V1 = s N1/2 Emax(z, 0). Collecting
terms and substituting in equation (3) yields the result. QED.
From the fact that < a1, a2, ... , aJ > are fractions that sum to one, it follows that the sum of their
square roots is greater than one. Thus, as expected, under these very specialized assumptions, a modular
design is “always” more valuable than the corresponding non-modular design. Moreover, additional
modularization (the splitting) increases value: if a module of size a is split into sub-modules of size b and
g, such that b + g = a, then the two modules’ contribution to overall value will rise because b1/2 + g1/2 >
a1/2.
In this fashion, higher degrees of modularity can increase the value of a complex design through
option value. This result is a special case of a well-known theorem, first stated by Robert Merton in 1973.17
For general probability distributions, assuming aggregate value is conserved, Merton showed that a
“portfolio of options” is more valuable than an “option on a portfolio.”
Up to this point in our thought experiment, we have assumed that designers will create only one
new design per module. However, as we indicated above, an important fact about options is that

Modularity in the Design of Complex Engineering Systems © Carliss Y. Baldwin and Kim B. Clark, 2004
25
“duplication of effort,” in the sense of mounting several design experiments aimed at the same target,
may be desirable. Pursuing several experimental designs gives developers the opportunity to select the
best outcome after the fact. How much economic value does this does this option create? Is it worth the
cost? The answer to this question, it turns out, depends on both the modular structure of the overall
system and the technical potential inherent in each module.
To quantify the value of parallel experimentation, let us suppose that in each of J modules, the
designers initiate kj independent design efforts. When the designs are complete, the designers then have
the option in each module to select the best of the kj outcomes for the final design. Thus let Q(kj) denote
the expected value of the highest realization of k independent draws from a standard normal distribution
as long as the realization is greater than zero. Formally:
∞Q(k) = k ∫ z [N(z)]k-1 n(z) dz
0
where N(z) and n(z) are respectively the standard normal distribution and density functions.18
By similar reasoning as above, the total value of a system with J modules and kj experiments on
the jth module is:
J J V(a, k; s, N) = s N1/2 S aj
1/2 Q(kj) = S sj Q(kj) . (5)
j=1 j=1
The rightmost expression simply notes that the option value of each module is the product of the
module’s dispersion parameter, sj, times a “highest draw expectation” for a standard normal variate. We
have tabulated Q(k) for values of k up to 50: the results are shown in Table 2. Using the tabulated values
it is straightforward to operationalize this valuation methodology.
17 Merton, 1973.18 This distribution of the best of k realizations is well known in statistics: it is the distribution of the "maximum orderstatistic of a sample of size k." Our expectation differs from the standard one, however, because it is taken only overthe range of values above zero. See Lindgren, 1968, on order statistics in general.

Modularity in the Design of Complex Engineering Systems © Carliss Y. Baldwin and Kim B. Clark, 2004
26
Table 2Tabulated Values of Q(k) for k = 1, …, 50
Equation 5 applies to systems wherein the modules are asymmetric. If modules are symmetric,
then it will be optimal to run the same number of experiments on each module. The 2J arguments in
equation 5 then collapse to two, and the value of the system as a whole, denoted V(j,k), becomes:
V(j,k) = s (Nj)1/2 Q(k) (6)
Figure 10 graphs this function for different values of j and k. The way to read this chart is as
follows. The vertical axis shows system value as a function of two variables. The first variable, on the
right-hand axis, is the number of modules in the system. In the figure, this variable ranges from 1 to 25.
The second variable, on the left axis, is the number of design experiments, i.e. R&D projects, per module.
This variable also ranges from 1 to 25. The surface shown on the vertical axis indicates the value of
different combinations of modules and experiments. As we go out along the middle of this surface, we
see the value of running one experiment on one module, two experiments on each of two modules, and
so on, until at the far corner, we have 25 experiments on each of 25 individual modules in the system.
k Q(k) k Q(k) k Q(k) k Q(k) k Q(k)
1 0.3989 11 1.5865 21 1.8892 31 2.0565 41 2.17072 0.681 12 1.6293 22 1.9097 32 2.0697 42 2.18033 0.8881 13 1.668 23 1.9292 33 2.0824 43 2.18974 1.0458 14 1.7034 24 1.9477 34 2.0947 44 2.19885 1.1697 15 1.7359 25 1.9653 35 2.1066 45 2.20776 1.2701 16 1.766 26 1.9822 36 2.1181 46 2.21647 1.3534 17 1.7939 27 1.9983 37 2.1293 47 2.22498 1.4242 18 1.82 28 2.0137 38 2.1401 48 2.23319 1.4853 19 1.8445 29 2.0285 39 2.1506 49 2.2412
10 1.5389 20 1.8675 30 2.0428 40 2.1608 50 2.2491

Modularity in the Design of Complex Engineering Systems © Carliss Y. Baldwin and Kim B. Clark, 2004
27
Figure 10The Value of Splitting and Substitution
59
1 31 7
2 12 5
1
71 3
1 92 5
0
5
1 0
1 5
2 0
2 5
3 0
The figure shows that there is strong complementarity between design modularity and
experimentation. More modules make more experiments more valuable, and vice versa. The two things
go together.
Although this function is the result of a thought experiment (and no real system is symmetrical
to this degree), the result is nevertheless compelling. The amount of economic value being created by the
combination of modules and experiments is really very large. The values are calculated relative to the
value of a single experiment in a non-modular system; we see, in effect, that a complex project organized
as 25 modules with 25 experiments per module can obtain approximately 25 times the value of the same
project organized as a single, interdependent whole. These values are hypothetical, and do not recognize
the costs of creating a modular architecture, running experiments, or integrating and testing the modular
system. But a value multiple of 25 will pay for a lot of engineering costs! In other words, the incentives

Modularity in the Design of Complex Engineering Systems © Carliss Y. Baldwin and Kim B. Clark, 2004
28
afforded by the combination of modularity and experimentation are so great that in a free-market
economy, if it is possible to modularize, someone will do so in order to capture this value.
The graph is also surprising in the way the factors interact. Modules and experiments work
together, and therefore, as one increases modularity, and one should experimentation, that is, R&D, as
well, in order to get the best outcome. This is costly, as we shall see. But there is another kind of “cost”
involved: the cost of potential innovation ignored. Often engineers with the encouragement of managers
will modularize a complex engineering system in order to reduce its cognitive complexity or shorten its
development time. Neither group may understand what the modularization implies for the value of
innovation and experimentation within the system. Yet if the firm that initially modularizes the system
ignores this value, there will be strong incentives for other firms to enter the market offering their own new
module designs.
Something like that happened to IBM after the company introduced the first modular computer,
System/360, in the mid-1960s. System/360 was a powerful and popular modular system, a tour de force in
terms of product design, marketing, and manufacturing. However, IBM’s top managers did not
understand the value of the options that had been created by its own new modular design.They did not
increase inhouse design efforts, and as a result, left profitable opportunities “on the table.” Before long,
new firms moved in and seized these opportunities. This was the start of the pattern of industry
evolution and value migration depicted at the beginning of this paper.
Many of the new firms that entered the computer industry in the wake of System/360 were
staffed by former IBM engineers. Engineers who had worked on System/360 and its successors could see
the module options very well, and knew the design rules of the system. Thus when IBM’s top managers
did not fund their projects, they took those projects elsewhere. Beginning in the early 1970s, scores and
then hundreds of engineers left IBM and joined others in founding companies that supplied “plug-
compatible” modules for IBM’s System/360 and 370. As it happens, one of IBM’s main R&D labs was
located in San Jose, California, and the exodus of engineers from the San Jose labs was one of the key
factors that contributed to the emergence of what we now call Silicon Valley.

Modularity in the Design of Complex Engineering Systems © Carliss Y. Baldwin and Kim B. Clark, 2004
29
The Costs of Modularity
We have yet to address the costs of modularity. In fact, the costs of creating and exploiting a
modular system can be a significant offset to the value that is created.
There are, first of all, the costs of making an interdependent system modular: the cost of creating
and disseminating design rules. The DSM mapping techniques, discussed above, show how painstaking
the process of modularization must be, if it is to succeed in creating truly independent modules. Every
important cross-module dependency must be understood and addressed via a design rule. Obviously the density
of the dependencies matters here. Modular breakpoints (interfaces) need to go at the “thin crossing
points” of the interdependency graph. Some systems are naturally more “loosely-coupled” than others:
they have more thin crossing points hence relatively more potential modules.
For example, circuits, the physical system on which computers are based, are one- and two-
dimensional; whereas mechanical solids are three-dimensional. Clearly it is harder to split up complex,
curved, 3-dimensional designs, and to create flexible interfaces for them: there are more dependencies to
manage, and the tolerances are much tighter. Thus modularizing an automobile’s design is a tougher
engineering problem than modularizing a circuit design: the cost of creating a modular architecture and
related interfaces will be higher. This has led some scholars, like Daniel Whitney at MIT, to predict that
autos and airplanes will achieve only limited modularity in practice.19 The option values inherent in these
tightly coupled systems will be low relative to systems that can more easily be modularized.
It is also costly to run the experiments needed to realize the potential value of a modular system
and to design the tests needed to determine if particular modules are compatible with the system, and
which one performs best. Indeed figuring out how many and what kind of experiments to run and how
to test the results are important sub-problems within the overall option valuation problem. The
interaction of option value and the costs of experimentation and testing modules causes each module in a
large system to have a unique value profile. For example, Figure 11 shows how value profiles may differ
across modules as a function of the number of experiments. Some modules (those that are hidden and
have high technical potential) can support a lot of experiments; others (those that are visible and/or have
low technical potential) can support few or none.
19 Whitney, 1996.

Modularity in the Design of Complex Engineering Systems © Carliss Y. Baldwin and Kim B. Clark, 2004
30
Figure 11The Value Profiles for Different Modules of a Computer System
Size Visibility Examples
large hidden disk drive; large application program
large visible microprocessor; operating system
small hidden cache memory; small application program
small visible instruction set; internal bus
-0.5
-0.4
-0.3
-0.2
-0.1
0
0.1
0.2
0.3
0.4
0.5
0 5 10 15 20 25
No. of Experiments
Net
Opt
ion
Val
ue (B
ench
mar
k Pr
oces
s= 1
) Small;Hidden
Large;Hidden
Small;VisibleLarge;
Visible

Modularity in the Design of Complex Engineering Systems © Carliss Y. Baldwin and Kim B. Clark, 2004
31
Conclusion
We conclude this brief excursion into the realm of modularity by returning to the question of
industry evolution, and commenting on the perils of modularity for incumbent firms. Modularity in the
design of a complex engineering system with high technical potential (high ss in the modules) is likely to
be highly disruptive to the pre-existing industry structure. Modularity-in-design allows users or system
integrators to mix and match of the best designs within each module category and to incorporate new
and improved module designs as they become available. Thus a modular system design requires that a
company operate all aspects of its business more efficiently than its competitors. If it is not “the best” in a
given module, then competitors will flock to that point of vulnerability.
For example, consider IBM’s introduction of the personal computer (PC) in the early 1980s.20 By
this time, IBM had learned the basic lessons of modularity inherent in System/360. Its managers
understood how modularity encouraged both innovation and entry on modules. Indeed, the PC was
extremely modular-in-design, and IBM leveraged this modularity by outsourcing most of its hardware
and software components. But IBM’s managers also understood that they needed to protect the
company’s privileged position within the modular architecture. Thus IBM retained control of what were
thought to be the key design and process modules—a chip called the BIOS (Basic Input Output System)
and the manufacturing process of the PC itself. By exercising control of these critical and essential
“architectural modules,” IBM’s managers believed that they could manage the rate of innovation in PC’s.
Their goal was to obtain maximum return from each generation of PC, before going on to the next.
However, the founders of Compaq had a different idea. First, they independently and legally
replicated IBM’s technical control element, the BIOS. Then they designed a machine that was fully
compatible with IBM’s published and non-proprietary specifications. They bought the key modules of
the PC — the chip and the operating system — and all the other parts they needed from IBM’s own
suppliers. And they went to market with an IBM-compatible PC built around the newer, faster Intel 386
chip while IBM was still marketing 286 machines. Within a year Compaq had sales of $100 million; by
1990, its revenues were $3 billion and climbing, and IBM was looking to exit from its unprofitable PC
business.
20 This history is recounted in Ferguson and Morris, 1994.

Modularity in the Design of Complex Engineering Systems © Carliss Y. Baldwin and Kim B. Clark, 2004
32
However, as everyone knows, the leading player in the PC market today is not Compaq but
Dell.21 In a nutshell, Dell did to Compaq what Compaq did to IBM: it took advantage of the benefits of
modularity and designed a line of technologically competitive, yet compatible, and lower-priced PCs. In
fact, Dell used modularity-in-the-design-of-production-processes more effectively than Compaq in order to
arrive at a more efficient, less-asset-intensive business model. Dell outsourced even more of its
manufacturing activities than Compaq. It designed its assembly processes to build machines to order
(BTO), thereby cutting out most of its inventory. And it sold its products directly to consumers, thereby
cutting out dealers’ margins and more inventory. Compaq simply could not compete. When its top
managers saw the handwriting on the wall in PCs in early 1998, they tried to move the company into
higher-margin “enterprise computing” through the acquisition of Digital Equipment Corporation, but the
transition was not successful. Today, Compaq no longer exists as a separate company—it was acquired
by Hewlett Packard Corporation in 2002.
In conclusion, the widespread adoption of modularity-in-design in complex engineering systems
with high technical potential can set in motion an uncontrollable process of design and industry
evolution. The economic consequences of this process—for good and bad—are depicted in the charts and
turnover rates described at the beginning of this paper. Thus modularity-in-design can open the door to
an exciting, innovative, but very Darwinian world in which no one really knows which firms or business
models will ultimately prevail. This can be a world of growth, innovation and opportunity. But, as the
Internet Bubble and Crash taught us, this world can also fall into periods of extreme value destruction,
chaos and inefficiency. Thus in the last analysis, modularity-in-design is neither good or bad. Rather, it is
potentially powerful and disruptive, and therefore dangerous to ignore.
21 For detailed comparisons of Compaq’s and Dell’s business models, see Wheelwright and Verlinden, 1998 andBaldwin and Feinberg, 1999.

Modularity in the Design of Complex Engineering Systems © Carliss Y. Baldwin and Kim B. Clark, 2004
33
References
Abernathy, William and James Utterback (1978) “Patterns of Industrial Innovation,” Technology Review80:41-47.
Baldwin, Carliss Y. and Kim B. Clark (1992) "Modularity and Real Options: An Exploratory Analysis"Harvard Business School Working Paper #93-026, October.
Baldwin, Carliss Y. and Kim B. Clark (1997) “Managing in the Age of Modularity,” Harvard BusinessReview Sept/Oct: 81-93.
Baldwin, Carliss Y. and Kim B. Clark (2000). Design Rules, Volume 1, The Power of Modularity, MIT Press,Cambridge MA.
Baldwin, Carliss Y. and Kim B. Clark (2002) “Where Do Transactions Come From? A Perspective fromEngineering Design,” Harvard Business School Working Paper 03-031, Boston, MA.
Baldwin Carliss Y. and Barbara Feinberg, (1999) “Compaq: The DEC Acquisition,” 9-800-199, HarvardBusiness School Publishing Company, Boston, MA.
Braha, Dan (2002) “Partitioning Tasks to Product Development Teams,” Proceedings of ASME 2002International Design Engineering Technical Conferences, Montreal CN, October.
Browning, Tyson R. (2001) “Applying the Design Structure Matrix to System Decomposition andIntegration Problems: A Review and New Directions,” IEEE Transactions in EngineeringManagement 48(3):292-306.
Browning, Tyson R. (2002) “Process Integration Using the Design Structure Matrix,” Systems Engineering,5(3):180-193.
Browning, Tyson R. and Steven D. Eppinger (2002) “Modeling Impacts of Process Architecture on theCost and Schedule Risk in Product Development,” forthcoming in IEEE Transactions inEngineering Management.
Chandler, Alfred D. (1962) Strategy and Structure, MIT Press, Cambridge, MA.
Chandler, Alfred D. (1977) The Visible Hand: The Managerial Revolution in American Business, HarvardUniversity Press, Cambridge, MA.
Clark, Kim B. (1985) “The Interaction of Design Hierarchies and Market Concepts in TechnologicalEvolution,” Research Policy, 14(5):235-251.
Eppinger, Steven D. (1991) "Model-based Approaches to Managing Concurrent Engineering" Journal ofEngineering Design, 2: 283-290.
Eppinger, S. D., D.E. Whitney, R.P. Smith, and D.A. Gebala, 1994, "A Model-Based Method forOrganizing Tasks in Product Development," Research in Engineering Design 6(1):1-13
Ferguson, Charles H. and Charles R. Morris, Computer Wars: The Fall of IBM and the Future of GlobalTechnology, Times Books, NY, 1994.
Fixson, Sebastian and Mari Sako (2001) “Modularity in Product Architecture: Will the Auto IndustryFollow the Computer Industry?” Paper presented at the Fall Meeting of the International MotorVehicle Program (IVMP).
Fujimoto, Takahiro (1999) The Evolution of a Manufacturing System at Toyota, Oxford University Press,Oxford, UK.

Modularity in the Design of Complex Engineering Systems © Carliss Y. Baldwin and Kim B. Clark, 2004
34
Fujimoto, Takahiro and Akira Takeishi (2001) Modularization in the Auto Industry: Interlinked MultipleHierarchies of Product, Production and Supplier Systems, Tokyo University Discussion Paper,CIRJE-F-107, Tokyo, Japan.
Fujimoto, Takahiro (2002) “Architecture, Capability and Competitiveness of Firms and Industries,”presented at the Saint-Gobain Centre for Economic Research 5th Conference, Paris, FR,November.
Garud Raghu and Arun Kumaraswamy (1995) “Technological and Organizational Designs to AchieveEconomies of Substitution,” Strategic Management Journal, 17:63-76, reprinted in Managing in theModular Age: Architectures, Networks, and Organizations, (G. Raghu, A. Kumaraswamy, and R.N.Langlois, eds.) Blackwell, Oxford/Malden, MA.
Gomes, Paulo J. and Nitin R. Joglekar (2003) “The Costs of Organizing Distributed Product DevelopmentProcesses,” Boston University School of Management Working Paper #2002-06, Boston, MA,January.
Holland, John H. (1992) Adaptation in Natural and Artificial Systems, 2nd Ed. MIT Press, Cambridge, MA.
Holland, John H. (1996) Hidden Order: How Adaptation Builds Complexity, Addison-Wesley PublishingCompany, Reading, MA.
Holland, John H. (1999) Emergence: From Chaos to Order, Perseus Books, Reading, MA.
Joglekar, Nitin and Steven Rosenthal (2003) “Coordination of Design Supply Chains for BundlingPhysical and Software Products,” Journal for Product Innovation Management, forthcoming.
Klepper, Steven (1996) “Entry, Exit, Growth and Innovation over the Product Life Cycle, AmericanEconomic Review, 86(30):562-583.
Kusiak, Andrew (1995) Engineering Design, Academic Press, New York, NY.
Lindgren, Bernard W. (1968) Statistical Theory, Macmillan Publishing Co., New York, NY.
Loch, Christoph H., Christian Terwiesch and Stefan Thomke (2001) “Parallel and Sequential Testing ofDesign Alternatives,” Management Science, 45(5):663-678.
Marples, D.L. 1961, “The Decisions of Engineering Design,” IEEE Transactions in Engineering Management,2: 55-81
McCord, Kent R. and Steven D. Eppinger, 1993, "Managing the Integration Problem in ConcurrentEngineering," MIT Sloan School of Management Working Paper, no. 3594, August.
Mead, Carver and Lynn Conway (1980) Introduction to VLSI Systems, Addison-Wesley, Reading, MA.
Merton, Robert C. (1973) “Theory of Rational Option Pricing,” Bell Journal of Economics and ManagementScience, 4(Spring): 141-183; reprinted in Continuous Time Finance, Basil Blackwell, Oxford, UK,1990.
Milgrom, Paul and John Roberts (1990) “The Economics of Modern Manufacturing: Technology, Strategyand Organization,” American Economic Review, 80:511-528.
Parnas, David L. (1972a) "A Technique for Software Module Specification with Examples,"Communications of the ACM 15(May): 330-36.
Parnas, David L. (1972b) "On the Criteria to Be Used in Decomposing Systems into Modules,"Communications of the ACM 15(December): 1053-58.

Modularity in the Design of Complex Engineering Systems © Carliss Y. Baldwin and Kim B. Clark, 2004
35
Parnas, David L., P.C. Clements, and D.M. Weiss (1985) "The Modular Structure of Complex Systems,"IEEE Transactions on Software Engineering, SE-11(March): 259-66.
Sako, Mari (2002) “Modularity and Outsourcing: The Nature of Co-Evolution of Product Architectureand Organization Architecture in the Global Automotive Industry, forthcoming in The Business ofSystems Integration (A. Prencipe, A. Davies and M. Hobday, eds.) Oxford University Press,Oxford, UK.
Sanchez, Ron (1991) “Strategic Flexibility, Real Options and Product-based Strategy,” Ph.D dissertation,Massachusetts Institute of Technology, Cambridge, MA.
Sanchez, R. and Mahoney, J. T. (1996) “Modularity, flexibility and knowledge management in productand organizational design”. Strategic Management Journal, 17: 63-76, reprinted in Managing in theModular Age: Architectures, Networks, and Organizations, (G. Raghu, A. Kumaraswamy, and R.N.Langlois, eds.) Blackwell, Oxford/Malden, MA.
Sharman, David M., Ali A. Yassine, and Paul Carlile (2002) “Characterizing Modular Architectures,”Proceedings of DETC ’02, Design Theory & Methodology Conference, Montreal, Canada, September.
Sturgeon, Timothy (2002) “Modular Production Networks: A New American Model of IndustrialOrganization,” Industrial and Corporate Change, 11(3):451-496.
Sturgeon, Timothy (2003) “Exploring the Benefits, Risks, and Evolution of Value-Chain Modularity inProduct-level Electronics,” draft, Industrial Performance Center, MIT, February.
Sullivan, Kevin J., William G. Griswold, Yuanfang Cai and Ben Hallen, "The Structure and Value ofModularity in Software Design," University of Virginia Department of Computer ScienceTechnical Report CS-2001-13, submitted for publication to ESEC/FSE 2001.
Sutton, John (1992) Sunk Costs and Market Structure, MIT Press, Cambridge, MA.
Topkis, Donald M. (1998) Supermodularity and Complementarity, Princeton University Press, Princeton, NJ.
Ulrich, Karl (1995) “The Role of Product Architecture in the Manufacturing Firm,” Research Policy, 24:419-440, reprinted in Managing in the Modular Age: Architectures, Networks, and Organizations, (G.Raghu, A. Kumaraswamy, and R.N. Langlois, eds.) Blackwell, Oxford/Malden, MA.
Wheelwright, Stephen C. and Matt Verlinden, 1998 “Compaq Computer Corporation,” 9-698-094,Harvard Business School Publishing Company, Boston, MA
Whitney, Daniel E. (1996) “Why Mechanical Design Cannot Be Like VLSI Design,”http://web.mit.edu/ctpid/www/Whitney/morepapers/design.pdf, viewed April 9, 2001.