modernizing ohio’s transportation system€¦ · ohio statewide $3.5 billion $3 ... i-70 far east...
TRANSCRIPT
JUNE 2018 Founded in 1971, TRIP ® of Washington, DC, is a nonprofit organization that researches, evaluates and distributes economic and technical data on surface transportation issues. TRIP is sponsored by insurance companies, equipment manufacturers, distributors and suppliers; businesses involved in highway and transit engineering and construction; labor unions; and organizations concerned with efficient and safe surface transportation.
Modernizing Ohio’s Transportation System:
Progress and Challenges in Providing Safe, Efficient and Well-Maintained Roads, Highways and Bridges

Modernizing Ohio’s Transportation System
Executive Summary
Ohio’s roads, highways and bridges form vital transportation links for the state’s residents, visitors
and businesses, providing daily access to homes, jobs, shopping, natural resources and recreation. The
condition, efficiency and funding of Ohio’s transportation system are critical to quality of life and economic
competitiveness in the Buckeye State. Inadequate transportation investment, which will result in
deteriorated transportation facilities and diminished access, will negatively affect economic competitiveness
and quality of life.
Located within a day’s drive of 60 percent of the population of the United States and Canada, Ohio
can capitalize on its central location by maintaining and modernizing its roads, highways and bridges by
improving the physical condition of its transportation network; and, by enhancing the system’s ability to
provide efficient, reliable and safe mobility for residents, visitors and businesses. Ohio maintains one of the
most extensive and heavily traveled transportation systems in the nation. Ohio ranks second nationally
among states in the number of bridges, third in the volume of freight carried on its transportation system,
and sixth in both miles of Interstate highways and total vehicle miles traveled (VMT). Making needed
improvements to Ohio roads, highways, bridges and transit systems could also provide a significant boost to
the state’s economy by creating jobs in the short term and stimulating long-term economic growth as a
result of enhanced mobility and access.
This report examines the condition, use and safety of Ohio’s roads, highways and bridges and future
mobility needs. Sources of information for this report include the Ohio Department of Transportation
(ODOT), the Federal Highway Administration (FHWA), the American Association of State Highway and
Transportation Officials (AASHTO), the Bureau of Transportation Statistics (BTS), the U.S. Census Bureau, the
Texas Transportation Institute (TTI), the American Road & Transportation Builders Association (ARTBA)and
the National Highway Traffic Safety Administration (NHTSA).
DRIVING COSTS IN OHIO
Driving on Ohio’s transportation system costs the state’s motorists a total of $12 billion every year in the form of additional vehicle operating costs (VOC), congestion-related delays and traffic crashes.
• Driving on rough roads costs Ohio motorists a total of $3.5 billion annually in extra vehicle operating costs (VOC). These costs include accelerated vehicle depreciation, additional repair costs, and increased fuel consumption and tire wear.
2 Modernizing Ohio’s Transportation System
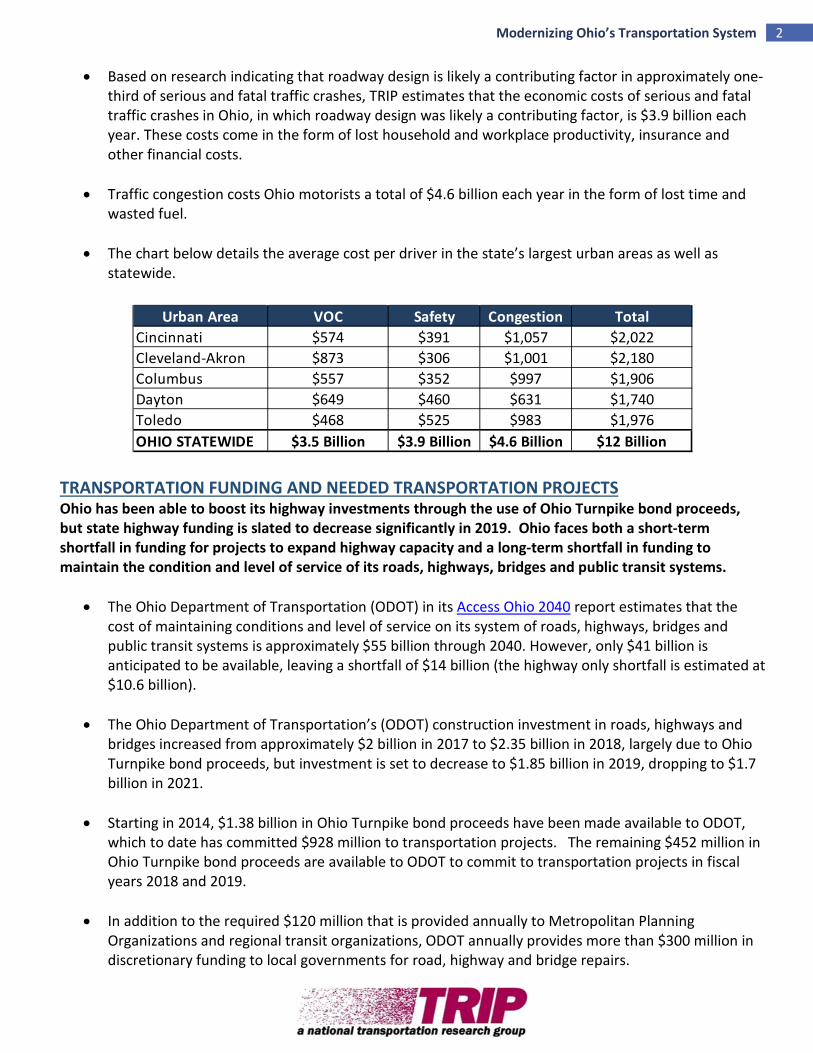
• Based on research indicating that roadway design is likely a contributing factor in approximately one-third of serious and fatal traffic crashes, TRIP estimates that the economic costs of serious and fatal traffic crashes in Ohio, in which roadway design was likely a contributing factor, is $3.9 billion each year. These costs come in the form of lost household and workplace productivity, insurance and other financial costs.
• Traffic congestion costs Ohio motorists a total of $4.6 billion each year in the form of lost time and
wasted fuel. • The chart below details the average cost per driver in the state’s largest urban areas as well as
statewide.
TRANSPORTATION FUNDING AND NEEDED TRANSPORTATION PROJECTS Ohio has been able to boost its highway investments through the use of Ohio Turnpike bond proceeds, but state highway funding is slated to decrease significantly in 2019. Ohio faces both a short-term shortfall in funding for projects to expand highway capacity and a long-term shortfall in funding to maintain the condition and level of service of its roads, highways, bridges and public transit systems.
• The Ohio Department of Transportation (ODOT) in its Access Ohio 2040 report estimates that the cost of maintaining conditions and level of service on its system of roads, highways, bridges and public transit systems is approximately $55 billion through 2040. However, only $41 billion is anticipated to be available, leaving a shortfall of $14 billion (the highway only shortfall is estimated at $10.6 billion).
• The Ohio Department of Transportation’s (ODOT) construction investment in roads, highways and
bridges increased from approximately $2 billion in 2017 to $2.35 billion in 2018, largely due to Ohio Turnpike bond proceeds, but investment is set to decrease to $1.85 billion in 2019, dropping to $1.7 billion in 2021.
• Starting in 2014, $1.38 billion in Ohio Turnpike bond proceeds have been made available to ODOT,
which to date has committed $928 million to transportation projects. The remaining $452 million in Ohio Turnpike bond proceeds are available to ODOT to commit to transportation projects in fiscal years 2018 and 2019.
• In addition to the required $120 million that is provided annually to Metropolitan Planning
Organizations and regional transit organizations, ODOT annually provides more than $300 million in discretionary funding to local governments for road, highway and bridge repairs.
Urban Area VOC Safety Congestion TotalCincinnati $574 $391 $1,057 $2,022Cleveland-Akron $873 $306 $1,001 $2,180Columbus $557 $352 $997 $1,906Dayton $649 $460 $631 $1,740Toledo $468 $525 $983 $1,976OHIO STATEWIDE $3.5 Billion $3.9 Billion $4.6 Billion $12 Billion

3 Modernizing Ohio’s Transportation System
• The Transportation Review Advisory Council (TRAC) oversees the selection of major projects to be constructed by ODOT. TRAC’s draft 2018-2021 major new construction list includes 45 highway and bridge projects in Ohio at a total cost of $8.3 billion, of which $2.5 billion in federal, state and local funding is anticipated to be available through 2023, leaving approximately $5.8 billion unfunded.
• The charts below detail needed transportation projects in the state’s largest urban areas and
statewide that have adequate state and local funding identified to proceed by 2023.
Route Project
I-75 Widening Hopple Street to Mitchell (Two Phases)
Cleveland Innerbelt Replace mainline structure over I-490I-680 to SR 164 Construction of Interchange Ramps Opportunity Corridor Development, construction of roadway from E 55th St to E 93rd St, new alignmentCleveland Innerbelt Declaration lane on I-71 to SR 176 ExitCleveland Innerbelt Improve I-90 Central Interchange area
Mid-Ohio Intermodal Center Construction of SR 309 RR overpass over CSX spurI-70 / I-71 Relocate City of Columbus powerline in I-70/71 corridorI-70 / I-71 Reconstruct and widen East Freeway InterchangeUS 33/SR 161 / Post Road Interchange ImprovementsUS 36 / SR 37 / I-71 Construction of new interchange (South)I-70 / I-71 Reconstruct and widen I-71 and Broad Street BridgeI-70 / I-71 Reconstruct I-70 EB & WB, Reconstruct I-71 NB & SB
I-70 Add third lane from US 68 to SR 72US 35 Super Street ImprovementsUS 35 Widening US 35 by adding a third lane Whalen Blvd. to I-675
I-75 Widening I-75, Interchange improvements to SR 25I-75 Reconstruction of I-75, widening I-75 bridge over Maumee RiverSR 110 New bridge over Maumee River in NapoleonI-475, Dorr Street Widening of I-475 and construction of Dorr St. Interchange
US 20 / SR 113 Widening of Center Ridge Road to five lanesLima Rail Grade Construction of Rail Grade Separation
Statewide
Cincinnati
Cleveland-Akron
Columbus
Dayton
Toledo

4 Modernizing Ohio’s Transportation System
• The charts below detail needed transportation projects in the state’s largest urban areas and statewide that lack adequate state and local funding to proceed to construction through 2023.
Route Project
Western Hills ViaductEastern & Western approach, utility relocation, viaduct repairs and construction, new bridge over Mill Creek and RR, demolition of existing viaduct
I-75Add lane between Paddock and Kemper, bridge over Mill Creek to Galbraith Rd., RR bridge on I-75, Galbraith Rd to Shepherd Ln NB & SB
I-75 Mill Creek ExpressI-75 Brent Spence Bridge Approach work and Ohio share of main span
Eastern CorridorRed Bank Road Expwy, SR 32F, I-275/SR 32 interchange, Old SR 74 improvements and overpass, Clepper extension, new Bach Buxton Interchange, WB third lane, Glen Este Withamville ramps and overpass, EB ramp to Clepper Ln.
I-76/ I-77 / SR 8 I-77 widening and interchange improvements, Central Interchange reconstructionUS 30 Relocate US 30 from Trump Avenue to SR 44
Cleveland InnerbeltRelocate CSX & NS RR bridges, reconstruct bridge near SR 2 and near I-77, modify/relocate I-90 and SR 2 interchange, relocate EB & WB I-90 from I-77 to SR 2, reconstruct I-71 from SR 176 to I-90
I-270 South Outerbelt Modify interchanges at I-270/I-71/Stringtown and I-270/23I-70 Far East Freeway Ramp from SB I-270 to EB I-70, Brice Road interchange improvementsI-71/Big Walnut Road New interchange at Big Walnut and widening of I-71US 36/SR 37 Widening of US 36/SR 37 and replacement of rail bridgeUS 36/SR 37/I-71 I-71 NB & SB exit ramps and extension of Sunbury Pkwy
I-70/I-71Reconstruct I-70/I-71 East Interchange, reconstruct I-71 from Broad to Main, replace I-70 EB & WB, I-71/I-70/SR 315 interchange
I-70/75 Improve access to Dayton Airport and US 40 interchangeUS 35 New interchange at Valley/Trebein RoadUS 35 Modification of Woodman/SR 835 and Smithville Road interchanges
SR 66/CR 24Relocate SR 66 west of Archbold on CR 24, traffic and engineering studies for widening
I-475 WideningI-475 structure over Monclova Rd, I-475 widening from US 24 to SR 2, I-475/US 20A interchange construction
SR 18 Traffic and engineering studies for wideningChesapeake Bypass Chesapeake Bypass Phase 2
Toledo
Statewide
Cincinnati
Cleveland-Akron
Columbus
Dayton
5 Modernizing Ohio’s Transportation System
IMPACT OF INFLATION ON FEDERAL AND STATE MOTOR FUEL USER FEES Inflation has reduced significantly the buying power of the federal and Ohio motor fuel user fees, which are critical funding sources for Ohio road, highway and bridge repairs and improvements.
• The buying power of the federal 18.4 cents-per-gallon gasoline and 24.4 cents-per-gallon diesel motor fuel user fee, which was last increased in 1993, has had its buying power reduced to 10.7 and 14.2 cents-per-gallon, respectively, due to inflation.
• The buying power of the Ohio 28 cents-per-gallon user fee, which was last increased in 2005, has had
its buying power reduced to 18 cents-per-gallon due to the impact of inflation.
POPULATION, ECONOMIC AND TRAVEL TRENDS Population and economic growth results in increased demands on major roads and highways, leading to increased wear and tear on a state’s transportation system.
• Ohio’s population reached approximately 11.6 million residents in 2016, a two percent increase since 2000. Ohio had eight million licensed drivers in 2016.
• From 2000 to 2016, Ohio’s gross domestic product, a measure of the state’s economic output,
increased by 14 percent, when adjusted for inflation, compared to the national average of 30 percent.
• Vehicle miles traveled (VMT) in Ohio increased by 12 percent from 2000 to 2016 –from 105.9 billion
VMT in 2000 to 118.6 billion VMT in 2016. The rate of vehicle travel growth in Ohio has accelerated since 2013, increasing five percent between 2013 and 2016. By 2040, vehicle travel in Ohio is projected to increase another 20 percent.
OHIO ROAD CONDITIONS A lack of adequate state and local funding has resulted in approximately one-third of major urban roads and highways in Ohio having pavement surfaces in poor or mediocre condition, providing a rough ride and costing motorists in the form of additional vehicle operating costs.
• The pavement data in this report, which is for all arterial and collector roads and highways, is provided by the Federal Highway Administration (FHWA), based on data submitted annually by the Ohio Department of Transportation (ODOT) on the condition of major state and locally maintained roads and highways.
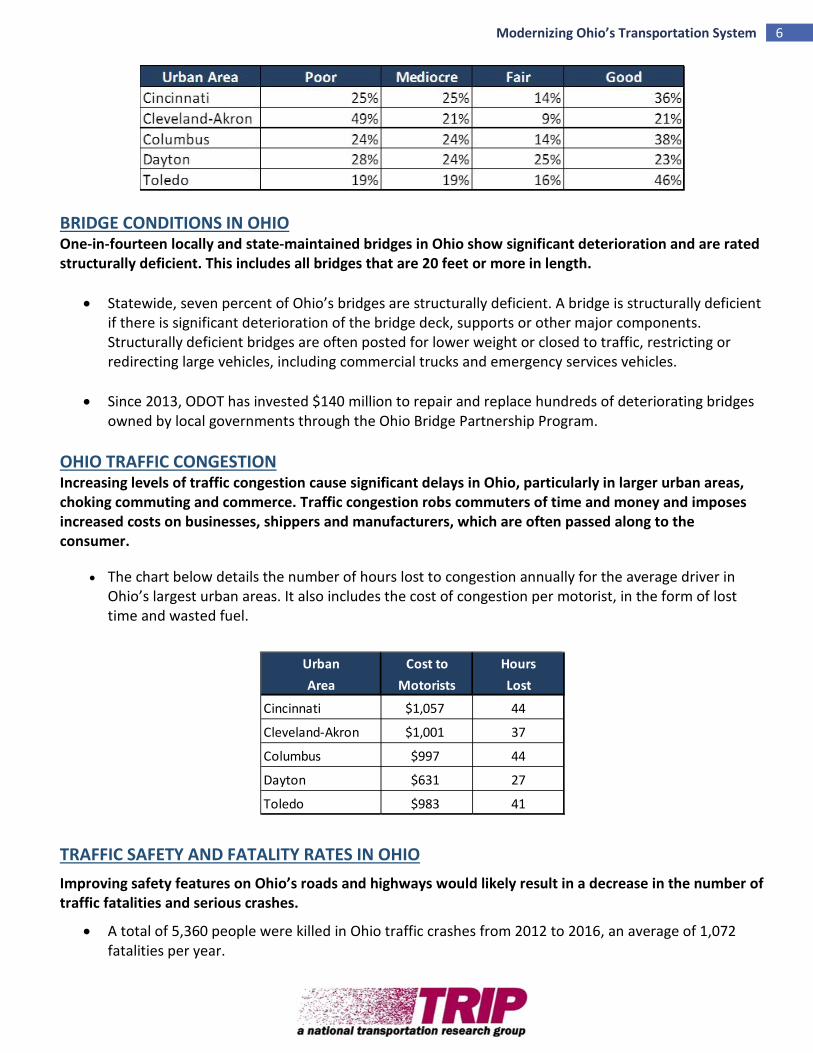
• Twenty-three percent of Ohio’s major locally and state-maintained urban roads and highways have
pavements in poor condition and 12 percent are rated in mediocre condition. Thirteen percent of major urban roads are in fair condition and the remaining 52 percent are rated in good condition.
• The chart below details pavement conditions on major urban roads in the state’s largest urban areas:
6 Modernizing Ohio’s Transportation System
BRIDGE CONDITIONS IN OHIO One-in-fourteen locally and state-maintained bridges in Ohio show significant deterioration and are rated structurally deficient. This includes all bridges that are 20 feet or more in length.
• Statewide, seven percent of Ohio’s bridges are structurally deficient. A bridge is structurally deficient if there is significant deterioration of the bridge deck, supports or other major components. Structurally deficient bridges are often posted for lower weight or closed to traffic, restricting or redirecting large vehicles, including commercial trucks and emergency services vehicles.
• Since 2013, ODOT has invested $140 million to repair and replace hundreds of deteriorating bridges
owned by local governments through the Ohio Bridge Partnership Program. OHIO TRAFFIC CONGESTION Increasing levels of traffic congestion cause significant delays in Ohio, particularly in larger urban areas, choking commuting and commerce. Traffic congestion robs commuters of time and money and imposes increased costs on businesses, shippers and manufacturers, which are often passed along to the consumer.
• The chart below details the number of hours lost to congestion annually for the average driver in Ohio’s largest urban areas. It also includes the cost of congestion per motorist, in the form of lost time and wasted fuel.
TRAFFIC SAFETY AND FATALITY RATES IN OHIO Improving safety features on Ohio’s roads and highways would likely result in a decrease in the number of traffic fatalities and serious crashes.
• A total of 5,360 people were killed in Ohio traffic crashes from 2012 to 2016, an average of 1,072 fatalities per year.
Urban Cost to HoursArea Motorists Lost
Cincinnati $1,057 44
Cleveland-Akron $1,001 37
Columbus $997 44
Dayton $631 27
Toledo $983 41

7 Modernizing Ohio’s Transportation System
• Ohio’s overall traffic fatality rate of 0.95 fatalities per 100 million vehicle miles of travel in 2016 was below the national average of 1.18.
• The fatality rate on Ohio’s non-interstate rural roads in 2016 was approximately two-and-a-half times
higher than on all other roads in the state (1.84 fatalities per 100 million vehicle miles of travel vs. 0.71).
• Several factors are associated with vehicle crashes that result in fatalities, including driver behavior,
vehicle characteristics and roadway features. TRIP estimates that roadway features are likely a contributing factor in approximately one-third of fatal traffic crashes.
• Where appropriate, highway improvements can reduce traffic fatalities and crashes while improving traffic flow to help relieve congestion. Such improvements include removing or shielding obstacles; adding or improving medians; improved lighting; adding rumble strips, wider lanes, wider and paved shoulders; upgrading roads from two lanes to four lanes; and better road markings and traffic signals.
FEDERAL TRANSPORTATION FUNDING IN OHIO The current federal surface transportation program, which expires in 2020, falls far short of providing the level of funding needed to meet the nation’s highway and transit needs. The Trump Administration has released a plan to increase investment in infrastructure, which includes surface transportation, by $1.5 trillion. Boosting federal surface transportation spending will require that Congress provide a long-term and sustainable source of funding to support the federal Highway Trust Fund.
• Signed into law in December 2015, the Fixing America’s Surface Transportation Act (FAST Act), provides modest increases in federal highway and transit spending, allows states greater long-term funding certainty and streamlines the federal project approval process. But, the FAST Act does not provide adequate funding to meet the nation’s need for highway and transit improvements and does not include a long-term and sustainable funding source.
• President Trump released an infrastructure investment plan in February 2018 that would provide
$200 billion in new federal grants and loans over 10 years to leverage $1.5 trillion in total project spending nationwide, relying on state and local governments to raise the additional $1.3 trillion.
TRANSPORTATION AND ECONOMIC GROWTH IN OHIO The efficiency of Ohio’s transportation system, particularly its highways, is critical to the state’s economy. A key component in business efficiency and success is the level and ease of access to customers, markets, materials and workers. The design, construction and maintenance of infrastructure in Ohio is a significant source of employment in the state.
• Annually, $1.1 trillion in goods are shipped to and from sites in Ohio, mostly by truck. • Seventy-eight percent of the goods shipped annually to and from sites in Ohio are carried by trucks
and another 12 percent are carried by courier services or multiple mode deliveries, which include trucking.

8 Modernizing Ohio’s Transportation System
• The design, construction and maintenance of transportation infrastructure in Ohio supports 132,374 full-time jobs across all sectors of the state economy. These workers earn $5.5 billion annually.
• Approximately 2.4 million full-time jobs in Ohio in key industries like tourism, retail sales, agriculture
and manufacturing are dependent on the state’s transportation infrastructure network.
• Increasingly, companies are looking at the quality of a region’s transportation system when deciding where to re-locate or expand. Regions with congested or poorly maintained roads may see businesses relocate to areas with a smoother, more efficient and more modern transportation system.
• Highway accessibility was ranked the number one site selection factor in a 2017 survey of corporate executives by Area Development Magazine. Labor costs and the availability of skilled labor, which are both impacted by a site's level of accessibility, were rated second and third, respectively.
• The Federal Highway Administration estimates that each dollar spent on road, highway and bridge improvements results in an average benefit of $5.20 in the form of reduced vehicle maintenance costs, reduced delays, reduced fuel consumption, improved safety, reduced road and bridge maintenance costs and reduced emissions as a result of improved traffic flow.
Sources of information for this report include the Federal Highway Administration (FHWA), the Ohio Department of Transportation (ODOT), the American Association of State Highway and Transportation Official (AASHTO), the Bureau of Transportation Statistics (BTS), the U. S. Census Bureau, the Congressional Budget Office (CBO), the Texas Transportation Institute (TTI), the American Road & Transportation Builders Association (ARTBA) and the National Highway Traffic Safety Administration (NHTSA). All data used in the report are the most recent available.
9 Modernizing Ohio’s Transportation System
Introduction
Ohio’s roads, highways and bridges form vital transportation links for the state’s residents, visitors
and businesses, providing daily access to homes, jobs, shopping, natural resources and recreation.
Modernizing Ohio’s transportation system is critical to providing mobility and economic competitiveness in
the Buckeye State.
Supporting quality of life and a robust economy in Ohio requires that the state provide a safe,
efficient and well-maintained transportation system. Inadequate transportation investment, which will
result in deteriorated transportation facilities and diminished access and safety, will negatively affect
economic competitiveness and reduce access and mobility in Ohio.
To maintain its level of economic competitiveness and achieve further economic growth, Ohio will
need to maintain and modernize its roads, highways and bridges by improving the physical condition of the
transportation network and enhancing the system’s ability to provide efficient, reliable and safe mobility for
residents, visitors and businesses. Making needed improvements to Ohio’s roads, highways, bridges and
transit systems could also provide a significant boost to the state’s economy by creating jobs in the short
term and stimulating long-term economic growth as a result of enhanced mobility and access.
This report examines the condition, use and safety of Ohio’s roads, highways and bridges and future
mobility needs. Sources of information for this report include the Ohio Department of Transportation
(ODOT), the Federal Highway Administration (FHWA), the American Association of State Highway and
Transportation Officials (AASHTO), the Bureau of Transportation Statistics (BTS), the U.S. Census Bureau, the
Texas Transportation Institute (TTI), the American Road & Transportation Builders Association (ARTBA) and
the National Highway Traffic Safety Administration (NHTSA).

10 Modernizing Ohio’s Transportation System
Population, Travel and Economic Trends
Ohio residents and businesses require a high level of personal and commercial mobility. Population
increases and economic growth in Ohio have resulted in an increase in vehicle miles of travel (VMT) and an
increase in the demand for mobility. To foster quality of life and spur continued economic growth in Ohio, it
will be critical that the state provide a safe and modern transportation system that can accommodate future
growth in population, tourism, business, recreation and vehicle travel.
Ohio’s population grew to approximately 11.6 million residents in 2016, a two percent increase since
2000.1 Ohio had eight million licensed drivers in 2016.2
From 2000 to 2016, Ohio’s gross domestic product (GDP), a measure of the state’s economic output,
increased by 14 percent, when adjusted for inflation. U.S. GDP increased 30 percent during this period.
From 2000 to 2016, annual VMT in Ohio increased by 12 percent, from 105.9 billion miles traveled
annually to 118.6 billion miles traveled annually.3 The rate of vehicle travel growth in Ohio has accelerated
significantly since 2013, increasing by five percent between 2013 and 2016.4 By 2040, vehicle travel in Ohio
is projected to increase another 20 percent.5
Condition of Ohio’s Roads
The life cycle of Ohio’s roads is greatly affected by the state and local governments’ ability to perform
timely maintenance and upgrades to ensure that road and highway surfaces last as long as possible.
The pavement data in this report, which is for all arterial and collector roads and highways, is
provided by the Federal Highway Administration (FHWA), based on data submitted annually by ODOT on the
condition of major state and locally maintained roads and highways. Pavement data for Interstate highways
and other principal arterials is collected for all system mileage, whereas pavement data for minor arterial

11 Modernizing Ohio’s Transportation System
and all collector roads and highways is based on sampling portions of roadways as prescribed by FHWA to
insure that the data collected is adequate to provide an accurate assessment of pavement conditions on
these roads and highways.
Statewide, nearly one-third of Ohio’s major roads are in poor or mediocre condition. Eighteen
percent of Ohio’s major locally and state-maintained roads are in poor condition and 12 percent are in
mediocre condition.6 Fifteen percent are in fair condition and the remaining 55 percent are in good
condition.7
Twenty-three percent of Ohio’s major locally and state-maintained urban roads and highways have
pavements rated in poor condition and twelve percent are in mediocre condition.8 Thirteen percent of
Ohio’s major urban roads are rated in fair condition and the remaining 52 percent are rated in good
condition.9
Twelve percent of Ohio’s major locally and state-maintained rural roads and highways have
pavements rated in poor condition and 13 percent are in mediocre condition.10 Seventeen percent of Ohio’s
major rural roads are rated in fair condition and the remaining 59 percent are rated in good condition.11
The chart below details pavement conditions on major urban roads in the state’s largest urban
areas.12
Chart 1. Pavement conditions on major roads in Ohio’s largest urban areas.
Source: TRIP analysis of Federal Highway Administration data.
Pavement failure is caused by a combination of traffic, moisture and climate. Moisture often works
its way into road surfaces and the materials that form the road’s foundation. Road surfaces at intersections
Urban Area Poor Mediocre Fair GoodCincinnati 25% 25% 14% 36%Cleveland-Akron 49% 21% 9% 21%Columbus 24% 24% 14% 38%Dayton 28% 24% 25% 23%Toledo 19% 19% 16% 46%

12 Modernizing Ohio’s Transportation System
are even more prone to deterioration because the slow-moving or standing loads occurring at these sites
subject the pavement to higher levels of stress. It is critical that roads are fixed before they require major
repairs because reconstructing roads costs approximately four times more than resurfacing them.13 As roads
and highways continue to age, they will reach a point of deterioration where routine paving and
maintenance will not be adequate to keep pavement surfaces in good condition and costly reconstruction of
the roadway and its underlying surfaces will become necessary.
Chart 2. Pavement Condition Cycle Time with Treatment and Cost
Source: North Carolina Department of Transportation (2016). 2016 Maintenance Operations and Performance Analysis Report
Long-term repair costs increase significantly when road and
bridge maintenance is deferred, as road and bridge deterioration
accelerates later in the service life of a transportation facility and
requires more costly repairs. A report on maintaining pavements
found that every $1 of deferred maintenance on roads and bridges
costs an additional $4 to $5 in needed future repairs.14

13 Modernizing Ohio’s Transportation System
The Costs to Motorists of Roads in Deteriorated Condition
TRIP has calculated the additional cost to motorists of driving on roads in poor, mediocre or fair
condition. When roads are in poor, mediocre or fair condition – which may include potholes, rutting or
rough surfaces – the cost to operate and maintain a vehicle increases. These additional vehicle operating
costs (VOC) include accelerated vehicle depreciation, additional vehicle repair costs, increased fuel
consumption and increased tire wear. TRIP estimates that additional VOC borne by Ohio motorists as a
result of deteriorated road conditions is $3.5 billion annually, or $436 per driver.15 The costs are typically
higher in the state’s largest urban areas. The chart below details the annual VOC per driver in the state’s
largest urban areas.
Chart 3. Average annual vehicle operating cost per driver.
Source: TRIP.
Additional vehicle operating costs have been calculated in the Highway Development and
Management Model (HDM), which is recognized by the U.S. Department of Transportation and more than
100 other countries as the definitive analysis of the impact of road conditions on vehicle operating costs. The
HDM report is based on numerous studies that have measured the impact of various factors, including road
conditions, on vehicle operating costs.16
The HDM study found that road deterioration increases ownership, repair, fuel and tire costs. The
report found that deteriorated roads accelerate the pace of depreciation of vehicles and the need for repairs
because the stress on the vehicle increases in proportion to the level of roughness of the pavement surface.
Urban Area VOCCincinnati $574Cleveland-Akron $873Columbus $557Dayton $649Toledo $468OHIO STATEWIDE $3.5 Billion

14 Modernizing Ohio’s Transportation System
Similarly, tire wear and fuel consumption increase as roads deteriorate since there is less efficient transfer of
power to the drive train and additional friction between the road and the tires.
TRIP’s additional VOC estimate is based on taking the average number of miles driven annually by a
motorist, calculating current VOC based on AAA’s 2017 VOC and then using the HDM model to estimate the
additional VOC paid by drivers as a result of substandard roads.17 Additional research on the impact of road
conditions on fuel consumption by the Texas Transportation Institute (TTI) is also factored in to TRIP’s
vehicle operating cost methodology.
Bridge Conditions in Ohio
Ohio’s bridges form key links in the state’s highway system, providing communities and individuals
access to employment, schools, shopping and medical facilities, and facilitating commerce and access for
emergency vehicles.
Seven percent of Ohio’s locally and state maintained bridges are rated as structurally deficient.18 A
bridge is structurally deficient if there is significant deterioration of the bridge deck, supports or other major
components. Bridges that are structurally deficient may be posted for lower weight limits or closed if their
condition warrants such action. Deteriorated bridges can have a significant impact on daily life. Restrictions
on vehicle weight may cause many vehicles – especially emergency vehicles, commercial trucks, school
buses and farm equipment – to use alternate routes to avoid posted bridges. Redirected trips also lengthen
travel time, waste fuel and reduce the efficiency of the local economy.
Since 2013, ODOT has invested $140 million to repair and replace hundreds of deteriorating bridges
owned by local governments through the Ohio Bridge Partnership Program.19
15 Modernizing Ohio’s Transportation System
The service life of bridges can be extended by performing routine maintenance such as resurfacing
decks, painting surfaces, insuring that a facility has good drainage and replacing deteriorating components.
But, most bridges will eventually require more costly reconstruction or major rehabilitation to remain
operable.
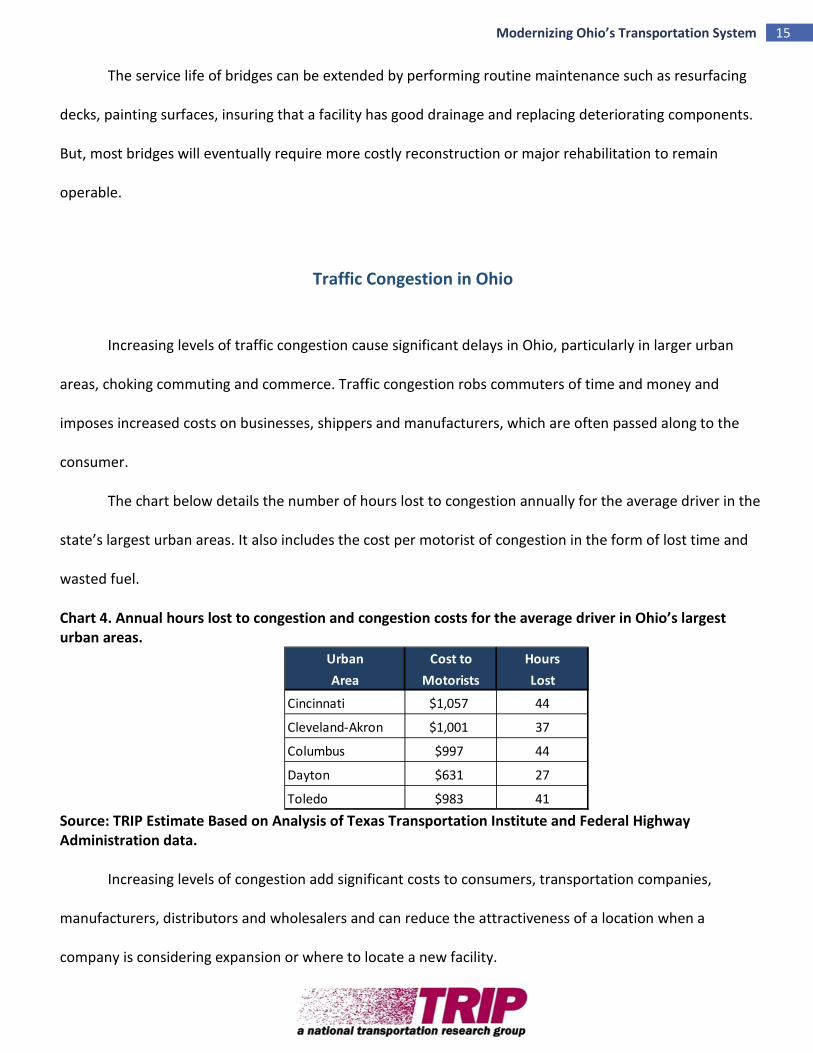
Traffic Congestion in Ohio
Increasing levels of traffic congestion cause significant delays in Ohio, particularly in larger urban
areas, choking commuting and commerce. Traffic congestion robs commuters of time and money and
imposes increased costs on businesses, shippers and manufacturers, which are often passed along to the
consumer.
The chart below details the number of hours lost to congestion annually for the average driver in the
state’s largest urban areas. It also includes the cost per motorist of congestion in the form of lost time and
wasted fuel.
Chart 4. Annual hours lost to congestion and congestion costs for the average driver in Ohio’s largest urban areas.
Source: TRIP Estimate Based on Analysis of Texas Transportation Institute and Federal Highway Administration data.
Increasing levels of congestion add significant costs to consumers, transportation companies,
manufacturers, distributors and wholesalers and can reduce the attractiveness of a location when a
company is considering expansion or where to locate a new facility.
Urban Cost to HoursArea Motorists Lost
Cincinnati $1,057 44
Cleveland-Akron $1,001 37
Columbus $997 44
Dayton $631 27
Toledo $983 41

16 Modernizing Ohio’s Transportation System
Traffic Safety in Ohio
A total of 5,360 people were killed in Ohio traffic crashes from 2012 to 2016, an average of 1,072
fatalities per year.20
Chart 5. Traffic Fatalities in Ohio from 2012 – 2016.
Source: National Highway Traffic Safety Administration.
Three major factors are associated with fatal vehicle crashes: driver behavior, vehicle characteristics
and roadway features. It is estimated that roadway features are likely a contributing factor in approximately
one-third of fatal traffic crashes. Roadway features that impact safety include the number of lanes, lane
widths, lighting, lane markings, rumble strips, shoulders, guard rails, other shielding devices, median barriers
and intersection design.
Ohio’s overall traffic fatality rate of 0.95 fatalities per 100 million vehicle miles of travel in 2016 is
lower than the national average of 1.18.21 The traffic fatality rate on the state’s rural roads is
disproportionately high. The fatality rate on Ohio’s non-interstate rural roads in 2016 was approximately
two-and-a-half times that on all other roads in the state (1.84 fatalities per 100 million vehicle miles of travel
vs. 0.71).22
Improving safety on Ohio’s roadways can be achieved through further improvements in vehicle
safety; improvements in driver, pedestrian, and bicyclist behavior; and a variety of improvements in
roadway safety features.
Year Fatalities2012 1,1232013 9892014 1,0062015 1,1102016 1,132
TOTAL 5,360

17 Modernizing Ohio’s Transportation System
The severity of traffic crashes could be reduced through roadway improvements, where appropriate,
such as adding turn lanes, removing or shielding obstacles, adding or improving medians, widening lanes,
widening and paving shoulders, improving intersection layout, and providing better road markings and
upgrading or installing traffic signals. Roads with poor geometry, with insufficient clear distances, without
turn lanes, having inadequate shoulders for the posted speed limits, or poorly laid out intersections or
interchanges, pose greater risks to motorists, pedestrians and bicyclists.
Investments in rural traffic safety have been found to result in significant reductions in serious traffic
crashes. A 2012 report by TTI found that improvements completed recently by TxDOT that widened lanes,
improved shoulders and made other safety improvements on 1,159 miles of rural state roadways resulted in
133 fewer fatalities on these roads in the first three years after the improvements were completed (as
compared to the three years prior).23 TTI estimates that the improvements on these roads are likely to save
880 lives over 20 years.24
Transportation Funding in Ohio and Needed Projects
Investment in Ohio’s roads, highways and bridges is funded by local, state and federal governments.
The largest source of federal and state road, bridge and highway funding in Ohio is the federal and state
motor fuel user fees. The buying power of both the federal and state motor fuel user fee have been
significantly eroded due to inflation. The buying power of the federal 18.4 cents-per-gallon gasoline and
24.4 cents-per-gallon diesel motor fuel user fee, which was last increased in 1993, has had its buying power
reduced to 10.7 and 14.2 cents-per-gallon, respectively, due to the impact of inflation.25 Similarly, the
buying power of the Ohio 28 cents-per-gallon user fee, which was last increased in 2005, has been reduced
to 18 cents-per-gallon as a result of inflation.26

18 Modernizing Ohio’s Transportation System
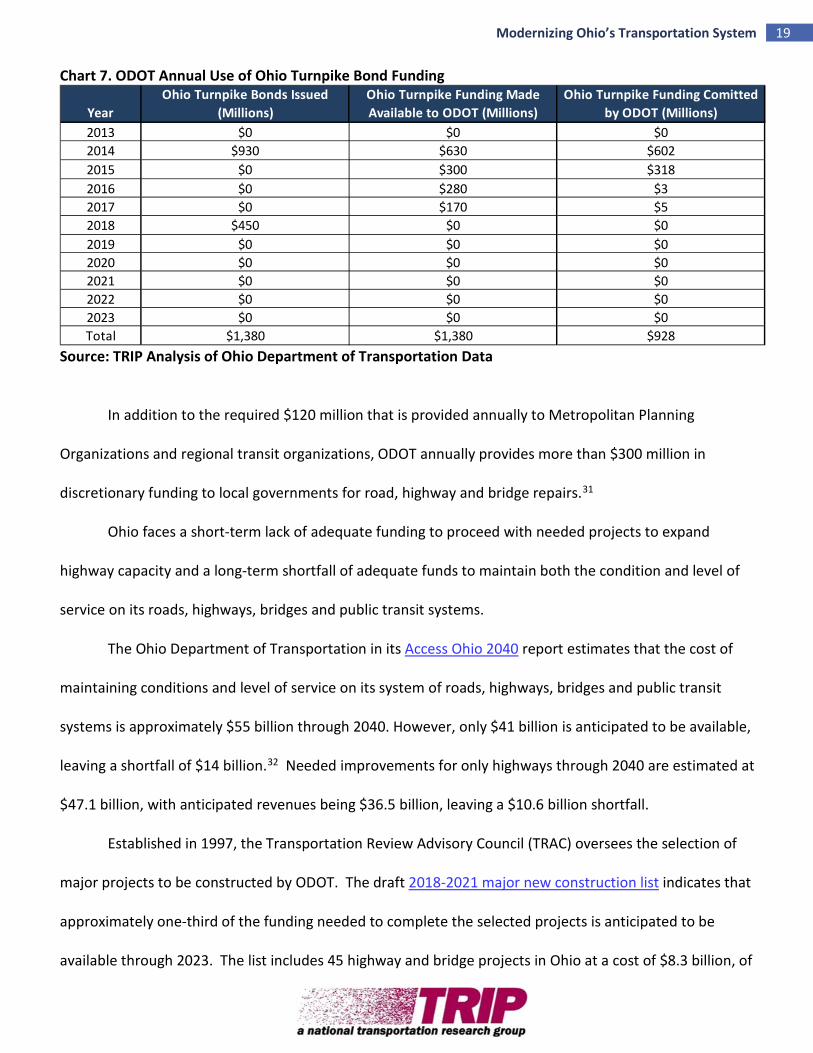
In 2013 the Ohio General Assembly approved the use of Ohio Turnpike bond proceeds with the
provision that 90 percent of the revenue be used on transportation projects within 75 miles of the Turnpike.
This helped boost ODOT’s construction investment in its roads, highways and bridges from approximately $2
billion in 2017 to $2.35 billion in 2018.27
Chart 6. ODOT Annual Investment in Road, Highway and Bridge Repairs
Source: Ohio Department of Transportation Starting in 2014, $1.38 billion in Ohio Turnpike bond proceeds have been made available to ODOT,
which to date has committed $928 million to transportation projects.28 The remaining $452 million in Ohio
Turnpike bond proceeds are available to ODOT to commit to transportation projects in fiscal years 2018 and
2019.29 ODOT does not anticipate any additional revenue from Ohio Turnpike bond proceeds, and
investment in the state’s roads, highways and bridges is set to decrease to $1.85 billion in 2019, dropping to
$1.7 billion in 2021. 30
YearConstruction Funding Including
Turnpike Funding (Millions)2013 $1,8532014 $2,4212015 $2,4292016 $1,9352017 $1,9922018 $2,3502019 $1,8582020 $1,8212021 $1,7002022 $1,7002023 $1,700
19 Modernizing Ohio’s Transportation System
Chart 7. ODOT Annual Use of Ohio Turnpike Bond Funding
Source: TRIP Analysis of Ohio Department of Transportation Data
In addition to the required $120 million that is provided annually to Metropolitan Planning
Organizations and regional transit organizations, ODOT annually provides more than $300 million in
discretionary funding to local governments for road, highway and bridge repairs.31
Ohio faces a short-term lack of adequate funding to proceed with needed projects to expand
highway capacity and a long-term shortfall of adequate funds to maintain both the condition and level of
service on its roads, highways, bridges and public transit systems.
The Ohio Department of Transportation in its Access Ohio 2040 report estimates that the cost of
maintaining conditions and level of service on its system of roads, highways, bridges and public transit
systems is approximately $55 billion through 2040. However, only $41 billion is anticipated to be available,
leaving a shortfall of $14 billion.32 Needed improvements for only highways through 2040 are estimated at
$47.1 billion, with anticipated revenues being $36.5 billion, leaving a $10.6 billion shortfall.
Established in 1997, the Transportation Review Advisory Council (TRAC) oversees the selection of
major projects to be constructed by ODOT. The draft 2018-2021 major new construction list indicates that
approximately one-third of the funding needed to complete the selected projects is anticipated to be
available through 2023. The list includes 45 highway and bridge projects in Ohio at a cost of $8.3 billion, of
YearOhio Turnpike Bonds Issued
(Millions)Ohio Turnpike Funding Made Available to ODOT (Millions)
Ohio Turnpike Funding Comitted by ODOT (Millions)
2013 $0 $0 $02014 $930 $630 $6022015 $0 $300 $3182016 $0 $280 $32017 $0 $170 $52018 $450 $0 $02019 $0 $0 $02020 $0 $0 $02021 $0 $0 $02022 $0 $0 $02023 $0 $0 $0Total $1,380 $1,380 $928

20 Modernizing Ohio’s Transportation System
which $2.5 billion in state and local funding is anticipated to be available through 2023, leaving
approximately $5.8 billion unfunded.
The charts below detail needed transportation projects in the state’s largest urban areas and
statewide that have adequate state and local funding identified to proceed by 2023.
Chart 7. Projects that will be completed or underway by 2023
Source: Transportation Review Advisory Council The charts below detail needed transportation projects in the state’s largest urban areas and
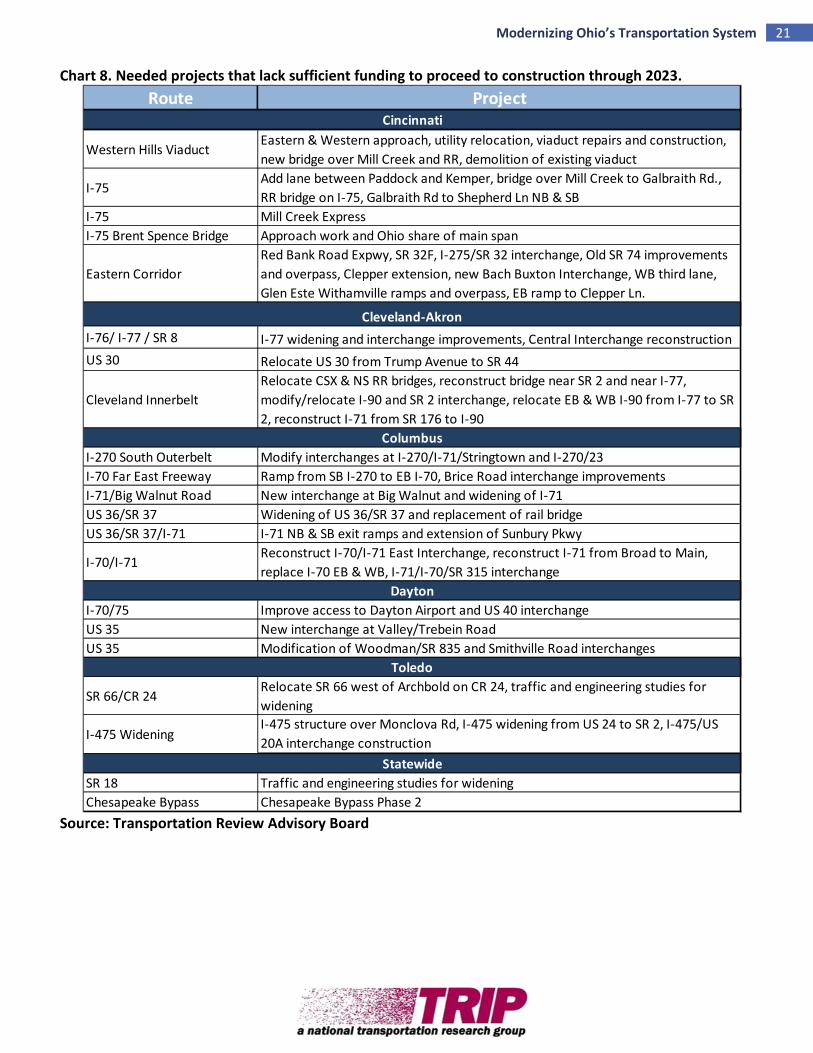
statewide that lack adequate state and local funding to proceed to construction through 2023.
Route Project
I-75 Widening Hopple Street to Mitchell (Two Phases)
Cleveland Innerbelt Replace mainline structure over I-490I-680 to SR 164 Construction of Interchange Ramps Opportunity Corridor Development, construction of roadway from E 55th St to E 93rd St, new alignmentCleveland Innerbelt Declaration lane on I-71 to SR 176 ExitCleveland Innerbelt Improve I-90 Central Interchange area
Mid-Ohio Intermodal Center Construction of SR 309 RR overpass over CSX spurI-70 / I-71 Relocate City of Columbus powerline in I-70/71 corridorI-70 / I-71 Reconstruct and widen East Freeway InterchangeUS 33/SR 161 / Post Road Interchange ImprovementsUS 36 / SR 37 / I-71 Construction of new interchange (South)I-70 / I-71 Reconstruct and widen I-71 and Broad Street BridgeI-70 / I-71 Reconstruct I-70 EB & WB, Reconstruct I-71 NB & SB
I-70 Add third lane from US 68 to SR 72US 35 Super Street ImprovementsUS 35 Widening US 35 by adding a third lane Whalen Blvd. to I-675
I-75 Widening I-75, Interchange improvements to SR 25I-75 Reconstruction of I-75, widening I-75 bridge over Maumee RiverSR 110 New bridge over Maumee River in NapoleonI-475, Dorr Street Widening of I-475 and construction of Dorr St. Interchange
US 20 / SR 113 Widening of Center Ridge Road to five lanesLima Rail Grade Construction of Rail Grade Separation
Statewide
Cincinnati
Cleveland-Akron
Columbus
Dayton
Toledo
21 Modernizing Ohio’s Transportation System
Chart 8. Needed projects that lack sufficient funding to proceed to construction through 2023.
Source: Transportation Review Advisory Board
Route Project
Western Hills ViaductEastern & Western approach, utility relocation, viaduct repairs and construction, new bridge over Mill Creek and RR, demolition of existing viaduct
I-75Add lane between Paddock and Kemper, bridge over Mill Creek to Galbraith Rd., RR bridge on I-75, Galbraith Rd to Shepherd Ln NB & SB
I-75 Mill Creek ExpressI-75 Brent Spence Bridge Approach work and Ohio share of main span
Eastern CorridorRed Bank Road Expwy, SR 32F, I-275/SR 32 interchange, Old SR 74 improvements and overpass, Clepper extension, new Bach Buxton Interchange, WB third lane, Glen Este Withamville ramps and overpass, EB ramp to Clepper Ln.
I-76/ I-77 / SR 8 I-77 widening and interchange improvements, Central Interchange reconstructionUS 30 Relocate US 30 from Trump Avenue to SR 44
Cleveland InnerbeltRelocate CSX & NS RR bridges, reconstruct bridge near SR 2 and near I-77, modify/relocate I-90 and SR 2 interchange, relocate EB & WB I-90 from I-77 to SR 2, reconstruct I-71 from SR 176 to I-90
I-270 South Outerbelt Modify interchanges at I-270/I-71/Stringtown and I-270/23I-70 Far East Freeway Ramp from SB I-270 to EB I-70, Brice Road interchange improvementsI-71/Big Walnut Road New interchange at Big Walnut and widening of I-71US 36/SR 37 Widening of US 36/SR 37 and replacement of rail bridgeUS 36/SR 37/I-71 I-71 NB & SB exit ramps and extension of Sunbury Pkwy
I-70/I-71Reconstruct I-70/I-71 East Interchange, reconstruct I-71 from Broad to Main, replace I-70 EB & WB, I-71/I-70/SR 315 interchange
I-70/75 Improve access to Dayton Airport and US 40 interchangeUS 35 New interchange at Valley/Trebein RoadUS 35 Modification of Woodman/SR 835 and Smithville Road interchanges
SR 66/CR 24Relocate SR 66 west of Archbold on CR 24, traffic and engineering studies for widening
I-475 WideningI-475 structure over Monclova Rd, I-475 widening from US 24 to SR 2, I-475/US 20A interchange construction
SR 18 Traffic and engineering studies for wideningChesapeake Bypass Chesapeake Bypass Phase 2
Toledo
Statewide
Cincinnati
Cleveland-Akron
Columbus
Dayton

22 Modernizing Ohio’s Transportation System
Federal Transportation Funding
Investment in Ohio’s roads, highways and bridges is funded by local, state and federal governments.
A lack of sufficient funding at all levels will make it difficult to adequately maintain and improve the state’s
existing transportation system.
The federal government is a critical source of funding for Ohio’s roads, highways, bridges and transit
systems and provides a significant return to Ohio in road and bridge funding based on the revenue
generated in the state by the federal motor fuel tax.
Most federal funds for highway and transit improvements in Ohio are provided by federal highway
user fees, largely an 18.4 cents-per-gallon tax on gasoline and a 24.4 cents-per-gallon tax on diesel fuel.
Since 2008 revenue into the federal Highway Trust Fund has been inadequate to support legislatively set
funding levels so Congress has transferred approximately $53 billion in general funds and an additional $2
billion from a related trust fund into the federal Highway Trust Fund.33
Signed into law in December 2015, the Fixing America’s Surface Transportation Act (FAST Act),
provides modest increases in federal highway and transit spending. The five-year bill also provides states
with greater funding certainty and streamlines the federal project approval process. But, the FAST Act does
not provide adequate funding to meet the nation’s need for highway and transit improvements and does
not include a long-term and sustainable funding source.
The five-year, $305 billion FAST Act will provide a boost of approximately 15 percent in highway
funding and 18 percent in transit funding over the duration of the program, which expires in 2020.34 In
addition to federal motor fuel tax revenues, the FAST Act will also be funded by $70 billion in U.S. general
funds, which will rely on offsets from several unrelated federal programs including the Strategic Petroleum
Reserve, the Federal Reserve and U.S. Customs.

23 Modernizing Ohio’s Transportation System
President Trump released an infrastructure investment plan in February 2018 that would provide
$200 billion in new federal grants and loans over 10 years to leverage $1.5 trillion in total project spending
nationwide on infrastructure, including surface transportation. The Trump administration’s funding
proposal would rely on state and local governments to raise the additional $1.3 trillion to access the
increased federal funding. Boosting federal surface transportation spending will require that Congress
provide a long-term and sustainable source of funding to support the federal Highway Trust Fund.
Importance of Transportation to Economic Growth
Today’s culture of business demands that an area have well-maintained and efficient roads, highways
and bridges if it is to remain economically competitive. Global communications and the impact of free trade
in North America and elsewhere have resulted in a significant increase in freight movement, making the
quality of a region’s transportation system a key component in a business’s ability to compete locally,
nationally and internationally.
Businesses have responded to improved communications and the need to cut costs with a variety of
innovations including just-in-time delivery, increased small package delivery, demand-side inventory
management and e-commerce. The result of these changes has been a significant improvement in logistics
efficiency as firms move from a push-style distribution system, which relies on large-scale warehousing of
materials, to a pull-style distribution system, which relies on smaller, more strategic movement of goods.
These improvements have made mobile inventories the norm, resulting in the nation’s trucks literally
becoming rolling warehouses.
Highways are vitally important to continued economic development in Ohio, particularly to the
state’s manufacturing, agriculture and tourism industries. As the economy expands, creating more jobs and

24 Modernizing Ohio’s Transportation System
increasing consumer confidence, the demand for consumer and business products grows. In turn,
manufacturers ship greater quantities of goods to market to meet this demand, a process that adds to truck
traffic on the state’s highways and major arterial roads.
Every year, approximately $1.1 trillion in goods are
shipped to and from sites in Ohio, mostly by trucks.35
Seventy-eight percent of the goods shipped annually to and
from sites in Ohio are carried by trucks and another 12
percent are carried by courier services or multiple-mode
deliveries, which include trucking.36
The design, construction and maintenance of
transportation infrastructure in Ohio play a critical role in the
state’s economy, supporting the equivalent of 132,374 full-
time jobs across all sectors of the state economy, earning these workers approximately $5.5 billion
annually.37 These jobs include 65,944 full-time jobs directly involved in transportation infrastructure
construction and related activities as well as 66,430 full-time jobs as a result of spending by employees and
companies in the transportation design and construction industry.38
Transportation construction in Ohio annually contributes an estimated $1.0 billion in state and local
income, corporate and unemployment insurance taxes and the federal payroll tax.
Approximately 2.4 million full-time jobs in Ohio in key industries like tourism, retail sales, agriculture
and manufacturing are dependent on the quality, safety and reliability of the state’s transportation
infrastructure network. These workers earn $95.0 billion in wages and contribute an estimated $17.3 billion
in state and local income, corporate and unemployment insurance taxes and the federal payroll tax.39

25 Modernizing Ohio’s Transportation System
The cost of road and bridge improvements are more than offset by the reduction of user costs
associated with driving on rough roads, the improvement in business productivity, the reduction in delays
and the improvement in traffic safety. The Federal Highway Administration estimates that each dollar spent
on road, highway and bridge improvements results in an average benefit of $5.20 in the form of reduced
vehicle maintenance costs, reduced delays, reduced fuel consumption, improved safety, reduced road and
bridge maintenance costs and reduced emissions as a result of improved traffic flow.40
Local, regional and state economic performance is improved when a region’s surface transportation
system is expanded or repaired. This improvement comes as a result of the initial job creation and increased
employment created over the long-term because of improved access, reduced transport costs and improved
safety.
Increasingly, companies are looking at the quality of a region’s transportation system when deciding
where to re-locate or expand. Regions with congested or poorly maintained roads may see businesses
relocate to areas with a smoother, more efficient and more modern transportation system. Highway
accessibility was ranked the number one site selection factor in a 2017 survey of corporate executives by
Area Development Magazine. Labor costs and the availability of skilled labor, which are both impacted by a
site's level of accessibility, were rated second and third, respectively.41
Conclusion
It is critical that Ohio is able to provide a well-maintained, safe and efficient 21st century network of
roads, highways, bridges and transit that can accommodate the mobility demands of a modern society.
Providing a modern transportation system in Ohio will require that investment in the state’s roads,
highways, bridges and public transit systems is increased to close the significant shortfall in needed funding.

26 Modernizing Ohio’s Transportation System
With the use of Ohio Turnpike bond proceeds expected to end in 2018 and the Trump administration’s
funding proposal calling for additional state and local funding to be leveraged by federal funding, Ohio will
be called on to increase its investment in its transportation system.
If Ohio is unable to provide an adequate level of transportation investment it risks threatening the
state’s quality of life with a transportation system that lacks adequate resources to ensure an efficient, safe
and well-maintained transportation system.
# # #

27 Modernizing Ohio’s Transportation System
ENDNOTES
1 U.S. Census Bureau (2016). 2 Highway Statistics (2016). Federal Highway Administration. DL-1C 3 U.S. Department of Transportation - Federal Highway Administration: Highway Statistics 2000 and 2016. 4 U.S. Department of Transportation - Federal Highway Administration: Highway Statistics 2013 and 2016. 5 TRIP estimate based on analysis of FHWA and U.S. Census data. 6 Federal Highway Administration (2017). Pavement condition data is for 2016. 7 Ibid. 8 Ibid. 9 Ibid. 10 Ibid. 11 Ibid. 12 Ibid. 13 Selecting a Preventative Maintenance Treatment for Flexible Pavements. R. Hicks, J. Moulthrop. Transportation Research Board. 1999. Figure 1. 14 Pavement Maintenance, by David P. Orr, PE Senior Engineer, Cornell Local Roads Program, March 2006. 15 TRIP calculation. 16 Highway Development and Management: Volume Seven. Modeling Road User and Environmental Effects in HDM-4. Bennett, C. and Greenwood, I. 2000. 17 Your Driving Costs. American Automobile Association. 2017. 18 Federal Highway Administration National Bridge Inventory, 2017. 19 Ohio Department of Transportation (2018). Response to TRIP survey. 20 Federal Highway Administration National Highway Traffic Safety Administration, 2012-2016. 21 TRIP analysis of National Highway Traffic Safety Administration and Federal Highway Administration data (2017). 22 Ibid. 23 Adding Highway Shoulders, Width, Reduce Crash Numbers and Save Lives (August 9, 2012). Texas Transportation Institute. 24 Ibid. 25 TRIP analysis based on Bureau of Economic Analysis CPI index. 26 TRIP analysis based on Ohio Department of Transportation construction cost inflation estimates. 27 Ohio Department of Transportation (2018). Response to TRIP survey. 28 Ibid. 29 Ibid. 30 Ibid. 31 Ohio Department of Transportation (2018). Response to TRIP survey. 32 Ohio Department of Transportation (2014). Access Ohio 2040. https://www.dot.state.oh.us/Divisions/Planning/SPR/StatewidePlanning/access.ohio/AO40_library/ODOTAccessOhio2014.pdf 33 “Surface Transportation Reauthorization and the Solvency of the Highway Trust Fund,” presentation by Jim Tymon, American Association of State Highway and Transportation Officials (2014). 34 2015 “Fixing America’s Surface Transportation Act.” (2015) American Road and Transportation Builders Association. http://www.artba.org/newsline/wp-content/uploads/2015/12/ANALYSIS-FINAL.pdf 35 TRIP analysis of Bureau of Transportation Statistics, U.S. Department of Transportation. 2012 Commodity Flow Survey, State Summaries. 36 Ibid.
28 Modernizing Ohio’s Transportation System
37 American Road & Transportation Builders Association (2015). The 2015 U.S. Transportation Construction Industry Profile. https://www.transportationcreatesjobs.org/pdf/Economic_Profile.pdf 38 Ibid. 39 Ibid. 40 FHWA estimate based on its analysis of 2006 data. For more information on FHWA’s cost-benefit analysis of highway investment, see the 2008 Status of the Nation's Highways, Bridges, and Transit: Conditions and Performance. 41 Area Development Magazine (2018). 32nd Annual Survey of Corporate Executives: Availability of Skilled Labor New Top Priority. http://www.areadevelopment.com/Corporate-Consultants-Survey-Results/Q1-2018/32nd-annual-corporate-survey-14th-annual-consultants-survey.shtml