modelling the local dispersion and deposition of...
TRANSCRIPT

© Crown copyright Met Office
Modelling the Local Dispersion and Deposition of Radionuclides from FukushimaSusan Leadbetter, Andrew Jones, Matthew Hort
Acknowledgments: Helen Webster, Met Office, Roland Draxler, NOAA, WMO Task Team

Talk Outline
• Met Office radiological responsibilities
• Fukushima Dai-ichi incident
• UNSCEAR - WMO Task Team
• NAME modelling
• Wet deposition
• Comparison to observation
© Crown copyright Met Office

Radiological: Responsibilities
• PACRAM• UK, short range (~1-10km) impact
• DECC-MOD Accidents• Impact on UK interests anywhere in world• 5 day forecast within 1 hour• Source identification
• RSMC – IAEA+WMO• Joint (UK + France) lead for Europe
& Africa• Support for entire world
• CTBTO• Global source identification
© Crown copyright Met Office

© Crown copyright Met Office
Fukushima Dai-ichi

© Crown copyright Met Office
Met Office Response to Fukushima
• IAEA
• CTBTO
• Daily NAME model runs for releases of 5 radionuclides with colleagues from
• Health Protection Agency (HPA)
• Food Standards Agency (FSA)
• Office for Nuclear Regulation (ONR)
• Long range forecasts
NAME simulation: Integrated air concentration up to 1200 UTC 21/03/11

© Crown copyright Met Office
UNSCEAR
• Report on Fukushima for 60th session of committee in 2013
• Assessment of radiation risks of Fukushima Dai-ichinuclear power plant accident
• Determine the source
• Look at the atmospheric and oceanic dispersion
• Look at public exposure
• World Meteorological Office task team to look at impacts of meteorology on dispersion of radionuclides

© Crown copyright Met Office
WMO Task Team
• USA, UK, Canada, Japan, Austria
• Ensemble to study impacts of meteorology on dispersion:
• 5 dispersion models
• 5 meteorological models
• Radar rainfall data
• Report available on WMO website: • http://www.wmo.int/pages/prog/www/CBS-
Reports/documents/WMO_fnpp_final_AnnexIII_24Jan.pdf
ATDM-Meteorology
CMC
NOAA
ECMWF
UKMET
JMA
CMC-MLDP0 C C
JMA-RATM C,R
NOAA-HYSPLIT C,R C,R C,R
UKMET-NAME C C C,R
ZAMG-FLEXPART C,R C,R

© Crown copyright Met Office
Dispersion Modelling

© Crown copyright Met Office
Region of Study

© Crown copyright Met Office
Dispersion Modelling I
• Modelled as series of independent 3-hour sources each followed for 72 hours
• Each source has 1Bq/hr release rate
Draxler et al. (2011)
+ + + …

© Crown copyright Met Office
Dispersion Modelling I
• Modelled as series of independent 3-hour sources each followed for 72 hours
• Transfer coefficient matrix. Number of releases (i), number of sampling periods (j), number of grid points (k)
• Source term applied offline
ijkTCM
ijki TCMDQCijk
Release rate
Decay rate
Draxler et al. (2011)

© Crown copyright Met Office
Dispersion Modelling II
• Caesium-137
• Non-sedimenting
• Wet and dry depositing
• Released at Fukushima Dai-ichi at 100m
• Meteorology from Global UM, ECMWF, JMA and radar rainfall
• Output 0-100m air concentration and total deposition at a resolution of 0.05° by 0.05°

© Crown copyright Met Office
Caesium-137 Source Term

© Crown copyright Met Office
Caesium-137 - Modelled
• Deposition high on 15 March
• Combination of wind direction and precipitation
Air Concentration (Bq/m3) Total Deposition (Bq/m2)

© Crown copyright Met Office
Caesium-137 Modelled Deposits: 11-31 March

© Crown copyright Met Office
Caesium-137 Observed Deposits
• MEXT soil sampling (MEXT, 2011)
• US DoE aerial measurements (DoE, 2011)
Cs137 Deposits - Modelled
k Bq/m2

© Crown copyright Met Office
Deposits: Model – Obs.
k Bq/m2

© Crown copyright Met Office
Deposition

© Crown copyright Met Office
Deposition

© Crown copyright Met Office
Wet Deposition
• Removal of material based on depletion equation:
• C is concentration, Λ is the scavenging coefficient, given by:
• r is rainfall rate in mm/h and A and B are coefficients
CdtdC
BAr

© Crown copyright Met Office
Types of Wet Deposition in NAME
In-cloud(Rainout)
Below-cloud(Washout)
In-cloud(Rainout)
Below-cloud(Washout)
Rain
Below-cloud
(washout)
A = 8.4 x 10⁻⁵
B = 0.79
In-cloud (rainout)
A = 3.36 x 10⁻⁴
B = 0.79
BAr

© Crown copyright Met Office
Impact of Varying Scavenging Coefficients

© Crown copyright Met Office
Deposits: Model - Obs.
k Bq/m2
© Crown copyright Met Office
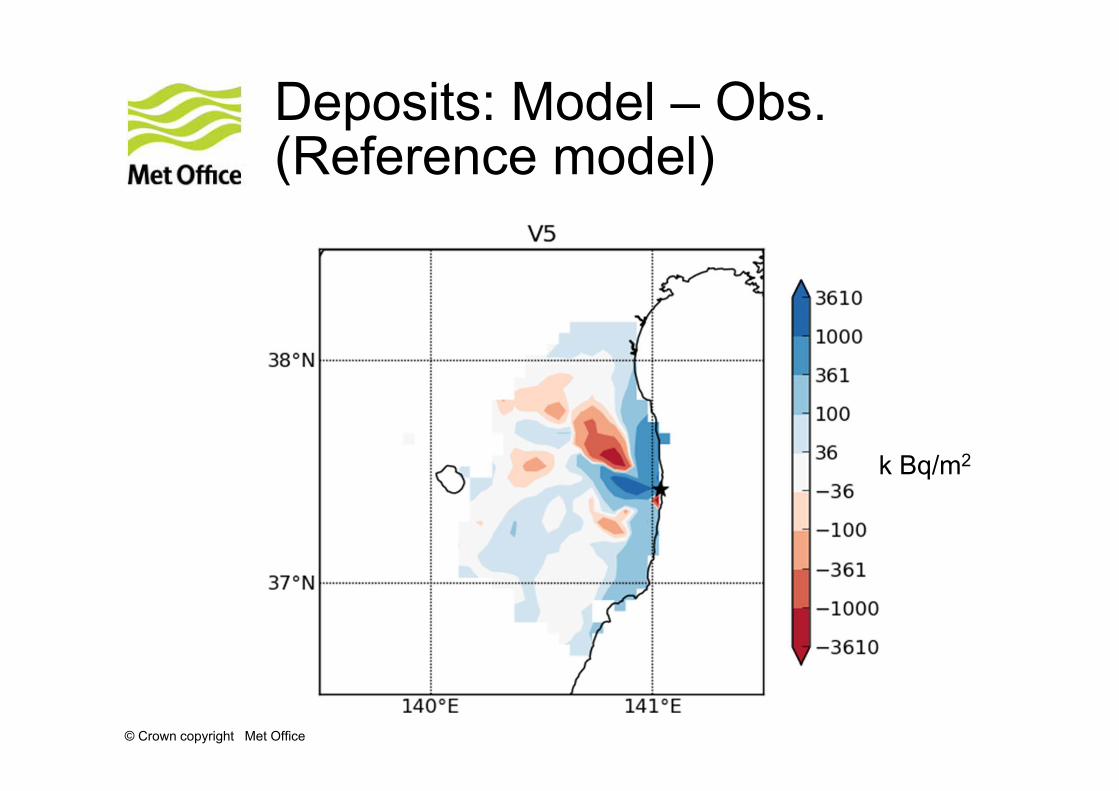
Deposits: Model – Obs.(Reference model)
k Bq/m2

© Crown copyright Met Office
Statistical Comparison
Correlation
00.10.20.30.40.50.60.70.80.9
1
V5a V5b V5c V5d V6a V6b V6c V6d
Fractional Bias
-0.4-0.3-0.2-0.1
00.10.20.30.40.5
V5a V5b V5c V5d V6a V6b V6c V6d
Percent Within a Factor of 2
0
10
20
30
40
50
60
V5a V5b V5c V5d V6a V6b V6c V6d
Kolmogorv-Smirnov Parameter
0
5
10
15
20
25
30
35
V5a V5b V5c V5d V6a V6b V6c V6d
No single “best model”

© Crown copyright Met Office
Air Concentration – Tokai
• Peaks well captured by all models
• Measured air concentration remains high between peaks

© Crown copyright Met Office
Air Concentration - Model versus Observations
• Models show a negative bias

© Crown copyright Met Office
Statistical ComparisonFractional Bias
-1.6-1.4-1.2
-1-0.8-0.6-0.4-0.2
0V5a V5b V5c V5d V6a V6b V6c V6d
Percentage Within factor 2
0
5
10
15
20
25
V5a V5b V5c V5d V6a V6b V6c V6d
• Statistics less robust due to only 41 measurements
• All models have negative bias
• V5a – decreased in-cloud scavenging - performs best in contrast to deposition results

© Crown copyright Met Office
Summary
• Modelled region of deposits compares well to observed deposits
• Predictions very sensitive to specific events/periods
• Current (standard) scavenging coefficients result in positive bias in deposits
• No single “best set” of scavenging coefficients
• Deposition/scavenging data very scarce

© Crown copyright Met Office
Any Questions?