modelling technology adoption decisions by … technology adoption decisions by smallholder cassava...
TRANSCRIPT

Modelling technology adoption decisions by smallholder cassava
producers in East AfricaPaul Mwebaze, Sarina MacFadyen, Andy Hulthen, Paul De Barro-CSIRO, Australia
Anton Bua, Chris Omongo, Andrew Kalyebi-NACCRI, Uganda
Donald Kachigamba-DARS, Malawi
Fred Tairo-MARI, Tanzania
2017 Oceania Stata Users Group Meeting, ANU, Canberra, 29 September

Overview of presentation
• Introduction
• Methodology
• Results and Discussion
• Conclusions and policy implications
• Further work
2

3
0
10
20
30
40
50
60
Niger
ia
Thaila
nd
Indo
nesia
Bra
zil
Gha
na
DR C
ongo
Cam
bodia
India
Ang
ola
Moz
ambiqu
e
Malaw
i
Tanza
nia
Cam
eroo
n
Côte
d'Iv
oire
Mad
agas
car
Uga
nda
Millio
n to
nn
es
Leading cassava producers (FAO, 2014)

Research questions
• What is the current status of cassava production and productivity in Uganda, Tanzania and Malawi?
• What is the current adoption rate of improved cassava production technologies?
• What is the economic impact of B. tabaci on smallholder farmers?
4

Methods
• Literature review
• Questionnaire development• Pre-survey workshops
• Pilot surveys
• Farmer surveys using multi-stage random sampling procedure
• A total of 1200 farmers interviewed
• Econometric modelling
5
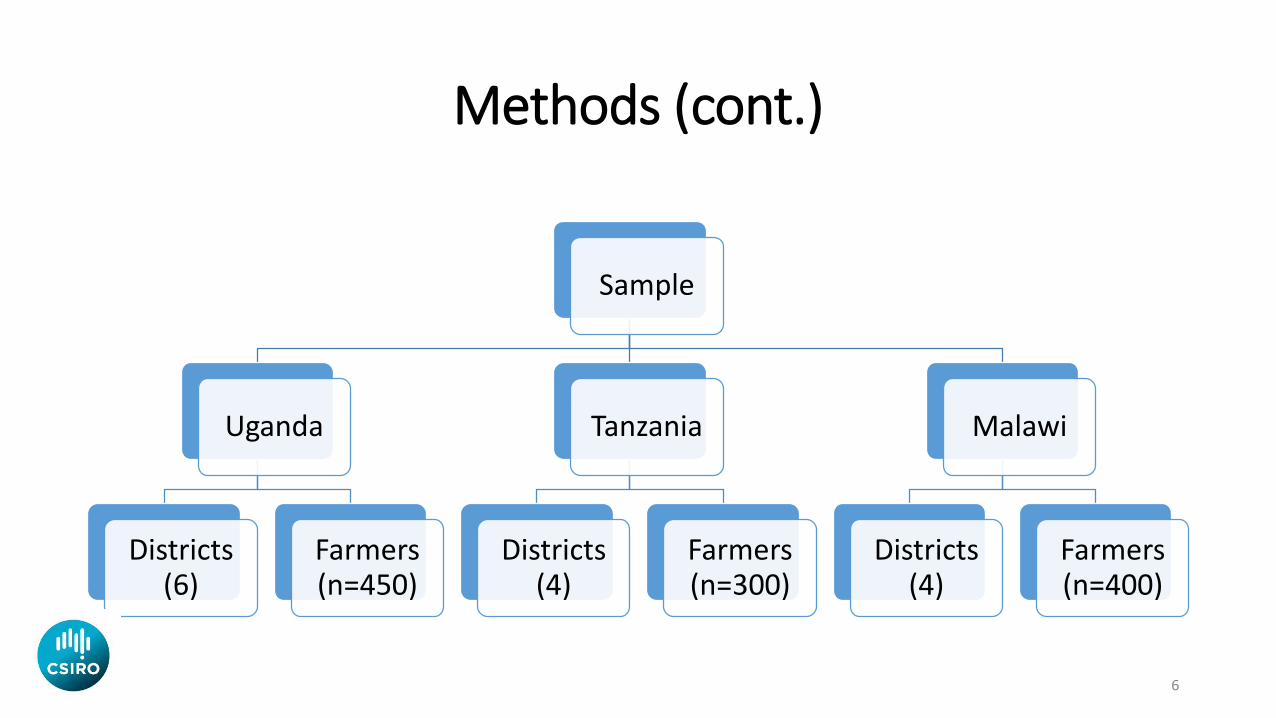
Methods (cont.)
Sample
Uganda
Districts (6)
Farmers (n=450)
Tanzania
Districts (4)
Farmers (n=300)
Malawi
Districts (4)
Farmers (n=400)
6

7

8

9

Multivariate probit model
10
where: m denotes technology choices for household i and plot j. Y*ijm is a latent variable which captures the unobserved preferences for technology m. This latent variable is assumed to be a linear combination of observed plot and household characteristics Xijm, and unobserved characteristics captured by the stochastic error term, εijm. βm is the vector of parameters to be estimated is βm.
)2(
)1(
01
0
'*
*
ijmYif
otherwiseijm
ijmmijmijm
Y
XY
Cappellari L, Jenkins S, 2003. Multivariate probit regression. The Stata Journal 3(3): 278-294

Multivariate probit model (cont.)
11
Ω =
1 𝜌12 𝜌13 … 𝜌1𝑚𝜌12 1 𝜌23 … 𝜌2𝑚𝜌13 𝜌23 1 … 𝜌3𝑚… … … 1 …𝜌1𝑚 𝜌2𝑚 𝜌3𝑚 … 1
where the off-diagonal elements in the covariance matrix, ρjm, represents the unobserved correlation between the stochastic components of the jth and mth technology options. This specification with nonzero diagonal elements allows for correlation across the error terms of several latent equations, whichrepresent unobserved characteristics that affect the choice of technology
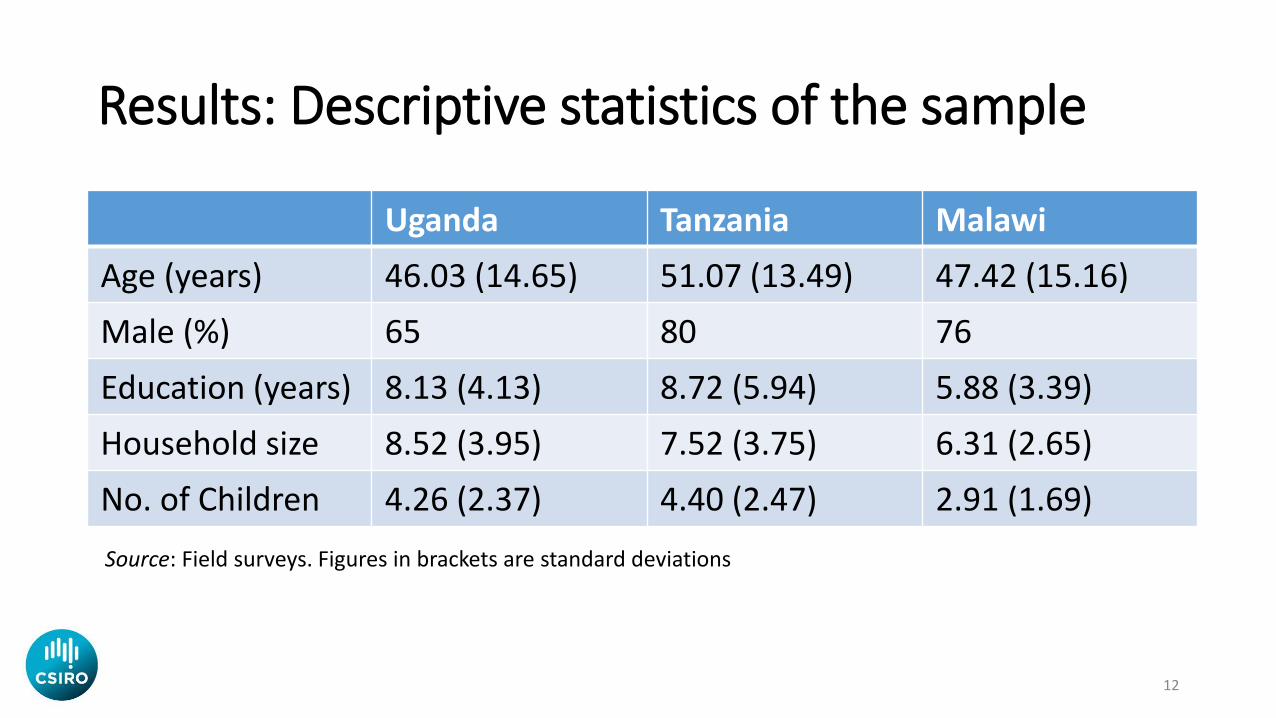
Results: Descriptive statistics of the sample
Uganda Tanzania Malawi
Age (years) 46.03 (14.65) 51.07 (13.49) 47.42 (15.16)
Male (%) 65 80 76
Education (years) 8.13 (4.13) 8.72 (5.94) 5.88 (3.39)
Household size 8.52 (3.95) 7.52 (3.75) 6.31 (2.65)
No. of Children 4.26 (2.37) 4.40 (2.47) 2.91 (1.69)
12
Source: Field surveys. Figures in brackets are standard deviations

Results: Descriptive statistics (cont.)
Uganda Tanzania Malawi
Total land/farm size (acres) 1.90 (1.51) 4.25 (3.54) 1.69 (1.97)
Land under cassava (acres) 1.21 (1.31) 2.46 (1.83) 1.44 (2.19)
Access to credit (%) 16 22 33
Member of organisation (%) 47 43 34
Extension (%) 30 31 45
Source: Field surveys. Figures in brackets are standard deviations
13

Results: Adoption of improved cassava production technologies
Uganda Tanzania Malawi
Inorganic fertiliser (%) 0.0 0.0 3.0
Pesticide use (%) 1.0 2.0 2.0
Improved cassava variety (%) 70 11 51
Intercropping (%) 31 72 36
Plant spacing (%) 70 69 50
No. of Obs. 400 428 400
14
Source: Field surveys
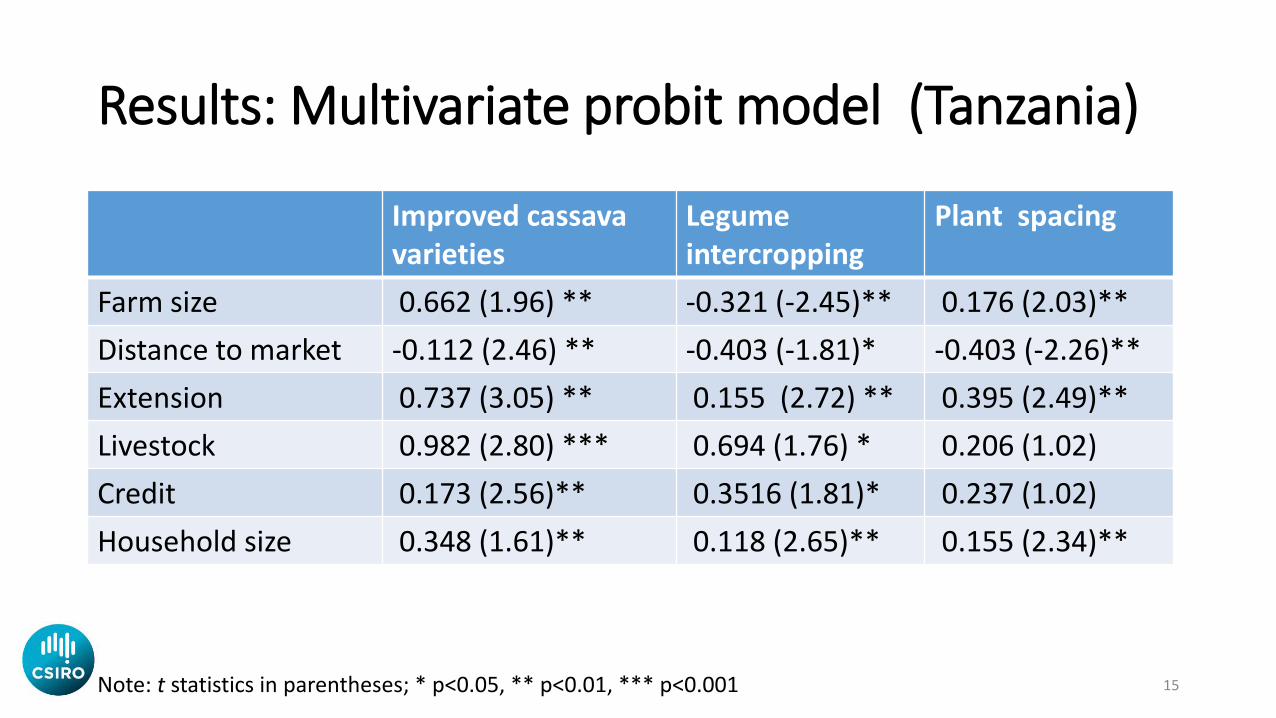
Results: Multivariate probit model (Tanzania)
Improved cassavavarieties
Legumeintercropping
Plant spacing
Farm size 0.662 (1.96) ** -0.321 (-2.45)** 0.176 (2.03)**
Distance to market -0.112 (2.46) ** -0.403 (-1.81)* -0.403 (-2.26)**
Extension 0.737 (3.05) ** 0.155 (2.72) ** 0.395 (2.49)**
Livestock 0.982 (2.80) *** 0.694 (1.76) * 0.206 (1.02)
Credit 0.173 (2.56)** 0.3516 (1.81)* 0.237 (1.02)
Household size 0.348 (1.61)** 0.118 (2.65)** 0.155 (2.34)**
15Note: t statistics in parentheses; * p<0.05, ** p<0.01, *** p<0.001
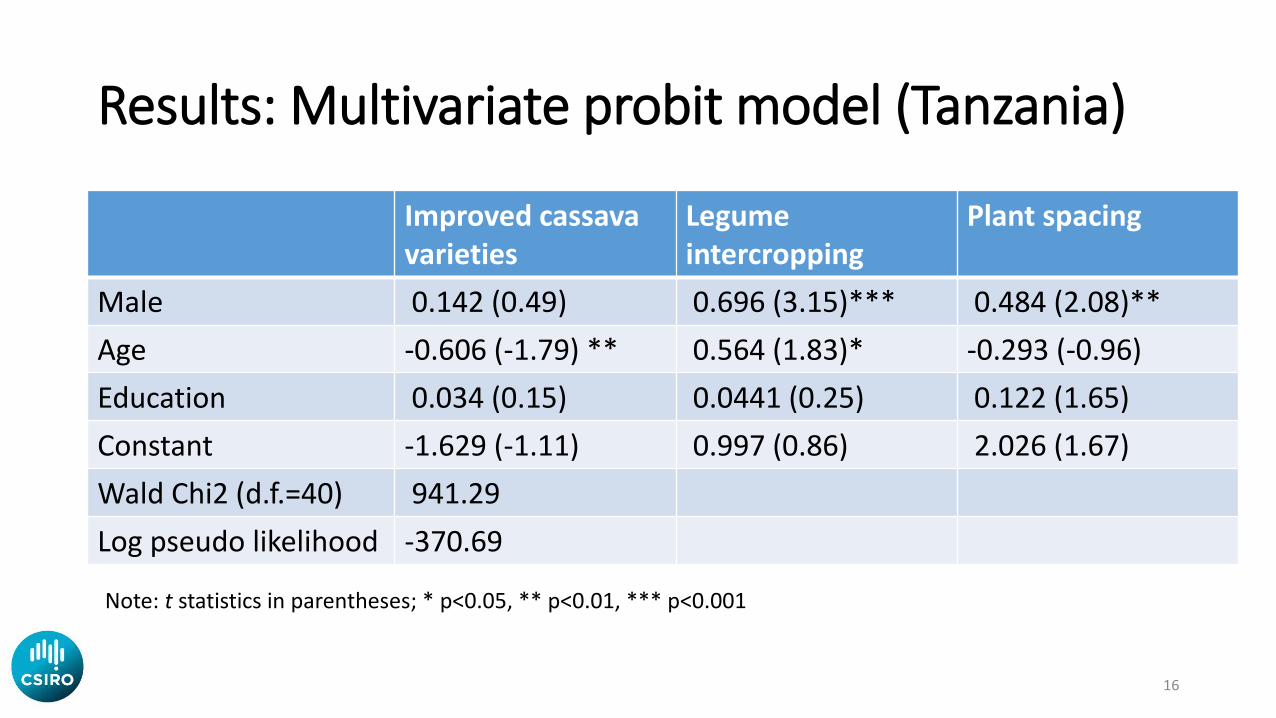
Results: Multivariate probit model (Tanzania)
Improved cassava varieties
Legumeintercropping
Plant spacing
Male 0.142 (0.49) 0.696 (3.15)*** 0.484 (2.08)**
Age -0.606 (-1.79) ** 0.564 (1.83)* -0.293 (-0.96)
Education 0.034 (0.15) 0.0441 (0.25) 0.122 (1.65)
Constant -1.629 (-1.11) 0.997 (0.86) 2.026 (1.67)
Wald Chi2 (d.f.=40) 941.29
Log pseudo likelihood -370.69
16
Note: t statistics in parentheses; * p<0.05, ** p<0.01, *** p<0.001

Correlation coefficients for MVP equations
Improved cassava varieties
Legume intercropping
Plant spacing
Improved varieties -0.29 (-2.06)** 0.25 (1.59)*
Legume intercropping
-0.29 (-2.06)** -0.29 (-2.58)**
17
Note: t statistics in parentheses; * p<0.05, ** p<0.01, *** p<0.001
Likelihood ratio test of rho21 = rho31 = rho32 = 0: chi2(3) = 19.21 Prob > chi2 = 0.0167
Conclusions
• Both socio-economic and farm characteristics are significant in conditioning farmer’s decisions to adopt improved technologies
• Results suggest that adoption covariates differ across technologies. Farm size positively influences adoption of improved cassava varieties but negatively influences legume intercropping
• Access to markets significantly influences farmers’ adoption decisions. Households located closer to markets are more likely to adopt improved cassava production technologies
• The size of the household has a positive effect on the adoption of improved cassava production technologies, probably because of increased labor availability
18

Conclusions (cont.)
• Older farmers are significantly less likely to adopt improved cassava varieties and plant spacing, perhaps because young farmers are stronger and better able to provide the labor needed
• The decision to adopt improved cassava varieties is positively and significantly influenced by livestock ownership
• Credit constrained households are less likely to adopt improved cassava production technologies, because adoption of such technologies requires purchased inputs (hence cash outlay)
• Institutional factors such as access to extension services increase adoption of all improved cassava production technologies
19

Further work
• Field trials to validate surveys
• Publications in the pipeline…..• Mwebaze P, et al. Socio-economic and baseline survey
data for future impact assessments of cassava production in East Africa (in prep for Agricultural Economics)
• Mwebaze P, et al. Modelling technology adoption by cassava farmers in East Africa (in prep for Food Policy)
20

Thank you!
• Funding from Bill & Melinda Gates Foundation through University of Greenwich
• Any questions or comment? Please email: [email protected]
21