modelling nigeria population growth: a trend analysis approach
TRANSCRIPT

Volume 5, Issue 4, April – 2020 International Journal of Innovative Science and Research Technology
ISSN No:-2456-2165
IJISRT20APR988 www.ijisrt.com 997
Modelling Nigeria Population Growth:
A Trend Analysis Approach
Olanrewaju S.O, Olafioye S.O and Oguntade E.S.
Department of Statistics, University of Abuja. Abuja. Nigeria.
Abstract:- This research work is all about Statistical
Modelling of Nigeria’s Population Growth. The
research aims at determining the growth trend of the
population for Male, Female and Total population, as
well as finding the impact of population growth rate and
its effects on the citizens. The source of data used in this
research project is purely secondary data collected from
the Documentary report of National Bureau of Statistics
(N.B.S), Abuja. The statistical tools that were used to
analyse the data collected are Trend (Growth) Models
or Trend Analysis. Eleven (11) Trend (Growth) Models
were used to model the data namely: Linear Trend
Model, Logarithmic Growth Models, Logistic Growth
Models, Exponential Growth Models, Inverse Trend
Model, Cubic Growth Model, Quadratic Trend Model,
Compound Trend Model, Power Trend Model, Growth
Equation Model and S-curve Trend Model. The data
covers the period of 10 years, that is, from 2007 to 2016.
The data was run with SPSS. The results of the analysis
revealed that only seven (7) Trend (Growth) Models are
fit to model population growth (rate) correctly. From
the seven fitted models, the model parameters were
extracted and compared before deducing that Logistic
Growth Trend model emerges the best to describe or
model Nigeria’s Population Growth. The researcher
therefore recommends that government should do
everything at its disposal to reduce the current
population growth rate by providing adequate measures
to educate or encourage people to reduce the number of
children they are giving birth to and by providing
publicly financed social security for sustainable
development.
Keywords:- Trend growth models, Population,
Demography.
I. INTRODUCTION
The study of population is as old as the world itself
and the need to study demography or population studies can
never be over-emphasized.
Population can be defined as the approximate total
number of people (including children, the disabled, beggars
and other persons) living in a particular environment or
country at a given period of time. The Sociologists defined
it as collection of people in a particular area with common
language, culture, custom, norms etc. The context of
Population gave rise to Population census or Complete Enumeration which is important for social, economic and
political planning in a particular Nation. The main source
of ascertaining or knowing the population of a given area or
country is through complete enumeration. Complete
Enumeration can be defined as time to time (usually every
10 years) and simultaneous house-to- house head count by
the Government through its Agents that live in a particular area.
The first population census done in Nigeria in 1866
was the complete enumeration of people living in Lagos
five years after the annexation of Lagos in 1861, and it was
carried out for administrative convenience. Similarly, other
head counts were conducted in Lagos in 1868-1871, 1881,
1891, and 1911. The first nationwide census was conducted
in Nigeria in 1921. Before Nigeria independence, two more
population censuses were done in 1931 and 1952/53
respectively. After the independence, the first complete enumeration was conducted in 1963 which put Nigeria’s
population at 55.7 million approximately. More so, trial
census was conducted in Nigeria in 1991 after the
cancellation of 1973 census figures. The census conducted
in 1991 by Nigeria government the population to 88.5
million. Meanwhile, another population census was
conducted in March 2006 which gave an approximate
figure at 140.3 million people. Now, the population figure
of Nigeria is currently estimated at 208 million people
(source: NBS)
The importance of population growth cannot be over emphasized, and its impact on the citizens cannot be
overlooked. Nigeria’s population grows at an alarming rate
and this has consequential effects on the citizens as there
are no enough social and infrastructural amenities to cater
for the teeming populace. Hence, this problem prompts this
researcher into this study, that is, ‘Statistical Modelling of
Nigeria’s Population Growth’.
II. REVIEW OF RELATED LITERATURES
According to [1], Population growth or projection provides the frame work for the development of labour
force and economic growth, which is being used in
estimation of future costing of social protection. Many of
the developing countries in which Nigeria is included,
always use United Nation’s (UN) population projections
standard in the absence of official national population
projections. The population projections of the United
Nation usually published biannually titled ‘World
Population Prospects’, cover most countries and major
regions in the world.
In 1985, about 80 million people were added to the
population of the world which was estimated to be 4.8
Billion as at then. On yearly basis the number of human

Volume 5, Issue 4, April – 2020 International Journal of Innovative Science and Research Technology
ISSN No:-2456-2165
IJISRT20APR988 www.ijisrt.com 998
beings keep on increasing and by 2014, the world
population has reached 7Billion people, but it is a pity that
as the population is increasing, the amount of natural
resources with which to sustain this population, in order to
improve the quality of human lives and to eliminate mass
poverty remain constant. Many developing Countries in
Africa and Asia are the worse hit including Nigeria.
The rates at which population of the world is growing
is so alarming, something urgent need to be done. Many
governments could not provide education, health care and
food security for their citizen, much less their abilities to
raise standard of living of their people.
Many governments need to embark on several fronts
in order to limit population growth. That is, to control the
effect of such growth on available resources and, with
increase in knowledge, enlargement of their range and
improve their productivity. More so, making provision for their people with forms of social security instead of large
numbers of children. Encouraging and educating people on
reducing the size of their families is not just keep
population in balance with resources, but also it is a way of
assuring, especially for women the basic human right of
self-determination. Serious increase in the rate of
population growth that eats into surpluses available for
social and economic development can impede
improvements in education and health. ([2])
[3] added that, the pressure from Population explosion
is already forcing peasant farmers to work harder, often on shrinking fame on marginal land, just to maintain
household income. In Nigeria, and some other developing
countries in Africa and Asia, population of rural areas
almost doubled between year 1985 and 2006, with a
corresponding decrease in the available land. Spontaneous
growth in population also creates serious depletion in urban
economic and social problems that threaten to make cities
wholly unmanageable. High population growth affects the
course of national economic development.
For a more rapid rate of economic and social development in the developing countries in Africa and
Asia, a concern for population growth must therefore be
part of a broader concern.
According to [4], ‘‘Population growth in Nigeria by
and large can be influenced by three major factors namely
fertility, mortality and migration rates. Meanwhile, these
three factors can have a significant influence positively or
negatively, on future population growth. For instance, the
contribution of mortality to population growth will be
positive if mortality is reducing and negative if mortality is
increasing.’’
[5] in his work stated that there is need to always
adopt a positive outlook for the future in population
projections: life expectancy at birth supposed to continue to
increase and death rates are expected to reduce over all age
groups. The contribution of mortality to population growth
should be positive under this assumption.
Furthermore, the present population age structure
influence future growth and as a matter of fact affecting the
overall number of births(fertility), deaths(mortality) and
migration. In some cases, rates of death are not declining at
the same rate over all age groups but rather fluctuating over
all the age groups, especially in some developing countries
that have been ravaged with and severally affected by
terrorists, inter-tribal or ethno-religious wars, and diseases and epidemics such as HIV/AIDS, Ebola, Lassa fever,
Monkey pause etc. In these complex cases, the contribution
of mortality to population growth is less clear. The
contribution of mortality may also be related to the
interplay between age- specific mortality rates and
population age structure.
Nigeria is a diverse country both in terrain and in
people. Nigeria’s population grows at a rapid rate. Nigeria
occupy the 7th position in the world population ranking of
nations as at today coming after China, India, USA, Indonesia, Japan and Brazil. And it is predicted or projected
that if the population grows at the current rate and
unchecked, Nigeria will become the 3rd most populous
nation in the world by 2050 (source: UN population
Projection).
Nigeria is the only macro state in Africa due to her
population size. Yet the size of that population is unknown,
that is, there is no actual or accurate and reliable figure,
within reasonable limits because the population censuses
have become highly politicized. The Official estimate of
the population figure in 1963 census was 56 million people. In 1991, census figure was 88.5 million while 2006 head
count was estimated to be 140.3 million people. The
projected figure for 2017 was 200 million (source: NBS).
“Everyone accepts the need to have an accurate and
reliable population count… The failure of each attempt
since independence (1960) has not been due to technical
deficiencies of the institutions charged with the
responsibility but to political interference and acute
politicization of the process” (source: Report of the
Constitution Drafting Committee, Vol. II, Pg. 151, 1976).
The population census presents a detailed picture of
population and its composition by economic, social and
demographic characteristics as at last census done.
Population registers and vital statistics systems provide
continuous information on the changes that occur within a
population. Sample surveys of the population, on either an
adhoc or a periodic basis, complement census and
registration statistics and furnish new or additional
information for an understanding of the current
demographic situation and factors influencing it. ([6])
According to [3], ‘‘The most populous country in
Africa, Nigeria accounts for approximately one-fifth of the
African population (or one over thirty-fifth of the world’s
population). About 40 percent of Nigerians live in the
urban areas of the country. About 40 cities have population
of more than 500,000 people. The varieties of customs,
languages and traditions among Nigerians are well over
Volume 5, Issue 4, April – 2020 International Journal of Innovative Science and Research Technology
ISSN No:-2456-2165
IJISRT20APR988 www.ijisrt.com 999
400 ethnic groups (and over 1,000 dialects) which give the
country a cultural diversity. Population census figures are
always use to determine regional funding and the number
of representatives of ethnic and religious groups in
government service. This gives room for an incentive for
inflating local populations. Population census figures have
been a sensitive and controversial issue in Nigeria, because
of its implication for shaping regional, state and ethnic relations and balance of power. In the past, census figures
were believed to have been manipulated for political
advantage and selfish interest. Nigeria’s population is
polarized between the North and the South, the three major
ethnic groups (Hausa, Yoruba and Igbo) and between the
two major religious group(Christianity and Islam). For
instance, each religious group claims that their population
is well over 45% of the total population. Same also for the
three major ethnic groups, where each ethnic group claims
their population is more than 30% of the entire population.
([7]).
III. RESEARCH METHODOLOGY.
A. Data Source
The secondary data used in this study are data
collected through a documentary report from National
Bureau of Statistics (NBS) Headquarters, Central Area,
Abuja and National Population Commission (NPC)
Headquarters, zone 7, Wuse District, Abuja; and also, from
different write-ups on Population and Population growth
rates in various Textbooks, Journals and Internets.
B. Population of the Study
The population for this research work comprises all
the thirty-six (36) States of Nigeria, including the Federal
Capital Territory (FCT). The Population in the thirty-six
(36) States and FCT are further sub-divided into Male and
Female.
C. Sample Size of the Study
The sample size consists of data on the thirty-six (36)
States of the Federation including the Federal Capital
Territory (FCT). The data collected and the number of samples used for this research work is the Nigeria’s
population projection from 2007 to 2016 on yearly basis,
for both Male and Female.
D. Trend Models and Analysis.
There are no automatic techniques to identify trend
components in the time series data. However, as long as the
trend is consistently increasing or decreasing, then, that part
of data analysis is typically not very difficult. If the time
series data contain considerable some number of errors,
then the first step in the process of trend identification is
smoothing. Hence, the examination of some selected ‘‘Trend (Growth) Models’’ is as follow:[8]
Linear Trend Models
The Linear Trend in line with regression, the
statistical model is as follows: Given a (random) sample:
(Yi, Xi), the relationship between the observation Yi and the
independent variables Xij is formulated as: Yi = βo +
β1∅1(Xi1) + β2∅2 (Xi2) + β3∅3 (Xi3) + …. + βp∅p (Xip) + εi
(i = 1,2,3…,n)
where ∅1,∅2, ∅3,…∅p may be non- linear functions.[9]
Quadratic Trend Model
In some cases, a linear trend is inadequate to capture
the trend of a time series, that is why a natural
generalization of the linear trend model which is the
Polynomial Trend Model, written in the form:
Tt = βo + β1t + β2t2 + β3t3 +… +βptp
Malthusian Growth Model
Malthusian Growth Model, sometimes called a simple Exponential Growth Model, is essentially
exponential growth based on a constant rate. The model is
named after Thomas Robert Malthus, who wrote an essay
on the Principle of Population in 1798, one of the earliest
and most influential books on Population.
Malthusian models have the following form:
P(t)= P0ert
Where,
P0 = P0 is the initial population size,
r = the population growth rate, sometimes called Malthusian parameter,
t = time
e = exponential
Hyperbolic Growth Model
The function, x (t) =1
𝑡𝑐−𝑡 exhibits hyperbolic growth
with a singularity at time tc, in the limit as t------˃ tc. The
function goes to infinity.
More generally, the function, x(t)= Tt= 𝑘
𝑡𝑐−𝑡 exhibits
hyperbolic growth, where k is a scale factor.
Exponential Growth Model
The formula for Exponential Growth of a variable X
at positive or negative growth rate r, as time t goes on in
discrete intervals (that is, at integers time 0,1,2,3….), is
Xt = X0 (1 + r)t
where X0 is the value of X at time 0, r is the growth
rate and t is the time. For example, with a growth rate of r =
5% = 0.05, going from any integer value of time to the next
integer causes x at the second time to be 1.05 times (i.e, 5%
larger than) what it was at the previous time.
Negative Exponential Distribution
The cumulative distribution function of Negative
Exponential Distribution is given by:
F(x; ʎ)= {1 − 𝑒 − ʎ𝑥 𝑥 ≥ 00 𝑥 < 0

Volume 5, Issue 4, April – 2020 International Journal of Innovative Science and Research Technology
ISSN No:-2456-2165
IJISRT20APR988 www.ijisrt.com 1000
Alternatively, this can be defined using the Heaviside
step function; H(x)
F (x; ʎ) = (1-e⁻ʎx) H (x)
Alternative Parameterization
A commonly used alternative parameterization is to
define the probability density function (Pdf) of an exponential distribution as
F (x; β) = {1
𝛽𝑒−𝑥/𝛽 𝑥 ≥ 0
0 𝑥 < 0
where β˃0 is a scale parameter of the distribution and is the
reciprocal of the rate parameter, ʎ, defined above.
Logarithmic Growth Model
In Mathematics, logarithmic growth describes a
phenomenon whose size or cost can be described as a
logarithm function of some input e.g. y = C log (x). Note
that any logarithm base can be used; since one can be
converted to another by multiplying a fixed constant
logarithmic growth in the inverse of Exponential Growth and it is very slow.
A familiar example of logarithmic growth is the
number of digits needed to represent a number, N, in
positional notation, which grows as logb(N), where b is the
base of the number system used.
Gompertz Model
In probability and statistics, the Gompertz model is a
continuous probability distribution and it is oftenly applied
to describe the model of adult lifespan by demographers and actuaries. Related fields of science such as Biology and
Gerontology also considered the Gompertz model for
survival analysis. More recently, computer scientists have
also started to model the failure rates of computer codes by
using this distribution. Early users in the 1990s of the
Gompertz model in CLV models included Edge consulting
and Brand science. The Formula can be given as
𝑓(𝑥; 𝑛, 𝑏) = 𝑏𝑛𝑒bx en exp (⁻ 𝑛ebx) for x≥ 0
where b˃0 is the scale parameter and n˃0 is the shape
parameter of the Gompertz distribution. In the actuarial and biological sciences and in demography, the Gompertz
model is parameterized slightly differently (Gompertz-
makeham law of mortality)
Cubic Equation Model
An algebraic equation of the third degree, also known
as the general form of a cubic equation is:
ax3 + bx2 + cx + d = 0
where a, b, c d are constants and a≠ 0.
By replacing x in this equation with a new unknown y,
related to x then, x = y- 𝑏
3𝑎
A cubic equation can be reduced to the simpler (canonical)
form: y3 + py+q=0
where
p = b2/3a2 = c/a
q = 2b2/27a3-bc/3a2 + da
Exponential Smoothing Model
The sequence of raw data is often represented by {Xt}
beginning at time t=0, and the output of the exponential
smoothing algorithm is commonly written as {St}, which
may be regarded as the best estimate of what the next value
of x will be. When the sequence of observation at time t=0,
then, the simplest form of exponential smoothing can be
given as:
S0 = x0
St = 𝛼𝑥t-1 + (1-𝛼)St-1, t ˃ 0
Where 𝛼 is a smoothing factor, and 0< 𝛼 < 1
IV. DATA PRESENTATION AND ANALYSIS
Data Presentation
For this study, the annual data of Nigeria population
from 2007 to 2016 was taken from the National Bureau of
Statistics (NBS) bulletin.
Analysis of Data The data is analysed using SPSS and Microsoft Excel
for beautiful chart. The data is subjected to eleven (11)
selected Trend (Growth) Models for analysis.
Results of the Data Analysed and Interpretation of
Results
The results of the analysis and interpretation of the
results using SPSS, R-console and Microsoft Excel are
presented below. There are eleven (11) modelling for each
of (i) Male Population (ii)Female Population and (iii) Total
Population, as shown in the following tables and graphs
[10]
Modelling with Eleven (11) Selected Trend (Growth)
Models For Male Population
(All models are formulated in R-Console)

Volume 5, Issue 4, April – 2020 International Journal of Innovative Science and Research Technology
ISSN No:-2456-2165
IJISRT20APR988 www.ijisrt.com 1001
Dependent Variable: MALE Population
Equation
Model Summary Parameter Estimates
R Square F df1 df2 Sig. Constant
Linear .998 3643.346 1 8 .000
Logarithmic .888 63.539 1 8 .000
Inverse .630 13.614 1 8 .006
Quadratic .999 2742.331 2 7 .000
Cubic .999 1646.534 3 6 .000
Compound .999 5682.328 1 8 .000 7.175E7
Power .911 81.578 1 8 .000 7.071E7
S .662 15.696 1 8 .004 18.347
Growth .999 5682.328 1 8 .000 18.089
Exponential .999 5682.328 1 8 .000 7.175E7
Logistic .999 5682.328 1 8 .000 1.394E-8
Table 1(a):- Model Summary and Parameter Estimates of Male Population
Population (Continued)
Equation
Parameter Estimates
Constant b1 b2 b3
Linear 7.084E7 2733038.612
Logarithmic 6.979E7 1.065E7
Inverse 9.282E7 -2.371E7
Quadratic 7.156E7 2372918.987 32738.148
Cubic 7.126E7 2639688.261 -25102.759 3505.510
Compound 1.032
Power .126
S -.284
Growth .032
Exponential .032
Logistic
.969
Table 1(b):- Model Summary and Parameter Estimates of Male

Volume 5, Issue 4, April – 2020 International Journal of Innovative Science and Research Technology
ISSN No:-2456-2165
IJISRT20APR988 www.ijisrt.com 1002
Fig 1:- Graph of Model Summary and Parameter Estimates of Male Population
Figure 1 above shows that only seven (7) Models have almost perfect straight line, hence these seven (7) models are fit and
significant to Model Male Population Growth. They are: Linear, Quadratic, Cubic, Compound, Logistic, Growth, and
Exponential Trend Models.
Fig 2:- Graph of Linear Trend Model
The chart above shows that there is almost perfect upward straight line, hence the trend is fit and significant to model male Population Growth at R-Squared Value of 0.9983

Volume 5, Issue 4, April – 2020 International Journal of Innovative Science and Research Technology
ISSN No:-2456-2165
IJISRT20APR988 www.ijisrt.com 1003
Fig 3:- Graph of Quadratic Trend Model
Figure 3 shows that there is almost perfect straight line upward trend, hence the Quadratic Trend Model is fit and significant
to model male population Growth at R-Squared Value of 0.9988
Fig 4:- Graph of Cubic Growth Model
Figure 4 shows that there is almost perfect straight line upward trend, hence the Cubic Growth Model is fit and significant to
model male Population Growth at R-Squared Value of 0.9990

Volume 5, Issue 4, April – 2020 International Journal of Innovative Science and Research Technology
ISSN No:-2456-2165
IJISRT20APR988 www.ijisrt.com 1004
Fig 5:- Graph of Compound Trend Model
The graph above revealed that there is almost perfect straight line upward trend, hence the Compound Trend Model is fit and
significant to model Male Population Growth at R-Squared Value of 0.9986.
Fig 6:- Graph of Logistic Growth Model
Figure 6 above shows that there is almost perfect straight-line upward trend, hence the Logistic Growth Model is fit and
Significant to Model Male Population Growth at R-Squared Value of 0.9994.
Volume 5, Issue 4, April – 2020 International Journal of Innovative Science and Research Technology
ISSN No:-2456-2165
IJISRT20APR988 www.ijisrt.com 1005
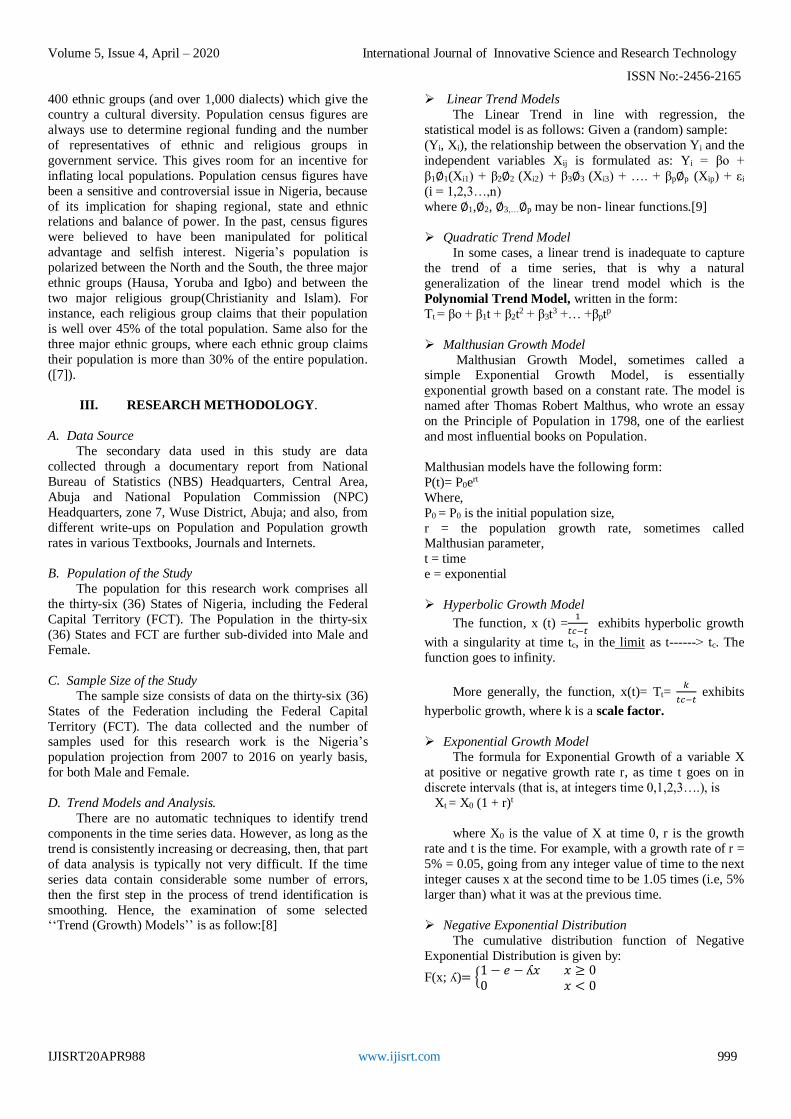
Fig 7:- Graph of Growth Equation Model
Figure 7 above shows that there is almost perfect straight-line upward trend, hence the Growth Equation Model is fit and
significant to Model male Population Growth at R-Squared Value of 0.9991.
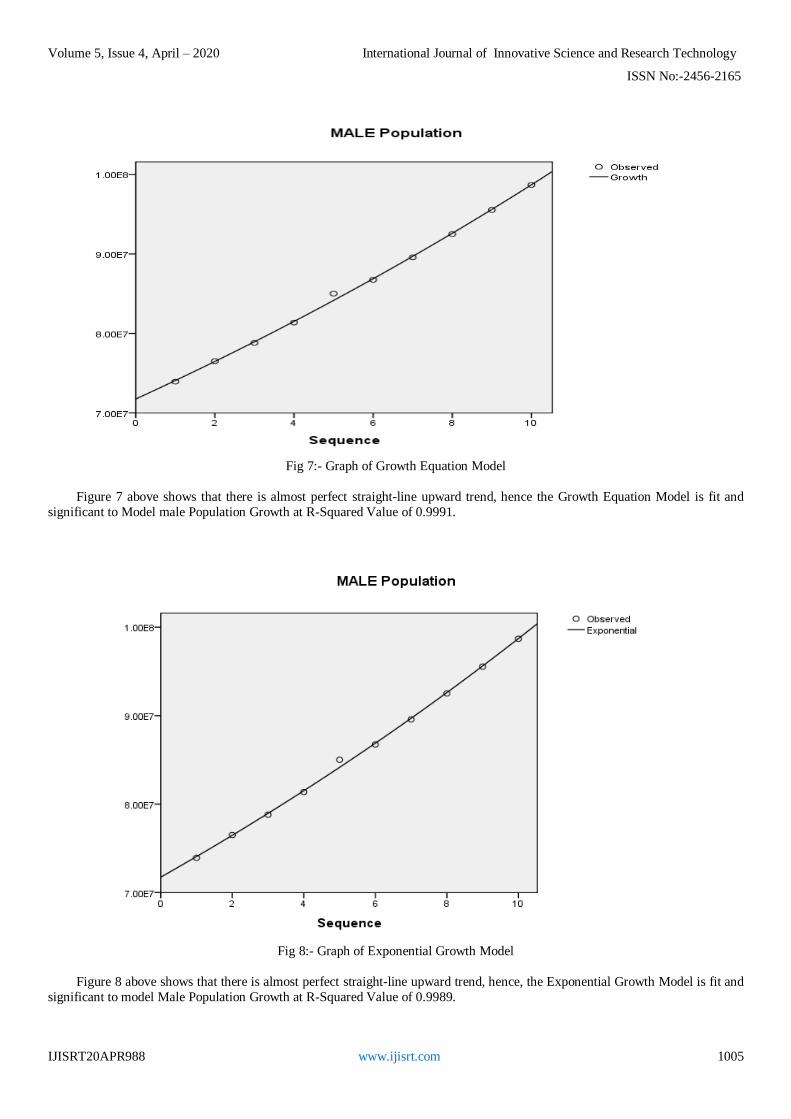
Fig 8:- Graph of Exponential Growth Model
Figure 8 above shows that there is almost perfect straight-line upward trend, hence, the Exponential Growth Model is fit and
significant to model Male Population Growth at R-Squared Value of 0.9989.
Volume 5, Issue 4, April – 2020 International Journal of Innovative Science and Research Technology
ISSN No:-2456-2165
IJISRT20APR988 www.ijisrt.com 1006
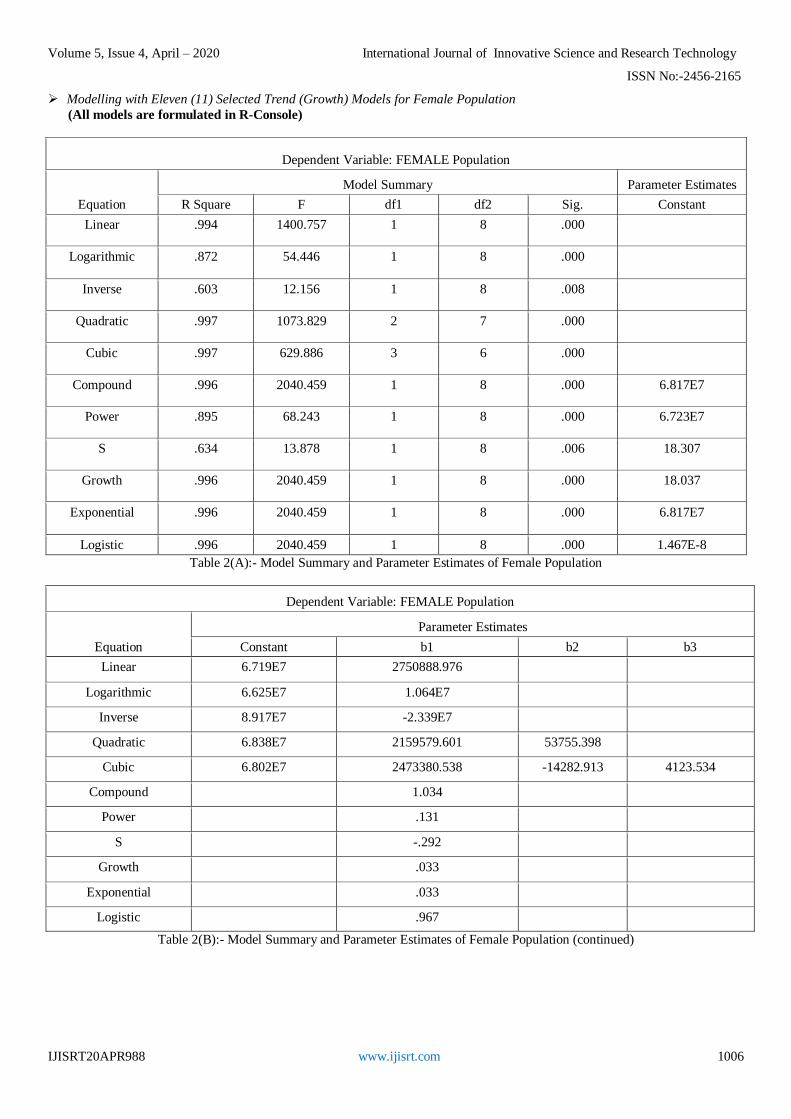
Modelling with Eleven (11) Selected Trend (Growth) Models for Female Population
(All models are formulated in R-Console)
Dependent Variable: FEMALE Population
Equation
Model Summary Parameter Estimates
R Square F df1 df2 Sig. Constant
Linear .994 1400.757 1 8 .000
Logarithmic .872 54.446 1 8 .000
Inverse .603 12.156 1 8 .008
Quadratic .997 1073.829 2 7 .000
Cubic .997 629.886 3 6 .000
Compound .996 2040.459 1 8 .000 6.817E7
Power .895 68.243 1 8 .000 6.723E7
S .634 13.878 1 8 .006 18.307
Growth .996 2040.459 1 8 .000 18.037
Exponential .996 2040.459 1 8 .000 6.817E7
Logistic .996 2040.459 1 8 .000 1.467E-8
Table 2(A):- Model Summary and Parameter Estimates of Female Population
Dependent Variable: FEMALE Population
Equation
Parameter Estimates
Constant b1 b2 b3
Linear 6.719E7 2750888.976
Logarithmic 6.625E7 1.064E7
Inverse 8.917E7 -2.339E7
Quadratic 6.838E7 2159579.601 53755.398
Cubic 6.802E7 2473380.538 -14282.913 4123.534
Compound 1.034
Power .131
S -.292
Growth .033
Exponential .033
Logistic .967
Table 2(B):- Model Summary and Parameter Estimates of Female Population (continued)
Volume 5, Issue 4, April – 2020 International Journal of Innovative Science and Research Technology
ISSN No:-2456-2165
IJISRT20APR988 www.ijisrt.com 1007
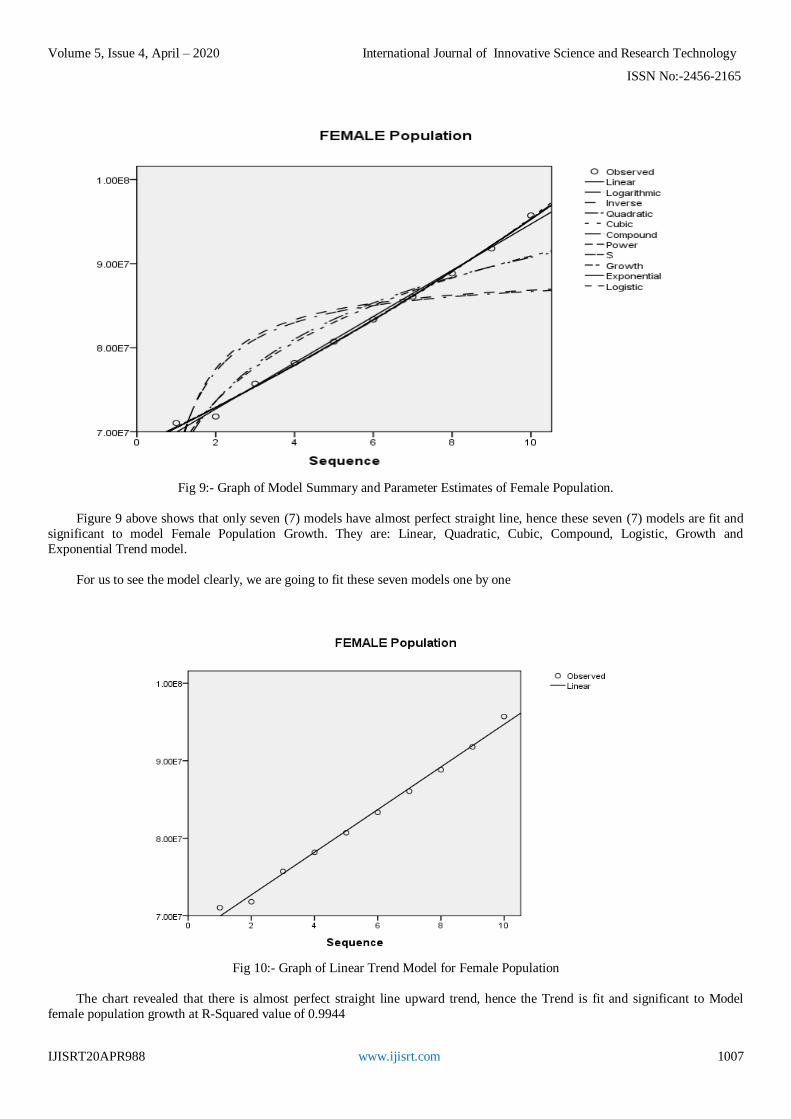
Fig 9:- Graph of Model Summary and Parameter Estimates of Female Population.
Figure 9 above shows that only seven (7) models have almost perfect straight line, hence these seven (7) models are fit and
significant to model Female Population Growth. They are: Linear, Quadratic, Cubic, Compound, Logistic, Growth and
Exponential Trend model.
For us to see the model clearly, we are going to fit these seven models one by one
Fig 10:- Graph of Linear Trend Model for Female Population
The chart revealed that there is almost perfect straight line upward trend, hence the Trend is fit and significant to Model
female population growth at R-Squared value of 0.9944

Volume 5, Issue 4, April – 2020 International Journal of Innovative Science and Research Technology
ISSN No:-2456-2165
IJISRT20APR988 www.ijisrt.com 1008
Fig 11:- Graph of Quadratic Trend Model
Figure 11 shows that there is almost perfect straight line upward trend, hence the Quadratic Trend Model is fit and Significant to model Female Population Growth at R-Squared Value of 0.9968
Fig 12:- Graph of Cubic Growth Model
Figure 12 shows that there is almost perfect straight line upward trend, hence the Cubic Growth Model is fit and significant
to Model Female Population Growth at R-Squared Value of 0.9966

Volume 5, Issue 4, April – 2020 International Journal of Innovative Science and Research Technology
ISSN No:-2456-2165
IJISRT20APR988 www.ijisrt.com 1009
Fig 13:- Graph of Compound Trend Model
Figure 13 above shows that there is almost perfect straight line upward trend, hence the Compound Trend Model is fit and
significant to Model Female Population Growth at R-Squared value of 0.9962.
Fig 14:- Graph of Logistic Growth Model
Figure 14 above shows that there is almost perfect straight line upward trend, hence the Logistic Growth Model is fit and
significant to model Female Population Growth at R-Squared Value of 0.9964

Volume 5, Issue 4, April – 2020 International Journal of Innovative Science and Research Technology
ISSN No:-2456-2165
IJISRT20APR988 www.ijisrt.com 1010
Fig 15:- Graph of Growth Equation Model
Figure 15 above shows that there is almost perfect straight line upward trend, hence the Growth Equation Model is fit and
significant to model Female Population Growth at R-Squared Value of 0.9960
Fig 16:- Graph of Exponential Growth Model
Figure 16 above shows that there is almost perfect straight line upward trend, hence the Exponential Growth Model is fit and
significant to model Female Population Growth at R-Squared Value of 0.9958.

Volume 5, Issue 4, April – 2020 International Journal of Innovative Science and Research Technology
ISSN No:-2456-2165
IJISRT20APR988 www.ijisrt.com 1011
Modelling with Eleven (11) Selected Trend (Growth) Models for Total Population
(All models are formulated in R-Console)
Dependent Variable: TOTAL Population
Equation
Model Summary Parameter Estimates
R Square F df1 df2 Sig. Constant
Linear .997 2916.627 1 8 .000
Logarithmic .881 59.253 1 8 .000
Inverse .617 12.893 1 8 .007
Quadratic .999 3046.157 2 7 .000
Cubic .999 1857.757 3 6 .000
Compound .999 6384.558 1 8 .000 1.399E8
Power .904 75.427 1 8 .000 1.379E8
S .649 14.803 1 8 .005 19.020
Growth .999 6384.558 1 8 .000 18.757
Exponential .999 6384.558 1 8 .000 1.399E8
Logistic .999 6384.558 1 8 .000 7.147E-9
Table 3(A):- Model Summary and Parameter Estimates (Model Summary)
Dependent Variable: TOTAL Population
Equation
Parameter Estimates
Constant b1 b2 b3
Linear 1.380E8 5483927.588
Logarithmic 1.360E8 2.129E7
Inverse 1.820E8 -4.711E7
Quadratic 1.399E8 4532498.588 86493.545
Cubic 1.393E8 5113068.799 -39385.672 7629.044
Compound 1.033
Power .128
S -.288
Growth .033
Exponential .033
Logistic .968
Table 3(B):- Model Summary and Parameter Estimates (Parameter Estimates)

Volume 5, Issue 4, April – 2020 International Journal of Innovative Science and Research Technology
ISSN No:-2456-2165
IJISRT20APR988 www.ijisrt.com 1012
Fig 17:- Graph of Model Summary and Parameter Estimates of Total Population
Figure 17 above shows that only seven (7) models have almost perfect straight line, hence these seven (7) models are fit to
model Total Population Growth. They are: Linear, Quadratic, Cubic, Compound, Logistic, Growth and Exponential Trend
Models. Specifically, the seven models would now be fitted one by one
Fig 18:- Graph of Linear Trend Model
Figure 18 above shows that there is almost perfect straight line upward trend, hence the Linear Trend Model is fit and
significant to model Total Population Growth at R-Squared Value of 0.9973

Volume 5, Issue 4, April – 2020 International Journal of Innovative Science and Research Technology
ISSN No:-2456-2165
IJISRT20APR988 www.ijisrt.com 1013
Fig 19:- Graph of Quadratic Trend Model
Figure 19 shows that there is almost perfect straight line upward trend, hence the Quadratic Trend Model is fit and
significant to model Total Population Growth at R-Squared value of 0.991
Fig 20:- Graph of Cubic Growth Model
Figure 20 shows that there is almost perfect straight line upward trend, hence the Cubic Growth Model is fit and significant
to model Total Population Growth at R-Squared Value of 0.9988
Volume 5, Issue 4, April – 2020 International Journal of Innovative Science and Research Technology
ISSN No:-2456-2165
IJISRT20APR988 www.ijisrt.com 1014
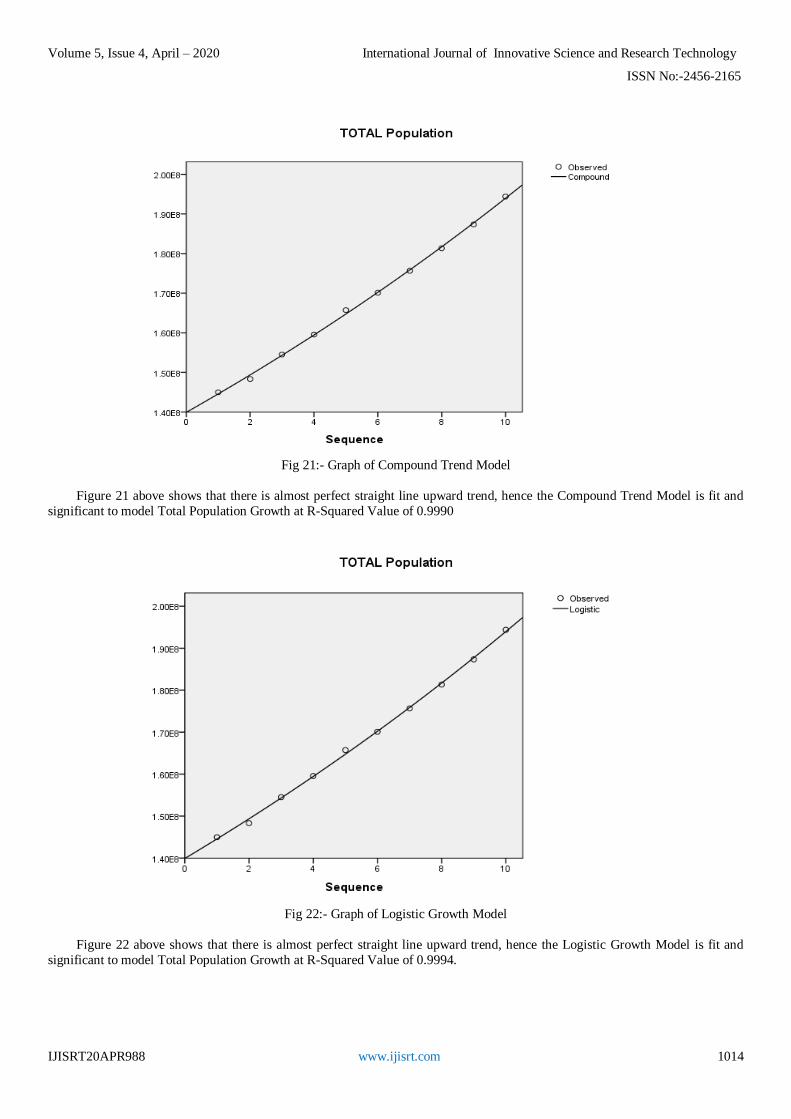
Fig 21:- Graph of Compound Trend Model
Figure 21 above shows that there is almost perfect straight line upward trend, hence the Compound Trend Model is fit and
significant to model Total Population Growth at R-Squared Value of 0.9990
Fig 22:- Graph of Logistic Growth Model
Figure 22 above shows that there is almost perfect straight line upward trend, hence the Logistic Growth Model is fit and
significant to model Total Population Growth at R-Squared Value of 0.9994.

Volume 5, Issue 4, April – 2020 International Journal of Innovative Science and Research Technology
ISSN No:-2456-2165
IJISRT20APR988 www.ijisrt.com 1015
Fig 23:- Graph of Growth Equation Model
Figure 23 above shows that there is almost perfect straight line upward trend, hence the Growth Equation Model is fit and
significant to model Total Population Growth at R-Squared Value of 0.9992.
Fig 24:- Graph of Exponential Growth Model
Figure 24 above shows that there is almost perfect straight line upward trend, hence the Exponential Growth Model is fit and
significant to model Total Population Growth at Squared value of 0.9989

Volume 5, Issue 4, April – 2020 International Journal of Innovative Science and Research Technology
ISSN No:-2456-2165
IJISRT20APR988 www.ijisrt.com 1016
V. DISCUSSIONS AND FINDINGS
From the comparison tables and charts above, the
models that best describes the growth trend of the Nigeria’s
population for Male, Female and Total Populations over the
ten years observed, that is, from 2007-20016, as a result of
the models with the best performing parameters, i.e. the
models with the highest value of R–square and significant at 1% level of significance are seven, which are Quadratic
Trend, Cubic Equation, Compound Growth, Exponential
Growth, Growth Equation, Linear Trend and Logistic
Trend Model. From the seven (7) fitted models, the model
parameters were extracted and compared and we are able to
deduce that Logistic Trend Model is the best describe or
model Nigeria population growth at R-squared values of
0.9994, 0.9964 and 0.9994 respectively for Male, Female
and Total Populations for the period under review, and can
be helpful for modelling the subsequent years.
VI. SUMMARY
Presently, Nigeria’s population growth rate is
projected at 2.86 annually (source: NBS), with this high
growth rate and applying the double time growth analysis,
Nigeria’s population would be expected to double in the
next 25 years approximately.
As earlier said the study was based on the Nigeria’s
Population (Male, Female and Total Population) obtained
from NBS annual bulletin for the year 2007 to 2016. The
methodology employed in this project is the Trend Growth Model or Trend Analysis. Various trend plots for the
selected trend models were produced and studied. Eleven
models were actually examined and only seven of the
growth models were fit to model the data of the Nigeria’s
population as discussed in the section above.
VII. CONCLUSION
Based on the analyses and results above, we have
observed that the Nigeria’s population is growing at a very
high rate. This obvious imply that the growth rate is putting much pressure on the resources of the environment and
consequently leading to environmental degradation, which
invariably affecting the human health. It is therefore
necessary to put in place drastic measures to first of all
solve the population problems before proceeding to solving
the damage done to the environment as well as the resultant
health problems.
The less developed countries of Africa, Nigeria in
particular, are currently faced with the problems of rapidly
increasing population, which thwarts their aspirations for
social and economic growth. The corollary of the thwarted aspirations, in a milieu of rapid population growth,
precarious economic advance, and rigidity in social
structure, is frustration. Instability, social and political
unrest, even revolution, is associated with frustrated
expectations. They also serve to retard the advance which is
sought; this is the Paradox in developing countries.
Nigeria, as a developing country, is a nation of
diversity, opportunity and challenge. It is also a nation
where neglect and ignorance have permitted severe
population difficulties to develop to almost unmanageable
and therefore explosive proportions. This study also
proffers solutions by ways of suggesting ways out of the
lingering problems.
RECOMMENDATIONS
Based on the information gathered from this research work,
the following recommendations are suggested:
There should be immediate and rapid action to facilitate
declining fertility, especially in the least economically
favoured sector of the population.
There should be action plan for economic and social
progress that will permeate to all sectors, especially the
disadvantaged ones.
We recommend that there should be reduction of current growth rates which is imperative for sustainable
development. The critical issues are the balance
between population size and available resources and the
rate of population growth in relation to the capacity of
the economy to provide for the basic needs of the
population, not just today but for generations to come.
The researchers also recommend that measures to
provide adequate livelihood for poor households should
be put in place, for instance, establishment and
enforcement of child labour laws, and provision of
publicly financed social security and Improvement of
public health. Improvements in health and education of all, especially
of women, and in conjunction with other social changes
that raise the status of women, can have a profound
effect in bringing down population growth rates.
Research has shown that highly educated and social
class women are always busy with studies, work and
business, and may not want to give birth to more than
two or three children so that they can adequately take
care of them because of their tight schedule.
REFERENCES
[1]. STOTO, M. (1993): ‘‘Readings in Populations
Research Methodology’’ New York, United Nations
Population Fund (UNFPA).
[2]. COALE, A.J. and DEMENY, P.(1966): ‘‘Regional
Model of Life Tables and Stable Population’’.
Princeton University Press.
[3]. Allen, Abimbola Adebimpe (2013). Population
dynamics and infrastructure: meeting the millennium
development goals in Ondo State, Nigeria. African
Population Studies 27, No 2, October 2013
[4]. Alao, A (2010) The politics and socio-economic dynamics of demography in Nigeria: The past and
present in the future. Background Paper for
Nigeria: The Next Generation Project; Next
Generation
[5]. MABOGUNJE, A.L. (1972): ‘‘Population Growth
and Economic Development in Africa’’, London,
Heinemann Educational Books, pp.235-242.

Volume 5, Issue 4, April – 2020 International Journal of Innovative Science and Research Technology
ISSN No:-2456-2165
IJISRT20APR988 www.ijisrt.com 1017
[6]. OKOYE, S.C. (1992): ‘‘Population Projection:
Techniques of Demographic Data Analysis with
Special Reference to Sub-Saharan Africa’’
[7]. Bloom, DE, Freeman, RB (1986) The effects of rapid
population growth on labor supply and employment in
developing countries. Population and Development
Review 12: 381–414
[8]. SHANGODOYIN, D.K and OJO, J.F. (2002): ‘‘Element of Time Series Analysis’’ Evans Brothers
(Nigeria Publishers) Limited. Jericho Road. Ibadan.
Nigeria.
[9]. GUPTA, S.P: ‘‘Statistical Methods’’, Sultan Chand
and Sons Educational Publishers, New Delhi.
[10]. LEETE, R. (1992): ‘‘A User-friendly Package for
making National and Sub- National Projections’’
Kuala Lumpur, Malaysia: Print and Coy. (Third
Edition).
[11]. Bloom, D, Finlay, J, Humair, S. (2010) Prospects for
Economic Growth in Nigeria: A Demographic Perspective. Paper presented at the IUSSP Seminar on
Demographics and Macroeconomic Performance held
at Novotel, Gare de Lyon, Paris, France, 4–5 June
2010. Available
at: http://www.ntaccounts.org/doc/repository/BFHM
OS2010.pdf.