modelling equilibrium concentrations of microcontaminants
TRANSCRIPT

ELSEVIER Aquatic Toxicology 31 (I 995) 1-25
Modelling equilibrium concentrations of microcontaminants in organisms of the Rhine delta: Can average field residues
in the aquatic foodchain be predicted from laboratory accumulation?
A. Jan Hendriks* Institute for Inland Water Management and Waste Wuter Treatment, P 0. Box 17, Lelystad,
The Netherlands
(Received 27 August 1993; accepted 18 June 1994)
Abstract
To explore the validity of extrapolation of laboratory bioaccumulation ratios to field condi- tions, we collected values from experiments and compared these to ratios observed in the field surveys carried out in the Rhine delta. For some major chemical groups and taxa, we concluded that: (1) Fat weight corrected concentrations of more persistent organics in (a) organic suspend- ed solids, freshwater plants and pelagic invertebrates tended to be similar, both in laboratory experiments and field surveys, (b) fish from the Rhine delta were about twice as high as those in the invertebrates and those expected from laboratory studies, and (c) birds were one order of magnitude or more above those in their invertebrate and fish prey, whereas accumulation in laboratory experiments with common birds and mammals did not exceed their food level by more than 10; (2) Fat weight corrected concentrations of less persistent organics can be sub- stantially lower than those of more persistent isolipophilic compounds; for instance, accumula- tion of some polycyclic aromatic hydrocarbons in short-term laboratory experiments was simi- lar to that of more persistent compounds but field levels were 30 (in invertebrates) to more than 1000 (in fish) times lower than expected; (3) Dry weight corrected concentrations of cadmium, copper, mercury and zinc in (a) freshwater plants and invertebrates from the Rhine delta were 0.2 to 0.3 times the concentrations in suspended solids, as more or less expected from literature, (b) fish were lower than for invertebrates both for literature and Rhine delta data, and (c) kidneys and livers of laboratory and field birds or laboratory mammals are at most 10 times those in their food. The pattern of bioaccumulation of mercury is similar to that of extremely persistent organics.
Key words: Bioaccumulation; Bioconcentration; Biomagnification; Aquatic foodchain; Rhine
*Corresponding author.
0166-445X/95/$09.50 0 1995 Elsevier Science B.V. All rights reserved
SSDI 0166-445X(94)00052-2

2 A. J. Hendriksl Aquatic Toxicology 31 (I 99s) l-25
1. Introduction
Laboratory experiments and field surveys on contaminant concentrations and or- ganisms response are usually interpreted using some kind of model. For a general picture, one relies on simple rules that link laboratory results to anticipated field situations by correcting for exposure time, test species and so forth. Examples can be found in derivation of standards, in defining priority pollutants and in emission con- trol (e.g. Vrijhof, 1984; OECD, 1987, 1992; U.S. EPA 1984, 1991; Van der Kooij et al., 1991). For specific purposes, more realistic sets of differential equations are de- signed but laboratory and field testing of these complex models is usually limited to a few contaminants or species only (e.g. De Vries, 1990; Van Haren et al., 1990; Kramer et al., 1993; Goodman, 1982; Marshall, 1978).
To our experience, environmental management strongly demands refinement of current methods for risk assessment. Therefore we are developing an intermediate type of model that aims to be more accurate than the simple ones and more widely applicable than the complex models.
In this paper we will discuss the module for equilibrium concentration kinetics. The objectives are to explore: (1) the range of bioaccumulation ratios reported, (2) in laboratory experiments as well as Rhine-delta field surveys, (3) for miscellaneous contaminants and taxa.
We will first concentrate on more and less persistent organics and than focus on metals. Per group of chemicals, we will subsequently discuss concentration ratios for lower and higher phylogenetic and trophic groups of organisms. The equations speci- fied are first calibrated with (reviews on) laboratory experiments and than validated with the results from Rhine-delta field surveys.
2. Methods
2.1. Laboratory experiments data and reviews
The octanol-water partition ratios K,, (1 kg-‘) used throughout this study were selected in a decreasing order of preference from De Bruijn et al. (1989), Leo and Weininger (1989) or from one of the publications that provided the data on the residues. For metals, we used median solid-water partition ratios K, (1 kg-‘) for Rhine delta rivers and lakes, estimated as described by Van der Kooij et al. (1991).
Laboratory calibration of equilibrium bioaccumulation ratios of organics has been performed repeatedly and we largely confined ourselves to a review of these studies, summarized in Tables 2 and 3. For metals, we collected laboratory bioconcentration ratios from the AQUIRE-database (Pilli et al., 1989) and a 5 additional data for cadmium and algae from a review (Taylor, 1983). If several records referred to the same assay, we used the exposure concentration and the bioconcentration ratio re- ported for the largest exposure period. Only data with an exposure time sufficiently long to reach at least 10% of the equilibrium accumulation were taken into account.

A.J. HendrikslAquatic Toxicology 31 (199.5) 1-25 3
The fraction of the equilibrium reached was estimated by 1-exp(-k,,,t) with k,,, = O.OO~Z-~.~ for Cd and Hg with z being the adult size of the taxon (for details, see Hendriks, 1994). As kout tend to be one order of magnitude higher for Cu and Zn we used k,,, = O.O~Z-~.~ there.
Some publications did not report whether concentrations were expressed in wet weight (ww), dry weight (dw) or fat weight (fw). Unless explicitly reported in the study, we assumed that residues referred to wet weight measurements. If needed for comparison, we used typical dry to wet weight fractions of 0.1 (plants and inverte- brates) and 0.3 (vertebrates) and typical fat to wet weight fractions of 0.1 x 0.15 = 0.015 and 0.3 x 0.15 = 0.045, respectively (e.g. Jorgensen, 1979; Parker- ton, 1993; Hendriks and Pieters, 1993). Half the organic matter of suspended or sedimented solids was assumed to consist of carbon.
If several bioaccumulation ratios were available for a combination of a compound and a taxon, we calculated the geometric mean of individual values or, if these were absent, the geometric average of the minimum and maximum of the ranges given.
2.2. Field surveys in the Rhine-delta
For field validation we used concentrations in suspended solids and organisms obtained in our monitoring programs, extended with some specific surveys. The methodological aspects of these studies in terms of chemical analysis and sampling strategy have been published elsewhere (De Boer, 1988; Pieters and Taai, 1991; Vene- ma, 1991, IRC 1992b; Pieters and Hagel, 1992; Hendriks, 1993; Hendriks and Pieters, 1993; Platteeuw et al., 1994).
The concentrations in suspended solids used throughout this paper refer to normal-
Volkerak
monitoring location:
0 suspended solids
Fig. 1. Rhine-delta rivers and lakes
4 A. J. Hendriksl Aquatic Toxicology 31 (1995) 1-25
ized levels (10% organic carbon = 20% organic matter, 40% luteum) and reflect the average of twelve samples in 1990 (Hendriks, 1993; Venema, 1991). The residues in organisms were compared to suspended solid samples collected at the nearest up- stream monitoring station, being Lobith, with exception of the Markermeer and Haringvliet-West residues, which were compared to suspended solids concentrations at the IJsselmeer and Haringvliet stations (Fig. 1).
The residues observed in organisms have been compared to concentrations in their apparent habitat and food, for mobile species as directed by fishery experts and ornithologists.
3. Theory
Concentration kinetics is traditionally described by a one-compartment model (e.g. Aoyama and Inoue, 1987; Bartell et al., 1984; Connolly and Tonelli, 1985; Harding et al., 1981; Jorgensen, 1979; Oakley, 1983; Spacie and Hamelink, 1982; Thomann and Connolly, 1984a,b).
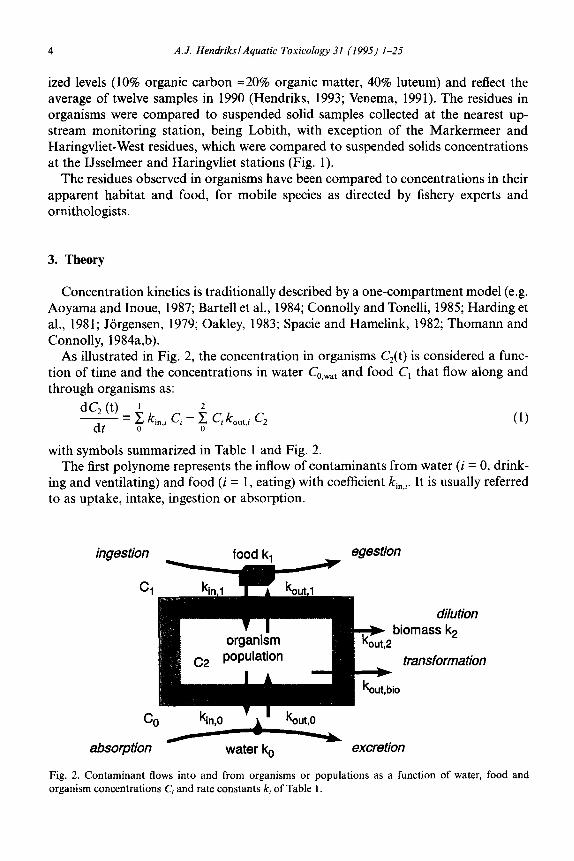
As illustrated in Fig. 2, the concentration in organisms C,(t) is considered a func- tion of time and the concentrations in water C,,,,, and food C, that flow along and through organisms as:
dG 0) - = i k,“,i Ci - i cikout,i Cz
dt 0
with symbols summarized in Table 1 and Fig. 2. The first polynome represents the inflow of contaminants from water (i = 0, drink-
ing and ventilating) and food (i = 1, eating) with coefficient ki,,i. It is usually referred to as uptake, intake, ingestion or absorption.
inge lstion
C
ion
tr2
dilution lass k2
rnsformation
absorption water k, excretion
Fig. 2. Contaminant flows into and from organisms or populations as a function of water, food and organism concentrations C, and rate constants k, of Table 1.

A. J. Hendriksl Aquatic Toxicology 31 (1995) l-25 5
The second polynome consists of four output pathways, each considered propor- tional to the residue in the organism Cz(t) by a coefficient of koUt,?
There is a physicochemical minimum outflow by output via water (i = 0, ventilat- ing, urinating), food (i = 1, defecating) and biomass (i = 2). Output to water and food is inconsistently called excretion (often but not always for water), egestion (often but not always for feces), elimination, clearance and depuration (various meanings). Loss of contaminants by dilution is caused by addition and repulsion of cells from organ- isms and by birth and death of individuals in populations. As growth refers to weight increase only and does not to take into account the (dis)continuous peeling of scales, skin, hairs and the like, we prefer the term production dilution for the overall process.
In addition, we may distinguish a biochemical excess outflow (i = bio), caused by selective reactions that decrease the lipophilic nature of the compounds and enhance the transport to safer locations in- or outside the organism (e.g. Buhler and Williams, 1988; Livingstone, 1991). We will further refer to it by the traditional term of bio- transformation, though other processes such as selective direction towards tissues to be shedded (e.g. Baker, 1981) have the same effect.
In this paper, we will focus on one of the two crucial factors of Eq. (1) the equili- brium bioaccumulation ratio:
c*(o3) C kin i -=A
C, IX kout,i
Table 1 Factors used in the equations
(2)
Symbol Description Unit
c “.wat concentration in water pg 1-l C C0.0,0, O.SOl, concentration in (organic) suspended or sedimented solids pg kg-’ C,,C, concentration in food (i = 1) and organisms or populations (i = 2) iug kg-’
in (octanol-equivalent) fat weight, dry weight, wet weight fw, dw, ww K OW equilibrium octanol-water partition ratio kg-’ 1-l
L equilibrium solid-water partition ratio kg-’ I-’ k Ill., inflow constant for contaminants with water (i = 0) or food (i = 1) d-’ k 0ut.z outflow constant for contaminants as a physicochemical minimum (i = phy) d-’
via water (i = 0), food (i = l), biomass (i = 2) and as a biochemical excess (i = bio)
i abiotic (0) lower (1) and higher (2) trophic level of compartments Pdry.0 PfW dry weight or (octanol-equivalent) fat weight fraction in (organic) solids
(i = 0), food(i = 1) and organisms (i = 2) I t time d z adult taxon size kg
Alternative symbols also used in related papers: P,, for KOw, BCF for C, : C,,,,, BCF,, for C, : &,,, k,, or k, for k,,,,, k,ri or k, for Lt.O; lm, dm, wm = lipid mass, dry mass, wet mass. Abbreviations for chemicals: x DDT = DDT, DDD, DDE; CBz = benzenes; Cd = cadmium; CNBz = chloronitrobenzenes; CP = chlo- rophenols; Cu = copper; De = deca; Di = di; HCH = hexachlorocyclohexane; Hg = mercury; Hp = hepta; HX = hexa; Mn = mono; Oc = octa; OCB = organochlorobiocides; ONBs = organonitrobiocides; OPBs = organophosphorbiocides; PAHs = polycyclic aromatic hydrocarbons; PCB = polychlorobifenyls; PCDDs = polychlorodibenzodioxins; PCDFs = polychlorodibenzofurans; Pn = penta; Te = tetra; Tri = tri; Zn = zinc.

6 A.J. HendrikslAquatic Toxicology 31 (1995) l-25
where C, is defined to be constant, and exchange with either water or food is assumed to be dominant.
4. Results
4.1. More persistent organics
4.1.1. Laboratory calibration Lower organisms. The ratio of equilibrium concentrations of persistent organics in living organisms C, and in water C,,,,, in the absence of transformation and produc- tion dilution is comprehensively described by:
C(m) = Pfat,Z(Kow- I)+ 1 (KOW < 107) (3)
C O,Wder I= ~fat,zKow (10’ < K,,, c 107) (4)
where pfat,? is the octanol-equivalent fat fraction in the organism (references in Table 2). The condition K,,c 1 O7 reflects the observation that bioaccumulation of extremely
lipophilic organics does not exceed the level reached by compounds with a K,, of about lo7 (for possible causes, e.g. Gobas, 1989). In case of very hydrophilic contami- nants (K,, < 102), concentrations in the 70% to 90% water fraction of organisms contribute substantially to the overall body burden (on a wet weight basis) and Eq. (3) should be applied.
For compounds of an intermediate lipophility (lo2 < K,, < 107), Eq. (4) has been applied successfully as an approximation of bioaccumulation in several aquatic and terrestrial taxa (references in Table 2). The fat fractionspt,, are obtained from log-log regressions that usually produce bioconcentration ratios to water C,: Co,,,, to be almost linear proportional to octanol-water partitioning ratios K,,. Occasionally, the relationship is reported to be less or more than linear proportional, possibly partly caused by using data on less persistent compounds. The non-linearity may induce additional variability in the other constant, the octanol-equivalent fat fraction pfat.
Yet, for our purpose, we may assume a linear relationship (references in Table 2).
Table 2 Ranges of octanol-equivalent fat fraction prat.t in lower organisms in laboratory experiments
Pet Taxa
Organic solids” =0.03 Aquatic plant$ 0.002-0.05 Chlorella fusca, Myriophyllum spicatum, Lemna minor Terrestrial plants” 0.00-0.01 Hordeum sp. (roots) Aquatic animals’ 0.01-0.05 Crustacea, Oligochaeta, Mollusca, Pisces, Terrestrial animals’ O.OlW.25 Lumbricidae
“Karickhoff et al. (1979) converted with p dry = 0.1; %eyer et al. (1984, 1991), Gobas et al. (1991), Dogger (personal communication); ‘Patterson et al. (1991), Briggs, et al. (1982), Topp et al. (1986); dK(inemann (1980), Mackay (1982), Geyer et al. (1991), Hawker and Connell (1986), Gabric et al. (1990); ‘Connell and Markwell (1990), Lord et al. (1980), Belfroid et al. (1993).

A.J. HendrikslAquatic Toxicology 31 (1995) I-25 7
For more persistent organics, lower bioconcentration ratios C, : C,,,,, than expect- ed from Eq. (4) were observed for micro- or macrophytes. Swackhammer and Skoglund (1993) found bioconcentration of lipophilic microcontaminants in algae to be more than one order of magnitude lower than expected from the equilibrium partitioning theory at high production rates k, in laboratory assays and field blooms in summer. Decreased bioconcentration in shoots and leaves of terrestrial plants was attributed to trapping of airborne compounds that volatilize from the soil (Qiuping et al., 1991) and to slow transport in aqueous tissues that prevent steady state (Briggs et al., 1982; Topp et al., 1986).
Table 2 shows that the octanol-equivalent fat fraction prat.r of dead plants (=organic solids) is approximately equal to that of living plants so that concentrations in sus- pended solids and sediments can also be approximated by Eq. (5). The equilibrium ratio of the concentrations in organisms and in organic solids to which they are exposed can now conveniently be calculated by
(3
where pfat,i is the octanol-equivalent fat fraction in the organic solids (i = 0). The bioconcentration ratio to organic solids C,: C,,OsO, in kg-’ fw kg-’ dw, i.e. the ratio of concentrations in organism fat weight (Pfat,* = 1) and organic solids dry weight
0 fat.0 = 0.3, see Table 2) can now be estimated to be l/O.3 = 3.3. Since organic matter consists for about 50% of organic carbon, ratios to organic carbon are about half this value (= 1.7).
Expressing accumulation as bioconcentration ratios to organic solids C, : C,.,,,, instead of water C, : C,,,,, has several advantages. It facilitates interpretation of con- centrations measured in abiotic compartments. To reduce uncertainty caused by rela- tively low levels of contaminants, pollution by lipophilic organics is nowadays moni- tored in suspended solids and sediments instead of water of the Rhine-delta (Hen- driks, 1993). Moreover, fat-corrected ratios of concentrations in organic solids (sus- pended or sedimented), plants and animals facilitate the understanding of affinity- of compounds for living and dead biological matter present in the ecosystems.
Higher organisms. If one applies the model for exchange of contaminants with water to that of food, Eq. (5) can be used to describe the biomagnification ratio C,: C,, i.e. the ratio of concentrations in organisms and in their food, as well. Obviously, the quality and quantity of food changes during digestion and the total amount of the octanol-equivalent fat pfat,, - and with it the capacity to store contaminants - is likely to decrease along the digestive tract.
In guppy (Poecilia reticulata), about 0.1 to 0.7 of the ingested dry weight food was egested, while the fraction fat decreased from 0.1 to 0.05 (Sijm, 1992). Thus, the capacity to store microcontaminants in the octanol-equivalent fat fraction of the food may decrease from (l/0.1) x 2 = 20 to (l/0.7) x 2 = 3 when it becomes feces. This corresponds to lipid-corrected biomagnification ratios of the same magnitude, if we assume that the fat weight fraction in the fish pfat,2 and its food before intake pfat,, are

8 A.J. HendrikslAquatic Toxicology 31 (1995) 1-25
100
!I !____ 10
i 1
K 0.1
TeCBz- al
100
10: . . .
1
0.1
octanoi-water pdtion ratio Kc,,,, IW’P’l
Fig. 3.0, average (and its 95% confidence interval) organism fat weight and organic suspended solids dry weight bioconcentration ratios C2(oo) : C,,o,,, of more persistent organics in organisms and suspended soilids in Rhine-delta field surveys. ----, level expected from laboratory calibration; n = number of locations; fl= geometric mean of all ratios (except TrBbz and TeCBz); 29 to 18d = IUPAC numbers PCBs.

A. J. Hendriksl Aquatic Toxicology 31 (I 995) 1-25 9
about equal. Though the importance of fat digestion for exchange of microcontami- nants has repeatedly been reported (e.g. Miiller et al., 1978; Koss and Koransky, 1975; Takenaka and Takahashi, 1991), physiological evidence for the equilibrium mechanisms in the digestive track is poor. Yet, preliminary results from a study on intestinal permeation of microcontaminants support the idea that exchange of con- taminants with water and food may be driven by the same type of forces (Dulfer, personal communication).
Table 3
Bird or mammal wet weight to food wet weight concentration ratios C, : C, in laboratory experiments
Compound K OW Bird or mammal to food concentration ratios CJC,
Aves Rodentia” Ruminantia Canis Homob Specific
(kg-’ ww/kg-’ ww)
Malathion 5x lo* 3 x lo-L Tetrachloroethylene 3x lo3 1 x 1om3 y-Hexachlorohexane 5x10’ 8x10-’ lx lo-2 5 x 10-l a-Hexachlorohexane 6x 10’ 1 x IO-’ Fenthion 1 x IO4 1 x lo-4 Pentachlorophenol 2 x lo4 3 x 10-l 3 x lo-’ Heptachlor 3x10⁴ 8x10+ 3 x lo-’ 1,2,4$Tetrachlorobenzene 4x lo4 7 x IO-* 2,2’-Dichlorobiphenyl 9x IO4 2x lo-’ 2,2’3,5’,6-Pentachlorobiphenyl, PCB095 1 x 10S Endrin 2x10⁵ 3x10-I 1 x lo-’ 2 x 10-Z Dieldrin 3x105 sx10-’ 2 x 10-l 1 x 10-l 1,2,3,4-Tetrachloronaphtalene 3 x IO’ 2 x lo-’ 2,4’,5-Trichlorobiphenyl 5x lo5 3 x lo-2 Hexachlorobenzene 5x10⁵ 1 4 x lo-’ 1 x 10-l Aroclor 1254 3 x IO6 4 x 10-l 3 x lo-’ I x 10-2 Aldrin 3 x 10“ 6 x lo-’ I x 10-l 2 x 10-l DDT 5 x IO6 3 x lo-2 1 x 10-l 4 x lo-> 2,2’,4,4’,6-Pentachlorobiphenyl 6 x lo6 1 x 10-l 2,2’,4,4’,5,5’-Hexachloro- biphenyl, PCBl53 8x10& 5x10-r Aroclorl260 8x IO6 6x IO-’ 2 x 10-l DDE 9x 10” 2x 10-l 2,3,7,8-Tetrachlorodibenzo-p- dioxin 1 x 10’ 4 x lo-2 2 x 10-l Octachlorodibenzo-p-dioxin I x109 4 x lo-’ Cadmium” 4 x lo-” (Methyl)mercury” 3 x 10’ 1 x lo-”
2 x IO-’ 6 x 10-l
I x 10-l
5 x IO-‘* 9 x 10-j 1 . ..h’ 1 2
2x IO-’ 2x 10’ 2...5’ I’
4x IO’
I”
9 4...10h 3 x IO”
8
2’ 3,,9’.‘.“’
Data from Garten and Trabalka (1983) with additional data for specific compounds and taxa by “Geyer et al. (1980), bGeyer et al. (1987), ‘Stevens (1992) dHornshaw et al. (1983, Mustela vision with PCB95 and PCB153 as major compounds), ‘Roylace (1985, Anus plutyrhynchos), ‘Vos et al. (1971, 1972, Coturnix
coturnix), BWren (1991, Mustela vision), %lark and Stafford (1981), Myotis lucifugus, upper values apply to starved bats), ‘Porter and Wiemeyer (1972, F&o spurverius), ‘Cain et al. (1983, Anas plutyrhynchos),
‘Wren (1991, Lutra canadensis), ‘Finley and Stendell (1978, Anus rubripes), *Borg et al. (1970, Accipter
gentilis); “in liver or kidney.

10 A. J. HendrikslAquatic Toxicology 31 (1995) 1-25
F I T o%ue~ "i&04' "i&36' “i’ii.06 “““, B
la+07
3
o%+03~ "i'Go4‘ ’ “Go6 “ib;oe‘ ““- lo+07
Fig. 4. q , average (and its 95% confidence interval) roach fat weight and organic suspended solids dry weight bioconcentration ratios C,(W) : CO,,,, of persistent organics in Rhine-delta field surveys. - - - -, level expected from laboratory calibration; n = number of locations; p = geometric mean of all rartios.

A.J. HendrikslAquatic Toxicology 31 11995) 1-25 11
As long as equilibrium biomagnification ratios C, : C, cannot be predicted from the digestibility of fat in food, calibration will have to rely on values reported in laborato- ry studies. To get an idea of its magnitude for various compounds, we collected some values of C,: C, for birds and mammals in Table 3. One may conclude that the ratios rarely exceed 1, probably largely due to short exposure periods (t<<m). Higher values are occasionally reported, especially for species that are not traditionally used in laboratory experiments.
4.1.2. Field validation Lower organisms. Fig. 3 gives the bioconcentration ratios for more persistent or- ganics in aquatic invertebrate and fish fat versus those in dry organic suspended solids (C, : Co,OSo,) as measured in our monitoring programs (see section on methods).
We may conclude that most ratios for invertebrates do not significantly deviate from the 3.3 expected from laboratory calibration in the previous section. There was no difference observed between the benthic chironomids, the epibenthic molluscs and the pelagic crustaceans. Levels in fish are about twice as high, possibly due to addi- tional exposure to food. Here too, overall lipid-corrected accumulation appears to be similar for the zoo-planktivorous and -benthivorous roach (Rutilus rutilus), the pis- civorous pike-perch (Stizopedion lucioperca) and eel (Anguilla anguilla) of an interme- diate trophic level. The highest ratios were measured for y-hexachlorohexane (I/-HCH), dieldrin, the higher chlorobifenyls (PCBs), DDD and DDE. The lower ratios that were sometimes observed for 01- andp-HCH, tri- and tetra-chlorobenzenes (TrBz, TeBz), hexachlorobenzene (HxBz) and DDT may be attributed to degradation or volatilization after passage of the suspended solids monitoring spot or to transfor- mation in the organisms.
We also calculated bioconcentration ratios C,: CO,OSOl to sediment instead of sus- pended solids. As these were generally one order of magnitude lower than expected from laboratory equilibrium bioaccumulation, we did not elaborate on these data. The observation that concentration ratios to suspended solids were close to expected levels whereas those to sediment were substantially lower may be understood from the short residence time of water in the rivers and lakes and the pelagic nature of the taxa sampled.
To obtain an impression of the variability between different life stages, Hendriks and Pieters (1993) also sampled different cohorts of roach (R. rutilus) throughout the Rhine delta. As demonstrated by Fig. 4, residues of organics were on the same level in different cohorts, indicating that variability between young and old fish is small.
At Nieuwe Merwede, the same organochlorine compounds were measured in the freshwater plant Potamogeton pectinatus (Ruys, personal communication). The con- centration ratios C, : CO,OSO, varied from 0.47 (HxCBz) to 8.8 for (a-HCH) for suspend- ed solids and from 0.26 (PCB52) to 2.5 (y-HCH) for nearby sampled sediments.
Both laboratory calibration and field validation suggest that equilibrium concen- tration of organics in dead and living plants and in animals can be approximated with the ratio given for the lower end of the foodchain in Fig. 5. Moreover, the accumula- tion patterns are confirmed by field studies in other areas. In more stagnant lakes, concentrations in organism fat were 0.5 (invertebrate) to 10 (fish) times those in

12 A. J. Hendriksl Aquatic Toxicology 31 (1995) 1-25
sediment organic carbon (Bierman, 1990; Ankley et al., 1992). In an extensive review on laboratory and field ratios, concentrations of Z PCBs were on average 1.1 (suspen- sion feeders) to 5 (fish) times higher than adsorbed at organic carbon (Parkerton, 1993). Ratios for individual organochlorine compounds reached the level of 10, which is about twice as high as the maxima of Fig. 3 if expressed in similar units. Thomann
Table 4 Average bird fat weight to food fat weight concentration ratios C, : C, in Rhine-delta field surveys
Compound K OW Lake
Zoommeer, Volkerak Ketelmeer, Markermeer
Prey
Zebra mussel (D. polymorpha)
Predator
Perch Zebra mussel Roach (G. cernua) (D. poly- (R. rutilus) Perch morpha) Eel (P Jluviatilis) (A. anguilla)
Avocet Pochard Common tern Pochard Cormorant (R. avosetta) (A. fuligula) (S. hirundo) (A. fuligula) (I? carbo)
egg egg egg liver liver
Number of prey and predator samples, respectively
4, 5 4,5 4, 5 (8)“, 5 20, 4
@g kg-’ fw/pg kg-’ fw)
Pentachlorobenzene 2x10⁵ 11 8 7 Cl 14 Hexachlorobenzene 5x lo5 15 2 4 2 16 PCB028 4x10⁵ 4 5 3 Cl 19 PCB052 1x10⁶ 1 2 <l <l 1 PCBlOl 1x10⁶ 3 1 2 Cl 2 PCBl18 1 x 10’ 10 5 5 2 26 PCB138 3x10⁶ 11 6 6 1 25 PCB153 4x10⁶ 9 5 6 3 32 PCBl80 5x lo6 10 2 12 3 37 a-Hexachlorocyclohexane 6 x 10’ 1 2 1 2 13 /J-Hexachlorocyclohexane 7 x 10’ 1 2 <l 13 20 r-Hexachlorocyclohexane 5 x 10’ 2 2 3 <l 3 Dieldrin 3x10S 3 4 1 3 19 DDD 2x 10⁶ 1 4 <l <I 2 DDE 9x IO6 31 103 6 3 81 DDT 8~10~ 3 5 <l 26 6 DDT + DDE + DDD 24 70 4 4 37 Organics (geometric mean) 5 6 2 1 13 Cadmium na na na < lb 8” Copper na na na 3b nd Mercury na na na 6 144
nd, not detected; na, not analyzed; aone mixed sample of 8 individuals, ‘3 prey samples; “thought to represent other zoobenthos as well.

A. J. Hendriksl Aquatic Toxicology 31 (I 995) l--25 I3
Phalacrocorax _/c&T
u
secundary carnivores
primary carnivores
Pisces _* .
“1,
: Al!2 r
UB
bet&_
lnsecta herbivores
Crustacea /-*x_ Annelida ___
7 ,yJr. w -11_2‘r ” producers
IJJJl l l * %
Schizophyta organic solids Tracheophyta
Fig. 5. Typical ranges of bioaccumulation ratios C,(w): C, to the next trophic level for more persistent organics in laboratory experiments (except birds) and field surveys in as derived in this paper.
(1989) reported fat-corrected concentrations of persistent organics in predatory fish to be at most 3 times those in prey fish for the 20 combinations reviewed.
Higher organisms. In Table 4, we compared the average concentrations of more persistent organics in eggs and livers of some carnivorous birds to levels measured in prey from the same region. Concentrations of hexachlorobenzene, PCB118, PCB138, PCB138, PCB153, PCB180 and DDT+DDD+DDE in birds are repeatedly higher than in their food, especially in cormorant (Phalacrocorax carbo). The extreme values for DDE may reflect an additional internal source caused by the transformation of DDT to DDE. The lipid-corrected biomagnification ratios from these field studies are higher than those observed in laboratory experiment according to Table 3. Whereas experimental ratios seldom exceed 10, field values repeatedly reach higher values. This may be understood from differences in exposure periods (short-term in laborato- ry versus long-term and pre-natal in field), food (seeds versus meat) and kinetics in species (resorption efficiency, transformation capacity).
Here too, the typical ratios summarized in Fig. 5 are confirmed by other field observations. Van den Berg (1987) found wet weight concentrations of 2,3,7,8-tetra- chlorodibenzodioxin (2,3,7,8-TeCDD), 2,3,4,7,8-pentachlorodibenzofuran (2,3,4,7, 8-PnCDF) and 1,2,3,6,7,8-hexachlorodibenzodioxin (1,2,3,6,7,8_HzCDD) in cormo- rant (Z? carbo) livers from the IJsselmeer region to be 12,340 and 30 times the average level in eel (A. anguilla) from several lakes. The outlier of 340 may be caused by feeding on exceptionally contaminated eel (e.g. from lake Ketelmeer) not sampled by Van den Berg (1987). For a province that is partially supplied with Rhine water, Broekhuizen and De Ruiter-Dijkman (1988) reported Z PCB residues in liver and

14 A.J. HendrikslAquatic Toxicology 31 (1995) 1-25
kidney of otter (Lutra lutra) to vary between 3.4 x lo3 and 2.4 x 10⁵pg kg-’ fw. Levels in fish ranged from 1 x 1 O3 to 1 x 1 O4 ,ug kg-’ fw. If high otter residues are caused by high fish residues, biomagnification ratios are between 3.4 and 24. In the same prov- ince, Votite (1981) measured chlorobiphenyl levels of 1 x lo4 pug kg-’ fw in pond bat (Myotis dasycneme), suggesting that biomagnification for zoobenthivorous and pis- civorous mammals may be similar. In the Wadden sea, also heavily contaminated with Rhine water, Boon et al. (1989) measured PCB 138 concentrations in extractable lipids and reported levels in seal (Phoca vitulina) blood to be about 3 and 10 times those in fish and invertebrates, respectively.
For the Great Lakes, Braune and Norstrom (1989) reported fat-corrected biomag- nification ratios in whole body herring gull (Larus argentatus) and its food alewife (Alosa pseudoharengus) to vary between about 5 and 10 (HxCBz, /I-HCH, PCBlOl, dieldrin), around 20 (DDE+DDT, PCBl18) and between 30 and 50 (PCB138, PCB153+132, PCBl80). As in our study, the highest biomagnification ratios were observed for DDE and chlorobiphenyls without adjacent meta and para positions free for oxidation, such as PCB138, PCB153 and PCB180 (see also Walker, 1990). Braune and Norstrom (1989), report whole body residues for PCBs that were twice as high as liver and egg concentrations. As elaborated by Walker (1990), larger differ- ences between organs indicate non-equilibrium, for instance after prolonged starva- tion.
4.2. Less persistent organics
4.2.1. Laboratory data Eq. (2) states that the equilibrium concentration in the organism C, will decrease
almost proportionally to the excess outflow caused by transformation if it exceeds the minimum physicochemical outflow.
In some laboratory studies, ratios of concentrations of phosphorbiocides (OPB), chloronitrobenzenes (CNBz), -anilines, -dibenzodioxins (PCDD) and -furans (PCDFs) in organisms and water were at least one order of magnitude lower than those of isolipophilic chlorobenzenes and -biphenyls (Opperhuizen and Sijm, 1990; De Bruijn and Hermens, 1991; De Wolf et al. 1992). Yet, bioconcentration of polycy- clic aromatic hydrocarbons (PAH) was shown to be equal to that of more persistent isolipophilic compounds in laboratory experiments (Hawker and Connell, 1986; Mackay, 1982; De Voogt et al., 1991). Long-term assays yielded lower levels of ben- zo(a)pyrene in oyster (Crassostrea virginica) and mosquitofish (Gambusia affinis) (Couch et al., 1979; Lu et al., 1977) but not of phenanthrene in fathead minnow (Pimephales promelas).
4.2.2. Field data Since less persistent organics are less likely to cause accumulation in foodchains,
they get a low priority in monitoring programs. Consequently, field validation for these compounds has to rely on small sets of data.
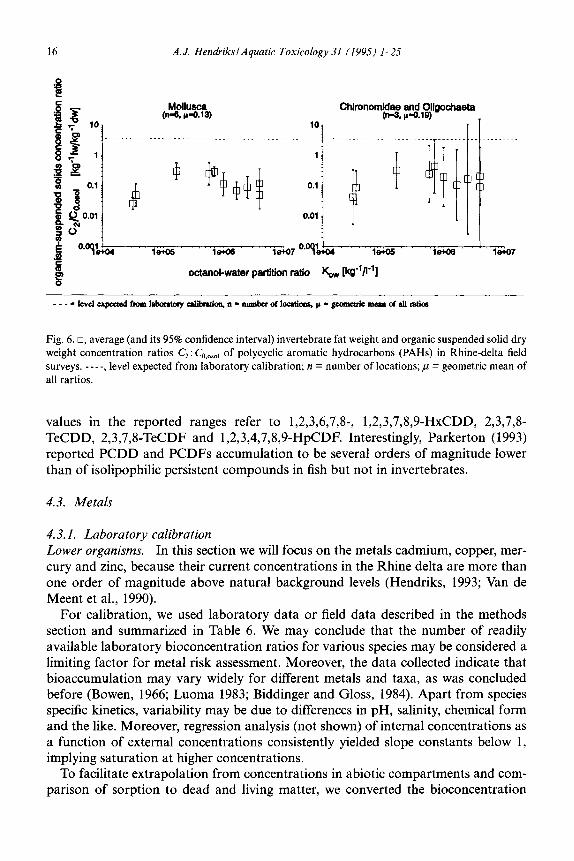
Fig. 6 gives the ratios of PAHs concentrations measured in invertebrates and organ- ic suspended solids (Hendriks and Pieters, 1993). The average ratio per compound

A.J. HendriksiAquatic Toxicology 31 (1995) I-25 15
varied between 0.03 (anthracene in molluscs) and 0.45 (chrysene in chironomids and oligochaetes). These levels are close to the 0.1 to 0.3 reported for PAHs and inverte- brates (Eadie et al., 1983) but Parkerton (1993) reported ratios to be close to those of more persistent compounds. We may conclude that field levels can be one order of magnitude lower than expected from laboratory accumulation of PAHs and isolipo- philic CBzs or PCBs.
To get an idea of concentration ratios of less persistent organics infish, we compar- ed residues of polycyclic aromatic hydrocarbons (PAHs), chlorophenols (CP), -nitro- benzenes (CNBz), -dibenzodioxines (PCDD) and -dibenzofurans (PCDF) in eel (A. anguiEla) to levels in abiotic compartments (Van der Valk et al., 1989; Venema, 1991; IRC, 1992a; Hendriks, 1993).
As summarized in Table 5, CP, CNBz, and PAH residues in fish were generally below or just above the detection limits of l-1Opg kg-’ ww. Accumulation of CPs and CNBzs in fish is in the same range as those of the lower CBzs and DDT in Fig. 3.
Bioconcentration ratios C, : Co,_,, for polycyclic aromatic hydrocarbons and fish in the Rhine-delta is exceptional low compared to laboratory data, but similar to values observed under other field conditions (e.g. Broman et al., 1990; Biddinger and Gloss, 1984; Van der Oost et al., 1991). It may be understood from biotransformation that develops after long-term exposure to chemicals in field conditions but not in short- term laboratory experiments with a single compound (e.g. Van de Guchte and Ten Hulscher, unpublished; Van der Oost et al., 1991).
Accumulation of chlorodibenzodioxins and -dibenzofurans is also lower than that of the more persistent compounds of the previous section, as may be expected from the above mentioned laboratory experiments (Opperhuizen and Sijm, 1990). The highest
Table 5 Ranges of eel (Anguillu anguilla) fat weight to organic suspended solids dry weight bioconcentration ratios
CZ : C”,,,,, for less persistent organics in Rhine-delta field surveys
Compounds c “.OSOI C, C, : G,,,,, ols kg-’ dw) 018 kg-’ fW (kg-‘fwlkg-’ dw)
2,4,6-Trichlorophenol 1 x IO’“.’ 1 x 10’ 1 Pentachlorophenol 1 x 10²a.C 53 x 10’ co.3 Mono-, Dichloronitrobenzenes 2 x lo’...5 x 10’” S5...S3 x 10’ Cl Fluoranthene 1 x 10⁴d 1 x 10’ I x lo-’ Other polycyclic aromatic hydrocarbons (PAHs) 6 x 10’” 55 51 x lo-? Chlorodibenzodioxins (PCDDs) 3 x 1o-2...3 x 10Zb 2 x lo-‘...l x 10-l 5 x lo-)...3 x 10-l Chlorodibenzofurans (PCDFs) 1 x 10~*...2 x 10Zb 5 x lo-4...5 x lo-* 2 x lo-4...2x 10-l
C “.OSOl = average of “12 or ‘2 samples taken at Lobith in 1988 and 1990 (Venema, 1991; Hendriks, 1993; IRC, 1992a); ‘estimated from total water concentrations assuming equilibrium partitioning. C, = pooled samples of 25 specimen (30-40 cm) of eel (A. anguih) per location, taken from five locations downstream from Lobith (Van der Valk et al., 1989). PAHs = benzo(b)fluoranthene, benzo(k)fluor- anthene, benzo(a)pyrene, benzo(g,h,i)-perylene, indeno( 1,2,3-c,d) pyrene; PCDDs = 2,3,7,8-TeCDD, 1,2,3,7,8-PeCDD, 1,2,3,4,7,8-HxCDD, 1,2,3,6,7,8-HxCDD, 1,2,3,7,8,9_HxCDD, 1,2,3,4,6,7,8_HpCDD and OCDD; PCDFs = 2,3,7,8-TeCDF, I 2 3 7 8-PeCDF, 2,3,4,7,8-PeCDF 1,2,3,4,7,8_HxCDF, , 1 > , 1,2,3,6,7,8-HxCDF, 2,3,4,6,7,8_HxCDF, 1,2,3,7,8,9-HxCDF, 1,2,3,4,6,7,8-HpCDF, 1,2,3,4,7,8,9_HpCDF and OcCDF. Other compound names in Table 1.
16 A.J. HendrikslAquatic Toxicology 31 (199.5) 1-25
Mollu3os b-3. r-0.13)
Chimom~~ anxn,C#gochaeta 1 .
10
octanol-water partition ratio &,,, [kgsl/lml]
I I
--Go7
Fig. 6. q , average (and its 95% confidence interval) invertebrate fat weight and organic suspended solid dry weight concentration ratios C, : C,,_,, of polycyclic aromatic hydrocarbons (PAHs) in Rhine-delta field surveys. - -- -, level expected from laboratory calibration; n = number of locations; ,U = geometric mean of all rartios.
values in the reported ranges refer to 1,2,3,6,7,8-, 1,2,3,7,8,9-HxCDD, 2,3,7,8- TeCDD, 2,3,7,8-TeCDF and 1,2,3,4,7,8,9_HpCDF. Interestingly, Parkerton (1993) reported PCDD and PCDFs accumulation to be several orders of magnitude lower than of isolipophilic persistent compounds in fish but not in invertebrates.
4.3. Metals
4.3.1. Laboratory calibration Lower organisms. In this section we will focus on the metals cadmium, copper, mer- cury and zinc, because their current concentrations in the Rhine delta are more than one order of magnitude above natural background levels (Hendriks, 1993; Van de Meent et al., 1990).
For calibration, we used laboratory data or field data described in the methods section and summarized in Table 6. We may conclude that the number of readily available laboratory bioconcentration ratios for various species may be considered a limiting factor for metal risk assessment. Moreover, the data collected indicate that bioaccumulation may vary widely for different metals and taxa, as was concluded before (Bowen, 1966; Luoma 1983; Biddinger and Gloss, 1984). Apart from species specific kinetics, variability may be due to differences in pH, salinity, chemical form and the like. Moreover, regression analysis (not shown) of internal concentrations as a function of external concentrations consistently yielded slope constants below 1, implying saturation at higher concentrations.
To facilitate extrapolation from concentrations in abiotic compartments and com- parison of sorption to dead and living matter, we converted the bioconcentration

A. J. Hendriksl Aquatic Toxicology 31 (ISUS) l--25 11
ratios to water C,: C,,,,, into ratios to solids C,: CO,sOl, using the solid-water parti- tioning ratio of Table 6 (Van der Kooij et al., 1991). On average accumulation in organisms tend to be 10 times lower than sorption to solids but we should keep in mind that laboratory data represent experiments with exposure time that were long enough to reach an estimated 10% or more of the equilibrium level.
Nevertheless, some clear outliers were noted in this limited data set. Bioconcentra- tion of Cd (green algae) and Cu (blue-green algae) in microphytes deviated substan- tially from the mean range. Somewhat higher levels were recently reported by
Table 6 Organism dry weight to water or suspended solids dry weight concentration ratios Cl: C’,, for metals in laboratory experiments and (Rhine-)field surveys
Literature (calibration)
c* : G,m G : Go, (kg-’ dw I-‘) (kg-’ dw kg-’ dw)
p onp
Cd (KS, = 1 x 10’ kg-’ I-‘) microphytes I 2 x 10’ (2 x lo’-2 x 10³) 8 5 0.002 (0.0002-0.02) macrophytes f 3x lO’(1 x lo’-7x 10³) 2 5 invertebrates I 3 x lo4 (3 x 10⁴-3x 10⁴) 1 2 0.2 (0.2-0.3) fish 1 6x 10’ (2x lo’-2x 10’) 4 8 0.0005 (0.0002-0.001)
Cu (K, = 5 x IO4 kg-’ I-‘) microphytes I 7 x IO’ (3 x IO’-1 x 10’) 3 IO 0.001 (0.000770.003) macrophytes f 1 x 10’ (3 x IO44 x 105) 4 7 2 (0.7-9) invertebrates f 6 x 10’ (7 x 10²-5 x 10⁴) 5 4 0.1 (0.01-l) fish f 2 x 10’ (7 x 10’4~ IO’) 2 6 0.03 (0.01-0.08)
Hg (KSW = 2 x IO’ kg-’ I-‘) microphytes” 1 4 x lo4 I 0.2 macrophytes” f 0 invertebratesa I 1 x lO’(l x lo’-1 x 10⁵) 1 2 0.7 (0.7-0.8) fish” 1 9 x lo3 (5 x 10³-2x 10⁴) 3 15 0.05 (0.0330.1) fishb 1 6 x lO’(3 x IO’-1 x 10⁴) 6 27
Zn (KSW = 1 x 10’ kg-’ I-‘) microphytes f 3 x 10³(2x lo’-5 x 10’) 3 13 0.03 (0.02-0.05)
macrophytes f 3 x lO’(l x105-8x 10’) 3 6 3 (1-7) invertebrates f 1 x lo4 (3 x lo’-5 x 10⁵) IO 4 0.1 (0.003-5) fish f 2x lO’(1 x 10³-2x 10’) 1 6 0.02 (0.01-0.02)
Rhine-delta field (validation)
Cz : G,so, (kg-’ dw I-‘)
P 0 n
0.3 (0.2-0.4) 2 6 0.2 (0.1-0.4) 2 14 0.002 (O.OOl~O.005) 3 8
0.2 (0.1-0.2) I 6 0.2 (0.1-0.4) 2 13
0.2 (0.1-0.4) 2 6 0.2 (0.1-0.3) 2 19 0.3 (0.1-0.7) 3 8
0.2 (0.2-0.3) 1 6 0.3 (0.2-0.4) 2 13
,U = geometric mean with 95% confidence interval = 10X”“KX”“, u = ‘geometric’ standard deviation = 10 4 z t& (log X)-IO&~, n = number of data, literature calibration with laboratory (= I) studies if available and else with field (= t) studies, “inorganic (lab) or total (field) mercury and bmethylmercury. Literature calibration (Pilli et al., 1989; Taylor 1983): microphytes, Chlorophyta and Cyanophyta; macro- phytes, Tracheophyta; invertebrates, Annelida, Mollusca, Insecta; fish, Osteichtyes. Rhine-delta field validation: macrophytes, Potamogeton pectinatus roots (Ruys, personal communication); invertebrates, Oligochaeta, Crustacea (mainly Cladocera), Chironomidae, Mollusca (Dreissenapolymorpha and Anodonta cygnea) (Hendriks and Pieters, 1993; RIZA, 1990); fish, Rut&s r&us, Anguilla anguilla (IRC, 1992b).

18 A.J. HendrikslAquatic Toxicology 31 (1995) I-25
0
'Sle+05 0 s E 2 s P 0 .Sle+04
kle+O1
1e+03+---- I-- 1 I-~_ - ._A le_02
1976 1980 1984 1988 time
Fig. 7. Cadmium and copper concentrations in D. polymorpha and in filtrated water (Marquenie and De Kock, 1983; Kraak et al., 1991; Hendriks, 1993).
Koelmans and Lijklema (1992), who found affinity of cadmium to Cryptomonas spp. to be similar to sorption to organic particles but about 10 (Fe-oxides) to 100 (Mn- oxides) times lower than binding to mineral particles. The lower sorption in the few studies cited may indicate a lower bioconcentration potential in microphytes but it may also reflect specific conditions, such as the high production rates observed in studies on organics (Swackhammer and Skoglund, 1993).
Metals also tend to accumulate less strongly in fish. This may reflect residues far below equilibrium levels, accumulation in specific target organs or simply a lower potential in this taxon.
Higher organisms. Biomagnification in vertebrates may be considered unlikely for metals, such as lead, that are stored in non-edible tissues. Yet, the metals considered here are either distributed evenly (typically Cu and Zn) or concentrated in specific edible organs (typically Cd and Hg) of vertebrates (Bowen, 1966; Benoit et al., 1976; Calamari et al., 1982; Hunter and Johnson, 1982; Talmage and Walton, 1991).
According to Table 3 biomagnification ratios for cadmium and mercury in liver and kidney of birds and mammals are generally below 1 and occasionally around 10.
4.3.2. Field validation Lower organisms. Table 6 also gives the bioconcentration ratios Cz: CO,sol that were measured in plants, invertebrates and fish of the Rhine delta. We may conclude that the ratios are within the range of 0.2 to 0.3, with exception of cadmium and fish. Yet, the values of 0.2 to 0.3 are close to the average level of about 0.1 expected from literature data in the previous section. They are also in accordance with data from a more stagnant unpolluted lake, where residues in invertebrates were equal to or lower than sediment concentrations (Timmermans et al., 1989).

A. J. Hendriksl Aquatic Toxicology 31 (1995) l-25 19
Moreover, the low values for cadmium and fish were also anticipated from the laboratory data. The ratios for microphytes of less than 0.2, calculated from literature values could not be verified by field data because of a lack of field data.
To confirm the tendency of saturation observed in literature data, Fig. 7 shows the cadmium and copper concentrations in zebra mussel (Dreissena polymorpha) and in filtered water (Marquenie, 1983; Kraak et al., 1991; Hendriks, 1993) at Lobith during 1976 to 1990. Though the concentrations decreased in mussel as well as water, the bioconcentration ratio C, : C,,,,, increases gradually. This phenomenon indicates that linear extrapolation of bioaccumulation ratios obtained from studies with high con- centrations, viz. laboratory experiments and past field surveys, underestimates resi- dues in less polluted conditions. Similar errors may be introduced for metals that are regulated by the species concerned (Luoma, 1983; Hunter and Johnson, 1982; Laskowski, 1991; Memmert, 1986; Scheuhammer, 1987; Krantzberg and Stokes, 1989; Rainbow and White, 1989) and environmental conditions that control the bio- logical availability (e.g. McCarthy, 1989; Wang, 1987; Luoma, 1983). Measurements of both laboratory and field bioconcentration ratios is therefore considered indispen- sable for a sound risk assessment.
Higher organisms. Due to expected absence of biomagnification, metals are seldom monitored in birds and mammals of the Rhine delta. The available information in Table 4 indicates that field levels are in the range obtained from laboratory experi- ments in Table 3. Moreover, substantial metal accumulation in birds and mammals at the higher end of aquatic and terrestrial foodchains has not been reported in most reviews so far (e.g. Biddinger and Gloss, 1984; Laskowski, 1991; Taylor, 1983; Jans- sen, 1991; Talmage and Walton, 1991).
Biomagnification of mercury in Table 4 is believed to be caused by the transforma- tion of inorganic to methyl-mercury in the lower end of the foodchain. The occur- rence of extremely high ratios in cormorant (p carbo) livers is confirmed by a study that reports residues in cormorant (Phalucrocorux uuritus) liver to be 6 times higher than the highest residues in nine other bird species from the same area (Braune, 1987).
5. Conclusions
From calibration with laboratory studies from literature and validation with field surveys from the Rhine delta we conclude that: (1) Fat weight corrected concentrations of more persistent organics (PCBs, CBzs,
OCBs) in (see Fig. 5): (a) organic suspended solids, freshwater plants and invertebrates tend to be on the
same level, both in laboratory experiments and field surveys; (b) fish from the Rhine delta were about twice as high as those in invertebrates and
as expected from laboratory experiments; and (c) birds from the Rhine delta were one order of magnitude or more above those
in their invertebrate and fish prey, whereas bioaccumulation in common labo- ratory birds and mammals did not exceed their food level by more than 10.

20 A.J. Hendriksl Aquatic Toxicology 31 (1995) 1-25
(2) Fat weight corrected concentrations of less persistent organics can be substan- tially lower than those of more persistent isolipophilic compounds. Whereas bio- accumulation of PAHs in (short-term, one compound) laboratory experiments was similar to that of more persistent compounds, field levels were 30 (in inverte- brates) and more than 1000 (in fish) times lower than expected. Though less urgent for consumption by top predators, a clear understanding of internal exposure of lower organisms to less persistent compounds is badly needed. More extensive laboratory and field studies and a systematic interpretation of it will enhance risk assessment for this large group of chemicals.
(3) Dry weight corrected concentrations of cadmium, copper, mercury and zinc in: (a) plants and invertebrates from the Rhine delta were 0.2 to 0.3 times the concen-
trations in suspended solids, as more or less expected from literature; (b) fish were lower than for invertebrates both for literature and Rhine delta
data; (c) kidneys and livers of laboratory and field birds or laboratory mammals are at
most 10 times those in their food. The pattern of bioaccumulation of mercury is similar to that of extremely persistent organics.
In this paper, we related the residues in the organisms to the concentrations meas- ured in (organic) suspended solids. It simplifies comparison to data from monitoring programs for abiotic compartments that sample suspended solids and sediments in- stead of water nowadays. In addition, it facilitates comparison of bioconcentration in lower organisms with sorption to dead organic matter and with biomagnification at the higher end of the foodchain, as illustrated by Fig. 5.
Whereas exchange of contaminants with dead matter must be passive by necessity, concentration kinetics in living biota may also comprise an active (i.e. enzymatic and energy consuming) uptake and release. However, the patterns emerging in this paper as summarized in the conclusions 1 to 3 strongly suggests that ad-, ab- and desorption of contaminants in both dead and living matter is of a largely passive nature, driven by affinity for octanol-equivalent fat weight and dry weight fractions. Moreover, Eq. (1) represents the one-compartment model that is widely applied to phenomena with- out active flows and a non-steady state analysis supports the idea of largely passive exchange (elaborated in Hendriks, 1994).
Obvious exceptions that were also mentioned before refer to metals that are regu- lated and -by definition-to organics that are biotransformed.
Though a correct understanding of the general mechanistic principles generally improves the performances of a model, one may apply the relationships also as such. They are intended to improve risk assessment for the thousands of species that are to be protected from the thousands of compounds released in our rivers and lakes.
Acknowledgements
The author wishes to thank the following people for their valuable contributions.
A.J. HendrikslAquatic Toxicology 31 (1995) l-25 21
Mennobart van Eerden, Maarten Platteeuw, Henk Pieters, Mado Ruys and Charlotte Schmidt kindly supplied additional data on Rhine delta residues, whereas Thomas Parkerton and Sies Dogger generously provided some unpublished results. Kees van de Guchte, Piet den Besten and Wim Ma gave valuable comments on the manuscript. Catherine Ponsford corrected the English text.
References
Ankley, G.T., P.M. Cook, A.R. Carlson, D.J. Call, J.A. Swenson, H.F. Corcoran and R.A. Hoke (1992) Bioaccumulation of PCBs from sediments by oligochaetes and fishes: comparison of laboratory and field studies. Can. J. Fish. Aquat. Sci. 49,2080-2085.
Aoyama, I. and Y. Inoue (1987) Simulation analysis of the concentration process of trace heavy metals by aquatic organisms from the viewpoint of nutrition ecology. Water Res. 12, 837-842.
Baker, A.J.M. (1981) Accumulators and excluders strategies in the response of plants to heavy metals. J. Plant Nutr. 3,643-654.
Bartell. S.M., R.H. Gardner and R.V. O’Neill (1984) The fates of aromatic model (FOAM): description. application and analysis. Ecol. Modelling 22, 109-122.
Belfroid, A., A. van Wezel, M. Sikkenk, K. van Gestel, W. Seinen and J. Hermens (1993) The toxicokinetic behavior of chlorobenzenes in earthworms (Eisena andrei): experiments in water. Ecotoxicol. Environ. Saf. 25, 154165.
Benoit, D.A., E.N. Leonard, G.M. Christensen and J.T. Fiandt (1976) Toxic effects of cadmium on three generations of brook trout, Salvelinus fontinalis. Trans. Am. Fish. Sot. 105, 55@560.
Biddinger, G.R. and S.P. Gloss (1984) The importance of trophic transfer in the bioaccumulation of chemical contaminants in aquatic ecosystems. Residue Rev. 91, 103-146.
Bierman, V.J., Jr. (1990) Equilibrium and biomagnification partitioning of organic chemicals in benthic animals. Environ. Sci. Technol. 24, 1407-1412.
Boon, J.P., F. Eijgenraam, J.M. Everaarts and J.C. Duinker (1989) A structure-activity relationship (SAR) approach towards metabolism of PCBs in marine animals from different trophic levels. Mar. Environ. Res. 27, 159-176.
Borg, K., K. Erne, E. Hanko and H. Wanntorp (1970) Experimental secondary mercury poisoning in the goshawk (Accipter gentilis gentilis). Environ. Pollut. 1, 91-104.
Bowen, H.J.M. (1966) Trace Elements in Biochemistry. Academic Press, New York. Braune, B.M. (1987) Comparison of total mercury levels in relation to diet and molt for nine species of
marine birds. Arch. Environ. Contam. Toxicol. 16, 217-224. Braune, B.M. and R.J. Norstrom (1989) Dynamics of organochlorine compounds in herring gulls:
III. Tissue distribution and bioaccumulation in lake Ontario gulls. Environ. Toxicol. Chem. 8, 9577968. Briggs, G.G., R.H. Bromilow and A.A. Evans (1982) Relationships between lipophilicity and root uptake
and translocation of non-ionised chemicals by barley. Pestic. Sci. 13,495-504. Broekhuizen, S. and E.M. de Ruiter-Dijkman (1988) Otters met PCB’s: de zeehondjes van het zoete water’?
(Otters with PCBs: the seals of fresh waters? Lutra 31, 68-78 (in Dutch). Broman, D., C. Naf, I. Lundbergh and Y. Zebuhr (1990) An in situ study on the distribution, biotransfor-
mation and flux of polycyclic aromatic hydrocarbons (PAHs) in an aquatic food chain (Seston Mytilus edulis L.-Somateria mollissima) from the Baltic: an ecotoxicological perspective. Environ. Toxicol. Chem. 9,429442.
Buhler, D.R. and D.E. Williams (1988) The role of biotransformation in the toxicity of chemicals. Aquat. Toxicol. 11, 19-28.
Cain, B.W., L. Sileo, J.C. Franson and J. Moore (1983) Effects of dietary cadmium to mallard ducklings. Environ. Res. 32, 286-297.
Calamari, D., G.F. Gaggino and G. Pacchetti (1982) Toxicokinetics of low levels of Cd, Cr, Ni and their mixture in long-term treatment on Salmo gairdneri. Chemosphere 11, 59-70.
Clark, D.R. and C.J. Stafford (1981) Effects of DDE and PCB (Arochlor 1260) on experimentally poisoned

22 A. J. Hendriksl Aquatic Toxicology 31 (1995) l-25
female little brown bats (Myotis lucifugus): lethal brain concentrations. J. Toxicol. Environ. Health 7, 925-934.
Connell, D.W. and R.D. Markwell (1990) Bioaccumulation in the soil to earthworms system. Chemosphere 20,91-100.
Connolly, J.P. and R. Tonelli (1985) Modelling kepone in the striped bass food chain of the James River estuary. Estuar. Coastal Shelf Sci. 20, 349-366.
Couch, J.A., L.A. Courtney, J.T. Winstead and S.S. Foss (1979) The american oyster (Crassostrea virgini- ca) as an indicator of carcinogens in the aquatic environment. In: Animals as Monitors. EPA-600/J-79- 080, National Academy of Science, Washington DC, pp. 65584.
De Boer, J. (1988) Chlorobiphenyls in bound and non-bound lipids of fishes; comparison of different extraction methods. Chemosphere 17, 1803-l 8 10.
De Bruijn, J., F. Blusser, W. Seinen and J. Hermens (1989) Determination of octanol/water partitioning coefficients for hydrophobic organic chemicals with the slow-stirring method. Environ. Toxicol. Chem. 8,499-512.
De Bruijn, J. and J.L.M. Hermens (1991) Qualitative and quantitative modelling of toxic effects of organo- phosporous compounds to fish. Sci. Total Environ. 109/l 10,441-445.
De Voogt, P., B. van Hattum, P. Leonards, J.C. Klamer and H. Govers (1991) Bioconcentration of polycyclic heteroaromatic hydrocarbons in the guppy (Poecilia reticulata). Aquat. Toxicol. 20, 169- 194.
De Vries, M.B. (1990) Manual uptaqe/cheops 1 .O. Delft Hydraulics, Delft, The Netherlands. De Wolf, W., J.H.M. De Bruijn, W. Seinen and J.L.M. Hermens (1992) Influence of biotransformation on
the relationship between bioconcentration factors and octanol-water partition coefficients. Environ. Sci. Technol. 26, 1197-1201.
Eadie, B.J. (1981) An equilibrium model for the partitioning of synthetic organic compounds: formulation and calibration. NOAA Tech. Mem. ERL GLERL-35, Great Lakes Environmental Research Laborato- ry, Ann Arbor, MI.
Finley, M.T. and R.C. Stendell(l978) Survival and reproductive success of black ducks fed methyl mercu- ry. Environ. Pollut. 16, 51-64.
Gabric, A.J., D.W. Connell and P.R.F. Bell (1990) A kinetic model for bioconcentration of lipophilic compounds by oligochaetes. Water Res. 10, 1225-1231.
Garten, CT. and J.R. Trabalka (1983) Evaluation of models for predicting terrestrial food chain behavior of xenobiotics. Environ. Sci. Technol. 10, 590-595.
Geyer, H., A.G. Kraus and W. Klein (1980) Relationships between solubility and bioaccumulation poten- tial of organic chemicals in rats. Chemosphere 9, 277-291.
Geyer, H., G. Politzki and D. Freitag (1984) Prediction of ecotoxicological behaviour of chemicals: rela- tionship between n-octanollwater partition coefficient and bioaccumulation of organic chemicals by the algae Chlorella. Chemosphere 13, 269-284.
Geyer, H.J., I. Scheunert and F. Korte (1987) Correlation between the bioconcentration potential of organic environmental chemicals in humans and their n-octanol-water partitioning coefficients, Che- mosphere 16, 239-252.
Geyer, H.J., I. Scheunert, R. Briiggemann, C. Steinberg, F. Korte and A. Kettrup (1991) QSAR for organic chemical bioconcentration in Daphnia, algae and mussels. In: QSAR in Environmental Toxicology, edited by J.L.M. Hermens and A. Opperhuizen. Proc. 4th Int. Workshop, 1620 September 1990, Veld- hoven, The Netherlands.
Gobas, F.A.P.C., K.E. Clark, W.Y. Shiu and D. Mackay (1989) Bioconcentration of polybrominated benzenes and biphenyls and related superhydrophobic chemicals in fish: role of bioavailability and elimination into feces. Environ. Toxicol. Chem. 8, 231-245.
Gobas, F.A.P., E.J. McNeill, L. Lovett-Doust and G. Douglas Haffner (1991) Bioconcentration ofchlorin- ated aromatic hydrocarbons in aquatic macrophytes. Comp. Biochem. Physiol. 78, 491-496.
Goodman, E.D. (1982) Modelling effects of pesticides on a population of soil/litter invertebrates in an orchard ecosystem. Environ. Toxicol. Chem. 1,45-60.
Harding, G.C., K.F. Drinkwater and W.P. Vass (1981) Importance of feeding, direct uptake from sea water, and transfer from generation to generation in the accumulation of an organochlorine @g’-DDT) by the marine planktonic copepod Calanusjinmarchicus. Can. J. Fish. Aquat. Sci. 38, 101-I 19.

A.J. Hendriksl Aquutic Toxicology 31 (1995) I-25 23
Hawker, D.W. and D.W. Connell (1986) Bioconcentration of lipophilic compounds by some aquatic or- ganisms. Ecotoxicol. Environ. Saf. 11, 184197.
Hendriks, A.J. (1993) Monitoring concentrations of microcontaminants in sediment and water in the Rhine delta: a comparison to reference values. Eur. Water Pollut. Control 3,33-38.
Hendriks, A.J. (1994) Modelling non-equilibrium concentrations of microcontaminants in organisms: spec- ification and laboratory calibration (submitted).
Hendriks, A.J. and H. Pieters (1993) Monitoring concentrations of microcontaminants in aquatic organ- isms in the Rhine delta: a comparison to reference values. Chemosphere 26, 817-836.
Hornshaw, T.C., R.J. Aulerich and H.E. Johnson (1983) Feeding Great Lakes fish to mink: effects on mink and accumulation and elimination of PCBs by mink. J. Toxicol. Environ. Health ll,933-946.
Hunter, B.A. and MS. Johnson (1982) Foodchain relationships of copper and cadmium in contaminated grassland ecosystems. Oikos 38, 108-I 17.
IRC (1992a) Sedimentuntersuchung, 1990 (Sediment investigations, 1990). International Rhine Commit- tee, Strassburg, France (in German).
IRC (1992b) Rheinfishuntersuchungen, 1990 (Rhine fish investigations, 1990). International Rhine Com- mittee, Strassburg, France (in German).
Janssen, M.P.M. (1991) Turnover of cadmium through soil arthropods, Thesis, Free Univ. Amsterdam. Jorgensen, S.E. (1979) Modelling the distribution and effect of heavy metals. Ecol. Modelling 2, 147-165. Karickhoff, S.W., D.S. Browns and T.A. Scott (1979) Sorption of hydrophobic pollutants on natural
sediments. Water Res. 13, 241-248. Koelmans, A.A. and L. Lijklema (1992) Sorption of 1,2,3,4-tetrachlorobenzene and cadmium to sediments
and suspended solids in lake VolkeraWZoom. Water Res. 26, 327-737. Konemann, W.H. (1980) Quantitative structure-activity relationships for kinetics and toxicity of aquatic
pollutants and their mixtures in fish. Thesis, Univ. Utrecht, The Netherlands, Koss, G. and Koransky W. (1975) Studies on the toxicology of hexachlorobenzene: I. Pharmacokinetics.
Arch. Toxicol. 34, 203-212. Kraak, M.H.S., M.C.Th. Scholten, W.H.M. Peeters and W.Chr. de Kock (1991) Biomonitoring of heavy
metals in the Western European rivers Rhine and Meuse using the freshwater mussel Dreissena pol_vmor- pha. Environ. Pollut. 74, 101-l 14.
Kramer, P.R.G., Th.P. Traas, T. Aldenberg and M.B. de Vries (1994) Modelling foodweb accumulation of cadmium in sedimentation areas of the Rhine Delta. Water Sci. Technol. 29, 1377140.
Krantzberg, G. and P.M. Stokes (1989) Metal regulation, tolerance and body burdens in the larvae of the genus Chironomus. Can. J. Fish. Aquat. Sci. 46, 389-398.
Laskowski, P. (1991) Are the top carnivores endangered by heavy metal biomagnification? Oikos 60, 387-390.
Leo, A. and D. Weininger (1989) MedChem CLogP database and software manual. Daylight Chemical Information Systems Inc., Irvine, CA, USA.
Livingstone, D.R. (1991) Organic xenobiotic metabolism in marine invertebrates. In: Advances in Compar- ative and Environmental Physiology, edited by R. Gills. Springer, Berlin.
Lord, K.A., G.G. Briggs, M.C. Neale and R. Manlove (1980) Uptake of pesticides from water and soil by earthworms. Pestic. Sci. 11, 401408.
Lu, P.Y., R.L. Metcalf, N. Plummer and D. Mandel (1977) The environmental fate of three carcinogens: benzo-(alpha)-pyrene, benzidine and vinyl chloride evaluated in laboratory model ecosystems. Arch. Environ. Contam. Toxicol. 6, 1299142.
Luoma, SM. (1983) Bioavailability of trace metals to aquatic organisms a review. Sci. Total Environ. 28, l-22. Mackay, D. (1982) Correlation of bioconcentration factors. Environ. Sci. Technol. 16,274278. Marquenie, J.M. and W.Chr. de Kock (1983) Biologisch en geochemisch onderzoek naar het voorkomen
en het gedrag van zware metalen in Nederlandse zoetwatergebieden (Biological and geochemical investi- gation of the presence and behavior of heavy metals in Dutch freshwater areas. Reports R831103a and R83/245, TNO-MT, Delft, The Netherlands (in Dutch).
Marshall, J.S. (1978) Field verification of cadmium toxicity to laboratory daphnia populations. Bull. Environ. Contam. Toxicol. 20, 387-393.
McCarthy, J.F. (1989) Bioavailability and toxicity of metals and hydrophobic organic contaminants. Intlu- ence Fate Treat. Pollut., ISS Aquat. Humic Subst., Adv. Chem. Ser. 219, 2633277.

24 A. J. Hendriksl Aquatic Toxicology 31 (1995) 1-25
Memmert, U. (1986) Bioaccumulation of zinc in two freshwater organisms (Daphnia magna, Crustacea and Brachydanio rerio, Pisces). Water Res. 21, 99-106.
Miiller, F., I. Scheunert, K. Kogel, D. Freitag, E. Richter, F. Coulston and F. Korte (1978) Comparative metabolism of hexachlorobenzene and pentachlorobenzene in plants, rats and Rhesus monkeys. Ecotoxi- col. Environ. Saf. 2,437448.
Oakley, S.M. et al. (1983) Accumulation of cadmium by Abarenicolu pacifica. Sci. Total Environ, 28, 105-l 18.
OECD (1987) The use of biological tests for water pollution assessment and control. Organisation for Economic Co-operation and Development, Paris.
OECD (1992) Report of the OECD workshop on the extrapolation of laboratory aquatic toxicity data to the real environment. Environ. Monogr. 59, Organisation for Economic Co-operation and Develop- ment, Paris.
Opperhuizen, A. and D.T.H.M. Sijm (1990) Bioaccumulation and biotransformation of polychlorinated dibenzo-p-dioxins and dibenzo-p-furans in fish. Environ. Toxicol. Chem. 9, 175-l 86.
Parkerton, T.F. (1993) Estimating toxicokinetic parameters for modelling the bioaccumulation of non- ionic organic chemicals in aquatic organisms. Thesis, Environmental Engineering and Science Program, Manhattan College, Riverdale, NY.
Paterson, S. (1991) A fugacity model of chemical uptake by plants from soil and air. Chemosphere 23, 539-565.
Pieters, H. and C. Taai (1991) Het voorkomen van milieukritische stoffen in predatorvissen, prooivissen, driehoeksmosselen, zooplankton, en bodemdieren afkomstig uit het Nederlandse deel van het Rijn- stroomgebied (Occurence of xenobiotics in predator fish, prey fish, zebramussel, zooplankton and ben- thic organisms). Report MO 91-205, Netherlands Institute for Fisheries Research, IJmuiden, The Neth- erlands (in Dutch).
Pieters, H. and P. Hagel (1992) Biomonitoring of mercury in European eel (Anguillu anguilla) in The Netherlands compared with pike-perch (Stizopedion luciopercu): statistical analysis. In: Impact of Heavy Metals in the Environment, edited by J.-P. Vernet. Elsevier, Amsterdam.
Pilli, A., D.O. Carle and B.R. Sheedy (1989) Aquatic information retrieval data base AQUIRE. Database and Technical Support Document, Environmental Research Laboratory, U.S. Environmental Protec- tion Agency, Duluth, MN.
Platteeuw, M., M.R. van Eerden and C. van de Guchte (1994) Variations in contamination content in livers from cormorants, Phalacrocorux carbon sinensis, living in a polluted sedimentation area in lake IJssel- meer, the Netherlands. Ardea (in press).
Porter, K.D. and Wiemeyer, S.N. (1972) DDE at low dietary levels kills captive American kestrels. Bull. Environ. Contam. Toxicol. 8, 1933199.
Qiuping Ye, R.K. Puri, S. Kaplia, W.R. Lower and A.F. Yanders (1991) Studies on uptake of PCBs by Hordeum vuigure (barley) and Lycopersicon esculentum (tomato). Chemosphere 23, 1397-1406.
Rainbow, P.S. and White, S.L. (1989) Comparative strategies of heavy metal accumulation by crustaceans: zinc, copper and cadmium in a decapod, an amphipod and a barnacle. Hydrobiologia 174, 2455262.
RIZA (1990) Concentrations in invertebrates. Internal AOCE, Institute for Inland Water Management and Waste Water Treatment RIZA, Lelystad, The Netherlands.
Roylance, K.J., C.D. Jorgensen, G.M. Booth and M.W. Carter (1985) Effects of dietary endrin on repro- duction of mallard ducks (Anusplutyrhynchos). Arch. Environ. Contam. Toxicol. 14, 705-711.
Scheuhammer, A.M. (1987) The chronic toxicity of aluminium, cadmium, mercury, lead in birds: a review. Environ. Pollut. 46, 263-295.
Sijm, D.T.H.M. (1992) Influence of biotransformation on bioaccumulation and toxicity of chlorinated aromatic compounds in fish. Thesis, Univ. Utrecht, The Netherlands.
Spacie, A. and J.L. Hamelink (1982) Alternative models for describing the bioconcentration of organics in fish. Environ. Toxicol. Chem. I, 309-320.
Stevens, J.B. (1992) Disposition of toxic metals in the agricultural food chain, 2. Steady-state bovine tissue biotransfer factors. Environ. Sci. Technol. 26, 1915-1921.
Swackhammer, D.L. and R.S. Skoglund (1993) Bioaccumulation of PCBs by algae: kinetics versus equili- brium. Environ. Toxicol. Chem. 12. 831-838.

A.J. Hendriksl Aquatic, Toxicology 31 (1995) l-25 15
Takenaka, S. and K. Takahashi (1991) Enhancement of fecal excretion of polychlorinated biphenyls by the
addition of rice bran fibre to the diet in rats. Chemosphere 22, 3755381.
Talmage, S.S. and B.T. Walton (1991) Small mammals as monitors of environmental contaminants. Rev.
Environ. Contam. Toxicol. 119,477144.
Taylor, D. (1983) The significance of the accumulation of cadmium by aquatic organisms. Ecotoxicol.
Environ. Saf. 7, 3342.
Thomann, R.V. (1989) Bioaccumulation model of organic chemical distribution in aquatic food chains.
Environ. Sci. Technol. 23, 6999707.
Thomann, R.V. and J.P. Connolly (1984a) Model of PCB in the Lake Michigan lake trout food chain.
Environ. Sci. Technol. 18, 65-71.
Thomann, R.V. and J.P. Connolly (1984b) An age-dependent model of PCB in a Lake Michigan food
chain. EPA-600/3-84-026.
Timmermans, K.R. (1991) Trace metal ecotoxicokinetics of chironomids. Dissertation, Univ. Amsterdam.
Timmermans, K.R. and P.A. Walker (1989) The fate of trace metals during the metamorphosis of chi-
ronomids (Diptera, Chironomidae). Environ. Pollut. 62, 73-85.
Topp, E.. I. Scheunert, A. Attar and F. Korte (1986) Factors affecting the uptake of 14-C-labelled organic
chemicals by plants from soil. Ecotoxicol. Environ. Saf. 11, 219-228.
Van den Berg, M., F. Blank, C. Heeremans, H. Wagenaar and K. Olie (1987) Presence of polychlorinated
dibenzo-p-dioxins and polychlorinated dibenzofurans in fish-eating birds and fish from The Netherlands.
Arch. Environ. Contam. Toxicol. 16, 149-l 58.
Van der Kooij, L.A., D. van de Meent, C.J. van Leeuwen and W.A. Bruggeman (1991) Deriving quality
criteria for water and sediment from the result of aquatic toxicity and product standards: application of
the equilibrium partitioning method. Water Res. 26, 6977705.
Van de Meent, D., T. Aldenberg, J.H. Canton, C.A.M. van Gestel and W. Slooff (1990) Streven naar
waarden (Striving to values). Report 670101-001, National Institute for Public Health and Environment-
al Protection RIVM, Bilthoven, The Netherlands.
Van der Oost, R., H. Heida, A. Opperhuizen and N.P.E. Vermeulen (1991) Interrelationships between
bioaccumulation or organic trace pollutants (PCBs, organochlorine pesticides and PAHs), and MFO-
induction in fish. Comp. Biochem. Physiol. lOOC, 4347.
Van der Valk, F., H. Pieters and R.C.C. Wegman (1989) Bioaccumulation in yellow eel (Anguilku) and
perch (Pewu_fluviatilis) from the Dutch branches of the Rhine - mercury, organochlorine compounds
and polynuclear aromatic hydrocarbons, Publication 7, Publications and Reports of the project ‘Ecolog-
ical Rehabilitation Rhine’, RIZAIRIVMIRIVO, Institute of Inland Water Management and Waste Wa-
ter Treatment, Lelystad/Netherlands Institute for Fisheries Research, IJmuiden, The Netherlands.
Van Haren, R.J.F., J. van der Meer and M.B. de Vries (1990) Cadmium and copper accumulation in the
common mussel Mytilus edultin the Western Scheldt estuary: a model approach. Hydrobiologia 19. 105.. 118.
Venema, R. (1991) Kwaliteit zwevende stof, 198881990 (Suspended solids quality, 19881990). RIZA
Report 91.040, Institute for Inland Water Management and Waste Water Treatment. Lelystad. The
Netherlands.
VOS, J.G., H.L. van der Maas, A. Musch and E. Ram (1971) Toxicity of hexachlorobenzene in Japanese
quail with special reference to porphyria, liver damage, reproduction and tissue residues, Toxicol. Appl.
Pharmacol. 18,944957.
VOS, J.G., P.F. Botterweg, J.J.T.W.A. Strik and J.H. Koeman (1972) Experimental studies with HCB in
birds. TNO-Nieuws 27, 599-603.
Volite, A.M. (1981) The conflict between bats and wood preservatives. In: Proc. 1st Eur. Symp. Bat
Research. Myotis 18/19,4144.
Vrijhof, H. (1984) The selection of priority black-list substances for the river Rhine and the waters of the
European community. Water Sci. Technol. 16, 525-528.
Walker, C.H. (1990) Persistent pollutants in fish-eating seabirds -bioaccumulation, metabolism and effects. Aquat. Toxicol. 17, 2933324.
Wang, W. (1987) Factors affecting metal toxicity to and accumulation by aquatic organisms - overview.
Environ. Int. 13.437457.
Wren, C.D. (1991) Cause-effect linkages between chemicals and population of mink (Mustela vison) and
otter (Lutra canadensis) in the Great Lakes. J. Toxicol. Environ. Health 33, 549-586.