modelling batch reactor for milk bush (thevetia peruviana) oil
TRANSCRIPT
International Journal of Scientific & Engineering Research, Volume 4, Issue 4, April-2013 952 ISSN 2229-5518
IJSER © 2013
http://www.ijser.org
Modelling Batch Reactor for Milk Bush (Thevetia peruviana) Oil
Transesterification in the Production of Biodiesel.
M.F.N Abowei1, O. M. Olatunji2 and A. J. Akor2
1Department of Petrochemical Engineering
2Department of Agricultural and Environmental Engineering
Rivers State University of Science and Technology, PMB 5080, Port Harcourt, Nigeria.
e-mail: [email protected]; [email protected]
Abstract: In this study, modelling equations for the simulation of batch reactor functional
dimensions at isothermal condition are proposed exploiting the transesterification kinetic of
Olatunji et. al. (2012). The kinetic model proposed by Olatunji et. al. (2012) was obtained
through the laboratory experiment on which Biodiesel was produced using alcohol to oil molar
ratio of 6:1, 9:1 and 12:1; the reaction temperature was put at constant 500C, and the catalyst
loading percentages is between 0.5% and 1.5% as proposed by Olatunji et. al. (2012). From
the results obtained, the modelling equations proposed are capable of simulating reactor
dimensions as a function of the kinetic parameters. The simulated results obtained was
analysed with MATLAB programming language which has demonstrated the dependency of
reactor dimensions as proposed by the kinetic parameters proposed by Olatunji et. al. (2012).
Key words: Batch reactor, Milk bush oil, Transesterification, Biodiesel, Production
INTRODUCTION
In the search for alternative renewable energy sources, great deal of attention is focused
on the Chemical Kinetics of Milk bush (Thevetia peruviana) oil transesterification process in
biodiesel production (Olatunji et. al.,2011). The work of Olatunji et. al., 2012 proposed the
reaction kinetics of esters as follows:
International Journal of Scientific & Engineering Research, Volume 4, Issue 4, April-2013 953 ISSN 2229-5518
IJSER © 2013
http://www.ijser.org
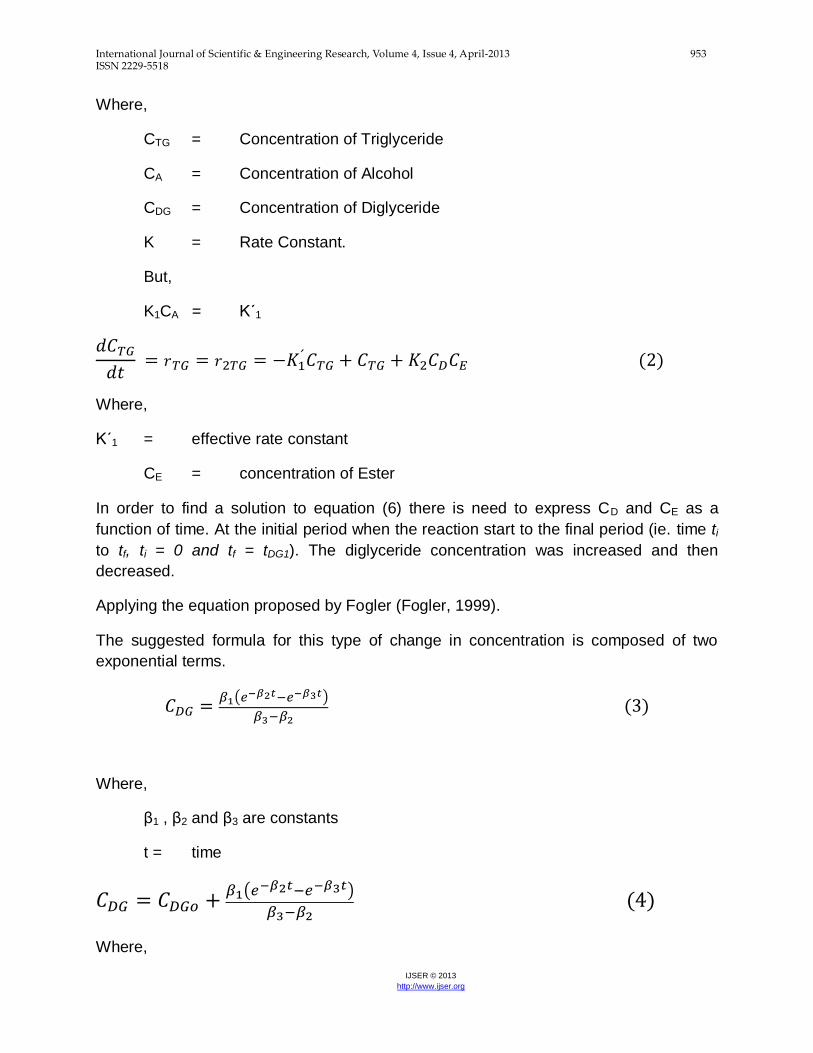
Where,
CTG = Concentration of Triglyceride
CA = Concentration of Alcohol
CDG = Concentration of Diglyceride
K = Rate Constant.
But,
K1CA = Kˊ1
Where,
Kˊ1 = effective rate constant
CE = concentration of Ester
In order to find a solution to equation (6) there is need to express CD and CE as a
function of time. At the initial period when the reaction start to the final period (ie. time ti
to tf, ti = 0 and tf = tDG1). The diglyceride concentration was increased and then
decreased.
Applying the equation proposed by Fogler (Fogler, 1999).
The suggested formula for this type of change in concentration is composed of two
exponential terms.
( )
Where,
β1 , β2 and β3 are constants
t = time
( )
Where,

International Journal of Scientific & Engineering Research, Volume 4, Issue 4, April-2013 954 ISSN 2229-5518
IJSER © 2013
http://www.ijser.org
CDGO = Initial concentration of Diglyceride
After the final period, ie. tf = tdg1, diglyceride concentration went below its initial value,
hence, equation (8) cannot be used to predict the final concentration of Diglyceride at
this period. Therefore equation 8 may be written as equation 9.
( )
( )
Also,
( )
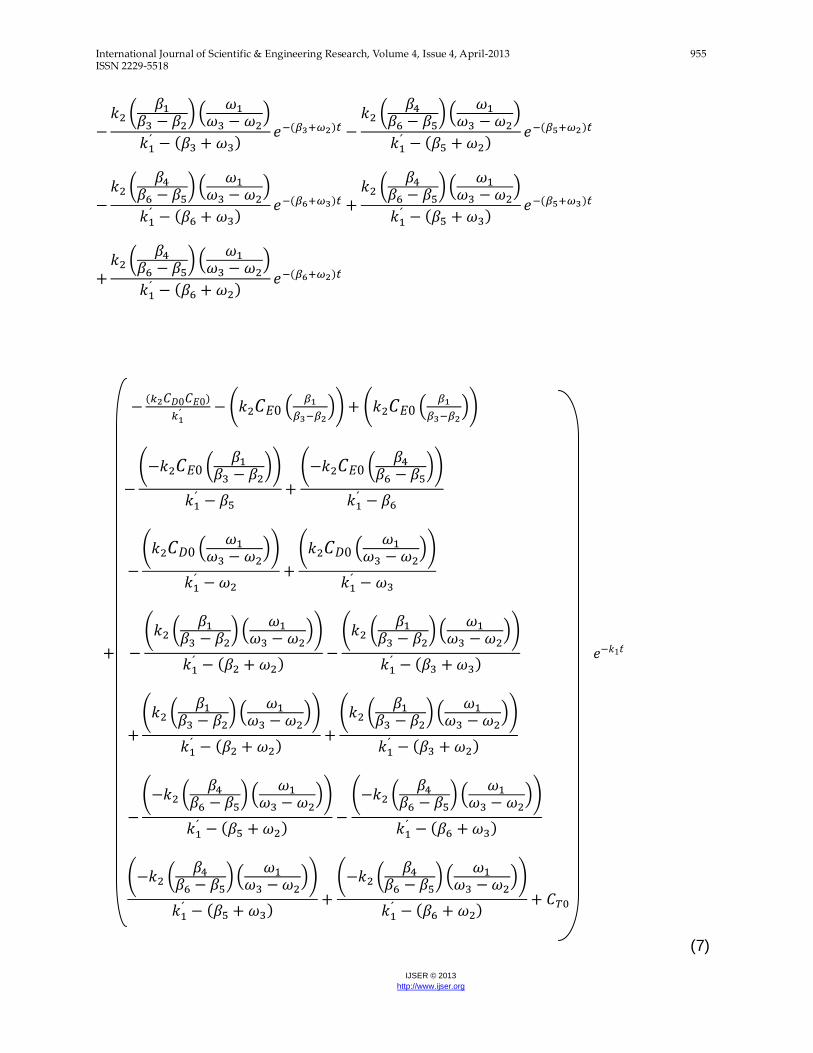
Substituting equation (9) and (10) into equation 6, taking the Laplace of the
new equation developed; also by applying the partial fraction technique,
and taking the inverse Laplace of the final equation.
CTG, CDG, and CMG final equations were developed.
(
)
(
)
(
)
(
)
(
)
(
)
(
) (
)
(
) (
)
(
) (
)
International Journal of Scientific & Engineering Research, Volume 4, Issue 4, April-2013 955 ISSN 2229-5518
IJSER © 2013
http://www.ijser.org
(
) (
)
(
) (
)
(
) (
)
(
) (
)
(
) (
)
( (
)) ( (
))
( (
))
( (
))
( (
))
( (
))
( (
) (
))
( (
) (
))
( (
) (
))
( (
) (
))
( (
) (
))
( (
) (
))
( (
) (
))
( (
) (
))
(7)
International Journal of Scientific & Engineering Research, Volume 4, Issue 4, April-2013 956 ISSN 2229-5518
IJSER © 2013
http://www.ijser.org
Where,
K = rate constants
The final concentration of Diglyceride, Monoglyceride, Ester (Biodiesel) and Glycerol were
derived in the same manner.
Where,αi , βi, ωi, are constants derived from Fogler’s equation to calculate the change in
concentration of Tri, Di, Mono glycerides, Ester and glycerol.
These constants are determined using initial guess values. From Linear Regression method
using MATLAB programming which was written to validate the model.
The aspect of modelling reactor functional parameters for large scale production of ester using
the proposed Chemical Kinetic expression need to be proposed.
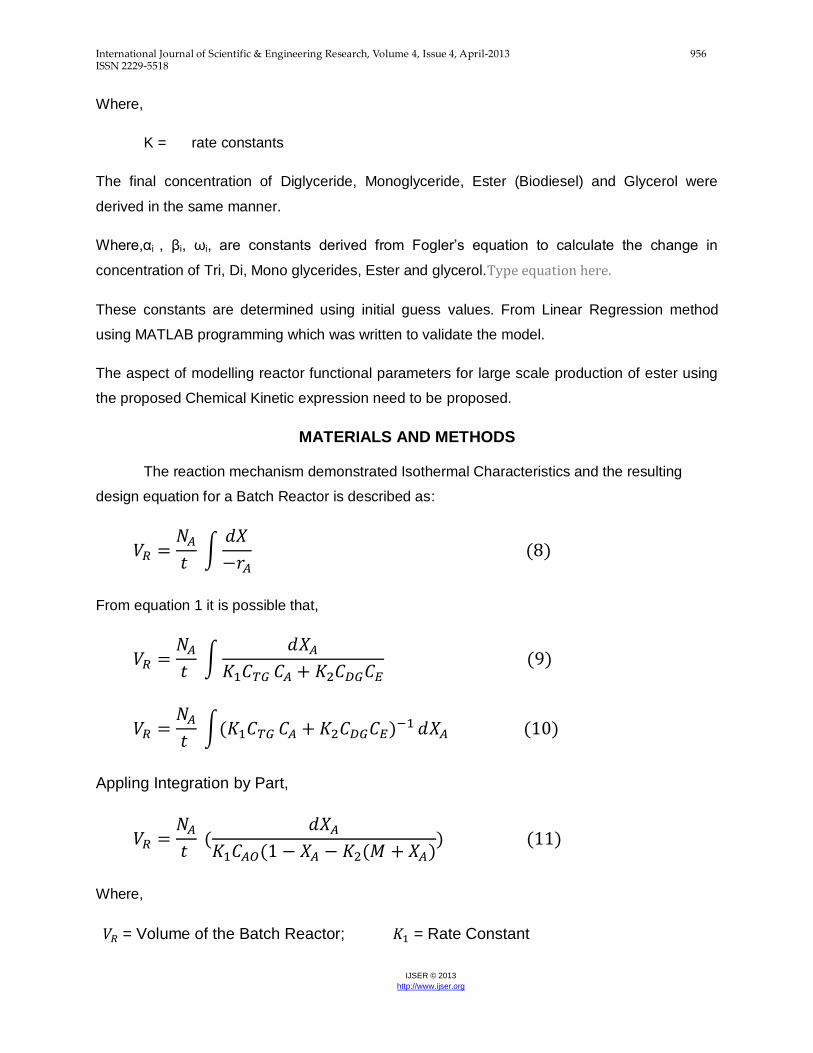
MATERIALS AND METHODS
The reaction mechanism demonstrated Isothermal Characteristics and the resulting
design equation for a Batch Reactor is described as:
∫
From equation 1 it is possible that,
∫
∫
Appling Integration by Part,
Where,
= Volume of the Batch Reactor; = Rate Constant
International Journal of Scientific & Engineering Research, Volume 4, Issue 4, April-2013 957 ISSN 2229-5518
IJSER © 2013
http://www.ijser.org
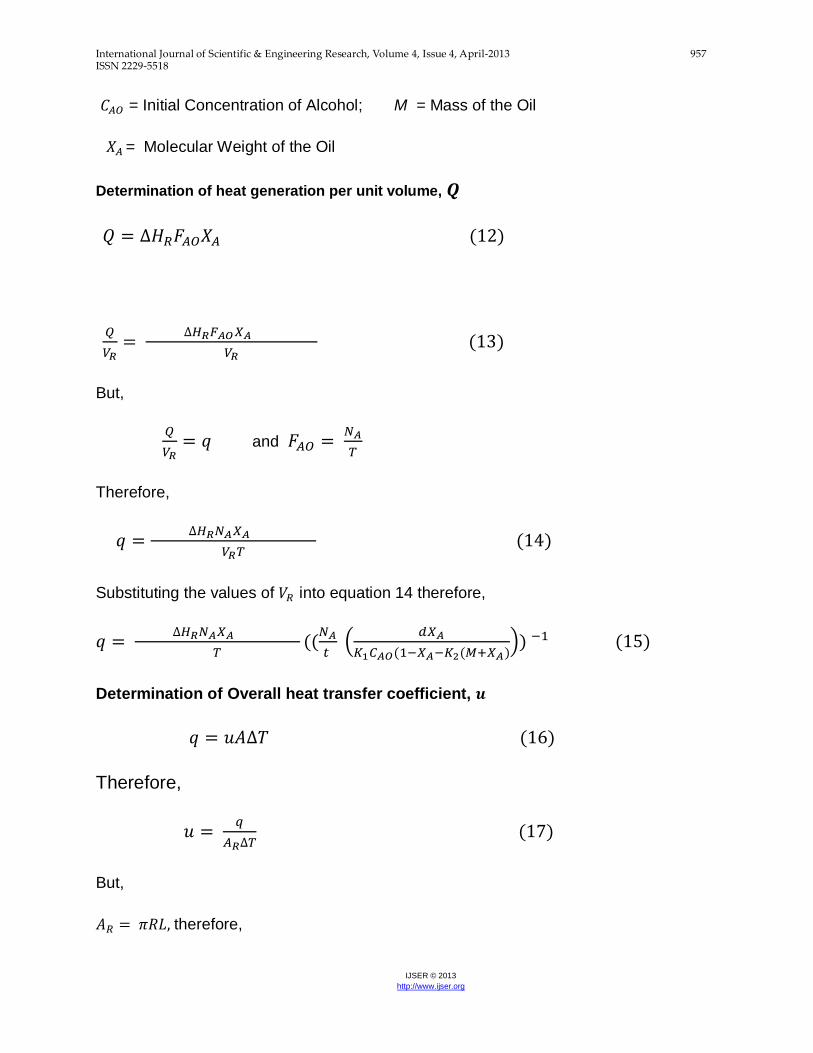
= Initial Concentration of Alcohol; M = Mass of the Oil
= Molecular Weight of the Oil
Determination of heat generation per unit volume,
But,
and
Therefore,
Substituting the values of into equation 14 therefore,
(
)
Determination of Overall heat transfer coefficient,
Therefore,
But,
therefore,
International Journal of Scientific & Engineering Research, Volume 4, Issue 4, April-2013 958 ISSN 2229-5518
IJSER © 2013
http://www.ijser.org
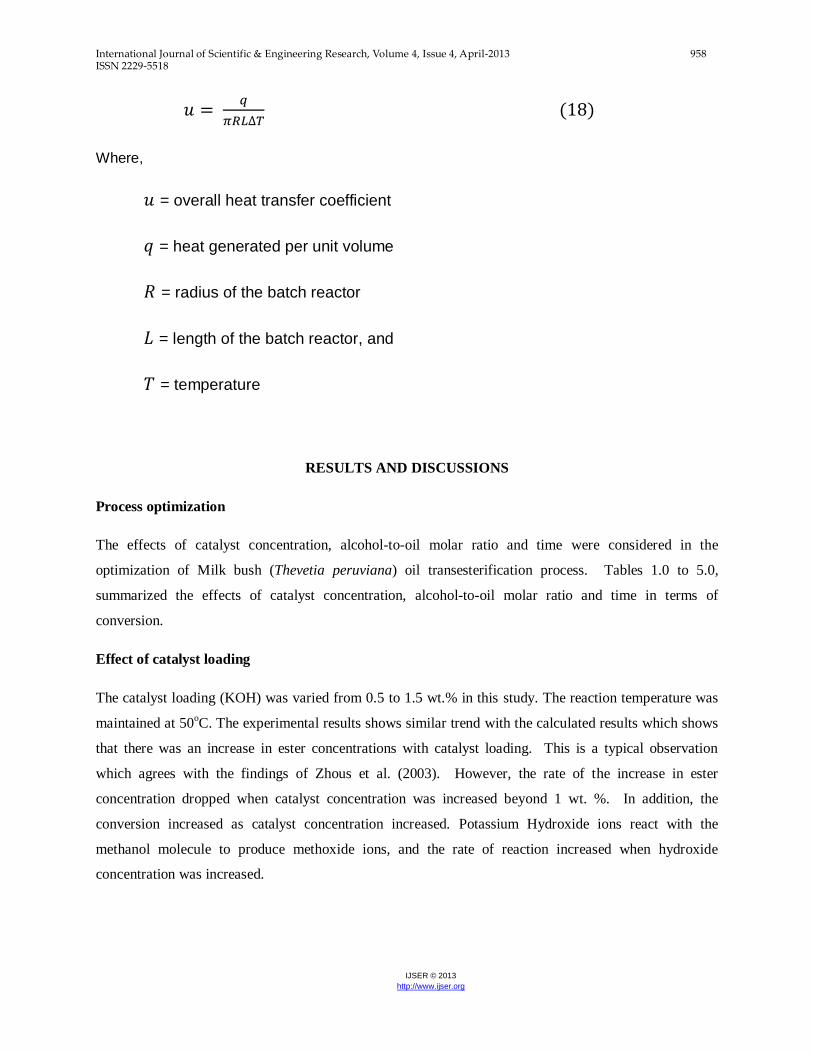
Where,
= overall heat transfer coefficient
= heat generated per unit volume
= radius of the batch reactor
= length of the batch reactor, and
= temperature
RESULTS AND DISCUSSIONS
Process optimization
The effects of catalyst concentration, alcohol-to-oil molar ratio and time were considered in the
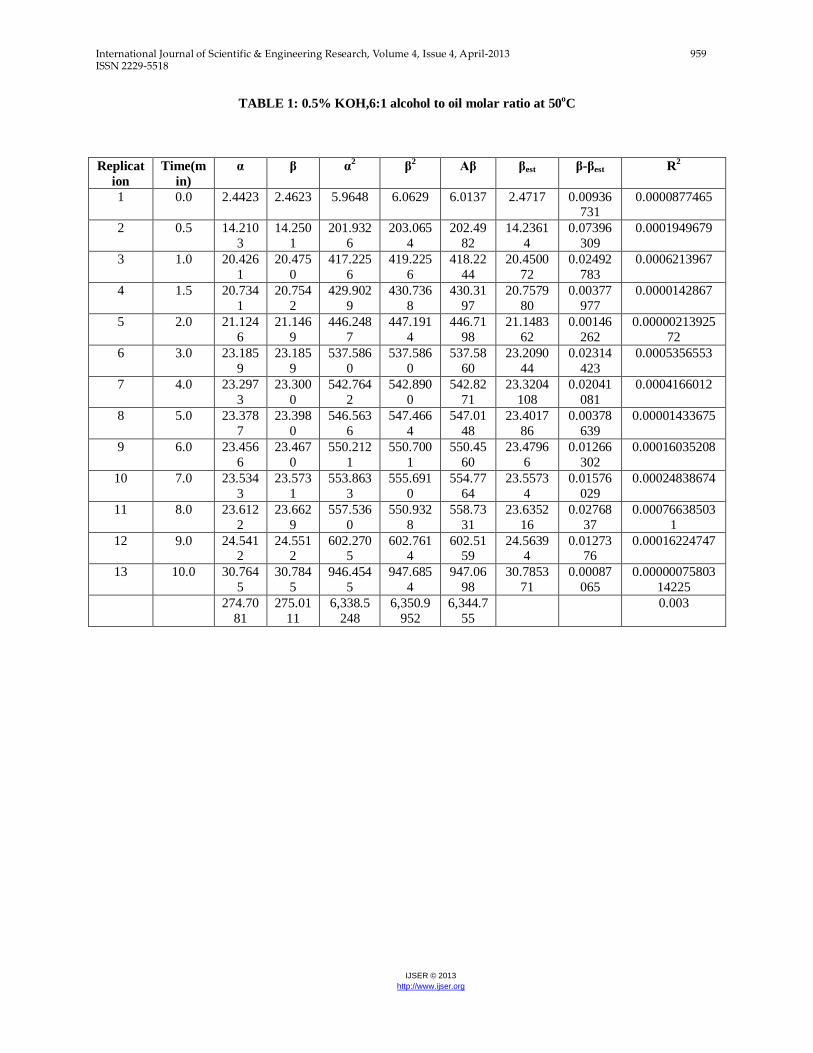
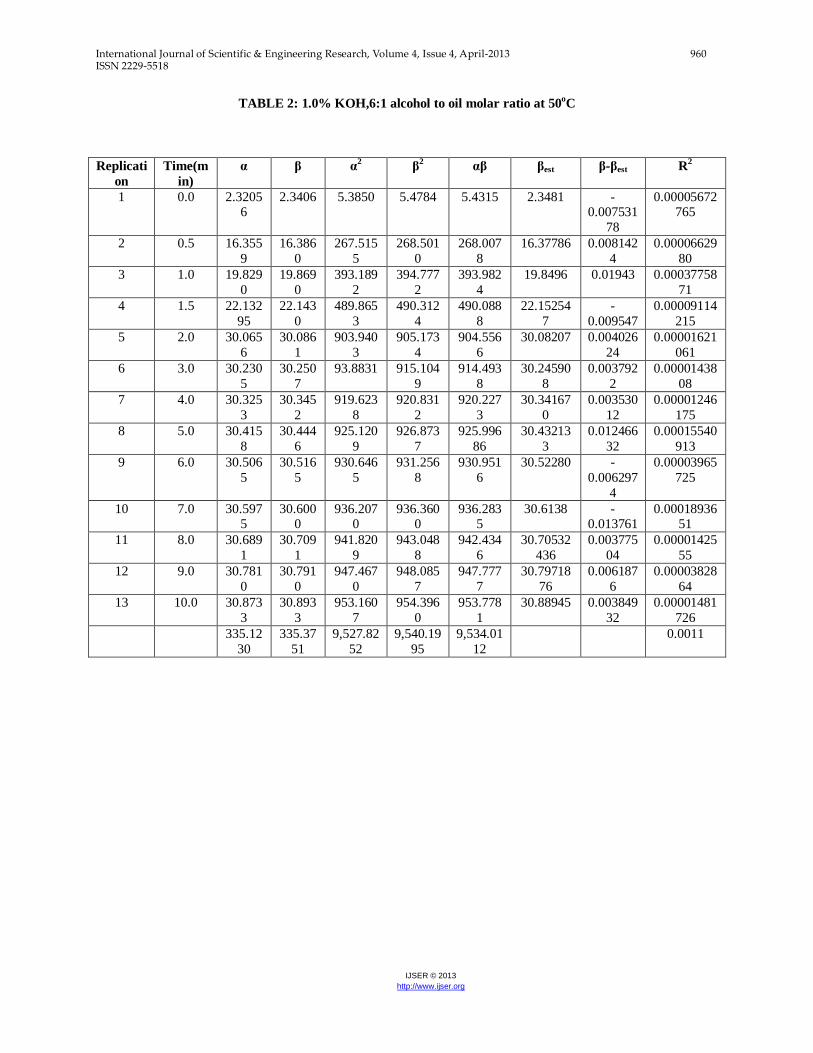
optimization of Milk bush (Thevetia peruviana) oil transesterification process. Tables 1.0 to 5.0,
summarized the effects of catalyst concentration, alcohol-to-oil molar ratio and time in terms of
conversion.
Effect of catalyst loading
The catalyst loading (KOH) was varied from 0.5 to 1.5 wt.% in this study. The reaction temperature was
maintained at 50oC. The experimental results shows similar trend with the calculated results which shows
that there was an increase in ester concentrations with catalyst loading. This is a typical observation
which agrees with the findings of Zhous et al. (2003). However, the rate of the increase in ester
concentration dropped when catalyst concentration was increased beyond 1 wt. %. In addition, the
conversion increased as catalyst concentration increased. Potassium Hydroxide ions react with the
methanol molecule to produce methoxide ions, and the rate of reaction increased when hydroxide
concentration was increased.
International Journal of Scientific & Engineering Research, Volume 4, Issue 4, April-2013 959 ISSN 2229-5518
IJSER © 2013
http://www.ijser.org
TABLE 1: 0.5% KOH,6:1 alcohol to oil molar ratio at 50oC
Replicat
ion
Time(m
in)
α β α2
β2
Αβ βest β-βest R2
1 0.0 2.4423 2.4623 5.9648 6.0629 6.0137 2.4717 0.00936731
0.0000877465
2 0.5 14.210
3
14.250
1
201.932
6
203.065
4
202.49
82
14.2361
4
0.07396
309
0.0001949679
3 1.0 20.426
1
20.475
0
417.225
6
419.225
6
418.22
44
20.4500
72
0.02492
783
0.0006213967
4 1.5 20.734
1
20.754
2
429.902
9
430.736
8
430.31
97
20.7579
80
0.00377
977
0.0000142867
5 2.0 21.124
6
21.146
9
446.248
7
447.191
4
446.71
98
21.1483
62
0.00146
262
0.00000213925
72
6 3.0 23.185
9
23.185
9
537.586
0
537.586
0
537.58
60
23.2090
44
0.02314
423
0.0005356553
7 4.0 23.297
3
23.300
0
542.764
2
542.890
0
542.82
71
23.3204
108
0.02041
081
0.0004166012
8 5.0 23.378
7
23.398
0
546.563
6
547.466
4
547.01
48
23.4017
86
0.00378
639
0.00001433675
9 6.0 23.456
6
23.467
0
550.212
1
550.700
1
550.45
60
23.4796
6
0.01266
302
0.00016035208
10 7.0 23.534
3
23.573
1
553.863
3
555.691
0
554.77
64
23.5573
4
0.01576
029
0.00024838674
11 8.0 23.612
2
23.662
9
557.536
0
550.932
8
558.73
31
23.6352
16
0.02768
37
0.00076638503
1
12 9.0 24.5412
24.5512
602.2705
602.7614
602.5159
24.56394
0.0127376
0.00016224747
13 10.0 30.764
5
30.784
5
946.454
5
947.685
4
947.06
98
30.7853
71
0.00087
065
0.00000075803
14225
274.70
81
275.01
11
6,338.5
248
6,350.9
952
6,344.7
55
0.003
International Journal of Scientific & Engineering Research, Volume 4, Issue 4, April-2013 960 ISSN 2229-5518
IJSER © 2013
http://www.ijser.org
TABLE 2: 1.0% KOH,6:1 alcohol to oil molar ratio at 50oC
Replicati
on
Time(m
in)
α β α2
β2
αβ βest β-βest R2
1 0.0 2.32056
2.3406 5.3850 5.4784 5.4315 2.3481 -0.007531
78
0.00005672765
2 0.5 16.355
9
16.386
0
267.515
5
268.501
0
268.007
8
16.37786 0.008142
4
0.00006629
80
3 1.0 19.829
0
19.869
0
393.189
2
394.777
2
393.982
4
19.8496 0.01943 0.00037758
71
4 1.5 22.132
95
22.143
0
489.865
3
490.312
4
490.088
8
22.15254
7
-
0.009547
0.00009114
215
5 2.0 30.065
6
30.086
1
903.940
3
905.173
4
904.556
6
30.08207 0.004026
24
0.00001621
061
6 3.0 30.230
5
30.250
7
93.8831 915.104
9
914.493
8
30.24590
8
0.003792
2
0.00001438
08
7 4.0 30.325
3
30.345
2
919.623
8
920.831
2
920.227
3
30.34167
0
0.003530
12
0.00001246
175
8 5.0 30.415
8
30.444
6
925.120
9
926.873
7
925.996
86
30.43213
3
0.012466
32
0.00015540
913
9 6.0 30.506
5
30.516
5
930.646
5
931.256
8
930.951
6
30.52280 -
0.006297
4
0.00003965
725
10 7.0 30.5975
30.6000
936.2070
936.3600
936.2835
30.6138 -0.013761
0.0001893651
11 8.0 30.689
1
30.709
1
941.820
9
943.048
8
942.434
6
30.70532
436
0.003775
04
0.00001425
55
12 9.0 30.781
0
30.791
0
947.467
0
948.085
7
947.777
7
30.79718
76
0.006187
6
0.00003828
64
13 10.0 30.873
3
30.893
3
953.160
7
954.396
0
953.778
1
30.88945 0.003849
32
0.00001481
726
335.12
30
335.37
51
9,527.82
52
9,540.19
95
9,534.01
12
0.0011
International Journal of Scientific & Engineering Research, Volume 4, Issue 4, April-2013 961 ISSN 2229-5518
IJSER © 2013
http://www.ijser.org
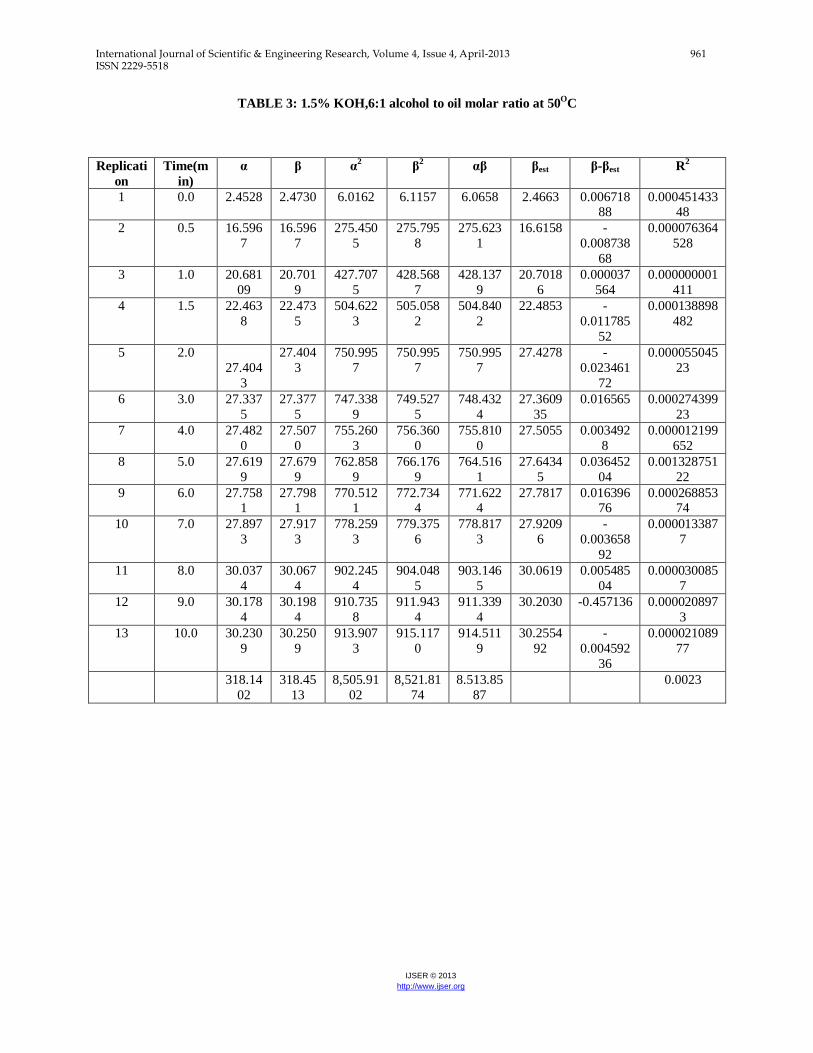
TABLE 3: 1.5% KOH,6:1 alcohol to oil molar ratio at 50O
C
Replicati
on
Time(m
in)
α β α2
β2
αβ βest β-βest R2
1 0.0 2.4528 2.4730 6.0162 6.1157 6.0658 2.4663 0.00671888
0.00045143348
2 0.5 16.596
7
16.596
7
275.450
5
275.795
8
275.623
1
16.6158 -
0.008738
68
0.000076364
528
3 1.0 20.681
09
20.701
9
427.707
5
428.568
7
428.137
9
20.7018
6
0.000037
564
0.000000001
411
4 1.5 22.463
8
22.473
5
504.622
3
505.058
2
504.840
2
22.4853 -
0.011785
52
0.000138898
482
5 2.0
27.404
3
27.404
3
750.995
7
750.995
7
750.995
7
27.4278 -
0.023461
72
0.000055045
23
6 3.0 27.337
5
27.377
5
747.338
9
749.527
5
748.432
4
27.3609
35
0.016565 0.000274399
23
7 4.0 27.482
0
27.507
0
755.260
3
756.360
0
755.810
0
27.5055 0.003492
8
0.000012199
652
8 5.0 27.619
9
27.679
9
762.858
9
766.176
9
764.516
1
27.6434
5
0.036452
04
0.001328751
22
9 6.0 27.7581
27.7981
770.5121
772.7344
771.6224
27.7817 0.01639676
0.00026885374
10 7.0 27.897
3
27.917
3
778.259
3
779.375
6
778.817
3
27.9209
6
-
0.003658
92
0.000013387
7
11 8.0 30.037
4
30.067
4
902.245
4
904.048
5
903.146
5
30.0619 0.005485
04
0.000030085
7
12 9.0 30.178
4
30.198
4
910.735
8
911.943
4
911.339
4
30.2030 -0.457136 0.000020897
3
13 10.0 30.230
9
30.250
9
913.907
3
915.117
0
914.511
9
30.2554
92
-
0.004592
36
0.000021089
77
318.14
02
318.45
13
8,505.91
02
8,521.81
74
8.513.85
87
0.0023
International Journal of Scientific & Engineering Research, Volume 4, Issue 4, April-2013 962 ISSN 2229-5518
IJSER © 2013
http://www.ijser.org
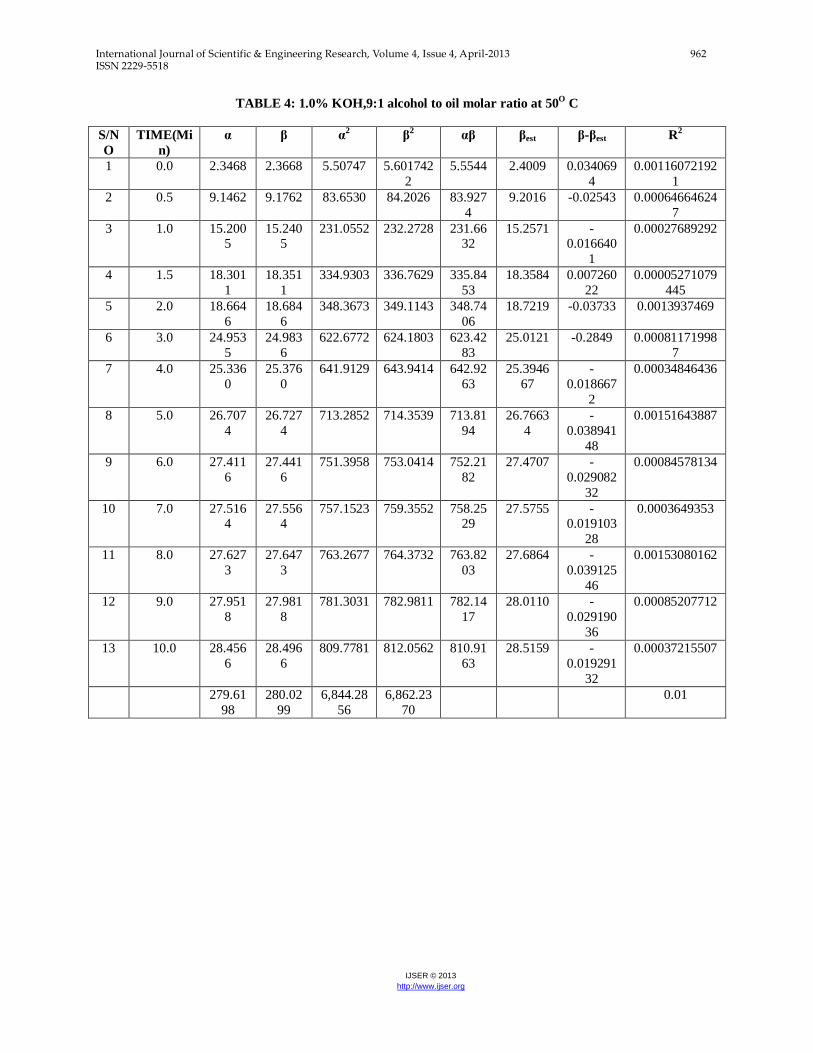
TABLE 4: 1.0% KOH,9:1 alcohol to oil molar ratio at 50O
C
S/N
O
TIME(Mi
n)
α β α2
β2
αβ βest β-βest R2
1 0.0 2.3468 2.3668 5.50747 5.601742
2
5.5544 2.4009 0.034069
4
0.00116072192
1
2 0.5 9.1462 9.1762 83.6530 84.2026 83.927
4
9.2016 -0.02543 0.00064664624
7
3 1.0 15.2005
15.2405
231.0552 232.2728 231.6632
15.2571 -0.016640
1
0.00027689292
4 1.5 18.301
1
18.351
1
334.9303 336.7629 335.84
53
18.3584 0.007260
22
0.00005271079
445
5 2.0 18.664
6
18.684
6
348.3673 349.1143 348.74
06
18.7219 -0.03733 0.0013937469
6 3.0 24.953
5
24.983
6
622.6772 624.1803 623.42
83
25.0121 -0.2849 0.00081171998
7
7 4.0 25.336
0
25.376
0
641.9129 643.9414 642.92
63
25.3946
67
-
0.018667
2
0.00034846436
8 5.0 26.707
4
26.727
4
713.2852 714.3539 713.81
94
26.7663
4
-
0.038941
48
0.00151643887
9 6.0 27.411
6
27.441
6
751.3958 753.0414 752.21
82
27.4707 -
0.029082
32
0.00084578134
10 7.0 27.5164
27.5564
757.1523 759.3552 758.2529
27.5755 -0.019103
28
0.0003649353
11 8.0 27.627
3
27.647
3
763.2677 764.3732 763.82
03
27.6864 -
0.039125
46
0.00153080162
12 9.0 27.951
8
27.981
8
781.3031 782.9811 782.14
17
28.0110 -
0.029190
36
0.00085207712
13 10.0 28.456
6
28.496
6
809.7781 812.0562 810.91
63
28.5159 -
0.019291
32
0.00037215507
279.61
98
280.02
99
6,844.28
56
6,862.23
70
0.01
International Journal of Scientific & Engineering Research, Volume 4, Issue 4, April-2013 963 ISSN 2229-5518
IJSER © 2013
http://www.ijser.org
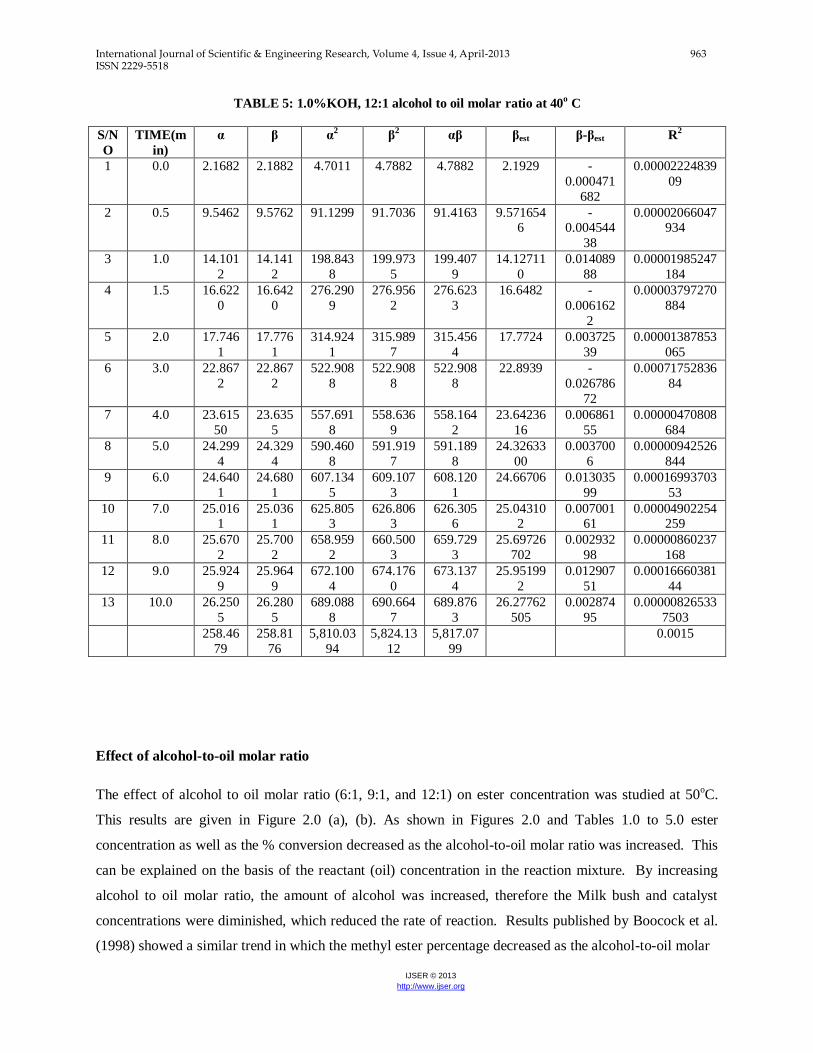
TABLE 5: 1.0%KOH, 12:1 alcohol to oil molar ratio at 40o C
S/N
O
TIME(m
in)
α β α2
β2
αβ βest β-βest R2
1 0.0 2.1682 2.1882 4.7011 4.7882 4.7882 2.1929 -
0.000471
682
0.00002224839
09
2 0.5 9.5462 9.5762 91.1299 91.7036 91.4163 9.5716546
-0.004544
38
0.00002066047934
3 1.0 14.101
2
14.141
2
198.843
8
199.973
5
199.407
9
14.12711
0
0.014089
88
0.00001985247
184
4 1.5 16.622
0
16.642
0
276.290
9
276.956
2
276.623
3
16.6482 -
0.006162
2
0.00003797270
884
5 2.0 17.746
1
17.776
1
314.924
1
315.989
7
315.456
4
17.7724 0.003725
39
0.00001387853
065
6 3.0 22.867
2
22.867
2
522.908
8
522.908
8
522.908
8
22.8939 -
0.026786
72
0.00071752836
84
7 4.0 23.615
50
23.635
5
557.691
8
558.636
9
558.164
2
23.64236
16
0.006861
55
0.00000470808
684
8 5.0 24.299
4
24.329
4
590.460
8
591.919
7
591.189
8
24.32633
00
0.003700
6
0.00000942526
844
9 6.0 24.640
1
24.680
1
607.134
5
609.107
3
608.120
1
24.66706 0.013035
99
0.00016993703
53
10 7.0 25.0161
25.0361
625.8053
626.8063
626.3056
25.043102
0.00700161
0.00004902254259
11 8.0 25.670
2
25.700
2
658.959
2
660.500
3
659.729
3
25.69726
702
0.002932
98
0.00000860237
168
12 9.0 25.924
9
25.964
9
672.100
4
674.176
0
673.137
4
25.95199
2
0.012907
51
0.00016660381
44
13 10.0 26.250
5
26.280
5
689.088
8
690.664
7
689.876
3
26.27762
505
0.002874
95
0.00000826533
7503
258.46
79
258.81
76
5,810.03
94
5,824.13
12
5,817.07
99
0.0015
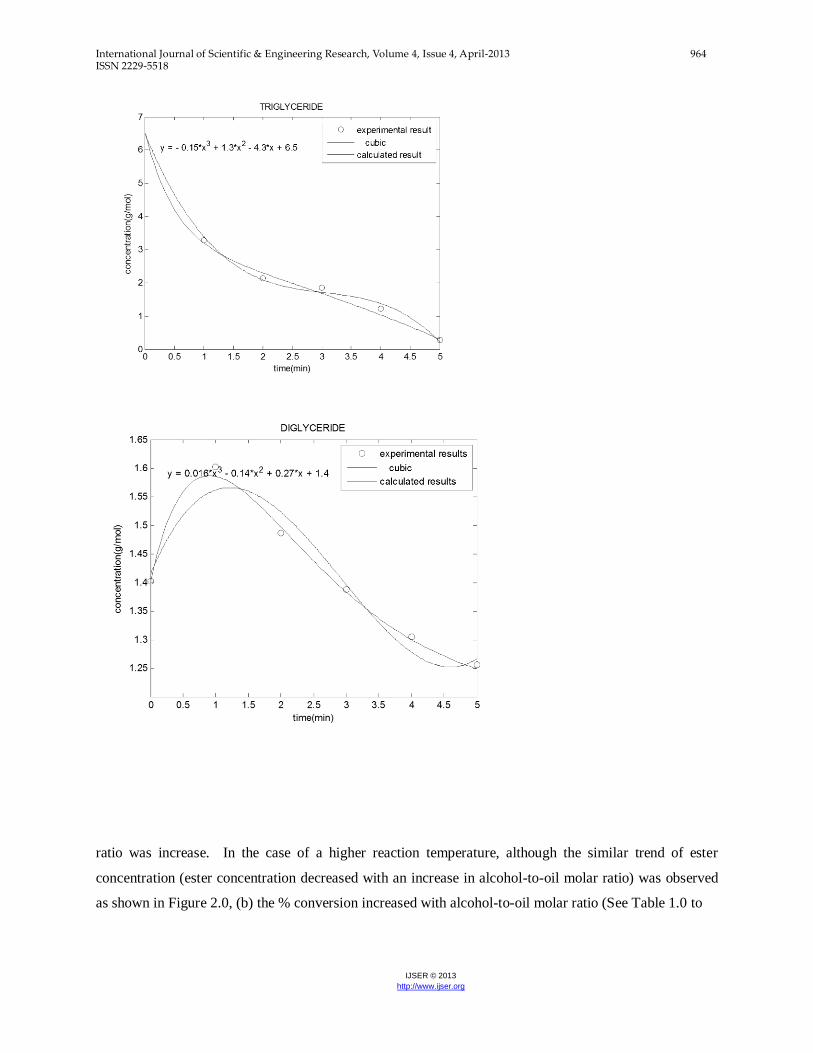
Effect of alcohol-to-oil molar ratio
The effect of alcohol to oil molar ratio (6:1, 9:1, and 12:1) on ester concentration was studied at 50oC.
This results are given in Figure 2.0 (a), (b). As shown in Figures 2.0 and Tables 1.0 to 5.0 ester
concentration as well as the % conversion decreased as the alcohol-to-oil molar ratio was increased. This
can be explained on the basis of the reactant (oil) concentration in the reaction mixture. By increasing
alcohol to oil molar ratio, the amount of alcohol was increased, therefore the Milk bush and catalyst
concentrations were diminished, which reduced the rate of reaction. Results published by Boocock et al.
(1998) showed a similar trend in which the methyl ester percentage decreased as the alcohol-to-oil molar
International Journal of Scientific & Engineering Research, Volume 4, Issue 4, April-2013 964 ISSN 2229-5518
IJSER © 2013
http://www.ijser.org
ratio was increase. In the case of a higher reaction temperature, although the similar trend of ester
concentration (ester concentration decreased with an increase in alcohol-to-oil molar ratio) was observed
as shown in Figure 2.0, (b) the % conversion increased with alcohol-to-oil molar ratio (See Table 1.0 to
International Journal of Scientific & Engineering Research, Volume 4, Issue 4, April-2013 965 ISSN 2229-5518
IJSER © 2013
http://www.ijser.org
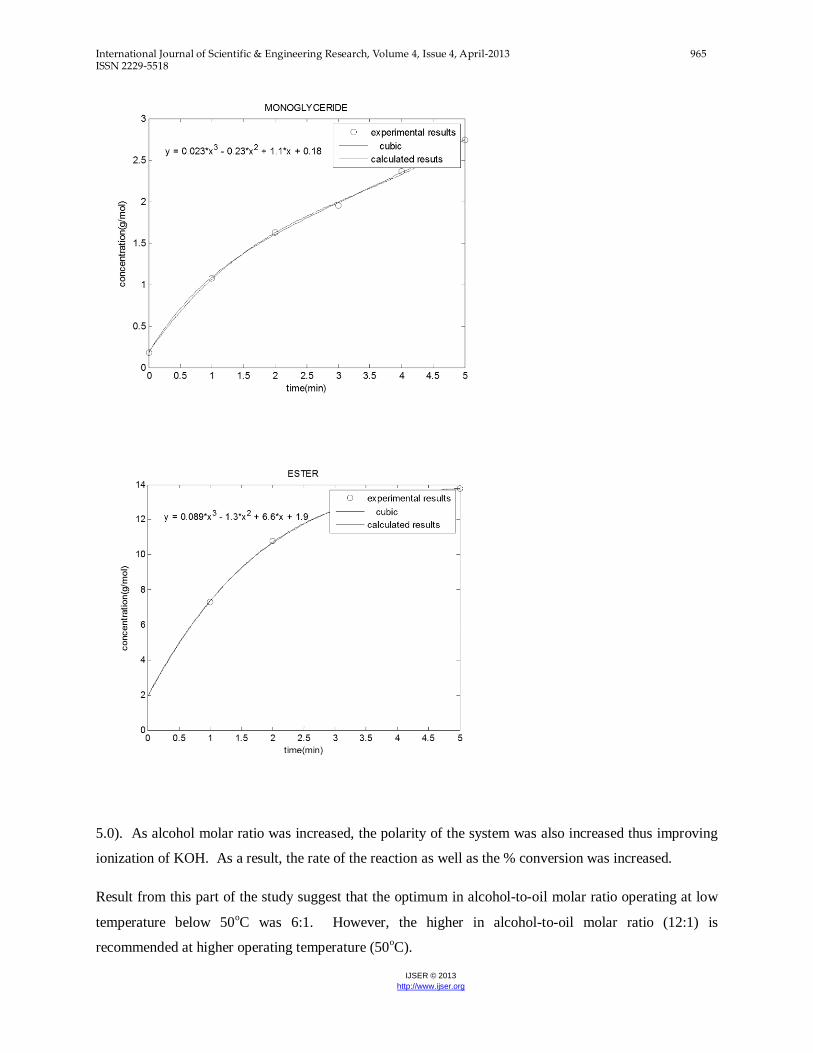
5.0). As alcohol molar ratio was increased, the polarity of the system was also increased thus improving
ionization of KOH. As a result, the rate of the reaction as well as the % conversion was increased.
Result from this part of the study suggest that the optimum in alcohol-to-oil molar ratio operating at low
temperature below 50oC was 6:1. However, the higher in alcohol-to-oil molar ratio (12:1) is
recommended at higher operating temperature (50oC).
International Journal of Scientific & Engineering Research, Volume 4, Issue 4, April-2013 966 ISSN 2229-5518
IJSER © 2013
http://www.ijser.org
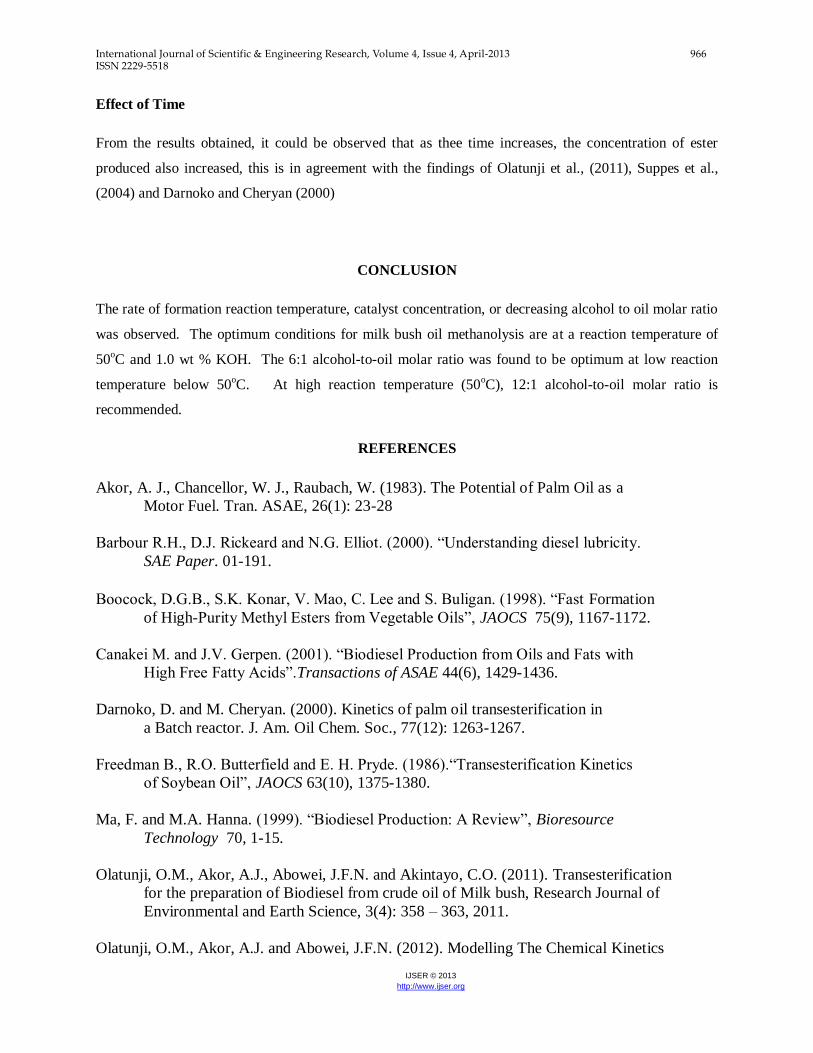
Effect of Time
From the results obtained, it could be observed that as thee time increases, the concentration of ester
produced also increased, this is in agreement with the findings of Olatunji et al., (2011), Suppes et al.,
(2004) and Darnoko and Cheryan (2000)
CONCLUSION
The rate of formation reaction temperature, catalyst concentration, or decreasing alcohol to oil molar ratio
was observed. The optimum conditions for milk bush oil methanolysis are at a reaction temperature of
50oC and 1.0 wt % KOH. The 6:1 alcohol-to-oil molar ratio was found to be optimum at low reaction
temperature below 50oC. At high reaction temperature (50
oC), 12:1 alcohol-to-oil molar ratio is
recommended.
REFERENCES
Akor, A. J., Chancellor, W. J., Raubach, W. (1983). The Potential of Palm Oil as a
Motor Fuel. Tran. ASAE, 26(1): 23-28
Barbour R.H., D.J. Rickeard and N.G. Elliot. (2000). “Understanding diesel lubricity.
SAE Paper. 01-191. Boocock, D.G.B., S.K. Konar, V. Mao, C. Lee and S. Buligan. (1998). “Fast Formation
of High-Purity Methyl Esters from Vegetable Oils”, JAOCS 75(9), 1167-1172.
Canakei M. and J.V. Gerpen. (2001). “Biodiesel Production from Oils and Fats with
High Free Fatty Acids”.Transactions of ASAE 44(6), 1429-1436.
Darnoko, D. and M. Cheryan. (2000). Kinetics of palm oil transesterification in
a Batch reactor. J. Am. Oil Chem. Soc., 77(12): 1263-1267.
Freedman B., R.O. Butterfield and E. H. Pryde. (1986).“Transesterification Kinetics
of Soybean Oil”, JAOCS 63(10), 1375-1380.
Ma, F. and M.A. Hanna. (1999). “Biodiesel Production: A Review”, Bioresource
Technology 70, 1-15.
Olatunji, O.M., Akor, A.J., Abowei, J.F.N. and Akintayo, C.O. (2011). Transesterification
for the preparation of Biodiesel from crude oil of Milk bush, Research Journal of
Environmental and Earth Science, 3(4): 358 – 363, 2011.
Olatunji, O.M., Akor, A.J. and Abowei, J.F.N. (2012). Modelling The Chemical Kinetics
International Journal of Scientific & Engineering Research, Volume 4, Issue 4, April-2013 967 ISSN 2229-5518
IJSER © 2013
http://www.ijser.org
Of Milk Bush (Thevetia peruviana) Oil Transesterification Process For
Biodiesel Production .Continental J. Engineering Sciences, 7(3): 40 – 48, 2011.
Suppes, G.J., Dasari, E.J., Doskosil, E.J., Mankidy, P.J. and Goff, M.J, (2004).
Transesterification of Soyabean oil with zeolite and metal catalysis. Appl. Catal. A: Gen.,
257(2): 213-223.
Zhous W., S.K. Konar and D.G. Boocock. (2003). “Ethyl Esters from the Single-Phase
Base-Catalyzed Ethanolysis of Vegetable Oils”.JAOCS. 80(4), 367-371.

International Journal of Scientific & Engineering Research, Volume 4, Issue 4, April-2013 968 ISSN 2229-5518
IJSER © 2013
http://www.ijser.org

International Journal of Scientific & Engineering Research, Volume 4, Issue 4, April-2013 969 ISSN 2229-5518
IJSER © 2013
http://www.ijser.org