modelling allocation with transport / conversion processes
TRANSCRIPT

Silva Fennica 31(3) review articles
Modelling Allocation with Transport /Conversion Processes
John H. M. Thornley
Thornley, J.H.M. 1997. Modelling allocation with transport / conversion processes. SilvaFennica 31(3): 341-355.
A shoot:root carbon:nitrogen allocation model, based on the two processes of transportand chemical conversion, is described and explored. The view is proposed that allallocation models, whether built for the purposes of theoretical investigation or practicalapplication, should start with this irreducible framework. In the present implementation,the processes operate according to: for substrate sources, dependence on shoot and rootsizes, with possible product inhibition; for transport, movement down a substrate con-centration gradient; for substrate sinks or utilization, linear bisubstrate kinetics. Thedynamic and equilibrium properties of the model are explored. Failure of this approachto allocation will indicate to the modeller that additional mechanisms to control theprocesses are needed, and the mode of failure will indicate the type of mechanismsrequired. Additional mechanisms are discussed which may involve hormones orteleonomic (goal-seeking) controls, and may be added to the irreducible framework.However, these additions should not replace the irreducible framework of transport andchemical conversion, because they do not in reality. Modifications to the basic model toreflect some possibilities such as ontogenesis with the transition from exponentialgrowth towards a steady state or with the scaling of within-plant transport resistances,the influence of hormones, and active transport, are described.
Keywords partitioning, shoot:root ratio, plant growth, simulationAuthor's address Institute of Terrestrial Ecology (Edinburgh), Bush Estate, Penicuik,Midlothian EH26 OQB, UK [email protected] 10 December 1996 Accepted 10 July 1997
1 Introduction work for allocation modelling, on to which moreelaborate hypotheses may be grafted.
The TR approach was proposed by ThornleyThe objective of this paper is to describe the (1972) for shoofcroot partitioning in relation totransport-resistance (TR) model for simulating the availability of C and N. In this approachdry matter allocation in plants, and to explain substrate sources are connected with transportwhy this approach provides an irreducible frame- resistances to substrate sinks where chemical/
341

Silva Fennica 31(3) review articles
biochemical conversions take place. The methodis described as 'irreducible' because transportand chemical conversion are processes whichmust take place in order that allocation is accom-plished, although how these processes are con-trolled is arguable. The TR model has been em-ployed by Wann et al. (1978) and Wann andRaper (1984) for simulating tobacco growth;Mäkelä and Sievänen (1987) have shown that amore aggregated teleonomic allocation model isembedded in the TR model; Rastetter et al. (1991)have used it in a forest and general ecosystemmodel; Thornley (1991) and Thornley and Can-nell (1996) have applied it in a forest plantationmodel; Dewar (1993) has extended the model toinclude water transport of N to the leaves andshown that this extension does not significantlychange the predictions obtained with the basicformalism; and Minchin et al. (1993) demon-strated that the model can account for a numberof experimentally observed source-sink relations.More recently the TR model has been applied tothree substrates, carbon, nitrogen and phospho-rus (Thornley, 1995), where there is also somediscussion of other approaches to allocation. Inspite of these developments, the model has notbeen used extensively in practical applications,although its applications have always been suc-cessful. Neither has it been replaced by an alter-native mechanistic theory.
Allocation in plants has been the subject ofseveral quite recent and comprehensive reviewsby Wilson (1988), Marcelis (1993), and Cannelland Dewar (1994). In his final sentence, Wilson(1988) suggests 'in so far as a working hypothe-sis is needed, Ockham's Razor indicates that itshould be of Thornley's (1972) type.' Marcelis(1993) concludes that 'the approach of potentialdemand and priority functions is most valuablefor simulation .... However, it requires extensiveinput data.' He also states that 'transport andsink regulation models are mechanistic and mightgive valuable results. However, their applicationis limited due to their complexity and difficultiesto determine the parameters.' Cannell and De-war (1994) state 'although there is much infor-mation on the distribution of dry matter in plants,there is surprisingly little understanding of themechanisms'; 'Progress in understanding ... as-similate allocation in plants may have been ham-
pered by regarding allocation as a single act';'Allocation is the outcome of many processesrather than a process in its own right'.
Wilson (1988) proposes that the TR approachis applied initially to these problems, and modi-fied or abandoned when it fails. Cannell andDewar (1994) give no unequivocal recommen-dation on the way forward, although they stressthe importance of developing methods of meas-uring the concentrations and fluxes of carbonand other nutrients, and elsewhere, Dewar et al.(1994) state that 'By treating simultaneously theuptake, transport and utilization of carbon, nutri-ents and water, source-sink models of free growthrepresent the most promising way forward'. Thus,while many workers see the value of the TRmodel as an explanatory theory, one main criti-cism levelled at it concerns the data required toparameterize it for practical applications.
Basically there are only two significant typesof process in the plant: transport, and chemical/biochemical conversion. (Morphogenesis can beconsidered in terms of these two processes also.)Both processes are necessary and are sufficientto accomplish allocation. Allocation is the out-come of the processes of substrate supply, trans-port and utilization. The mechanisms which de-termine the rates at which these processes oper-ate may be simple, or complex, and may dependto a greater or lesser extent on hormones, or onconstraints which have arisen through evolutionand give apparently goal-oriented behaviour['goal-oriented' responses can be considered asillusory depending on the position of the observ-er (Monod, 1974); an alternative 'objective' de-scription can always be constructed (e.g. Thornleyand Johnson, 1990, pp. 11-12)]. It will be arguedhere that, within the TR framework, quite simplemechanistic assumptions give rise to a surpris-ing variety of realistic responses, and the formal-ism is transparent, robust, and easily modified.In addition, it is argued that an indirect para-meterization is straightforward, although directparameter estimates cannot be provided untilmethods are found of measuring substrate con-centrations in the phloem and elsewhere in theplant. Finally, the limitations of purely goal-seek-ing models not based within a substrate transport/utilization framework are discussed.
342
Thornley Modelling Allocation with Transport / Conversion Processes
2 The Transport-ResistanceModel of Allocation
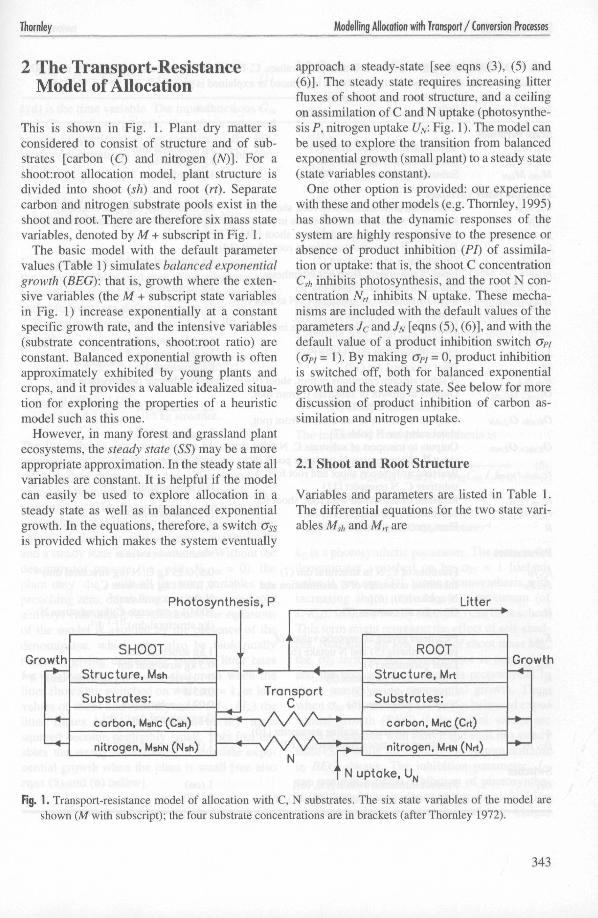
This is shown in Fig. 1. Plant dry matter isconsidered to consist of structure and of sub-strates [carbon (C) and nitrogen (AOL For ashoot:root allocation model, plant structure isdivided into shoot (sh) and root (rt). Separatecarbon and nitrogen substrate pools exist in theshoot and root. There are therefore six mass statevariables, denoted by M + subscript in Fig. 1.
The basic model with the default parametervalues (Table 1) simulates balanced exponentialgrowth (BEG): that is, growth where the exten-sive variables (the M + subscript state variablesin Fig. 1) increase exponentially at a constantspecific growth rate, and the intensive variables(substrate concentrations, shoot:root ratio) areconstant. Balanced exponential growth is oftenapproximately exhibited by young plants andcrops, and it provides a valuable idealized situa-tion for exploring the properties of a heuristicmodel such as this one.
However, in many forest and grassland plantecosystems, the steady state (SS) may be a moreappropriate approximation. In the steady state allvariables are constant. It is helpful if the modelcan easily be used to explore allocation in asteady state as well as in balanced exponentialgrowth. In the equations, therefore, a switch oSsis provided which makes the system eventually
approach a steady-state [see eqns (3), (5) and(6)]. The steady state requires increasing litterfluxes of shoot and root structure, and a ceilingon assimilation of C and N uptake (photosynthe-sis P, nitrogen uptake U^. Fig. 1). The model canbe used to explore the transition from balancedexponential growth (small plant) to a steady state(state variables constant).
One other option is provided: our experiencewith these and other models (e.g. Thornley, 1995)has shown that the dynamic responses of thesystem are highly responsive to the presence orabsence of product inhibition (PI) of assimila-tion or uptake: that is, the shoot C concentrationCsh inhibits photosynthesis, and the root N con-centration Nrt inhibits N uptake. These mecha-nisms are included with the default values of theparameters Jc and JN [eqns (5), (6)], and with thedefault value of a product inhibition switch o>/(o>7 = 1). By making oPI = 0, product inhibitionis switched off, both for balanced exponentialgrowth and the steady state. See below for morediscussion of product inhibition of carbon as-similation and nitrogen uptake.
2.1 Shoot and Root Structure
Variables and parameters are listed in Table 1.The differential equations for the two state vari-ables Msh and Mrt are
Photosynthesis, P
GrowthSHOOT
Structure, Msh
Substrates:
carbon, MshC (Csh)
nitrogen, MshN (iNsh)
TransportC
Litter
ROOT
Structure, Mrt
Substrates:
carbon, Mrtc(Crt)
nitrogen, MrtN (Nrt)
Growth
N uptake, UN
Fig. 1. Transport-resistance model of allocation with C, N substrates. The six state variables of the model areshown (M with subscript); the four substrate concentrations are in brackets (after Thornley 1972).
343

Silva Fennica 31(3) review articles
Table 1. Definitions of symbols, units and numerical values. C, N, dm denote carbon, nitrogen, dry mass. Thenumber of the equation where the symbol is introduced or explained is given.
Symbol Definition Units
State variablesMrt, Msh
Mrtc, Mshc
MrtN, MshN
Structural dm in root, shoot (1)Substrate C in root, shoot (4)Substrate N in root, shoot (4)
Principal other variablesCrt, Csh C substrate concentrations in root, shoot (9)C,N Mean C,N substrate concentrations in plant (17)
fcrufcsh Growth fractions allocated to root, shoot (13)frt,fsh Fractions of plant structural dm in root, shoot (14)Grt, Gsh Growth rates of root, shoot (2)Ip,shc Input of substrate C from photosynthesis
into shoot substrate C pool (5)h,nc, h, shN Input by transport of substrate C, N to root C,
shoot N substrate pools (8)Iu,rtN Input of substrate N from N uptake into
root substrate N pool (6)Lrt, Lsh Litter fluxes from root, shoot (3)M Plant structural dm (12)Nn, Nsh N substrate concentrations in root, shoot (9)Oartc, Oc,shc Outputs to growth of substrate C from root,
kg structural dmkg C substratekg N substrate
kg C substrate (kg structural dm)"1
kg C, N substrate (kg structural dm)"1
kg structural dm d~'
kg substrate C d~'
kg substrate C, N d"1
kg substrate N d"1
kg structural dm d"1
kg structural dmkg N substrate (kg structural dm)"1
OcrtN, OG,shN
Or.shCi Oj,rtN
rC,shrh rN,rtsh
fC.rh rc.sh,rN,rh rN,sh
Parameters
fcjNJC,JN
kG
KM
KMMU
kchtt
kN
qPC,PN
SwitchesOp,
o»
shoot substrate C pools (7)Outputs to growth of substrate N from root,shoot substrate N pools (7)Outputs to transport of substrate C, N fromshoot C substrate, root N substrate pools (8)Resistances between shoot and root forsubstrate C, N transport (11)Resistances associated with root, shoot forsubstrate C, N transport (10)Plant specific growth rate (15)
Fractions of C, N in structural dm (7)Inhibition constants of C assimilation andN uptake [(5), (6)]Growth rate constant (2)
Parameter giving asymptotic values ofphotosynthesis (5) and N uptake (6)Litter parameter (3)C assimilation parameter (5)Litter rate constant (3)N uptake parameter (6)
Transport resistance scaling parameter (10)Transport resistance coefficients (10)
Product inhibition switch [(5), (6)]Steady-state growth switch [(3), (5), (6)]
kg substrate C d"1
kg substrate N d"1
kg substrate C, N d"1
(kg structural dm)"1 d
(kg structural dm)"1 dd"1
Numerical value and units
0.5, 0.25 kg C, N (kg structural dm)"1
0.1,0.01 kg substrate C,N (kg structural dm)"1
200 [(kg substrate C)(kg substrate N)(kg structural dm)"2]"1 d"1
1 kg structural dm0.5 kg structural dm0.1 kg substrate C (kg structural dm)"1 d~'0.05 d"1
0.02 kg substrate N(kg structural dm)"1 d"1
11 (kg structural dm)'?"1 d
l(on)O(off)
344

Thornley Modelling Allocation with Transport / Conversion Processes
dM,h dMr,• = Lrsh — L,sh,
d/ d/(1)
t (d) is the time variable. The input functions Gsh
and Grt are from growth. Growth is assumedsimply proportional to the product of the sub-strate concentrations (c/. equation 1 of Thornley1972):
Gsh = kGM.shCshNsh, Grl = kGMr(CrtNrt (2)kG = 200 [(kg substrate C)(kg substrate N)
(kg structure"2]"1 cH.
kG is a growth parameter, which is assumed to bethe same for shoot and root. The substrate con-centrations, C and N, subscripted sh for shootand rt for root, are defined in eqns (9).
The output functions Lsh and Lrt are litter flux-es with
Lsh -1 + KMJitt I Mrt
(3)1 + KM,ntt I Msh
Oss = 0 (BEG), 1 (55);him = 0.05 d"1, KM,utt = 0-5 kg structure.
The litter fluxes are switched on by setting theparameter aSs = 1 to give a steady state (SS). IfGss = 0, then there are no litter fluxes and bal-anced exponential growth (BEG) occurs. kutt is arate constant. The denominator in the litter func-tion ensures that the litter flux decreases at lowvalues of shoot or root structure quadraticallyand a steady state is always attained. Without thedenominator present (i.e. with KMM - 0), theplant may 'die', with all the state variables ap-proaching zero, depending on the shoot and rootactivity. This unhelpful solution to the equationsof the model is avoided by the presence of thedenominator, which may also be biologicallyrealistic, giving decreasing specific litter ratesfor small plants. Note also that even when thelitter fluxes are switched on with oSs = 1, at lowvalues of shoot and root dry mass (Msh, Mrt) thelitter fluxes being proportional to dry masssquared become negligibly small. This fact en-ables the steady-state model to simulate expo-nential growth when the plant is small [see alsoeqns (5) and (6) below].
2.2 Carbon and Nitrogen Substrates
The differential equations for the masses of Cand N substrates in shoot sh and root rt are
dMshC
dt
dMrtcAt
dt
dMr,N
dt
- h,shC - OG,shC - Or,shC
= h,rtC - OG,rtC(4)
— lu,rtN — ~ Oj\rtN
The notation on the right side of these equationsis: / = input, O = output; with subscripts: P =photosynthesis, G = growth, T = transport, U =uptake. The right side terms are defined below.Substrate loss with the litter fluxes [eqns (3)] isassumed to be negligible.
2.2.7 Photosynthesis
The input of C from photosynthesis is
(5)Ip ffiC(1 + GSsMsh I KM)(\ + OpiCsh I Jc)
kc = 0.\ kg C (kg shoot structure)"1 or1,KM = 1 kg structure, Opj = 1,Jc = 0.1 kg substrate C (kg structure)"1
kc is a photosynthetic parameter. The term in thedenominator switched on by Oss = 1 [defaultvalue 0, see eqn (3)], limits photosynthesis withincreasing shoot mass Msh to a maximum (ofkcKM), so that a steady state (SS) can be reached.This term might represent the effect of self-shad-ing. Note that, for low values of shoot mass Ms/,,the Oss term in the denominator is negligible,and the photosynthetic input is proportional toshoot mass, giving exponential growth. Thus,when CJ55 = 1, the system starts in balanced expo-nential growth (BEG) if the initial values aresmall (compared with unity), and ends in a steadystate (SS), while for c% = 0, the system remainsin BEG always. The inhibition parameter, Jc,can provide product inhibition of photosynthe-sis. Although the evidence for product inhibitionof photosynthesis is much argued (e.g. Geiger
345

Silva Fennica 31(3) review articles
1976, Sharkey 1985, Blechschmidt-Schneider etai. 1989), the effect of product inhibition of pho-tosynthesis [or N uptake: eqn (6)] on dynamicresponses is so great that it is included as thedefault option in the model. Product inhibitioncould operate indirectly, e.g. via other processessuch as increased respiration or exudation, ratherthan directly as assumed here. Setting the switchGpi to zero makes it inoperative. With Jc = 0.1,product inhibition of photosynthesis becomes sig-nificant when the shoot C substrate concentra-tion is ~0.1 or larger.
2.2.3 Growth
The outputs of substrate C and N for utilizationin the growth processes in the shoot and root are
Oc,shC — fcGsh i OcnC = fcGrt',
OG,shN ~ fNGxh, OcrtN ~ J'NGU',
fc = 0.5, fN = 0.025, kg C, N (kg structure)-'.
(7)
The fractional C, N contents of structure aredenoted by/;, i = C, N. The growth rates G,/, andGrt are defined in eqns (2).
2.2.2 Nitrogen Uptake
The input of N from root uptake is
j
W rtN —(.0)
(1 + OssMrt I KM)(i + GpiNrt IJN)
kN = 0.02 kg N (kg root structure)"1 cH,KM = 1 kg structure,JN = 0.01 kg substrate N (kg structure)"1
kN is a nitrogen uptake rate parameter. The max-imum N uptake rate is kN KM for the steady-statescenario (<Jss = 1) when Mrt is large. For lowvalues of root mass Mrt, the oss term in thedenominator is negligible, and the N uptake rateis proportional to root mass, giving exponentialgrowth. JN provides for inhibition of N uptakedepending on the internal concentration of N inthe root; the inclusion of this mechanism reduc-es oscillatory/overshoot effects in the model. Thedefault value of the switch o>/ is 1 [eqn (5)];setting Gpi = 0 removes product inhibition fromthe model. To-date there appears to be no exper-imental work that addresses the question of pos-sible product inhibition of N uptake in plants.An analysis of an active-transport mechanismacross a membrane suggests that product inhibi-tion will occur at some product concentration(e.g. Thornley and Johnson, 1990, equation(S4.6a), p. 592, exercise 4.6, p. 118). Leakage ofions from the root may also be important athigher concentrations of internal substrates (Bou-ma and De Visser, 1993). Root exudation isanother possible mechanism of substrate loss,which is ignored.
2.2.4 Transport
The transport fluxes are
(sT,shC — *T,rtC ~
h,shN = Or,nN —
Csh — Crt
1"C,shrt
Nr, - Nsh
(8)
Transport of both C and N substrates is propor-tional to the concentration difference divided by aresistance. The resistances between shoot and rootfor C and N substrate transport, rCtShrt and r^rtsh,are obtained by summing components associatedwith the shoot and root as stated in eqn (11) be-low. Balanced exponential growth can only occurif the resistances are proportional to the reciprocalof plant mass. This is because a plant of twice thesize, growing at the same specific rate, requirestransport fluxes that are twice as large with thesame concentrations in the shoot and root. Thustransport resistances which are proportional to thereciprocal of plant mass are needed.
2.3 Definitions
The C, N substrate concentrations are
M she Ar MshN
MnC
Mrt
MrtN
Mrt
(9)
The transport resistances, with units of (kg struc-tural dry mass)"1 d, associated with root and shoot,and C and N substrates are
346
Thornley Modelling Allocation with Transport / Conversion Processes
- Pc PC f s h k c = , frtkN = fi(fN + N) (16)
(10)
Pc =PN = 1 (kg structural d, q = 1
Pc, PN are specific transport resistances for C andN substrate transport, q is a scaling parameterwhich depends on architecture. The default val-ue of unity is needed if balanced exponentialgrowth is to be possible. Dewar (personal com-munication) commenting on an early version ofthis manuscript suggested this interpretationwhich associates transport resistances with eachorgan as in eqns (10) and gives an easy methodof calculating a transport resistance between or-gans [eqns (11)].
The transport resistances between shoot androot for the C, N substrates are
fC,shn = t"N,rtsh =
The total structural mass M is
M = Msh + Mrt (12)
The fractions of new structural growth [eqn (2)]allocated to the shoot and root are
_ Gsh f _ GrtJG,sh — ——, JG,rt —
Cr Lr
where G = Gsh + Grt
(13)
The actual shoot and root structural fractions are
Msh Mrt, Jrt =M M
(14)
The specific growth rate of the plant, fi is [witheqns (1) and (12)]
dMIdt
(15)where
M
dM
dt
dMsh | dMrt
dt dt
For balanced exponential growth with ass = 0,and no product inhibitions of C and Af inputs, itcan be shown that the shoot and root fractions(fsh, frt), the specific growth rate (jn), the C, Ncontents of structure (/C/N), and the mean plantsubstrate concentrations ( C , N ) are related by
The mean plant substrate concentrations are
C = fshCsh + frtCn
N = fthNtk + frtNrtElimination of \i between eqns (16) gives
fshkc __ frtkN
(17)
fc + C fN
This equation represents the much-discussed'functional equilibrium' hypothesis of Davidson(1969), in which shoot activity and root activitymay be proportional to each other. Note thatshoot activity equals shoot fraction (/^) timesshoot specific activity (kc).
3 Simulations and Discussion
The heuristic model presented above needs ex-ploration by means of simulation, to illustratethe type and scope of its responses, and to deter-mine whether this type of approach may be suit-able for forest growth and ecosystem models.Dynamic behaviour is the first part of this evalu-ation, followed by consideration of the equilibri-um responses.
The equations were programmed in the con-tinuous system simulation language, ACSL(Mitchell and Gauthier 1993). Euler 's methodwas used for integration with an interval of 0.02d in most cases.
3.1 Dynamic Behaviour
3.1.1 Balanced Exponential Growth
Balanced exponential growth {BEG) is the termused to describe the situation where all extensivevariables (e.g. mass variables, Fig. 1) of the sys-tem are increasing exponentially at a constantspecific growth rate [eqn (15)], and all intensivevariables [e.g. concentrations, fractions, eqns (9),(14)] are constant. Figure 2 shows the approachto BEG, obtained by using eqns (3), (5) and (6)with the switch ass = 0: this gives no litter fluxesand no asymptotic ceiling on photosynthesis or
347

Silva Fennica 31(3) review articles
\- 0.14I
•a~ 0,2
«" 0.10
P 0.06
.2 0.04
«i 0.02
A, specific growth rote l o
Product inhibition
20 r B, mean C substrate concentration
No product inhibition
380 400 420 440 460 480 500 80 400 420 440 460 480 500
C, shoot allocation fraction
No product inhibition
^ 0.6 Product inhibition
400 420 440 460 460 500Time, t (d)
S"c 0.03Vo
o
0.04 r D, mean N substrate concentrat ion
No product inhibition
0.02
3 0.01
Product inhibition
420 440 460
Time, t (d)
Fig. 2. Dynamics of perturbed balanced exponential growth, obtained with Gss = 0 in eqns (3), (5) and (6). 75 %of the shoot is removed at time t = 400 d. The responses are shown for without and with product inhibition,obtained by using ö>/ = 0 or 1 in eqns (5) and (6). A, specific growth rate, (i [eqn (15)]; B, mean plant Csubstrate concentration [eqns (17)] [kg C substrate (kg structural dry matter)"1]; C, shoot growth allocationfraction [eqn (13)]; D, mean plant N substrate concentration [eqns (17)] [kg N substrate (kg structural drymatter)"1].
N uptake. Although BEG can be simulated for atime with the switch oSs = 1 (which gives asteady state approached asymptotically as time tproceeds) by integrating the equations at verylow mass values when the terms switched out bytaking Gss = 0 are negligibly small, it is moreconvenient to use the switch Gss = 0 so that thesystem stays always in BEG. These model runswere performed with and without product inhi-bition of photosynthesis and N uptake, obtainedby using the product inhibition switch GPI ineqns (5) and (6). The initial state is obtained bytaking the equilibrium state for balanced expo-nential growth and scaling down the shoot com-ponents by a factor of 0.25, equivalent to a 75 %defoliation. The equilibrium specific growth rate(Fig. 2A) is decreased by the presence of prod-uct inhibition of photosynthesis and uptake, asexpected. More striking is the effect of product
inhibition on allocation of new growth to theshoot [eqn (13)], drawn in Fig. 2C: when prod-uct inhibition occurs [eqns (5), (6)], the highlyoscillatory behaviour produced with no productinhibition is replaced by well-damped behaviourwith a single overshoot, which is realistic (Ficket al. 1971). The C and N substrate concentra-tions exhibit similar behaviour (Figs. 2B, D) butmove out-of-phase. It seems possible that thehighly oscillatory behaviour of the model with-out product inhibition of assimilation or uptakemay be a result of the lumped representation oftransport; a more distributed transport model withseveral substrate reservoirs in series would be-have in a more damped manner. The numericaldifficulties that are sometimes encountered withthe transport-resistance model of allocation canhave their origin in these oscillatory characteris-tics with an inappropriate integration interval.
348

Thornley Modelling Allocation with Transport / Conversion Processes
A, plant structural dry mass
No product inhibition
Product inhibition
1900 2000 2100 2200 2300 2400 2500
1.0
0 9
0.8
0.7
0.6
n «.
r Ci shoot allocation fraction
\f\
No product inhibition
Product inhibition
1900 2000 2100 2200 2300 2400 2500Time, t (d)
i25 |- B, mean C substrate concentrat ion
I Product inhibition0.020
0.015
<n 0.005O
No produc t inhibition
3 0.01in2
D, mean N substrate concentration
No product inhibition
Product inhibition
1900 2000 2100 2200 2300 2400 2500Time, t (d)
Fig. 3. Dynamics of perturbed steady-state growth, obtained with oss = 1 in eqns (3), (5) and (6). 75 % of the shootis removed at time t = 2000 d. The responses are shown without and with product inhibition, obtained by usingOPI = 0 or 1 in eqns (5) and (6). A, plant structural dry mass, M [eqn (12)]; B, mean plant C substrate concentra-tion [eqns (17)] [kg C substrate (kg structural dry matter)"1]; C, shoot growth allocation fraction [eqn (13)];D, mean plant N substrate concentration [eqns (17)] [kg N substrate (kg structural dry matter)"1].
3.1.2 Steady State
A steady state is reached by integrating the equa-tions with the switch o$s - 1 which gives rise tolitter fluxes [eqn (3)] and puts a ceiling on theassimilation and uptake rates [eqns (5), (6)]. Thesteady state with a 75 % shoot defoliation istaken as the initial value for examining the dy-namics with which the system returns to thesteady state. These simulations are given in Fig.3. The effect of product inhibition is not asmarked as for balanced exponential growth (Fig.2). The steady state is generally better dampedthan the balanced exponential growth state: over-shoot effects and oscillations are smaller (cf.Figs 3B, 3C, 3D to Figs 2B, 2C, 2D).
3.1.3 Ontogenesis
A difficulty in investigating shootroot alloca-tion is the importance of ontogeny (see Wilson1988). Within the framework of the vegetativeallocation model without any explicit represen-tation of development, there are two possibilitiesfor considering 'ontogenetic' effects. The first isto examine the transition from balanced expo-nential growth to the steady state. The second isto examine the effects of scaling the transportresistances differently, remembering that only ifthe transport resistances scale inversely with plantsize [q = 1 in eqn (10)], does an exponentialgrowth solution exist.
In Fig. 4 the shift from balanced exponentialgrowth (BEG) to a steady state is illustrated, ob-tained by running the model with <7Ss = 1 [eqn (3)]starting from a very low mass in BEG, with prod-
349

Silva Fennica 31(3) review articles
0.10 r A, specific growth rate • B, shoo t f r a c t i o n s
Growth fraction allocated to shootS 0.9
,9. 0.8oo
"o 0.7oszV)
0.6
Fraction of plant structural dm in shoot
300
4 r C, plant structural dry mass
100 200 300
Time, t (d)
0.06
0.05
0.04
0.03
0.02
0.01
0.00
r D, mean C, N substrate concentrations
Corbon
Nitrogen
100 200 300
Time, t (d)
Fig. 4. The transition from balanced exponential growth to the steady state with product inhibition [ö>/ = 1 ineqns (5) and (6)]. The model is simulated with the default parameter values and initial values correspondingto balanced exponential growth and structural dry mass of 0.0001 kg. A, specific growth rate [eqn (15)];B, allocation of current growth to the shoot [eqn (13)] and fraction of plant structure in the shoot [eqn (14)];C, plant structural dry mass [eqn (12)]; D, mean plant C and N substrate concentrations [eqn (17)] [kg C, Nsubstrate (kg structural dry matter)""1].
uct inhibition. The specific growth rate, initiallyconstant, falls to zero while the dry mass, increas-ing exponentially, approaches an asymptote (Fig.4A, C). Total structural dry mass, M, follows atypical sigmoidal growth trajectory (Fig. 4C),similar to the logistic or Gompertz functions (e.g.pp. 80-85 of France and Thornley 1984). Alloca-tion to the shoot [eqn (13)] increases to a highervalue (Fig. 4B), whereas the shoot fraction [eqn(14)], which equals the shoot allocation fraction inbalanced exponential growth, falls slightly beforeincreasing to a value which in the steady state islower than the shoot allocation fraction. This isdue to the different litter rates in shoot and root.The shoot is larger than the root; its specific litterrate is greater than that in the root [eqn (3)]; andtherefore the shoot needs a higher allocation frac-tion in the steady state. The C and N substrate con-
centrations move in opposite directions as theplant adjusts from exponential growth where car-bon is relatively abundant to a steady state wherenitrogen is relatively abundant (Fig. 4D).
In Fig. 5 the consequences of assigning differ-ent values to the transport resistance scaling fac-tor, q [eqn (10)], are illustrated, with the modelotherwise running in the balanced exponentialgrowth mode with oss = 0 and with productinhibition (ö>/ = 1). Transport fluxes becomeincreasingly limiting for values of q < 1 [eqn(10)] because they do not increase proportion-ately to plant size: this causes specific growthrate to decrease with time (Fig. 5A), allocationto the shoot to increase (Fig. 5B), and the differ-ence between the shoot and root C substrateconcentrations to widen (Fig. 5C). The oppositetrends occur if the resistances decrease faster
350

Thornley Modelling Allocation with Transport / Conversion Processes
0.10
•o~ 0.08
g"g 0.06.c"sO 0.04
A, specific growth rate
q -1 .33
' " I~(BEG)
0.67
B, shoot allocation fraction
i 0.6^7 _ „
1 (BEG)
T."33"""
60 BO
0.10
0.08
0.06
0.04
0.02
n nn
• C, carbon substrate concentrations^
Shoot ^ - * " * *
> ~ - . ^ - - ^ 1 (BEG)
• " " " " " " * * " • • .
q = 1.33
* * - - . _ . "" 1 (BEG)
""" Root ~~~ — —0.67"~
0 20 40 60 80 100
Time, t (d)
Fig. 5. Effect of scaling transport resistances [eqn (10)]on balanced exponential growth (BEG, Oss - 0)with product inhibition of inputs of both substrates[eqns (5), (6)]. The scaling parameter q [eqn (10)]is assigned the values given. A, plant specificgrowth rate [eqn (15)]; B, allocation fraction ofgrowth to shoot [eqn (13)]; C, shoot and root Csubstrate concentrations [eqns (9)] [kg C substrate(kg structural dry matter)"1].
than plant mass increases [q > 1 in eqn (10)].A further possible simulation, not reported here,
is to combine the ontogenetic effects of approach-ing a steady state (Fig. 4) with an allometricscaling of the transport resistance (Fig. 5).
3.2 Responses to Environment
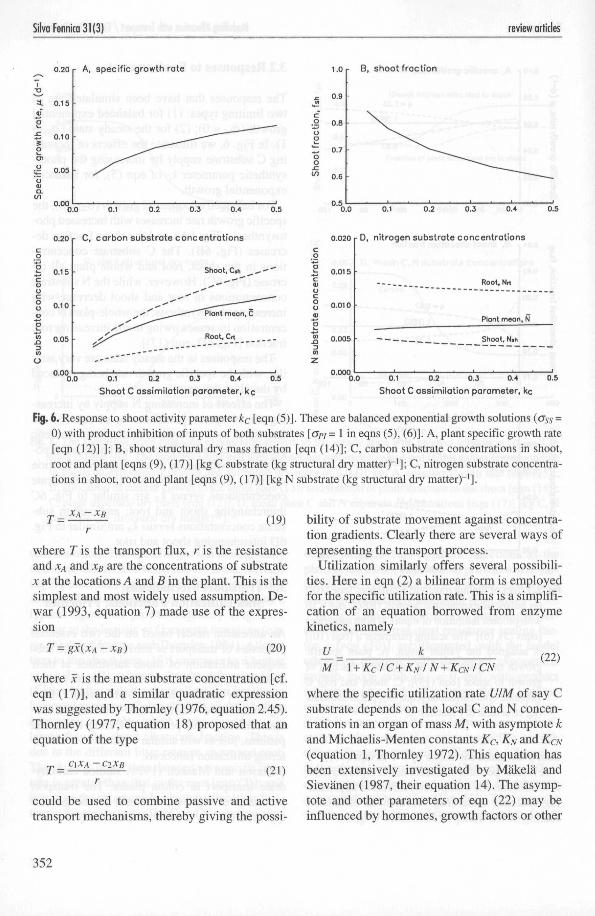
The responses that have been simulated are oftwo limiting types: (1) for balanced exponentialgrowth (oss = 0); (2) for the steady state (GSs =1). In Fig. 6, we illustrate the effects of increas-ing C substrate supply by increasing the photo-synthetic parameter kc of eqn (5), for balancedexponential growth.
For balanced exponential growth (oss = 0), thespecific growth rate increases with increased pho-tosynthesis (Fig. 6A), and the shoot fraction de-creases (Fig. 6B). The C substrate concentra-tions in the shoot, root and whole plant all in-crease (Fig. 6C). However, while the N substrateconcentrations in root and shoot decrease withincreasing photosynthesis, the whole-plant N con-centration increases owing to the increasing rootfraction [Fig. 6D, eqn (17)].
The responses in the steady state are very sim-ilar, with the specific growth rate being replacedby the plant dry mass.
The effects of increasing N supply by increas-ing the N uptake parameter kN of eqn (6) areanalogous to the increases in the photosyntheticparameter kc in Fig. 6, both for balanced expo-nential growth and the steady state: root fractionversus kNis similar to Fig. 6B; nitrogen substrateconcentrations versus kN are similar to Fig. 6Cinterchanging shoot and root; and carbon sub-strate concentrations versus kN are similar to Fig.6D interchanging shoot and root.
3.3 Transport Mechanisms;Sink Utilization Functions; Priorities
An allocation model based on the two essentialprocesses of transport of substrates and the sub-sequent utilization of those substrates at theirdestination, allows allocation priorities to be rep-resented in terms of these two processes. Differ-ing resistances with the same substrate utiliza-tion functions will produce differing allocationpatterns, just as will similar resistances with dif-fering utilization functions.
Mason and Maskell (1928) studied carbohy-drate transport in cotton plants. The transportprocesses of eqns (8) conform to the generaltype observed by these authors, namely
351
Silva Fennica 31(3) review articles
0.20 r A, specific growth rate
0.4
0.20
0.15
0.10
0.05
n no
r Ct carbon substrate concentrations
Shoot, C.h
•*• ^___-— "Plant mean.
sfs**^ Root. Crt
, _ . - " " " "
.
c
"0.0 0.1 0.2 0.3 0.4 0.5
Shoot C assimilation parameter, kc
1.0 r B, shoot fraction
0.020 r D, nitrogen substrate concentrations
£ 0.005
Root, Nrt
Plont meon, N
Shoot. N.h
0.0 0.1 0.2 0.3 0.4 0.5
Shoot C assimilation parameter, kc
Fig. 6. Response to shoot activity parameter kc [eqn (5)]. These are balanced exponential growth solutions (<Jss =0) with product inhibition of inputs of both substrates [o>/ = 1 in eqns (5), (6)]. A, plant specific growth rate[eqn (12)] ]; B, shoot structural dry mass fraction [eqn (14)]; C, carbon substrate concentrations in shoot,root and plant [eqns (9), (17)] [kg C substrate (kg structural dry matter)"1]; C, nitrogen substrate concentra-tions in shoot, root and plant [eqns (9), (17)] [kg N substrate (kg structural dry matter)"1].
T = (19)
where T is the transport flux, r is the resistanceand XA and xB are the concentrations of substratex at the locations A and B in the plant. This is thesimplest and most widely used assumption. De-war (1993, equation 7) made use of the expres-sion
T = gx(xA - xB) (20)
where x is the mean substrate concentration [cf.eqn (17)], and a similar quadratic expressionwas suggested by Thornley (1976, equation 2.45).Thornley (1977, equation 18) proposed that anequation of the type
T =C\XA-C2XB
(21)
could be used to combine passive and activetransport mechanisms, thereby giving the possi-
bility of substrate movement against concentra-tion gradients. Clearly there are several ways ofrepresenting the transport process.
Utilization similarly offers several possibili-ties. Here in eqn (2) a bilinear form is employedfor the specific utilization rate. This is a simplifi-cation of an equation borrowed from enzymekinetics, namely
uM \ + Kc/C + KN I N + KCNICN
(22)
where the specific utilization rate U/M of say Csubstrate depends on the local C and N concen-trations in an organ of mass M, with asymptote kand Michaelis-Menten constants Kc, KN and KCN(equation 1, Thornley 1972). This equation hasbeen extensively investigated by Mäkelä andSievänen (1987, their equation 14). The asymp-tote and other parameters of eqn (22) may beinfluenced by hormones, growth factors or other
352

Thornley Modelling Allocation with Transport / Conversion Processes
1.4
1.2
1.0
0.8
0.6
0.4
0.2
0.0
Competing Michaelis—Menten sinks
Sink B
2 4 6 8
Substrate concentrations, x
Fig. 7. Two Michaelis-Menten substrate responses [eqn(23)], illustrating different specific utilization ratesat high and low substrate concentrations. Parame-ters in eqns (23) are: kA = 1, kB = 2, KA = 2, KB = 8.Units are arbitrary.
morphogenetic factors which vary with positionin the plant.
Focussing now on the response to a singlesubstrate, x say, at two different locations in theplant, denoted by A and B, the utilization equa-tion may be re-written in the form
andUB kBxB
MA K A + xA MB KB + xB
(23)
where the values of kA, kB, KA, KB may depend onthe concentrations of other substrates or hor-mones. This equation is drawn in Fig. 7. Withthe parameter values chosen, it can be seen thatlocation A takes precedence for low values ofsubstrate, whereas location B has the higher uti-lization rate at high values of substrate concen-tration. Thus, traditional enzyme-kinetic expres-sions allow quite complex utilization or sinkresponses to be readily simulated.
Comparing eqns (22) and (23) with the biline-ar forms used for growth in eqns (2), because theroot N concentration Nrt is greater than the shootN concentration Nsh, the slope with respect tocarbon substrate of GshIMsh is less than that ofGrtIMrt. This means that a given increment incarbon substrate applied equally to shoot androot gives a greater increment in specific rootgrowth than in specific shoot growth. This caus-es the allocation responses of the transport-re-sistance model.
4 Conclusions
A summary of the present logical position is asfollows. Transport and chemical conversion arethe only two significant processes occurring inplants. Allocation is the result of these process-es. As illustrated here, these two processes alone,with the simplest of phenomenological assump-tions for the rates of the processes, are sufficientto predict a wide range of allocation responses.There are several possibilities for modifying theassumed phenomenology for the transport andconversion processes in order to obtain differentallocation responses. These include, for exam-ple, scaling of transport resistances [eqn (10)],non-linear transport fluxes [eqn (20)], activetransport [eqn (21)], integrating substrate trans-port with water transport (Dewar 1993), and morecomplicated substrate utilization responses [eqn(22)] in which the effects of hormones, growthfactors or water status are incorporated [see eqn(23) and Fig. 7].
The pipe-model hypothesis (Shinozaki et al.1964) is based on water transport. It has beenused and developed further by Valentine (1985),Mäkelä (1986, 1990) and Ludlow et al. (1990).To recast this into a transport-utilization frame-work could involve: taking account of the role ofwater transport in substrate transport (Dewar1993), taking account of the effects of plant wa-ter status on utilization and transport processes(e.g. Thornley 1996), or possibly taking a routefrom water stress to hormone production to mod-ifying utilization functions according to localhormone concentrations.
Teleonomic (apparently goal-seeking) modelscan have the allure of a siren: simplicity, a usefulrange of realism, and an evolutionary interpreta-tion. However, this allure is deceptive. The ap-proach is a cul-de-sac. There are many possiblegoals. The choice of goal is inevitably subjec-tive. The parameters can only be obtained byfitting responses at the system level. When theteleonomic model fails, as all models invariablydo, there is nowhere to go, nowhere to seek thecause of failure in other than the most superficialterms. This is not to deny the importance ofevolved constraints, or the value of a teleonomicviewpoint. Only if the teleonomic criteria are
353

Silva Fennica 31(3) review articles
built into a mechanistic framework can they beproperly considered in a progressive modellingendeavour.
Acknowledgements
I am indebted to Melvin Cannell and RoddyDewar for many helpful comments. The workhas been supported by NERC through its TIGER(Terrestrial Initiative in Global Environment Re-search) programme, the Department of the Envi-ronment Contract No PECD 7/12/79 on carbonsequestration, the European Community pro-grammes Epoch (EPOC-CT90-0022) and Espace(EV5V-CT93-0292) projects, and the AFRC In-stitute of Grassland and Environmental Researchat North Wyke (Devon, UK).
References
Blechschmidt-Schneider, S., Ferrar, P. & Osmond,C.B. 1989. Control of photosynthesis by the carbo-hydrate level in leaves of the C4 plant Amaran-thus edulis L. Planta 177: 515-525.
Bouma, T.J, & De Visser, R. 1993. Energy require-ments for maintenance of ion concentrations inroots. Physiologia Plantarum 89: 133-142.
Cannell, M.G.R. & Dewar, R.C. 1994. Carbon alloca-tion in trees: a review of concepts for modelling.Advances in Ecological Research 25: 59-104.
Davidson, R.L. 1969. Effect of root/leaf temperaturedifferentials on root/shoot ratios in some pasturegrasses and clover. Annals of Botany 33: 561-569.
Dewar, R.C. 1993. A root-shoot partitioning modelbased on carbon-nitrogen-water interactions andMiinch phloem flow. Functional Ecology 7: 356-368.
— , Ludlow, A.R. & Dougherty, P.M. 1994. Envi-ronmental influences on carbon allocation in pines.Ecological Bulletins 43: 92-101.
Fick, G.W., Williams, W.A. & Loomis, R.S. 1971.Recovery from partial defoliation and root prun-ing in sugar beet. Crop Science 13: 718-721.
France, J. & Thornley, J.H.M. 1984. Mathematicalmodels in agriculture. Butterworths, London.
Geiger, D.R. 1976. Effects of translocation and sink
demand on photosynthesis. Canadian Journal ofBotany 54: 2337-2345.
Ludlow, A.R., Randle, T.J. & Grace, J.C. 1990. De-veloping a process-based growth model for Sitkaspruce. In: Dixon, R.K., Meldahl, R.S., Ruark,G.A. & Warren, W.G. (eds.) Process modelling offorest growth responses to environmental stress.Timber Press Inc., Oregon, p. 249-262.
Mäkelä, A.A. 1986. Implications of the pipe modeltheory on dry matter partitioning and height growthin trees. Journal of Theoretical Biology 123: 103—120.
— 1990. Modeling structural-functional relationshipsin whole-tree growth: resource allocation. In: Dix-on, R.K., Meldahl, R.S., Ruark, G.A. & Warren,W.G. (eds.) Process modelling of forest growthresponses to environmental stress. Timber PressInc., Oregon, p. 81-95.
— & Sievänen, R.P. 1987. Comparison of two shoot-root partitioning models with respect to substrateutilization and functional balance. Annals of Bot-any 59: 129-140.
Marcelis, L.F.M. 1993. Simulation of biomass alloca-tion in glasshouse crops - a review. Acta Horti-culturae 328: 49-67.
Mason, T.G. & Maskell, E.J. 1928. Studies on thetransport of carbohydrate in the cotton plant. II.The factors determining the rate and the directionof movement of sugars. Annals of Botany 42:571-636.
Minchin, P.E.H., Thorpe, M.R. & Farrar, J.F. 1993.A simple mechanistic model of phloem transportwhich explains sink priority. Journal of Experi-mental Botany 44: 947-955.
Mitchell and Gauthier Associates (MGA), Inc. 1993.Advanced Continuous Simulation Language(ACSL) reference manual. 200 Baker Avenue,Concord MA, 01742-2100, USA.
Monod, J. 1974. Chance and necessity. Collins, Fonta-na, Great Britain (originally published as Le Hasardet al Necessite. Editions du Seuil, Paris, 1970).
Rastetter, E.B., Ryan, M.G., Shaver, G.R., Melillo,J.M., Nadelhoffer, K.J., Hobbie, J.E. & Aber, J.D.1991. A general biogeochemical model describ-ing the responses of the C and N cycles in terres-trial ecosystems to changes in CO2 and climate,and N deposition. Tree Physiology 9: 101-126.
Sharkey, T.D. 1985. Photosynthesis in intact leaves ofC3 plants: physics, physiology and rate limita-tions. The Botanical Review 51: 53-105.
354

Thornley Modelling Allocation with Transport / Conversion Processes
Shinozaki, K., Yoda, K., Hozumi, K. & Kira, T. 1964.A quantitative analysis of plant form - the pipemodel theory. Japanese Journal of Ecology 14:97-105.
Thornley, J.H.M. 1972. A balanced quantitative mod-el for root:shoot ratios in vegetative plants. An-nals of Botany 36: 431-441.
— 1977. Rootshoot interactions. In: Jennings, D.H.(ed.) Integration of activity in the higher plant.Society for Experimental Biology Symposium 16.University Press, Cambridge, p. 367-389.
— 1991. A transport-resistance model for forestgrowth and partitioning. Annals of Botany 67:219-228.
— 1995. Shoot:root allocation with respect to C, Nand P: an investigation of resistance and teleo-nomic models. Annals of Botany 75: 391^105.
— 1996. Modelling water in crops and plant ecosys-tems. Annals of Botany 77: 261-275.
— & Cannell, M.G.R. 1996. Temperate forest re-sponses to carbon dioxide, temperature and nitro-gen: a model analysis. Plant, Cell and Environ-ment 19: 1331-1348.
— & Johnson, I.R. 1990. Plant and crop modelling.University Press, Oxford.
Valentine, H.T. 1985. Tree-growth models: deriva-tions employing the pipe model theory. Journal ofTheoretical Biology 117: 579-585.
Wann, M., Raper, CD. & Lucas, H.L. Jr. 1978. Adynamic model for plant growth: a simulation ofdry matter accumulation for tobacco. Photosyn-thetical2: 121-136.
— & Raper, CD. 1984. A dynamic model for plantgrowth: validation study under changing tempera-tures. Annals of Botany 53: 45-62.
Wilson, J.B. 1988. A review of evidence on the con-trol of shoot:root ratio, in relation to models. An-nals of Botany 61: 433^49.
Total of 32 references
355