modeling the impacts of state energy policies barry rubin, zachary wendling, david warren, sanya...
TRANSCRIPT

Modeling the Impacts of State Energy Policies
Barry Rubin, Zachary Wendling, David Warren, Sanya Carley, and Kenneth Richards
School of Public and Environmental AffairsIndiana University
Bloomington, IN 47405
Presented at the 32nd USAEE/IAEE North American Conference, Anchorage, Alaska, July, 2013

Evaluating the Impacts of State Energy Efficiency: Status of State- and Sub-State-Level Energy Policy
Impact Analysis
• US energy policy is primarily driven by state governments.
• Decisions at the state and sub-state levels are based on preconceptions rather than detailed policy analysis.
• There is a compelling need for tools that can help state and local governments and business leaders evaluate alternative energy pathways.

Evaluating the Impacts of State Energy Efficiency: An Econometric Modeling Approach
• Over the past four years, our research team at Indiana University has created a framework for evaluating the impact of alternative energy policy scenarios.
• We have constructed an econometric, simultaneous, multi-equation econometric model that addresses the connection between energy consumption, energy prices, and economic activity for Indiana.
• In this presentation, we describe the estimation and simulation results for the sample period, and
• provide the results of applying the state model to analyze a Demand Side Management (DSM) policy.

Evaluating the Impacts of State Energy Efficiency: An Econometric Modeling Approach
• The model will eventually include 10 homogeneous multi-county regions. However, the research reported here focuses on our state-level model and two regions (South Bend and Indianapolis), each with 30 stochastic equations.
• The endogenous variables of the model include employment and earnings for ten economic sectors, and energy consumption disaggregated across three fuel types and four end use categories.
• The model also addresses unemployment, nonwage income, total personal income, and GDP per capita.

Evaluating the Impacts of State Energy Efficiency: An Econometric Modeling Approach
• The Indiana econometric model was estimated with annual data over the period 1977-2011.
• It is structured in a dynamic, simultaneous framework that allows tracing the effect of changes in exogenous and policy variables over the course of successive periods.
• The explicit linkage of diverse economic sectors via this structure simulates the interdependent nature of the economy, allowing the effects of energy and environmental policies to be transmitted throughout the model.

Evaluating the Impacts of State Energy Efficiency: An Econometric Modeling Approach
• Data sources include the U.S. Bureau of Labor Statistics, the Bureau of Economic Analysis, the Energy Information Administration (EIA), the Annual Survey of Manufactures and the Indiana Business Research Center.
• Exogenous variables include population, climatic variables, national level economic data, and, most importantly, energy prices for natural gas, motor gas, and electricity.
• Figure 1 graphically depicts the simultaneous nature of the model by identifying the various linkages across sectors and equations.

Evaluating the Impacts of State Energy Efficiency

Evaluating the Impacts of State Energy Efficiency: Stochastic Equations, Estimation and Simulation Results
• OLS estimation was used due to the tradeoff between simultaneous equation bias and the potential propagation of data errors with simultaneous equation estimation techniques in regional models.
• The following tables identify the endogenous and exogenous variables of the model, including the specific variables in each equation.
• Mean Absolute Percent Errors (MAPEs) are provided for each equation, as are graphs of actual and predicted values for selected endogenous variables from the sample period simulations.

Evaluating the Impacts of State Energy Efficiency: Stochastic Equations, Estimation and Simulation Results • MAPE values indicate the average error for each
endogenous variable when the model is “turned on” to simulate the sample period values with which the equations were fit.
• They provide an indication of the model’s performance and predictive ability, in contrast to single equation results which do not include the simultaneous interaction of the endogenous variables.
• MAPE values under 5% are generally considered excellent, between 5-10% very good, 10-15% good to mediocre, 15-20% potentially problematic, and >20% poor.

Evaluating the Impacts of State Energy Efficiency: Endogenous and Exogenous Variables

Evaluating the Impacts of State Energy Efficiency: Endogenous and Exogenous Variables

Evaluating the Impacts of State Energy Efficiency: Endogenous and Exogenous Variables

Evaluating the Impacts of State Energy Efficiency: State Estimation and Simulation Results
Dependent variable Independent variables R2 MAPE
Industrial electricity consumption
Two-year lagged own price, lagged motor gas price, lagged construction employment, lagged manufacturing employment, lagged utilities and transportation wage rate
0.95 3.34
Commercial electricity consumption
Own price, commercial natural gas price, wholesale employment, lagged finance employment, government wage rate
0.98 2.67
Residential electricity consumption
Own price, two-year lagged commerical natural gas price, finance employment, annual cooling degree days 0.98 2.20
Industrial natural gas consumption
Own price, motor gas price, lagged industrial electricity consumption, industrial sector employment, lagged manufacturing employment, lagged utilities and transportation wage rate, lagged industrial natural gas price
0.83 4.49
Commercial natural gas consumption
Own price, lagged own price, two-year lagged commercial electricity price, annual heating degree days, two-year lagged annual heating degree days, retail wage rate, lagged government wage rate
0.85 2.90
Residential natural gas consumption
Lagged own price, two-year lagged residential electricity price, two-year lagged residential natural gas consumption, residential electricity consumption, annual heating degree days, unemployment rate
0.83 2.52
Gross state product per capita
Industrial electricity consumption, lagged commercial electricity consumption, lagged motor gas price, finance wage rate, 1997 dummy
0.98 1.75
Non-wage income per capita
Residential electricity consumption, lagged motor gas price, lagged government employment, lagged commercial natural gas price
0.97 2.35
Unemployment rateLagged motor gas price, construction employment, commercial electricity consumption, utilities and transportation employment, 1990 dummy
0.84 13.42
Manufacturing employment
Lagged industrial natural gas price, lagged industrial electricity consumption, lagged services employment, construction employment, lagged utilities and transportation employment, 2001 dummy
0.85 3.53
Services employmentFinance employment, motor gas consumption, retail employment, commercial electricity consumption, 2001 dummy
0.99 2.13
Manufacturing earnings per employee
Lagged industrial natural gas price, motor gas price, industrial electricity consumption, lagged retail employment, two-year lagged services employment
0.95 1.44
Services earnings per employee
Commercial electricity consumption, motor gas price, wholesale wage rate, utilities and transportation employment
0.97 1.35

Evaluating the Impacts of State Energy Efficiency: South Bend Estimation and Simulation Results
Dependent variable Independent variables R2 MAPE
Industrial electricity consumption
Own price, industrial natural gas price, lagged manufacturing wage rate, lagged construction employment 0.90 6.59
Commercial electricity consumption
Own price, services employment, lagged per capita regional product 0.95 5.60
Residential electricity consumption
Own price, summer cooling degree days, finance employment, state retail employment, construction wage rate 0.91 3.87
Industrial natural gas consumption
Lagged own price, two-year lagged commercial electricity price, industrial sector employment 0.76 6.13
Commercial natural gas consumption
Own price, annual heating degree days, retail wage rate, lagged commerical electricity price, utilities and transportation wage rate
0.82 4.28
Residential natural gas consumption
Own price, commercial sector employment, industrial sector wage rate 0.67 3.58
Gross regional product per capita
Construction employment, manufacturing earnings, commerical electricity consumption, 1997 dummy 0.95 3.88
Non-wage income per capita
Services employment, industrial sector earnings, residential electricity price 0.86 4.37
Unemployment rate Manufacturing employment, 1990 dummy 0.79 14.88
Manufacturing employment
Gross state product per capita, industrial natural gas price, motor gas price, lagged manufacturing employment, 2001 dummy
0.76 4.28
Services employment Commercial electricity price, finance employment, 2001 dummy 0.97 4.99
Manufacturing earnings per employee
Industrial electricity price, industrial electricity consumption, lagged retail employment, utilities and transportation wage rate
0.89 1.97
Services earnings per employee
Lagged gross regional product, commercial electricity consumption 0.95 1.78

Evaluating the Impacts of State Energy Efficiency: Indianapolis Estimation and Simulation Results
Dependent variable Independent variables R2 MAPE
Industrial electricity consumption
Own price, lagged industrial natural gas price, lagged motor gas price, government employment, lagged manufacturing wage rate, lagged state utilities and transportation wage rate, lagged labor force participation rate
0.91 9.95
Commercial electricity consumption
Two-year lagged own price, commercial natural gas price, lagged government employment, retail wage rate, wholesale employment, annual cooling degree days
0.97 4.55
Residential electricity consumption
Own price, two-year lagged residential natural gas price, two-year lagged state finance employment, retail wage rate, lagged winter heating degree days, summer cooling degree days
0.98 2.50
Industrial natural gas consumption
Own price, motor gas price, industrial electricity price, manufacturing employment, utilities and transportation employment, lagged industrial sector employment
0.79 6.44
Commercial natural gas consumption
Own price, lagged commercial electricity price, state commercial natural gas consumption, finance employment, lagged utilities and transportation wage rate, annual heating degree days
0.92 2.92
Residential natural gas consumption
Own price, state residential natural gas consumption, lagged state residential electricity consumption, finance wage rate, retail employment, labor force participation rate
0.92 3.20
Gross regional product per capita
Lagged industrial electricity price, lagged motor gas price, lagged commercial electricity consumption, services employment, 1997 dummy
0.99 1.29
Non-wage income per capita
Lagged commercial electricity price, lagged motor gas price, government employment, lagged service employment
0.97 2.40
Unemployment rateCommercial electricity price, lagged motor gas price, construction employment, manufacturing employment, lagged commercial sector wage rate, 1990 dummy
0.86 11.76
Manufacturing employment
Lagged industrial electricity price, two-year lagged industrial electricity consumption, farming employment, state manufacturing employment, retail employment, 2001 dummy
0.78 3.96
Services employmentCommercial electricity price, commercial natural gas price, lagged commercial electricity consumption, lagged non-wage income per capita, 2001 dummy
0.99 4.00
Manufacturing earnings per employee
State industrial electricity consumption, motor gas consumption, lagged state retail employment, national GDP per capita, national unemployment rate
0.97 2.28
Services earnings per employee
Lagged motor gas price, lagged commercial electricity consumption, government employment, finance employment
0.97 1.63

Evaluating the Impacts of State Energy Efficiency: Simulation Results
Manufacturing employment (State)

Evaluating the Impacts of State Energy Efficiency: Simulation Results
Manufacturing employment (South Bend)

Evaluating the Impacts of State Energy Efficiency: Simulation Results
Manufacturing employment (Indianapolis)

Evaluating the Impacts of State Energy Efficiency: Simulation Results
Employment in services (State)

Evaluating the Impacts of State Energy Efficiency: Simulation Results
Employment in services (South Bend)

Evaluating the Impacts of State Energy Efficiency: Simulation Results
Employment in services (Indianapolis)

Evaluating the Impacts of State Energy Efficiency: Simulation Results
Residential electricity consumption (State)

Evaluating the Impacts of State Energy Efficiency: Simulation Results
Residential electricity consumption (South Bend)

Evaluating the Impacts of State Energy Efficiency: Simulation Results
Residential electricity consumption (Indianapolis)

• Policy analysis results with multi-equation models are derived via differencing a baseline forecast without the policy implemented, with a forecast in which the policy is present.
• The policy is translated into changes in the exogenous variables of the model.
• The policy that we address is the Indiana Utilities Regulatory Commission’s (IURC) Demand Side Management (DSM) ruling, passed in 2008, which requires all state jurisdictional electric utilities to achieve a two percent decrease in electricity use by 2019.
Evaluating the Impacts of State Energy Efficiency: Policy Analysis

• This policy is the only requirement for DSM in Indiana and has not been evaluated in a systematic way with respect to its impacts on the Indiana economy.
• It also serves as an example of how the econometric model can be utilized for policy analysis.
• We simulated the implementation of DSM by treating the electricity consumption variables as exogenous, setting the 2019 values two percent below the 2008 levels, and using a linear rate of decline between 2008 and 2019.
• The following charts compare selected elements of the baseline and policy forecasts, illustrating the percent impact of the policy.
Evaluating the Impacts of State Energy Efficiency: Policy Analysis

State impacts, percent difference versus the baseline forecast, 2019:
Evaluating the Impacts of State Energy Efficiency: Economic Impacts
Total em-ployment
Total earnings Total earnings per employee
GDP per capita Services employ-
ment
Manufacturing earnings per
employee
3.2%
5.9%
2.7%
8.5%
0.3%
2.0%

Percent difference in total employment versus the baseline, 2019:
Evaluating the Impacts of State Energy Efficiency: Economic Impacts Vary by Location
State South Bend Indianapolis
3.2%
9.1%
5.5%

Percent difference in total earnings per employee versus the baseline, 2019:
Evaluating the Impacts of State Energy Efficiency: Economic Impacts Vary by Location
State South Bend Indianapolis
2.7%
4.9%
6.7%

Percent difference in employment in services versus the baseline, 2019:
Evaluating the Impacts of State Energy Efficiency: Economic Impacts Vary by Location
State South Bend Indianapolis
0.3%
6.0%
7.8%

Evaluating the Impacts of State Energy Efficiency: Natural Gas Consumption Forecasts
State South Bend Indianapolis
11.5%
3.5%
23.5%Percent change in industrial natural gas consumption versus the baseline forecast, 2019
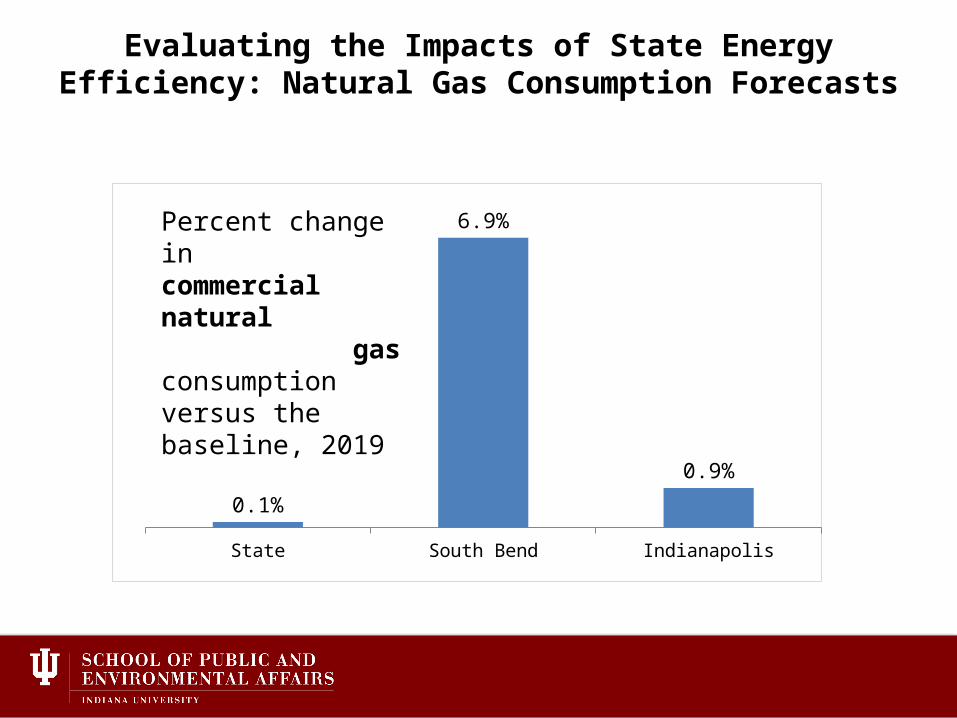
State South Bend Indianapolis
0.1%
6.9%
0.9%
Evaluating the Impacts of State Energy Efficiency: Natural Gas Consumption Forecasts
Percent change in commercial natural gas consumption versus the baseline, 2019

State South Bend Indianapolis
1.8%
4.1%
1.7%
Evaluating the Impacts of State Energy Efficiency: Natural Gas Consumption Forecasts
Percent change in residential natural gas consumption versus the baseline, 2019

Implementation of the IURC DSM order is projected to have a significant impact on the state economy by 2019, with varying magnitudes by region: • Total state employment is expected to rise by 107,000 (3.2%) as
compared to the baseline forecast. South Bend and Indianapolis are projected to gain 25,000 (9.1%) and 55,000 (5.5%) jobs, respectively.
• Earnings per employee are projected to rise by about $1,200 (2.7%). Gains of $2,500 (4.9%) and $3,900 (6.7%) are forecast for South Bend and Indianapolis.
• GDP per capita goes up $3,300 (8.5%), with an increase of $6,700 (20.7%) and $2,400 (5.2%) forecast for South Bend and Indianapolis.
Evaluating the Impacts of State Energy Efficiency: Economic Impact Results Summary

As for energy consumption, as compared to the baseline forecast:• The state is forecast to increase industrial, commercial, and
residential natural gas consumption by 11.5%, 0.1%, and 1.8%, respectively.
• Again, impacts in South Bend and Indianapolis vary in magnitude, with modest increases in the three natural gas end use sectors for South Bend (3.5%, 6.9%, and 4.1%). Indianapolis is projected to see small increases in commercial and residential natural gas consumption (0.9% and 1.7%) but a large increase in industrial natural gas consumption (23.5%).
Evaluating the Impacts of State Energy Efficiency: Energy Impact Results Summary

This research represents an advance in the ability to identify potential impacts of alternative energy policies by: • producing useable policy analysis results and thus serving as a
“proof of concept” for the econometric modeling approach,• disaggregating the potential impacts of critical policy
alternatives by economic sector, fuel type, and end use sector,• having the potential to inform public and private sector
decision-makers as to impacts on the state economy and specific industries, and
• assisting energy utilities in planning for the future. No other policy analysis framework provides such an extensive range of impact analysis results, nor are other policy analysis tools as customizable to specific state or local economies.
•
Evaluating the Impacts of State Energy Efficiency: Conclusions

Planned extensions/further research:
• addition of eight more sub-state, multi-county regions interacting with state-level model,
• linking the econometric model to MARKAL for addressing energy technology and more accurately portraying alternative policies as translated into exogenous policy variables,
• integrating GIS to incorporate land use and transportation impacts and feedback, and
• eventually extending to other state and subregions.
Evaluating the Impacts of State Energy Efficiency: Extensions

Limitations:
• the model is based on historical data and relationships, implying that forecasts are sensitive to structural shifts,
• this extensive a modeling effort requires significant resources to construct and test the model, and
• the accuracy of forecasts and policy analysis depends on the quality of state-level data.
Evaluating the Impacts of State Energy Efficiency: Limitations

We recently completed, in tandem with the Indiana Business Research Center, an analysis of a proposed coal gasification plant for a major Indiana utility using a previous version of our state model.
Evaluating the Impacts of State Energy Efficiency: Interesting Development