modeling the compressive stress–strain response of polymeric foams
TRANSCRIPT

Modeling the Compressive Stress–Strain Responseof Polymeric Foams
G. Spathis, E. Kontou
Department of Applied Mathematical and Physical Sciences, Section of Mechanics, National Technical Universityof Athens, 5 Heroes of Polytechnion, Athens GR-15773, Greece
Received 28 December 2009; accepted 1 December 2010DOI 10.1002/app.33848Published online 11 April 2011 in Wiley Online Library (wileyonlinelibrary.com).
ABSTRACT: The mechanical behavior of cellular materi-als appears to have, for both open and closed cells, similarcharacteristics. The compressive stress–strain diagram con-tains a nearly elastic regime; this leads to a limit load, fol-lowed by a plateau extending to a strain of about 50% onaverage. All of the main features of this curve are relatedto the material’s microstructure. In this study, taking intoaccount the complex deformation mechanisms occurringin a cellular material under external loading, we intro-duced a statistical micromechanics model. The geometryof our analysis was based on a previous study, where the
deformation of the individual struts was connected to themacroscopic deformation tensor. Assuming further thatdeformation was separated into elastic and viscoplasticparts and following a specific kinematic procedure, wesimulated the compressive stress–strain response, the ratedependence, and the loading–unloading behavior of poly-meric foam materials. VC 2011 Wiley Periodicals, Inc. J ApplPolym Sci 121: 3262–3268, 2011
Key words: compression; mechanical properties;microstructure; modeling
INTRODUCTION
Cellular solids may be distinguished as natural mate-rials, such as wood, cork, cancellous bone, sponge,and coral, or synthetic materials, such as metals, hon-eycombs, and foams. They can have either open cellfaces (open cells) connected with struts or they canbe covered by plates or membranes (closed cells).Synthetic cellular materials can be made from allmain material types, including metals, polymers,ceramics, paper, and carbon. Foams may appearwith a variety of densities, which are a few percent-age of the density of the base material.1 In all thesecases, a microstructure consisting of an intercon-nected network of cells with nearly straight edges isthe main characteristic. This specific microstructureis responsible for a variety of properties, such as ahigh bending stiffness, that have made metal foams acompetitive engineering material in recent years.2
Metallic foams used in sandwich panels between twodense solids lead to an increase in the moment ofinertia with a minimum increase in weight. Polymerand metal foams are useful in a large number of veryimportant applications, from daily life packaging ofmaterials to energy collection systems.
Basic information on cellular materials, includingtheir microstructure, density, and mechanical prop-erties, was given in a book by Gibbson and Ashby.3
Apart from this, many publications have dealt withthe manufacturing, design, properties, and applica-tions of these materials.4–6
With regard to the mechanical behavior of cellularmaterials, most foams, both open and closed cells,exhibit similar characteristics. In a compressivestress–strain diagram (Fig. 1), there is a nearly linearelastic regime (region I); this leads to a limit load,which is followed by a plateau (region II), whichextends to a strain of about 50% on average.7 There-after, a stiffening stress region manifests (region III).The initial region is related to the small bendingdeformation of the struts of the microstructure. Asthe compressive strain increases, there is a criticalvalue where a high number of individual struts,which are almost aligned with the loading axis,become unstable, buckle elastically or plastically,and exhibit the plateau region II. Upon higher val-ues of compressive strain, a large number of strutscome into contact, and this effect is expressed by thedensification region III. At this stage, the materialapproaches the intrinsic response of a solid-phasematerial. The load peak is considered to be relatedto the onset of the instability, which is initially local-ized, then diffused through the specimen, andrequires approximately the same stress value (pla-teau region).7 The material response becomes stableagain in the densification region.
Correspondence to: E. Kontou ([email protected]).
Journal of Applied Polymer Science, Vol. 121, 3262–3268 (2011)VC 2011 Wiley Periodicals, Inc.

A lot of micromechanical models have been devel-oped8–10 to describe the main features of the foam’smechanical response. To this trend, it was foundthat honeycombs exhibit a similar response tofoams;11,12 therefore, it was used as a model mate-rial. Moreover, the elastic/hyperelastic behavior ofcellular solids was examined in the studies reportedin refs. 1,13, and 14.
Given that the effective mechanical behavior ofsolid foams is controlled by the cell morphology,which links the macroscopic mechanical propertieswith the mesoscopic structural parameters, a homog-enization of the heterogeneous structure of the cellu-lar material is required. To analyze the response offoams, one needs to combine the beam theory withscaling laws, that is, to approximate an average cellby a simple beam model and calculate the materialproperties in terms of a homogenization procedure.3
It has been shown that this treatment is adequate forhoneycombs and open-cell foams but not for closed-cell ones.15 The multiphasic nature of these materialshas also been described by continuum models basedon the theory of porous media.16,17
On the other hand, foams based on polymers usu-ally exhibit large viscoelastic or viscoplastic deforma-tions when they are subjected to compression. Eachcell undergoes complex deformation mechanisms,which result in a nonlinear stress–strain behavior.15
To describe the aforementioned mechanical behav-ior of foams, special treatment is required for everydiscrete region. The elastic region and the onset ofinstability can be found from characteristic cell-typeanalysis, whereas the plateau region requires a finitesize model to be simulated.
Gong et al.1 emphasized that the modeling of thisresponse requires an analytical and accurate repre-sentation of the microstructure geometry and meas-urements and modeling of the constitutive behaviorof the base material. Following these requirements,Gong and coworkers1,18 developed a series of mod-els predicting the mechanical response of a set of
polyester urethane foams with various cell sizes anddensities.To this trend, the large strain response under the
complex loading conditions of foams was analyzed bytwo- and three-dimensional hyperelastic models.19
In this study, the compressive stress–strainresponse of polymeric foams was analyzed in theframe of viscoplasticity with the use of a statisticalmicromechanics model. This model deals with thedistributed orientations of the foam’s struts withrespect to the loading axis and introduces a relation-ship between the macroscopic stretch ratio and thestretch ratio of an individual strut. We took intoaccount the fact that after the initial elastic region, theobserved stress overshoot denoted the onset of strutbuckling and postbuckling, and the total deformationwas separated into an elastic and viscoplastic (inelas-tic) part in terms of a proper kinematic descrip-tion.20,21 The proposed model was proven to success-fully simulate the compressive stress–strain curves,the rate effect, and the hysteresis loop of polymericfoams, as studied experimentally elsewhere.1
MODEL OF STATISTICAL MICROMECHANICS
Hard af Segerstad et al.7 developed a model of anopen-cell flexible cellular solid consisting of a net-work of struts. As shown in Figure 2, each strut wasconnected to two vertex points that moved affinelyin the large deformation regime, and the strut wascharacterized by the vertex-to-vertex vectors r0i andri in the reference and current configurations, respec-tively, so that
Figure 1 Typical compressive stress–strain response of acellular solid.
Figure 2 Affine motion of the strut vertices in the large-strain (postbuckling) regime after Hard af Segerstad et al.Xi, Xi
0, ni0, ni0 are the position vectors of strut i at the initialand current configuration. X is the macroscopic deformationmap.
STRESS–STRAIN RESPONSE OF POLYMERIC FOAMS 3263
Journal of Applied Polymer Science DOI 10.1002/app
r0i ¼ r0iNi (1)
ri ¼ rini (2)
where Ni and ni are the material and spatial direc-tors of the strut, respectively, and kNik ¼ knik ¼ 1.
In region II, the strains are higher, and the strutsare driven in the postbuckling regime. It is assumed7
that the vertex motion is approximately affine. Fol-lowing these assumptions and to define an objectivemeasure of strut deformation, Hard af Segerstadet al. introduced the longitudinal stretch ratio of thei (ki) strut as follows:
ki ¼ rik k r0ik k�1¼ Ni�CNi
� �1=2(3)
where C ¼ FT�F is the macroscopic right Cauchy–Green deformation tensor, F is the deformation gra-dient tensor, FT is the transposed tensor.
With the reasonable assumption that there is atwo-dimensional problem in the case of isotropicfoam, the analytical expression for ki, by eq. (3), isgiven by
ki ¼ k21 cos2 hþ k22 sin
2 h� �1=2
(4)
where y is the angle between the loading axis andvector r0 and k1 and k2 are the macroscopic principalstretch ratios in the longitudinal and lateral direc-tions, respectively.
In our analysis, starting from an individual strut,we assumed that in the undeformed state, all strutsare randomly distributed and formed an initially iso-tropic material. When the compressive load isapplied, the elastic bending of the struts is initiated,especially for the group of struts that form low val-ues of y; this results in the initial elastic slope(region I) of the stress–strain curve. As loading pro-
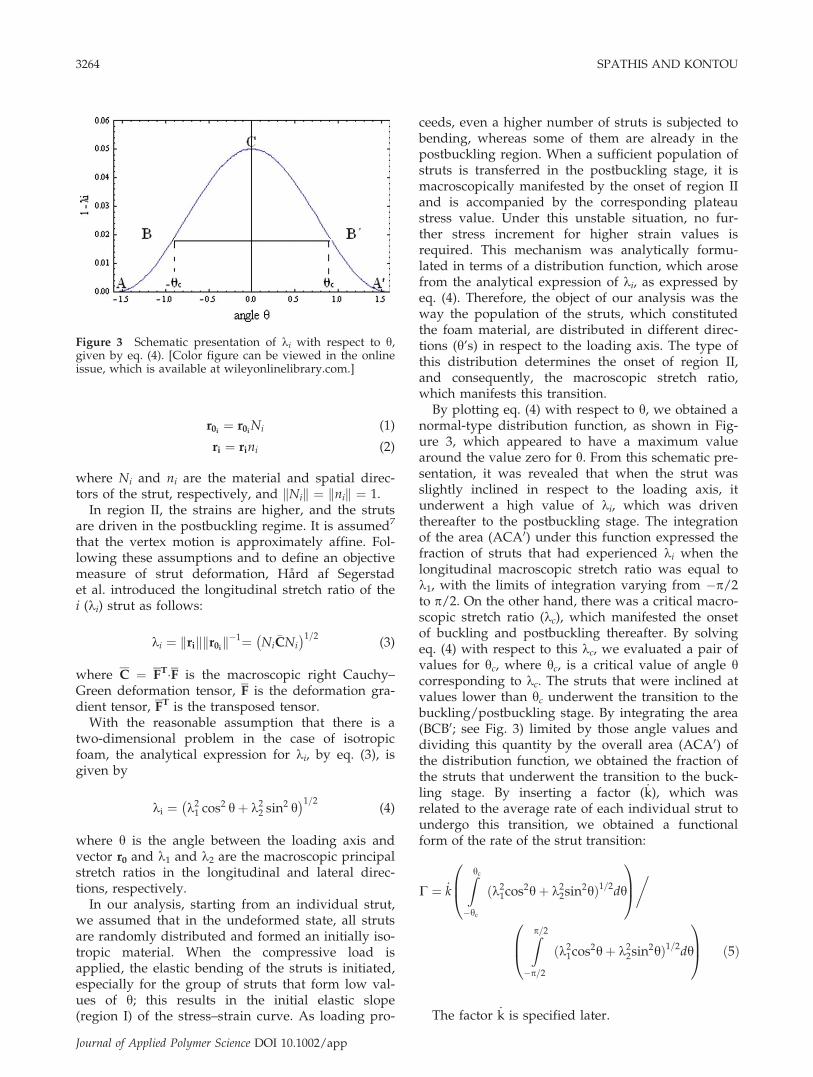
ceeds, even a higher number of struts is subjected tobending, whereas some of them are already in thepostbuckling region. When a sufficient population ofstruts is transferred in the postbuckling stage, it ismacroscopically manifested by the onset of region IIand is accompanied by the corresponding plateaustress value. Under this unstable situation, no fur-ther stress increment for higher strain values isrequired. This mechanism was analytically formu-lated in terms of a distribution function, which arosefrom the analytical expression of ki, as expressed byeq. (4). Therefore, the object of our analysis was theway the population of the struts, which constitutedthe foam material, are distributed in different direc-tions (y’s) in respect to the loading axis. The type ofthis distribution determines the onset of region II,and consequently, the macroscopic stretch ratio,which manifests this transition.By plotting eq. (4) with respect to y, we obtained a
normal-type distribution function, as shown in Fig-ure 3, which appeared to have a maximum valuearound the value zero for y. From this schematic pre-sentation, it was revealed that when the strut wasslightly inclined in respect to the loading axis, itunderwent a high value of ki, which was driventhereafter to the postbuckling stage. The integrationof the area (ACA0) under this function expressed thefraction of struts that had experienced ki when thelongitudinal macroscopic stretch ratio was equal tok1, with the limits of integration varying from �p/2to p/2. On the other hand, there was a critical macro-scopic stretch ratio (kc), which manifested the onsetof buckling and postbuckling thereafter. By solvingeq. (4) with respect to this kc, we evaluated a pair ofvalues for yc, where hc, is a critical value of angle hcorresponding to kc. The struts that were inclined atvalues lower than yc underwent the transition to thebuckling/postbuckling stage. By integrating the area(BCB0; see Fig. 3) limited by those angle values anddividing this quantity by the overall area (ACA0) ofthe distribution function, we obtained the fraction ofthe struts that underwent the transition to the buck-ling stage. By inserting a factor ( _k), which wasrelated to the average rate of each individual strut toundergo this transition, we obtained a functionalform of the rate of the strut transition:
C ¼ _k
Zhc�hc
ðk21cos2hþ k22sin2hÞ1=2dh
0B@
1CA�
Zp=2�p=2
ðk21cos2hþ k22sin2hÞ1=2dh
0B@
1CA ð5Þ
The factor _k is specified later.
Figure 3 Schematic presentation of ki with respect to y,given by eq. (4). [Color figure can be viewed in the onlineissue, which is available at wileyonlinelibrary.com.]
3264 SPATHIS AND KONTOU
Journal of Applied Polymer Science DOI 10.1002/app
KINEMATIC DESCRIPTION
According to the aforementioned mechanicalresponse of the foams, it was reasonable to assumethat the strain developed in the polymeric foammaterial could be separated into a viscoplastic (orinelastic) part, which corresponded to the bucklingand postbuckling conditions, and an elastic part,which was related to the effective or driven stress.This separation was treated in a way similar to thatin plasticity, where the kinematic formulation intro-duced by Rubin21 was implemented. The represen-tative volume element under consideration wasfoam material containing a large number of cells,and its orientation and elastic deformation wasdefined by a triad of vectors (mi). The time evolu-tion _mi of the vectors mi was expressed by _mi ¼Lmmi, where Lm is the elastic velocity gradient ten-sor, and Lm ¼ L � Lp, where L is the velocity gra-dient tensor and Lp is the plastic velocity gradienttensor and is decomposed into a symmetric part(Dp) and an antisymmetric part (Wp) as follows: Lp
¼ Dp þ Wp. For physically meaningful constitutiveequations for Dp and Wp, the inequality T0�Dp > 0had to be satisfied, where T0 is the deviatoric stresstensor. The details of this theory are presented in ref.According to Rubin, in the case of uniaxial stress, thetime derivatives ( _a, _b, c) of the principal stretch ratios(a, b, and c) of a material line element for a plasticallyorthotropic material are given by
_a
a¼
_jm3jm
þD011;
_b
b¼
_jm3jm
þD022;
_c
c¼
_jm3jm
þD033 (6)
where jm is the elastic dilatation expressed by
p ¼ K1
jm� 1
� �(7)
_jm is its time derivative, K is the bulk modulus andp is the hydrostatic pressure. In the case of the uni-axial stress (T11), jm is given by
jm ¼ 3K
T11 � 3K(8)
where D0ij are the components of the deviatoric sym-
metric part (D) of the total velocity gradient tensor,which after Rubin are given by the following equations:
D011 ¼
_amam
þ C18
T11
lJ�1m
½4b11a6m þ ðb22 þ b33Þ� (9a)
D022 ¼ � 1
2
_amam
þ C18
T11
lJ�1m
½2b11a6m þ ð2b22 � b33Þ� (9b)
D033 ¼ � 1
2
_amam
þ C18
T11
lJ�1m
½2b11a6m þ ð�b22 þ 2b33Þ� (9c)
where l is the shear modulus, am is the elasticstretch ratio, _am its time derivative, C is a nonnega-tive function that needs to be specified, and bij arenonnegative constants, which in the case of elasti-cally isotropic material are taken as equal to unity.When eqs. (6), (8), and (9a) are combined, the rate
evolution of am is of the form:
_amam
¼ _a
aþ _am2lð1þ mÞ3½am2lð1þ mÞ � 3K�
� C12
T11
lJ�1m
� �ð4b11a6m þ b22 þ b33Þ ð10Þ
where a is the longitudinal stretch ratio, m is thePoisson ratio, and _a is the imposed strain rate. Thequantity C is considered to define the rate of transi-tion in the buckling state. When the plateau regionis initiated, the effect that is subsequent to the stresspeak ( _am) is taken to be zero, and am is equal to kc,where kc is the critical stretch ratio relative to theonset of postbuckling. With this specific conditionapplied to eq. (10), and after some obvious approxi-mations, because of the fact that am is close to unity,eq. (10) leads to an expression of a critical rate (Cc)as follows:
Cc ¼_a
aðkc � 1Þ or Cc ¼_a
k1ðkc � 1Þ (11)
where a has been replaced with the symbol k1 forreasons of uniformity.Considering that at this critical point, C ¼ Cc, the
value of factor _k of eq. (5) can be calculated andbecause the distribution function is symmetric, wehave
_k ¼ Cc (12)
Combining eqs. (5), (11), and (12), we obtain
C ¼ _ak1ðkc � 1Þ
Zhc�hc
ðk21 cos2 hþ k22 sin2 hÞ1=2dh
0B@
1CA,
Zp=2�p=2
ðk21 cos2 hþ k22 sin2 hÞ1=2dh
0B@
1CA ð13Þ
Equation (13) expresses the rate of strut transitionto the buckling stage, where _a is the imposed strainrate and k1 and k2 are the macroscopic longitudinaland transverse stretch ratios, respectively.
STRESS–STRAIN RESPONSE OF POLYMERIC FOAMS 3265
Journal of Applied Polymer Science DOI 10.1002/app

APPLICATION OF THE PROPOSED MODEL TOTHE COMPRESSIVE BEHAVIOR OF
POLYMERIC FOAMS
Compressive stress–strain behavior
The proposed analysis was validated by a simula-tion of the experimental results of the study byGong et al.1 The foams analyzed in their study werebased on ester resin, diisocyanate, water, catalysts,and surfactants, and the geometric and material pa-rameters are discussed in detail in ref. 1. Compres-sive tests were performed, and it was found that themechanical properties of the foam polymers studieddepended on the rate of loading, which meant thatthey exhibited a viscoelastic response. In Figure 4,the representative experimental results of the risedirection response from the study by Gong et al. arepresented for a foam of a specific nominal cell size[3 pores per inch (ppi)] at four distinct displacementrates _di/H1, which varied from 7.5 � 10�2 to 7.5 �10�5 s�1. With increasing strain rate, the initial mod-ulus stiffened, the maximum stress increased, too,and the whole curve moved to higher values ofstress level.
To simulate the experimental data, apart from theelastic constants values, that is, l and m, the experi-mental strain rate _a and kc were incorporated intoeqs. (10) and (13). m was taken to be equal to 0.5 forthe strain range examined, according to the experi-mental data of Widdle et al.22 am could then be eval-uated at every stage of deformation through integra-tion of eq. (10). The integration of eq. (10) was madenumerically with small time steps with the softwareMathematica23 until a high convergence wasachieved.
From the performed integrations, we found thatthe variation of am with respect to the total strainwas of the form of the compressive stress–strain
curve. Therefore, by simply multiplying it by theYoung’s modulus of the material (taken from the ini-tial slope of the stress–strain curve), we obtained thesimulated compressive stress–strain curve.More specifically, the experimental results were
simulated as follows: the stress–strain curve of thelower strain rate of 7.5 � 10�5 s�1 was modeled bythe aforementioned procedure. The model parame-ters required were the initial slope of the stress–strain curve, which was the foam material’s modu-lus (E) equal to 125 kPa and kc, given by the experi-mental data, equal to 0.954. To obtain the part of thedensification region III, which is presented in the ex-perimental results, an ideal elastomer’s constitutiveequation was applied. This was a reasonableassumption because at this stage of deformation, theelastomeric features of the foam material were mani-fested. Therefore, the response at this region wassimulated with an extra stress term (rh), which wasgiven by24
rh ¼ Cr k1 �1
ðk1Þ2 !
(14)
where Cr is a hardening modulus equal to 0.5 kPa.To obtain the stress–strain data for all of the strainrates examined, a scaling rule, valid in viscoelastic-ity, was applied. According to this rule, proposed byMatsuoka,25 a stress–strain curve obtained at therate r1 could be predicted from an experimentalstress–strain curve at a rate r by the multiplicationof the stress and strain values by the scaling factor[(r1/r)
n] and [(r1/r)m] for the stress and strain,
respectively. In this way, all of the stress–straincurves for the four strain rates were simulated, withrespect to that at 7.5 � 10�5 s�1. The parameters mand n were fitted to be equal to 0.04. The simulatedcompressive stress–strain results are shown in
Figure 4 Compressive stress–strain data of a poly(esterurethane) foam (3 ppi) at various strain rates _di/H1 afterGong et al.1
Figure 5 Model simulations of the experimental resultsof Figure 4. [Color figure can be viewed in the onlineissue, which is available at wileyonlinelibrary.com.]
3266 SPATHIS AND KONTOU
Journal of Applied Polymer Science DOI 10.1002/app

Figure 5, and a very good agreement with the exper-imental data shown in Figure 4 was obtained.
Compressive loading–unloading behavior
In the study by Gong et al.,1 the loading–unloadingresponse of the foam materials was studied and ispresented in Figure 6. The stress–strain data of thefirst cycle are shown in this figure; they exhibited anonlinear unloading curve, with a small value of re-sidual strain. The stress during unloading was sim-ply the reversed stress–strain behavior of the foammaterial, which was a tensile mode of deformation,which started from the densified stage, where thefoam material was depressed approximately at astrain of 50%. The calculation of this stress was per-formed as discussed in the first paragraph of thissection and with a now lower value of Young’smodulus (because of the different behavior of thedensified material), which was fitted equal to 12KPa. To simulate the unloading behavior, we alsotook into account the fact that all of the struts werein the buckling (or postbuckling) condition. There-fore, the distribution density function had to bemodified accordingly. kc was now defined as theposition where the majority of struts were recover-ing, and this effect took place at a value approxi-mately equal to 1 � kc.
The model simulations of the experimental data ofFigure 6 are presented in Figure 7 and exhibited asatisfactory agreement between the experiment andthe model simulations.
CONCLUSIONS
In this study, a statistical micromechanics model fordescribing the compressive stress–strain response ofthe cellular materials was examined. The model was
based on the expression of the stretch ratio of anindividual strut with respect to the macroscopic lon-gitudinal stretch ratio and the angle between theloading axis and the axis of the strut itself. Aftersome reasonable assumptions, this expression wastransformed to a probability density function withrespect to the macroscopic strain. Hence, a func-tional form of the rate of strut transition from theelastic region to the buckling stage was defined. Thisrate will be treated hereafter as the rate of inelasticstrain formation in a way similar to plasticity orinelasticity. Applying a specific kinematic formula-tion, we achieved the constitutive description of thefoam material.The proposed analysis was proven to successfully
describe the compressive stress–strain response ofthe polymeric foams, the exhibited rate dependence,and the loading–unloading stress–strain response.
References
1. Gong, L.; Kyriakides, S.; Jang, W.-Y. Int J Solid Struct 2005, 42,1355.
2. Tekoglu, C.; Onck, P. R. J Mater Sci 2005, 40, 5911.3. Gibson, L. J.; Ashby, M. F. Cellular Solids: Structure and Prop-
erties, 2nd ed.; Cambridge University Press: Cambridge, Eng-land, 1997.
4. Weaire, D.; Hutzler, S. The Physics of Foams; Oxford Univer-sity Press: Oxford, 1999.
5. Gibbson, L. J. Cell Solids MRS Bull 2003, 28(4), 270.6. Ashby, M. F.; Evans, A.; Fleck, N. A.; Gibson, L. J.; Hutchin-
son, J. W.; Wadley, H. N. G. Metal Foams: A Design Guide;Butterworth-Heinemann: Woburn, MA, 2000.
7. Hard af Segerstad, P.; Larsson, R.; Toll, S. Int J Plast 2008, 24,896.
8. Gent, A. N.; Thomas, A. G. Rubber Chem Technol 1963, 36,597.
9. Gibson, L. J.; Ashby, M. F.; Schajer, G. S.; Robertson, C. I. ProcR Soc London Sect A 1982, 382, 25.
10. Choi, J. B.; Lakes, R. S. Int J Mech Sci 1995, 37, 51.11. Zhu, H. X.; Knott, J. F.; Mills, N. J. J Mech Phys Solids 1997,
45, 319.
Figure 7 Model simulations of the experimental data ofFigure 6. [Color figure can be viewed in the online issue,which is available at wileyonlinelibrary.com.]
Figure 6 Compressive loading–unloading stress–strainresponse of a poly(ester urethane) foam (3 ppi) after Gonget al.1
STRESS–STRAIN RESPONSE OF POLYMERIC FOAMS 3267
Journal of Applied Polymer Science DOI 10.1002/app

12. Patel, M. R.; Finnie, I. J Mater 1970, 5, 909.13. Li, K.; Gao, X.-L.; Roy, A. K. Compos Sci Tech 2003, 63, 1769.14. Li, K.; Gao, X.-L.; Roy, A. K. Compos B 2004, 36, 249.15. Ehlers, W.; Markert, B. Int J Plast 2003, 19, 961.16. Bowen, R. Int J Eng Sci 1982, 20, 697.17. Larsson, J.; Larsson, R. Comp Methods Appl Mech Eng 2002,
191, 3885.18. Gong, L.; Kyriakides, S. Int J Solids Struct 2005, 42, 1381.19. Deminary, S.; Becker, W.; Hohe, J. Mech Mater 2006, 38, 985.
20. Spathis, G.; Kontou, E. J Appl Polym Sci 2001, 79, 2534.21. Rubin, M. B. Int J Solids Struct 1994, 31, 2653.22. Widdle, R. D., Jr.; Bajaj, A. K.; Davies, P. Int J Eng Sci 2008, 46, 31.23. Wolfram, S. Mathematica: A System for Doing Mathematics
by Computer, 4th ed.; Addison-Wesley: New York, 1999.24. Treloar, L. R. G. The Physics of Rubber Elasticity, 3rd ed.;
Clarendon: Oxford, 1975.25. Matsuoka, S. Relaxation Phenomena in Polymers, 2nd ed.;
Hanser: New York, 1992; Chapter 3.
3268 SPATHIS AND KONTOU
Journal of Applied Polymer Science DOI 10.1002/app