modeling puget sound’s circulation and its variability ocean 520 seminar december 11, 2002...
Post on 19-Dec-2015
214 views
TRANSCRIPT

Modeling Puget Sound’s Circulation and its Variability
Ocean 520 SeminarDecember 11, 2002
Mitsuhiro KawaseSchool of Oceanography, University of Washington

• A Modeling Partnership for Puget Sound
• Puget Sound Circulation Model: Status– Tidal Currents and Mixing– Exchange Circulation– Seasonal Cycle
• Interannual Variability in Puget Sound

Modeling Efforts in Puget Sound
Whole Sound(UW-PRISM/KC-DNR)
Dyes/Sinclair Inlet(PSNS)
South Sound (WA-DOE)
Duwamish Estuary/Elliott Bay(KC-DNR)

A Partnership for Modeling the Marine Environment of Puget Sound
University of Washington School of OceanographyUniversity of Washington College of EducationKing County Department of Natural Resources
Ocean Inquiry ProjectU.S. Naval Shipyard, Bremerton
Washington State Department of Ecology
FY 2002-2007, $4,454,000

Partnership Objectives
•Develop, maintain and operate a system of simulation models of Puget Sound’s circulation and ecosystem, a data management system for oceanographic data and model results, and an effective delivery interface for the model results and observational data for research, education and policy formulation. •Develop fundamental understanding of the Sound’s working, and address questions raised by the regional community concerning management of the Sound and its resources.

Inlet-Scale Integrated Modeling System for Sinclair and Dyes Inlet Watershed (Puget Sound Naval Shipyard, Bremerton)
Demonstration of fecal coliform transport in Sinclair and Dyes Inlets using CH3D-FC
Watershed Model (HSPF) Receiving Water Model (CH3D/WASP)

QuickTime™ and aYUV420 codec decompressorare needed to see this picture.
South Puget Sound Model Nutrient Study (SPASM)(Washington Department of Ecology)
•Three-dimensional circulation model coupled to a water quality/sediment model (EFDC)
•Modeling of circulation, T, S, biologican oxygen demand

Hydrodynamic and Fate and Transport Numerical Model for the Duwamish River and Elliott Bay(King County DNR)
•EFDC model
•Circulation, temperature, salinity, sediments, contaminant transport (metals, organics)
•For assessing impact of combined sewage outflow (CSO) into Duwamish River estuary

UW-PRISM Puget Sound Circulation Model
• Based on Princeton Ocean Model (POM, Blumberg and Mellor, 1987)
• Circulation, temperature, salinity, turbulent mixing (aquatic biogeochemistry and sediment in the future)
• Fine (360mx540m) and coarse (600mx900m) resolution versions• One-year integration for 2000• Tidal forcing at external boundaries in Strait of Juan de Fuca• River input from USGS gauge data• Atmospheric forcing: Observations at UW Atmospheric Sciences
Building (single point applied to the whole basin)• T and S external boundary condition from JEMS data set (quasi-
monthly sampling of three stations along N-S section from San Juan Island to Sequim)

Tidal Currents
•Admiralty Inlet
•Triple Junction
•Tacoma Narrows
Animations by Christian Sarason, OIP

Strong currents at the sills generate vigorous turbulent mixing
• High mixing rates in Admiralty Inlet, Tacoma Narrows and Hood Canal sill region
• Elevated mixing along boundaries and heads of inlets
• Weak mixing in basin interiors

Exchange Circulation
•Point Edwards
•Possession Sound

(cm/s)
Model
Average Along-channel Flow at Point Edwards, June 28- July 27, 2000
Slanted level ofNo motion
Inflow intensified on the Kitsap side
Outflow core on the east side
(cm/s)
Observed
Inflow core at the bottom

Average Along-channel Flow in Possession Sound, November 25 - December 24, 2000
Model
(cm/s)
Observed
(cm/s)Three layer flow
Outflow intensified on Whidbey side
Inflow intensified on Snohomish side

Seasonal Cycle
Saratoga Passage(WA-DOE SAR 003)
Point Jefferson(KC-DNR KSBP01)

Temperature and Salinity at 100m, off Point Jefferson
Temperature at 100m, Point Jefferson (KSBP01)
6
7
8
9
10
11
12
13
14
1/1 1/31 3/2 4/2 5/2 6/2 7/2 8/2 9/1 10/1 11/1 12/1 1/1
Yearday
Temperature (degrees C)
Data Fourier fit (7 components)

2000 Temperature at Point Jefferson, Model-Data Comparison
Tem
per a
ture
(C
)

2000 Salinity at Point Jefferson, Model-Data Comparison
Sal
inity
(P
SU
)
Initialization problem
Model missed a fresh event!

2000 Temperature in Saratoga Passage, Model - Data Comparison
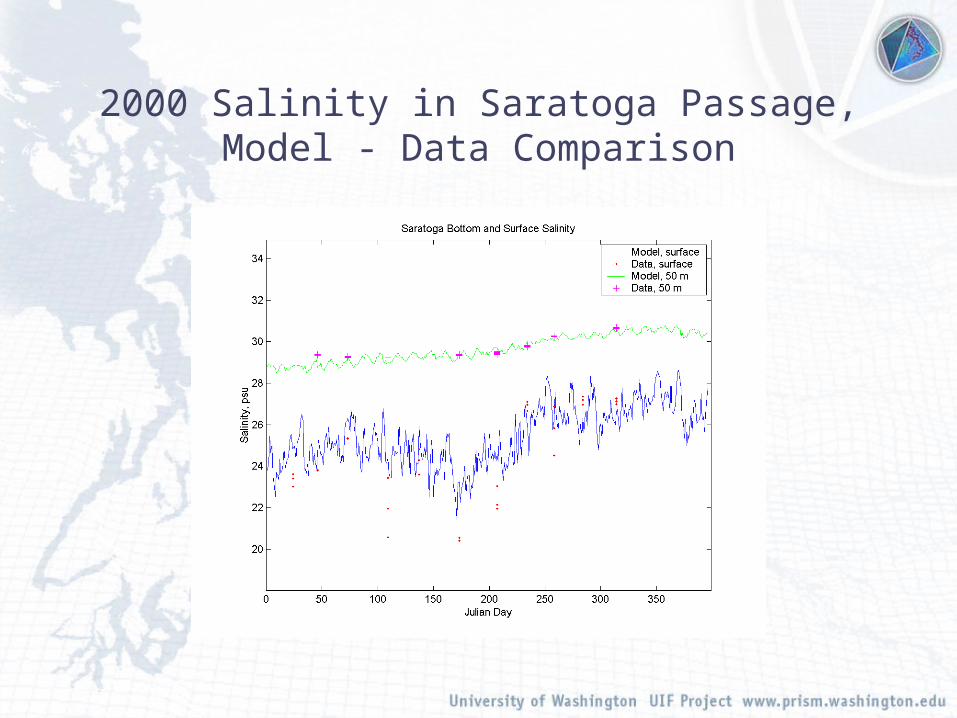
2000 Salinity in Saratoga Passage, Model - Data Comparison
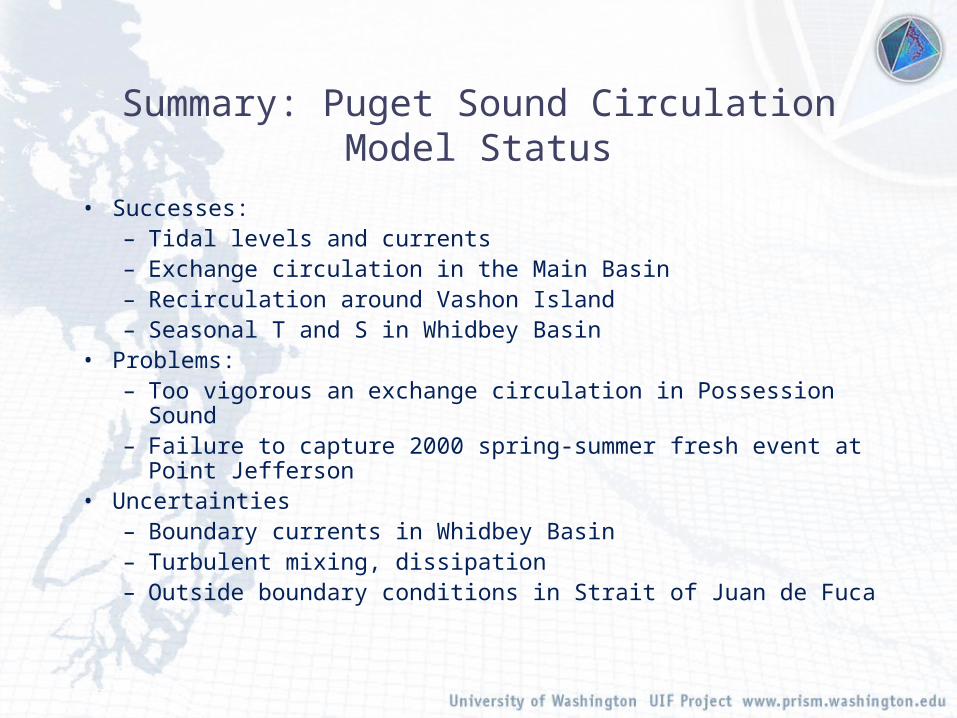
Summary: Puget Sound Circulation Model Status
• Successes:– Tidal levels and currents– Exchange circulation in the Main Basin– Recirculation around Vashon Island– Seasonal T and S in Whidbey Basin
• Problems:– Too vigorous an exchange circulation in Possession Sound– Failure to capture 2000 spring-summer fresh event at Point
Jefferson• Uncertainties
– Boundary currents in Whidbey Basin– Turbulent mixing, dissipation– Outside boundary conditions in Strait of Juan de Fuca

Interannual Variability
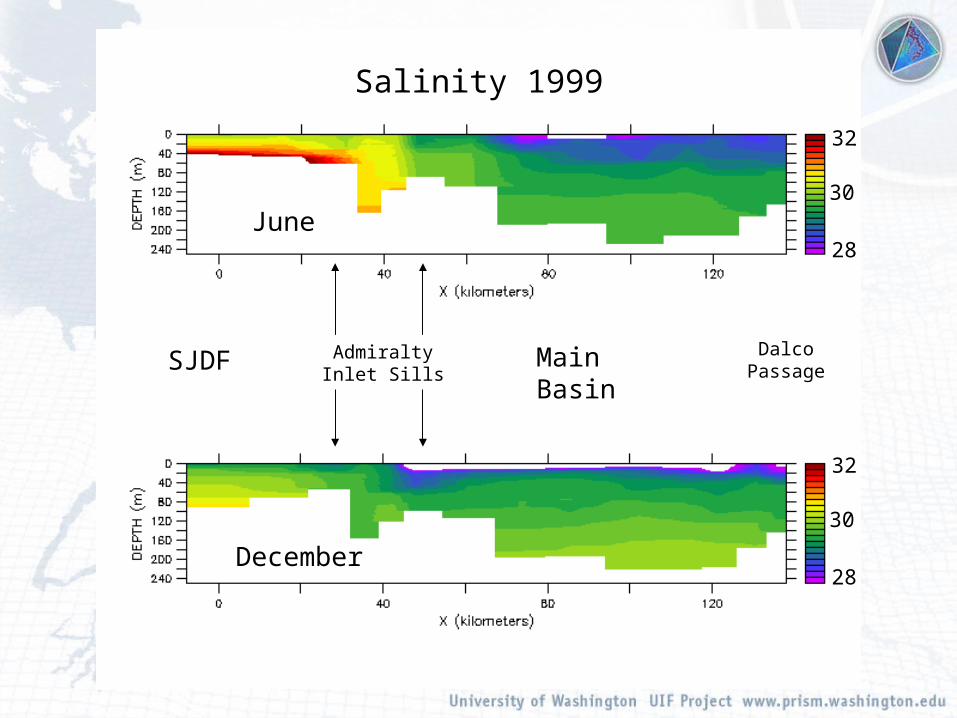
Salinity 1999
June
December
Admiralty Inlet Sills
SJDF Dalco Passage
Main Basin
30
32
28
30
32
28
30
32
28

Salinity 2000
June
December
Admiralty Inlet Sills
SJDF Dalco Passage
Main Basin
30
32
28
30
32
28

Salinity Anomaly, Puget Sound Main Basin at 100m
-1
-0.8
-0.6
-0.4
-0.2
0
0.2
0.4
0.6
0.8
1
J-51
J-52
J-53
J-54
J-55
J-56
J-57
J-58
J-59
J-60
J-61
J-62
J-63
J-64
J-65
J-66
J-67
J-68
J-69
J-70
J-71
J-72
J-73
J-74
J-75
J-76
J-77
J-78
Date
Salinity Anomaly (permil)
Point No Point 100m Point Jefferson 100m Possession Point 100m

5000
10000
15000
20000
25000
-0.6 -0.4 -0.2 0 0.2 0.4 0.6
Salinity Anomaly (6 month averages)
Skagit River Discharge (6 month averages) R=0.6 (36% of variance)

Salinity and Potential Density in Central Puget Sound, 1990 - 1998(Blue: 100m Red: 200m)
28.5
29
29.5
30
30.5
31
Jan-89 Jan-90 Jan-91 Jan-92 Jan-93 Jan-94 Jan-95 Jan-96 Jan-97 Jan-98 Jan-99 Jan-00
Date
Salinity (PSU)
22
22.5
23
23.5
24
Jan-89 Jan-90 Jan-91 Jan-92 Jan-93 Jan-94 Jan-95 Jan-96 Jan-97 Jan-98 Jan-99 Jan-00
Date
Potential density (sigma theta)
1997 (ENSO): Year of no density intrusion

-1.5
-1
-0.5
0
0.5
1
1.5
Jan-51 Jan-52 Jan-53 Jan-54 Jan-55 Jan-56 Jan-57 Jan-58 Jan-59 Jan-60 Jan-61 Jan-62
Date
Temperature Anomaly (C)
Point No Point 100m Point Jefferson 100m Possession Sound 100m
-3
-2.5
-2
-1.5
-1
-0.5
0
0.5
1
1.5
Jan-51
Jan-52
Jan-53
Jan-54
Jan-55
Jan-56
Jan-57
Jan-58
Jan-59
Jan-60
Jan-61
Jan-62
Date
Pacific Decadal Oscillation Index
R=0.57 (33% of variance)
Temperature Anomaly in Puget Sound and Pacific Decadal Oscillation
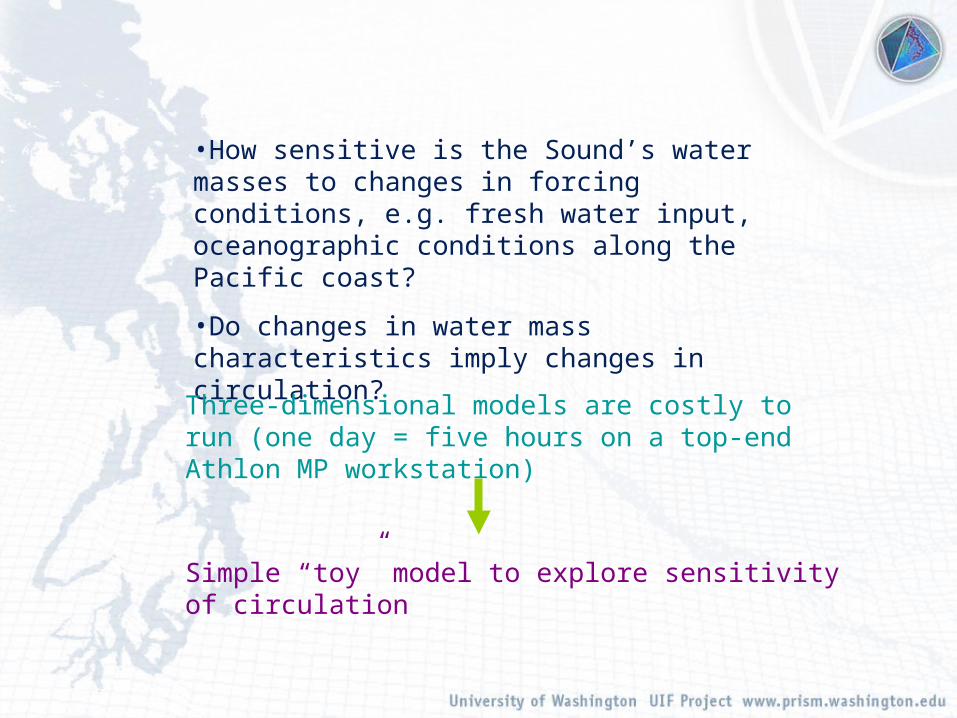
•How sensitive is the Sound’s water masses to changes in forcing conditions, e.g. fresh water input, oceanographic conditions along the Pacific coast?
•Do changes in water mass characteristics imply changes in circulation?
Three-dimensional models are costly to run (one day = five hours on a top-end Athlon MP workstation)
Simple “toy” model to explore sensitivity of circulation

A Simple Box Model of Seasonal and Interannual Variability in Puget Sound Circulaiton
Amanda Babson, M.S. Thesis 2002
• Twelve-box model based on an efflux-reflux model of Cokelet et al. (1990) and the dynamics of a simple box model of Georgia Basin - Strait of Juan de Fuca by Li et al. (1999)
• Conserves volume and salinity• Forcing from river discharge and external (SJDF) salinity• Deep inflow proportional to density difference between basins
(Stommel, 1961)• Mixing with a stratification-dependent cutoff• Model calibrated to mean annual forcing/conditions using WA-
DOE data, then run in a prognostic mode with climatological seasonal cycle/interannual forcing for 1992-1999

Whidbey
S. Hood
Canal
Strait of Juan de Fuca
N. Hood
Canal
AdmiraltyInlet
Main Basin
South Sound
VerticalMixing
Rivers
Advection
Model Schematic

The Model has significant hindcast skills at interannual timescales
r2composite seasonal
interannual mean interannual wrong order
S.Sound surface 0.2212 0.7333 0.3516S.Sound deep 0.4 0.678 0.3583Main surface 0.1673 0.6235 0.3256Main deep 0.4339 0.7879 0.4499Admiralty surface 0.3766 0.4385 0.2858Admiralty deep 0.335 0.2942 0.2556N.Hood surface 0.1462 0.5952 0.1849N.Hood deep 0.2817 0.4489 0.2318S.Hood surface 0.0857 0.3963 0.2365S.Hood deep 0.373 0.2915 0.0844Whidbey surface 0.2364 0.5392 0.1801Whidbey deep 0.2569 0.3888 0.2949

92 93 94 95 96 97 98 9924
26
28
30
32
Main Basin
Salinity (PSU)
92 93 94 95 96 97 98 99
20
25
30
Whidbey Basin
Salinity (PSU)
Note different scale
92 93 94 95 96 97 98 9924
26
28
30
32
N. Hood Canal
Salinity (PSU)
Sa
linity
(P
SU
)
Year
Observed and Simulated Surface and Deep Salinity in Three Basins, 1992-1999

92 93 94 95 96 97 98 990
500
1000
1500
2000
Volume Transport (m
3 s-1)
River flow into Whidbey
92 93 94 95 96 97 98 99-1.5
-1
-0.5
0
0.5
1
1.5x 10
4
Volume Transport (m
3 s-1)
Admiralty into Main deepAdmiralty into Whidbey deepAdmiralty into N.Hood Canal deep
Vol
ume
Tra
nspo
rt (
cubi
c m
eter
s pe
r se
cond
)
Year
River Inflow into Whidbey Basin and Inflow into Three Deep Boxes, 1992-1999

92 93 94 95 96 97 98 99
-1
0
1
x 104 Deep transport from Admiralty to Main: Interannual forcing run minus composite forcing run
92 93 94 95 96 97 98 99
-1
0
1
x 104
Transport difference (m
3 s-1) Interannaul SJF salinity forcing run minus composite forcing run
92 93 94 95 96 97 98 99
-1
0
1
x 104 Interannual river forcing run minus composite forcing run
Sensitivity of Deep Inflow to Variations in River Discharge and External Salinity
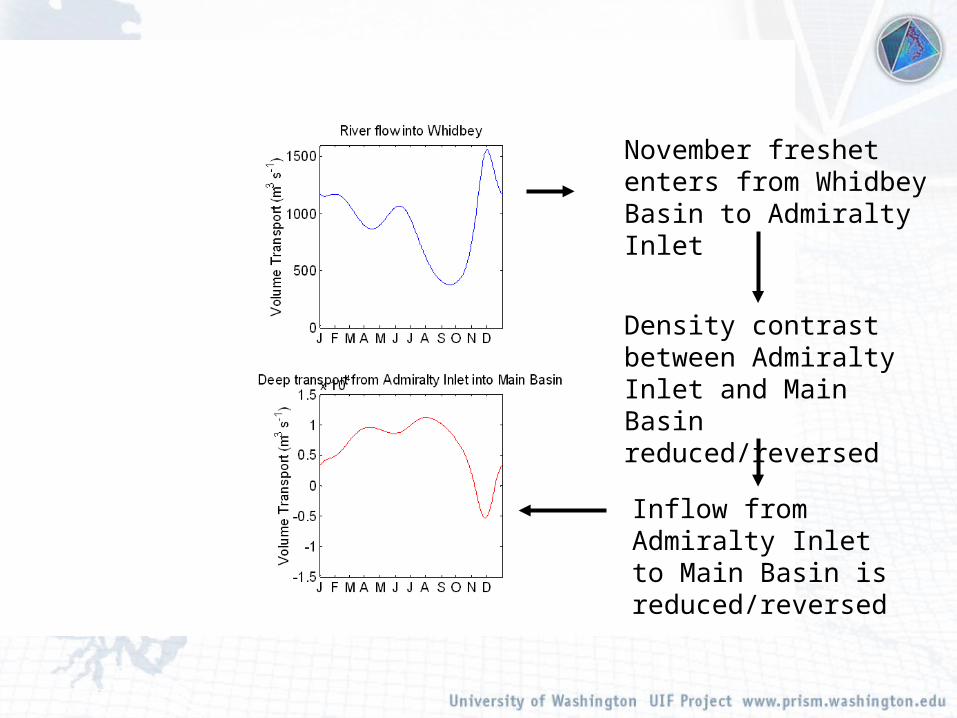
November freshet enters from Whidbey Basin to Admiralty Inlet
Density contrast between Admiralty Inlet and Main Basin reduced/reversed
Inflow from Admiralty Inlet to Main Basin is reduced/reversed

Summary• A simple predictive box model of Puget Sound circulation with
river and external salinity forcing has been constructed. The model can reproduce seasonal cycle of salinity variation, and is demonstrated to have hindcast skills at interannual timescales.
• Variability in river inflow modulates the exchange circulation significantly at intraseasonal timescales. Interannual variability of salinity appears to result from year-to-year variability of high discharge events.
• Increased discharge from the Skagit River in late Fall enters the Admiralty Inlet relatively undiluted, where it encounters strong mixing. The resultant freshening of the inflow layer causes the deep inflow into the Main Basin to halt temporarily and even reverse. The inflow however recovers within two months.