modeling olivine cpo evolution with complex … article 10.1002/2015gc005964 modeling olivine cpo...
TRANSCRIPT

RESEARCH ARTICLE10.1002/2015GC005964
Modeling olivine CPO evolution with complex deformationhistories: Implications for the interpretation of seismicanisotropy in the mantleYuval Boneh1, Luiz F. G. Morales2, Edouard Kaminski3, and Philip Skemer1
1Department of Earth and Planetary Sciences, Washington University in St. Louis, Saint Louis, Missouri, USA,2GFZ German Research Centre for Geosciences, Potsdam, Germany, 3Institut de Physique du Globe de Paris,Sorbonne Paris Cit�e, Universit�e Paris Diderot, CNRS, Paris, France
Abstract Relating seismic anisotropy to mantle flow requires detailed understanding of the develop-ment and evolution of olivine crystallographic preferred orientation (CPO). Recent experimental and fieldstudies have shown that olivine CPO evolution depends strongly on the integrated deformation history,which may lead to differences in how the corresponding seismic anisotropy should be interpreted. In thisstudy, two widely used numerical models for CPO evolution—D-Rex and VPSC—are evaluated to furtherexamine the effect of deformation history on olivine texture and seismic anisotropy. Building on previousexperimental work, models are initiated with several different CPOs to simulate unique deformation histor-ies. Significantly, models initiated with a preexisting CPO evolve differently than the CPOs generated with-out preexisting texture. Moreover, the CPO in each model evolves differently as a function of strain.Numerical simulations are compared to laboratory experiments by Boneh and Skemer (2014). In general,the D-Rex and VPSC models are able to reproduce the experimentally observed CPOs, although the modelssignificantly over-estimate the strength of the CPO and in some instances produce different CPO from whatis observed experimentally. Based on comparison with experiments, recommended parameters for D-Rexare: M* 5 10, k* 5 5, and v 5 0.3, and for VPSC: a 5 10–100. Numerical modeling confirms that CPO evolu-tion in olivine is highly sensitive to the details of the initial CPO, even at strains greater than 2. These obser-vations imply that there is a long transient interval of CPO realignment which must be considered carefullyin the modeling or interpretation of seismic anisotropy in complex tectonic settings.
1. Introduction
Patterns of flow in Earth’s interior provide insight into the convective forces that drive plate motions. How-ever, flow patterns are difficult to determine uniquely as Earth’s interior is largely invisible to direct observa-tion. Geophysical data, such as the velocity and anisotropy of seismic waves, represent our primary windowinto the internal structure of the planet. In the upper mantle, anisotropy of seismic wave velocities is causedmainly by the preferential alignment of seismically anisotropic grains in polycrystalline rock—often calledcrystallographic preferred orientation (CPO). CPO develops through the activity of specific deformationmechanisms, which cause individual crystal lattices to rotate into favored orientations with respect to thekinematics of flow [Ave Lallemant, 1975; Nicolas and Christensen, 1987].
Models of CPO evolution provide tools to both predict and interpret seismic anisotropy. This can be imple-mented in a forward manner by coupling geodynamic flow simulations or physical models to a numericalor conceptual model for CPO evolution, leading to predictions for seismic anisotropy in a given setting[Blackman et al., 1996; Chastel et al., 1993; Conrad et al., 2007; Druken et al., 2011, 2013; Faccenda and Capita-nio, 2012, 2013; Paczkowski et al., 2014; Tommasi, 1998]. CPO modeling can also be applied in an inverseway to relate seismological observations to the kinematics of mantle flow [Alpert et al., 2013; Becker et al.,2006b].
To interpret seismic anisotropy in terms of mantle flow it is typically assumed that CPO is near steady state,which means that the current CPO reflects the macroscopic deformation kinematics of the region sampledby the seismic waves. This assumption implies that the rate of CPO evolution along a particular flowline issignificantly smaller than the rate of deformation evolution, as quantified by the Grain-Orientation-Lag
Key Points:� CPO evolution of olivine polycrystals
is modeled using D-Rex and VPSC.� Deformation history significantly
influences texture evolution in olivinepolycrystals.� Long-lived transient CPOs provide
new ways to interpret seismicanisotropy in terms of mantle flow
Supporting Information:� Supporting Information S1� Tables S1-S2� Movie S1
Correspondence to:Y. Boneh,[email protected]
Citation:Boneh, Y., L. F. G. Morales, E. Kaminski,and P. Skemer (2015), Modeling olivineCPO evolution with complexdeformation histories: Implications forthe interpretation of seismicanisotropy in the mantle,Geochem. Geophys. Geosyst., 16,doi:10.1002/2015GC005964.
Received 17 JUN 2015
Accepted 26 AUG 2015
Accepted article online 1 SEP 2015
VC 2015. American Geophysical Union.
All Rights Reserved.
BONEH ET AL. OLIVINE CPO WITH DEFORMATION HISTORIES 1
Geochemistry, Geophysics, Geosystems
PUBLICATIONS

(GOL) parameter introduced by Kaminski and Ribe [2002]. Boneh and Skemer [2014] proposed an additionalset of empirical criteria for determining whether steady state CPO has been achieved. Texture can be con-sidered in steady state if the strength, symmetry, and orientation of the crystallographic orientation pat-terns do not change with progressive strain. Using similar criteria, recent experiments on polycrystallineolivine show that very large strains are necessary (up to a shear strain of 10) in order to achieve texturalsteady state [Hansen et al., 2014]. Experiments and field observations have also demonstrated that preexist-ing textures introduced by complex deformation histories significantly modify the rate and patterns of sub-sequent CPO evolution [Boneh and Skemer, 2014; Skemer et al., 2010, 2011; Warren et al., 2008; Webber et al.,2010]. These studies demonstrate that there is considerable variability in the rate of texture development,especially in comparison to experiments that do not take into account preexisting texture [Skemer et al.,2012]. Furthermore, experiments by Hansen et al. [2012] have demonstrated that the shear strength of poly-crystalline olivine is a function of texture strength, confirming that microstructure and rheology are coupledup to very large strains [Knoll et al., 2009]. Collectively, these data corroborate inferences from natural shearzones, which are thought to experience long transient evolution of both microstructure and rheology.
The protracted evolution of olivine CPO suggests that deformation history should have a significant impacton the interpretation of seismic anisotropy [Kaminski and Ribe, 2002; Skemer et al., 2012]. The viability of theforward modeling approach is contingent on the capability of numerical models to simulate CPO evolutionwith complex deformation history. A wide range of theoretical models using different physical backgroundsand hypotheses have been proposed to simulate texture evolution, including the viscoplastic self-consistent approach [Lebensohn and Tom�e, 1993; Tommasi et al., 2000; Wenk et al., 1991], second order vis-coplastic self-consistent approach [Casta~neda, 2002; Raterron et al., 2014], the kinematic model D-Rex[Kaminski and Ribe, 2001; Kaminski et al., 2004], and equilibrium-based models [Chastel et al., 1993]. In manycases, these models have been parameterized through comparison with laboratory experiments, such asthe results of Nicolas et al. [1973] and Zhang and Karato [1995], which describe the formation and evolutionof olivine deformed in uniaxial compression and simple shear, respectively. However, a limitation of thesecomparisons is that the starting materials of most of laboratory experiments and corresponding simulationshave a ‘‘random’’ texture, in which there is no significant quantifiable alignment of grains. Indeed, it is chal-lenging to model CPO evolution with complex deformation histories and kinematics [Blackman and Kendall,2002; Castelnau et al., 2009], which contributes to the difficulty of interpreting seismic anisotropy near plateboundaries [e.g., Becker et al., 2014; Blackman, 2007; Castelnau et al., 2009].
In this study we compare numerical models of CPO evolution with recent experimental results that demon-strate the effect of deformation history on CPO [Boneh and Skemer, 2014]. We employ two widely usedmethods for texture development modeling: the viscoplastic self-consistent (VPSC) approach as describedin Tommasi et al. [2000], which is based on the reorientation of crystals through intracrystalline slip andgrain interactions, and the D-Rex approach [Kaminski and Ribe, 2001], which considers intracrystalline slipand dynamic recrystallization but does not model mechanical interactions between grains. The VPSCapproach has been used to simulate olivine texture in mantle flow, shear zones and lithospheric plate inter-actions [Bonnin et al., 2012; Di Leo et al., 2014; Li et al., 2014; Tommasi et al., 1999, 2009]. D-Rex is often usedto simulate larger strains, when dynamic recrystallization must be taken into account. D-Rex is also pre-ferred in larger-scale geodynamic models, due to its relative ease of computation [Becker et al., 2006a; Con-der and Wiens, 2007; Faccenda and Capitanio, 2012; Hedjazian and Kaminski, 2014; Kaminski and Ribe, 2002].In contrast to the standard approach of comparing CPO evolution in experiments and models with a ran-dom set of initial grain orientations, we have initiated our models using the same natural CPO and thesame deformation configurations previously explored experimentally by Boneh and Skemer [2014]. Thisapproach allows for the direct comparison between experiments and numerical modeling and providesnew insights about the effect of preexisting crystallographic orientation on the texture development.
2. Methods
Both VPSC and D-Rex models are described extensively elsewhere [Kaminski and Ribe, 2001; Kaminski et al.,2004; Lebensohn and Tom�e, 1993; Tommasi et al., 2000]. Here we will highlight only the main features anddifferences between these models. For both models, the rotation of grains is implemented through the
Geochemistry, Geophysics, Geosystems 10.1002/2015GC005964
BONEH ET AL. OLIVINE CPO WITH DEFORMATION HISTORIES 2

glide of dislocations along specific crystal slip systems. The models consider the experimentally determinedolivine slip systems and their critical resolved shear stress (CRSS); deformation follows the viscoplastic law:
_cs 5 _c0 ssr=s
s0
� �n(1)
_cs is the slip system strain-rate, _c0 is the reference strain-rate, ssr is the resolved shear stress (a function of
the Schmidt factor—the orientation of the slip system with respect to the imposed stress), ss0 is the critical
resolved stress, and n is the stress exponent.
2.1. D-Rex ModelModeling texture through the kinematic approach of D-Rex assumes crystal reorientation through the localvelocity gradient:
dij5 Gijm – eijk wk (2)
where Gij is the Schmidt factor, which relates the crystal and imposed stress orientations, m is the slip rateon the softest slip system for a given grain, Eijk is the macroscopic (aggregate) strain rate, and x is the rota-tion rate. In order to satisfy the strain compatibility a minimization technique is used to minimize the differ-ence between the single crystal and aggregate strain [Ribe and Yu, 1991]. The residual strain, �10%[Kaminski and Ribe, 2001], is assumed to be accounted for by processes that do not impose crystal rotation,such as diffusive mass transfer and/or grain boundary migration [Ribe and Yu, 1991].
D-Rex simulates dynamic recrystallization through two dimensionless parameters that account for grainboundary migration and grain nucleation (M* and k* respectively). D-Rex also simulates the effects of ‘‘grainboundary sliding’’ through the dimensionless parameter v [Kaminski et al., 2004]. Grain growth is incorpo-rated using a parameter for grain-boundary migration:
M�5AlbM
V(3)
where A is dimensionless constant, m is the shear modulus, b is Burger vector, M is a dimensionless grain-boundary mobility, and V is the dislocation velocity.
Grain size reduction through dynamic recrystallization is incorporated into D-Rex using a parameter for thenucleation of strain-free grains
k�5 ln aVð Þq0
q
� �(4)
where k* is dimensionless nucleation parameter, aV is the nonrecrystallized volume fraction of thecrystal, and q0 and q are a reference dislocation density and the crystal’s dislocation density, respec-tively, the ratio of which acts as the driving force for nucleation. The two parameters, M* and k*,account for competing processes. M* is responsible for the migration of grain boundaries, whichcause highly strained crystals (‘‘soft’’ grains) to be invaded by weakly strained crystals (‘‘hard’’ grains)increasing the number of grains in hard orientations. k* accounts for the nucleation of new grains,which cause the highly strained soft grains to nucleate new grains with zero strain in the same ori-entation. Due to their low stain energy, these grains then grow by grain boundary migration, increas-ing the volume fraction of grains in soft orientations. One effect of grain size reduction bynucleation of new small grains is that these grains may accommodate strain by mechanisms that donot invoke crystallographic rotation (diffusion creep and/or grain boundary sliding). This effect is rep-resented by parameter v, which disables the rotation of grains below a specific grain volume fractionthreshold [Kaminski et al., 2004].
2.2. VPSC ModelIn the VPSC approach, each grain’s strain and stress is considered in terms of the bulk aggregate strain andstress by using the ‘‘one site’’ grain interaction simplification which simulates interaction of each grain witha surrounding homogeneous equivalent medium (HEM) [Eshelby, 1957]:
_�ij – _Eij 5 – aMijkl skl – Rklð Þ (5)
Geochemistry, Geophysics, Geosystems 10.1002/2015GC005964
BONEH ET AL. OLIVINE CPO WITH DEFORMATION HISTORIES 3

Where _�ij is the grain strain-rate, _Eij is the average strain-rate of the aggregate, a is parameter that describesgrain interaction with its surroundings, Mijkl is the interaction tensor that includes grain rheology and shape,skl is the grain deviatoric stress, and Rkl is the average stress of the aggregate. Through this approach,microscopic stress and strain rates may vary significantly with respect to the averaged (macroscopic) values.The grain interaction parameter, a, represents the grain response and ranges between the upper bound, inwhich a is equal to zero and homogeneous strain is assumed [Taylor, 1938], and the lower bound, in whicha approaches infinity, and homogeneous stress is assumed [Sachs, 1928]. Limitations of the VPSC comparedto full-field models (models that include aggregate microstructure) have been shown, in particular, theeffect of secondary slip systems [Castelnau et al., 2008; Castelnau et al., 2010; Detrez et al., 2015] and theoverestimation of texture strength [Castelnau et al., 2006].
2.3. Differences Between VPSC and D-RexThe fundamental difference between VPSC and D-Rex is that the former is physics-based (mean-field)model while the latter is an ad hoc (far-field) model. In VPSC interaction between grains are consideredvia the HEM assumption while stress compatibility is maintained, which allows a meaningful representa-tion of the relative activity of different slip system [Tommasi et al., 2000]. The formulation of the VPSCapproach in the present study does not include processes like dynamic recrystallization or relaxation proc-esses like dislocation climb and grain boundary sliding, although this has been implemented recently bySignorelli and Tommasi [2015]. In contrast, D-Rex includes ad hoc parameters that are intended to simulatemicrophysical processes in addition to deformation: dynamic recrystallization and grain boundary sliding.In addition, the calculation of intracrystalline deformation in D-Rex is analytical. Hence the code requiresfewer computations, which allows it to be easily coupled to larger geodynamic models.
2.4. Model Starting ConditionsBoth VPSC and D-Rex models are initiated using input textures composed of 1000 grain orientations. Insome tests, simulations are initiated using random crystal orientations. In most of the present study how-ever, we use the CPO of a natural dunite from Åheim, Norway as the starting texture. This is the CPO of thesame rock specimen that we used as the starting material for the experiments of Boneh and Skemer [2014]and has been widely used in other rock mechanics studies [Chopra and Paterson, 1981, 1984; Jackson et al.,1992; Keefner et al., 2011; Van der Wal et al., 1993; Wendt et al., 1998]. The texture of the Åheim dunite wasmeasured by Electron Backscatter Diffraction (EBSD), (for details of microstructural characterization, seeBoneh and Skemer [2014]). The Åheim dunite is foliated and exhibits a strong axial girdle (AG) texture, char-acterized by the alignment of [010] axes normal to the foliation of this rock, while [100] and [001] are dis-tributed along single continuous girdles parallel to the foliation (Figure 1a). Such a pattern reflects a historyof nearly uniaxial deformation [Mainprice, 2015; Nicolas et al., 1973; Wenk et al., 1991]. In both the Boneh andSkemer [2014] experiments and in the models described in this study, the Åheim dunite texture (Figure 1a)was deformed in three different configurations in which the sample and/or CPO is rotated to angles of 0,45, and 90 degrees with respect to the shortening axis (Figure 1b).
The stress exponent used in the models (n 5 3.5, Table 1) has been well established by rock deformationexperiments for olivine single crystals in various orientations [Bai et al., 1991; Durham and Goetze, 1977], aswell as for polycrystals [Karato et al., 1986]. To maintain consistency and to facilitate comparison with previ-ous studies, the relative strength of olivine’s primary slip-systems for VPSC and D-Rex (Table 1) are takenfrom Tommasi et al. [2000] and Kaminski and Ribe [2001], respectively. These critical resolved shear stressesare chosen to represent the most ubiquitous olivine texture (A-type, of Jung and Karato [2001]), which isdominated by slip on the [100](010) slip system [Ben Isma€ıl and Mainprice, 1998]. The [100](010) slip systemis also inferred to be the dominant slip system in the Boneh and Skemer [2014] experiments. The deforma-tion geometry is uniaxial compression with the corresponding strain tensor with E115 E3350.5, E225-1 andEi6¼j50. The parameters used are a 5 100 for VPSC, and M* 5 10, k* 5 5, v 5 0.3, for D-Rex. Rationale for thischoice of parameters is discussed in section 4.2.
2.5. Quantifying Texture and AnisotropyTexture is characterized by its strength, its symmetry, and its orientation with respect to the reference frameof deformation. Texture symmetry and orientation control the orientation of anisotropy detected seismo-logically. Texture strength influences mainly the magnitude of the anisotropy up to a limit, after which themagnitude reaches saturation [Hedjazian and Kaminski, 2014].
Geochemistry, Geophysics, Geosystems 10.1002/2015GC005964
BONEH ET AL. OLIVINE CPO WITH DEFORMATION HISTORIES 4

In order to evaluate texture evolution with increasing strain we use several quantitative parameters. Texturestrength is quantified using the M-index method, ranging from M 5 0, for a perfect random texture, toM 5 1, for perfect crystallographic alignment (e.g., a single grain) [Skemer et al., 2005], and the pole figurestrength (pfJ) parameter [e.g., Mainprice et al., 2014] for individual pole figures, which ranges from 1 for aperfect random texture to infinity for perfect alignment. As [100], [010] and [001] are all two-fold rotationaxes, the results from pfJ can be directly compared.
Texture symmetry is quantified using the parame-ters Point (P), Girdle (G), and Random (R), whichdescribe whether the CPO is best represented by apoint maximum (Point), an equal distribution ofpoints along a plane (Girdle), or a uniformly distrib-uted texture with no preferred orientation(Random) [Vollmer, 1990]. These three symmetryparameters, calculated from eigenvalues of theorientation tensor [Mainprice et al., 2014], alwayssum to 1, and therefore can be plotted in a ternarydiagram [e.g., Falus et al., 2011; Higgie andTommasi, 2012; Morales and Tommasi, 2011;
Table 1. Models Input Parameters
Slip System VPSC CRSSa D-Rex CRSSa
(010)[100] 1 1(001)[100] 1 2(010)[001] 2 3(100)[001] 3 6(021)[100] 6(110)[001] 6n (stress exponent)b 3.5 3.5N (number of grains) 1000 1000
aCRSS––Relative Resolved Shear Stress. The CRSS is relativeto the weakest slip system ((010)[100]).
bthe same stress exponent was used for all slip systems.
Figure 1. (a) Pole figures showing the olivine crystallographic preferred orientation (CPO) of Åheim dunite. The Åheim dunite exhibits agirdle of orientations in [100] and [001] parallel to the foliation plane. The foliation is also marked as dotted lines in Figure 1b. Contourintervals are linear and scaled to multiples of uniform distribution, m.u.d. (scale bars on left side of each pole figure). Texture strength(M-index) and texture symmetry (BA-index) are listed to the right of the pole figures. (b) Three configurations of the Åheim dunite samplesin which the axis of shortening is perpendicular, oblique, or parallel to the dunite initial foliation. On the right are schematic illustrationsof the initial texture for each of the three configurations. Pole figures are in a X-Y-Z reference frame in which the shortening axis is parallelto the Z direction and the X-Y plane is in the radial plane, perpendicular to the shortening axis.
Geochemistry, Geophysics, Geosystems 10.1002/2015GC005964
BONEH ET AL. OLIVINE CPO WITH DEFORMATION HISTORIES 5

Figure 2. Pole figures showing texture from experiments, VPSC, and D-Rex models for the three starting configurations: (a) perpendicular,(b) oblique, and (c) parallel. Experimental data are taken from high strain experiments of Boneh and Skemer [2014]. Parameters used inmodels: for D-Rex: M* 5 10, k* 5 5, v 5 0.3, and for VPSC: a 5 100 (other parameters are shown in Table 1). Scale bar to the right of eachpole figure show the multiples of uniform distribution (m.u.d.). Pole figures projected in equal area and lower hemisphere. Texturestrength of each pole figure (pfJ), the total texture strength (M-index), and the texture symmetry (BA-index) are given.
Geochemistry, Geophysics, Geosystems 10.1002/2015GC005964
BONEH ET AL. OLIVINE CPO WITH DEFORMATION HISTORIES 6

Tommasi et al., 2008; Vauchez et al., 2005]. P, G, and R components for specific pole figures are denoted usingsubscript notation: (e.g., the girdle component of the [100] pole figure is denoted G[100]). Another way toquantify a specific coaxial texture is the BA-index, in which a specific point and girdle components are com-pared to the point and girdle sum so that the dependence of the texture symmetry on the random compo-nent is minimized:
BA50:5 22P010
G0101P010
� �2
G100
G1001P100
� �� �(6)
The BA-index represents symmetry that includes point maxima in the [010] and girdle in the [100] and isscaled to range from BA 5 0 to BA 5 1 [Mainprice et al., 2014]. BA 5 0 corresponds to a ‘‘perfect’’ axial girdle(AG) texture while BA 5 1 would represent the absence of an AG texture.
Pole figures of CPO and seismic velocities were calculated and plotted using D. Mainprice software (Petrophysi-cal software, Unicef Careware, http://www.gm.univ-montp2.fr/PERSO/mainprice/) [Mainprice, 1990], whichassumes Voigt-Reuss-Hill average and elastic constants for olivine from Abramson et al. [1997] in calculating theseismic velocities. We also apply a code by Savransky and Kasdin [2012] to convert grains orientations outputfrom directional cosines [Kaminski and Ribe, 2001, equation (1)] to Euler angles. Pole figures of CPO used forMovie S1 (supporting information) were generated using MTEX [Bachmann et al., 2010; Mainprice et al., 2011].
3. Results
3.1. CPO Development With Different Starting TexturesIn Figure 2, CPOs generated by D-Rex and VPSC models are compared with the experiments of Boneh andSkemer [2014]. Results are shown for the three initial configuration: perpendicular (Figure 2a), oblique (Fig-ure 2b), and parallel (Figure 2c). Models are run to the same finite strains achieved experimentally (0.65,0.68, and 0.62, for the three configurations, respectively).
In the perpendicular configuration (Figure 2a), the experimental texture exhibits a fiber texture (i.e., thecoaxial AG-fabric) with girdles in [100] and [001] and a strong point maxima of [010], which is similar to theinitial texture symmetry (Figure 1a). Both models show significantly stronger texture than the experiments.For example, the [010] axes in the experimental CPO have a pole figure J-index strength (pfJ) of �2 com-pared to 5.5 in D-Rex and almost 17 in VPSC.
In the oblique configuration (Figure 2b), the experimental texture shows the [010] point maximum rotatedfrom its original position toward the shortening direction, and weak [100] and [001] point maxima. Bothmodels predict a [010] point maximum rotation similar to the experiment, however, there is difference inthe strength of this point maximum ([010] pfJ of 2.27, 4.9 and 11.45 for the experiments, D-Rex, and VPSC,respectively). In the experiments, D-Rex, and VPSC models, there is a pronounced [100] point maximumsuperimposed on a girdle in the axial plane, giving the texture a pseudo-orthorhombic symmetry.
In the parallel configuration, the experimental texture shows a weak [100] girdle along the radial (X-Y)plane, a [010] girdle along the X-Z plane, and a very weak CPO, i.e., mostly random texture, in the [001]axis (pfJ of 1.12). Both models predict that the [010] axes are distributed along the X-Z plane with threedistinct point maxima (one in the X direction and two at a symmetric and oblique angle away from theshortening axis). These three point maxima are more diffuse in D-Rex than in VPSC. For the [100] axis, D-Rex shows a point maximum parallel to Y with two weaker bands of data oriented in an ‘‘x’’ shape at ahigh angle to the radial plane. VPSC shows a stronger point maximum toward Y with ‘‘x’’ shaped bandsforming a girdle subparallel to the radial plane. The ‘‘x’’ shaped features in the model’s CPO agree wellwith the experimental observations, although there is a difference in the strength and orientation of thebands. For the [001] axis, both VPSC and D-Rex have similar textures with two point maxima at the Y andZ directions. The models predict two point maxima in the [001] axis, parallel to the X and Y axis, but theexperiments show a disperse crystals oriented only toward Y axis (also among other strains in the parallelconfigurations, see Boneh and Skemer [2014, Figure 3c]).
3.2. Evolution of Texture SymmetryD-Rex and VPSC models were run over a range of strains to assess how CPO evolves as a function of strain.Texture evolution for D-Rex (square symbols) and VPSC (circle symbols) models are shown in Figure 3 using
Geochemistry, Geophysics, Geosystems 10.1002/2015GC005964
BONEH ET AL. OLIVINE CPO WITH DEFORMATION HISTORIES 7

Figure 3. Ternary diagram of texture symmetry parameters Point, Girdle and Random, calculated using eigenvalues of the orientation tensor [Vollmer, 1990], for: (a) D-Rex (square sym-bols), and (b) VPSC (circles symbols). There are total of 22 strain steps: e 5 0.01 and 0.05, and 20 steps in increments of 0.1 (from e 5 0.1 to 2). Three models with preexisting configura-tions are shown: perpendicular (dark red), oblique (orange), and parallel (yellow), and an initially un-textured case is shown for reference (gray). The stars denote the two startingconditions: the undeformed Aheim dunite in blue and the untextured scenario in gray. Arrows show the initial trend of symmetry development from the initial texture. The symmetry ofeach configuration is shown to evolve differently as a function of strain.
Geochemistry, Geophysics, Geosystems 10.1002/2015GC005964
BONEH ET AL. OLIVINE CPO WITH DEFORMATION HISTORIES 8

a ternary diagram with Point, Girdle and Random texture components as end members. For each of olivine’sthree crystallographic axes the symmetry trajectory is shown for the three configurations with preexistingtexture: perpendicular (dark red symbols), oblique (orange symbols), and parallel (yellow symbols), and foran initially random texture (gray symbols). Each point represents a strain-increment between the initial tex-tures, with strain of zero, to strain of 2. The first two points represent texture for small finite strains of 0.01and 0.05, while the next 20 points are equally spaced with strain intervals of 0.1 (between strain of 0.1–2).The starting point (i.e., strain 5 0) from which texture evolves for the three configurations with preexistingtexture is shown as a blue star. The starting point for the random case, shown as gray star, is defined as hav-ing symmetry of R 5 1, and P 5 G 5 0.
For models initiated with random texture D-Rex and VPSC produce similar results, which are essentiallyidentical to the results of Kaminski and Ribe [2001] and Tommasi et al. [2000]. Texture evolves from randomto girdle in [100] and [001], and from random to point in [010], as expected from the experimental results ofNicolas et al. [1973]. In the D-Rex model, G[100] increases from 0 to 0.91, P[010] increases from 0 to 0.78, whileG[001] increases from 0 to 0.60. In the VPSC model, G[100] increases from 0 to 0.96, P[010] increases from 0 to0.89, while G[001] increases from 0 to 0.78.
For models initiated with preexisting texture, each of the three pretextured configurations shows differentsymmetry evolution and they also evolve differently with respect to the initially un-textured scenario. Forthe D-Rex models, G[100] increases from 0.54 to 0.87, 0.64, and 0.71 for perpendicular, oblique and parallelconfiguration, respectively, P[010] increases from 0.49 to 0.89, 0.87, and 0.59 for perpendicular, oblique andparallel configuration, respectively. For the VPSC models G[100] evolves from 0.54 to 0.80, 0.53, and 0.43 forperpendicular, oblique and parallel configuration, respectively. P[010] increases from 0.49 to 0.99, 0.99, and0.62 for perpendicular, oblique and parallel configuration, respectively.
D-Rex and VPSC show some notable differences in terms of their prediction of texture evolution. CPOs gen-erated by the VPSC approach tend to evolve more quickly than CPOs generated by D-Rex. For example, inD-Rex the [100] axes in perpendicular and oblique configurations reach texture with Random parameter ofR[100]< 0.05 at 1.7 and 1.9 strain, respectively, while in VPSC R[100] requires strains of only 0.4 and 0.7,respectively. This effect is seen for the perpendicular and oblique configurations in the [001] axis as well.However, for the [010] axes the two models predict similar texture trajectories. The full set of texture dataused in these calculations can be found in supporting information Tables S1 and S2. In addition, direct qual-itative comparisons of CPO evolution between the two models can be made using the animation provided(supporting information Movie S1).
3.3. Texture Strength and AnisotropyIn order to further quantify the evolution of texture we calculate the total texture strength, using the M-index parameter [Skemer et al., 2005], and the maximum P-wave seismic anisotropy. The calculated texturestrength and the associated seismic anisotropy are plotted as a function of strain (Figure 4). Experimentaldata from Boneh and Skemer [2014] are shown as open symbols for comparison. Texture strength in D-Rex(Figure 4a) for the perpendicular and oblique configurations show a small gradual increase of texturestrength to values of M 5 0.36 and M 5 0.31, respectively (Figure 4a), while the parallel configurationdecreases slightly to a low and relatively constant value of M 5 0.13. Texture strength in VPSC (Figure 4b)for the perpendicular configuration shows an initial increase of strength up to strain of about 0.75 then asteady strength value until strain of 2 (M 5 0.45 at E 5 2). For the oblique configuration the strengthincreases throughout the strain range (M 5 0.55 at E 5 2). For the parallel configuration strength decreasesinitially and starts to increase again when the strain is about 1 (M 5 0.37 at E 5 2). Texture strength of theinitially random case after strain of 2 is slightly higher (D-Rex) or similar (VPSC) to the parallel configurationstrength at the same strain (which is significantly lower than the perpendicular and oblique configurations).The texture strength in both models is stronger in the perpendicular and oblique configurations than in theparallel configuration.
In Figures 4c and 4d, the P-wave seismic anisotropy in percentage (AVp 5 200 (Vpmax2Vpmin)/(Vpmax 1 Vpmin)) is shown with respect to strain for D-Rex and VPSC, respectively. In both models thetrend of increasing seismic anisotropy with strain is similar although the models differ in terms of the mag-nitude of the anisotropy. Seismic anisotropy in D-Rex for the perpendicular and oblique configurationsshow a small gradual increase of texture strength to almost similar values of AVp 5 14.8% and AVp 5 15.5%,
Geochemistry, Geophysics, Geosystems 10.1002/2015GC005964
BONEH ET AL. OLIVINE CPO WITH DEFORMATION HISTORIES 9

respectively (Figure 4d), while the parallel configuration initially decreases to AVp 5 4.6% at strain of 0.5then increases up to AVp 5 13.3% at strain of 2. Seismic anisotropy in VPSC for the perpendicular andoblique configurations shows a small gradual increase of texture strength to values of AVp 5 15.5% andAVp 5 18.2%, respectively (Figure 4c), while the parallel configuration the seismic anisotropy stays at aboutto AVp 5 8.2% for the strain of 0.5 and increases up to AVp 5 17.4% at strain of 2.
4. Discussion
4.1. Texture Evolution in Uniaxial Deformation ExperimentsThe interpretation of seismic anisotropy relies on our understanding of the way crystals rotate and align ina polycrystalline aggregate under externally imposed deformation conditions. Nicolas et al. [1973] were thefirst to demonstrate how texture in olivine develops and strengthens as a function of strain in uniaxial com-pression. In these experiments, a CPO develops in which the [010] axes align parallel to the direction ofcompression and the [100] and [001] axes align within the radial plane, perpendicular to the compressionaxis. Put in terms of P, G, and R, the Nicolas et al. [1973] experiments predict that olivine in uniaxial compres-sion should accumulate a strong G[100], P[010], and G[001], with a corresponding decrease in the R componentof all three pole figures. For several decades, these experiments have provided an important basis for mod-eling and interpreting CPO and anisotropy in mantle rocks [e.g., Karato et al., 2008].
Building on the Nicolas et al. [1973] experiments, Boneh and Skemer [2014] showed the effect of defor-mation history on texture evolution in uniaxial compression. Unlike the Nicolas et al., 1973 experiments,which used samples with a weak preexisting CPO, Boneh and Skemer conducted experiments on theÅheim dunite, which possesses a strong preexisting texture. Experiments were conducted in three differ-ent configurations to simulate distinct deformation histories. As with the Nicolas et al. experiments,
Figure 4. (a and b) Texture strength and (c and d) P-wave seismic anisotropy (AVp 5 200 (Vpmax2Vpmin)/(Vpmax 1 Vpmin)) plotted as a function of strain. Numerical models are shownusing solid symbols. Experimental data from Boneh and Skemer [2014] are shown as open symbols. Color denotes the configuration of the experiment or model: gray for initial randomtexture, dark red, orange, and yellow for perpendicular, oblique and parallel configuration, respectively. Blue star denotes the undeformed Åheim dunite. Texture strength is quantifiedusing M-index [Skemer et al., 2005]. Seismic anisotropy quantified using the maximum anisotropy of the P-wave velocity, in percent.
Geochemistry, Geophysics, Geosystems 10.1002/2015GC005964
BONEH ET AL. OLIVINE CPO WITH DEFORMATION HISTORIES 10

Boneh and Skemer [2014] showed that texture evolves toward a symmetry characterized by strong pointmaxima in [010] and girdles in the [100] and [001] pole figures. However, for strains of � 0.6–0.7,texture evolution is still transient, and is far from the expected steady state, particularly in the obliqueand parallel cases (Figure 2). Moreover, each experimental configuration evolved differently as a functionof strain. Here we demonstrate that numerical models of texture evolution, run using identical startingconditions, lead to the same conclusions: that deformation history significantly influences the way tex-ture accumulates with progressive strain (Figures 2–4).
4.2. Comparison Between Numerical Models and ExperimentsIn general, comparison between numerical models and experiments reveals a similar texture signature butwith significant differences in the CPO strength and the magnitude of the calculated anisotropy (Figures 2and 4). For the three configurations, models show the development of a [010] point maximum parallel tothe shortening axis, in excellent agreement with the experiments (see further discussion in section 4.4). Forthe [100] and [001] axes there are some differences between the two models and the experiments (espe-cially in the oblique and parallel configurations). For example, in the oblique configuration, D-Rex shows[100] and [001] point maximum near the X and Y directions, respectively while VPSC shows [100] and [001]point maximum near the Y and X directions, respectively (Figure 2). In nearly all cases, the VPSC and D-Rexmodels overestimate the strength of the CPO, and therefore the magnitude of the seismic anisotropy.
With both the VPSC and the D-Rex models, parameterization is achieved mainly through comparison withlaboratory experiments. The experimental benchmarks for the D-Rex models of Kaminski et al. [2004] and
2.77
.02
1.0
2.0
4.48
.09
1.0 2.0 3.0
2.35
.14
.50 1.0 1.5 2.0
1.5
pfJ = 1.38 pfJ = 2.02 pfJ = 1.22
M = 0.15
BA = 0.158
4.17
.00
1.0 2.0 3.0
17.07
.00
4.0 8.0 12.0
3.93
.00
1.0
2.0
3.0
4.96
.00
1.0 2.0 3.0 4.0
19.43
.00
4.0 8.0 12.0 16.0
3.29
.00
1.0 1.5 2.0 2.5
3.70
.00
1.0
2.0
3.0
9.63
.00
2.0 4.0 6.0 8.0
7.31
.01
2.0
4.0
6.0
9.93
.00
2.0 4.0 6.0 8.0
10.70
.00
2.0 4.0 6.0 8.0
14.22
.03
4.0
8.0
12.0
M*
= 0
M*
= 50
M*
= 20
0M
* =
10
pfJ = 2.71 pfJ = 7.35 pfJ = 1.79
pfJ = 2.32 pfJ = 6.77 pfJ = 1.98
pfJ = 1.83 pfJ = 4.77 pfJ = 2.68
pfJ = 2.87 pfJ = 4.70 pfJ = 4.33
M = 0.26
BA = 0.057
M = 0.26
BA = 0.067
M = 0.23
BA = 0.199
M = 0.20
BA = 0.360
D-Rex
Experiment[100] [010] [001]
Perpendicular (ε = 0.65)
[100] [010] [001]
3.59
.05
1.0
2.0
3.0
4.98
.03
1.0 2.0 3.0 4.0
2.76
.08
.50 1.0 1.5 2.0 2.5
pfJ = 1.54 pfJ = 2.27 pfJ = 1.42
9.47
.01
2.0 4.0 6.0 8.0
13.40
.00
4.0 6.0 8.0 10.0
12.31
.03
4.0 6.0 8.0 10.0
7.02
.00
2.0
4.0
6.0 13.09
.00
2.0
6.0
10.0
7.35
.04
2.0
4.0
6.0
4.66
.00
1.0 2.0 3.0 4.0
11.94
.00
2.0 4.0 6.0 8.0
4.01
.05
1.0
2.0
3.0
5.18
.00
1.0 2.0 3.0 4.0
11.71
.00
2.0 4.0 6.0 8.0
3.34
.10
1.0 1.5 2.0 2.5
M*
= 0
D-Rex
M*
= 50
M*
= 20
0M
* =
10
Experiment[100] [010] [001]
M = 0.11
BA = 0.320
pfJ = 2.32 pfJ = 4.48 pfJ = 1.51
pfJ = 2.25 pfJ = 4.90 pfJ = 1.90
pfJ = 2.70 pfJ = 5.50 pfJ = 3.01
pfJ = 3.40 pfJ = 5.87 pfJ = 4.43
M = 0.20
BA = 0.134
M = 0.20
BA = 0.187
M = 0.18
BA = 0.325
M = 0.16
BA = 0.377
Oblique (ε = 0.68)
[100] [010] [001]5.35
.16
1.0 2.0 3.0 4.0
4.78
.01
1.0 2.0 3.0 4.0
3.12
.10
1.0
2.0 M = 0.10
BA = 0.776
[100] [010] [001]
pfJ = 1.78 pfJ = 1.97 pfJ = 1.33
pfJ = 1.48 pfJ = 1.95 pfJ = 1.47
pfJ = 1.60 pfJ = 2.41 pfJ = 2.42
pfJ = 2.16 pfJ = 2.94 pfJ = 3.61
6.17
.05
2.0 3.0 4.0 5.0
8.02
.00
2.0
4.0
6.0
9.77
.05
2.0 4.0 6.0 8.0
4.26
.12
1.0
2.0
3.0
5.84
.00
2.0 3.0 4.0
6.75
.08
2.0 3.0 4.0 5.0
4.53
.14
1.0 2.0 3.0 4.0
3.82
.01
1.0
2.0
3.0
3.76
.14
1.0
2.0
3.0
pfJ = 1.28 pfJ = 1.53 pfJ = 1.12
M = 0.06
BA = 0.671
M*
= 0
M*
= 50
M*
= 20
0M
* =
10
M = 0.10
BA = 0.759
M = 0.10
BA = 0.517
M = 0.11
BA = 0.766
D-Rex
Experiment[100] [010] [001]
Parallel (ε = 0.62)
2.55
.08
.50 1.00 1.50 2.00
2.89
.08
1.0 1.5 2.0
1.88
.41
.80
1.20
1.60
5.33
.00 .5 1.5 2.5 3.5 4.5
15.38
.00
4.0
8.0
12.0
3.85
.02
1.0
2.0
3.0
8.03
.00
1.0
3.0
5.0
7.0 26.88
.00
3.0 9.0 15.0 21.0
6.27
.00
1.0
3.0
5.0
8.68
.00
1.0 3.0 5.0 7.0
32.37
.00 3.0 9.0 15.0 21.0 27.0
7.22
.00
1.0
3.0
5.0
α =
1
VPSC
α =
100
α =
1000
α =
10
pfJ = 4.04 pfJ = 15.15 pfJ = 2.96
pfJ = 4.15 pfJ = 14.50 pfJ = 2.90
pfJ = 3.88 pfJ = 11.45 pfJ = 2.52
pfJ = 3.10 pfJ = 6.14 pfJ = 1.71
M = 0.38
BA = 0.140
M = 0.36
BA = 0.143
M = 0.31
BA = 0.142
M = 0.23
BA = 0.116
[100] [010] [001]9.04
.00
1.0 3.0 5.0 7.0
35.12
.00
X
4.0 12.0 20.0 28.0
7.83
.00
1.0
3.0
5.0
7.47
.00
1.0
3.0
5.0
43.71
.00 4.0 12.0 20.0 28.0 36.0
6.52
.00
1.0
3.0
5.0
7.37
.00
1.0
3.0
5.0
45.77
.00
5.0 15.0 25.0 35.0
6.19
.00
1.0
3.0
5.0
4.96
.00 .5 1.5 2.5 3.5
15.70
.00
2.0
6.0
10.0
3.18
.01
1.0
2.0
6.76
0.0
1.0
3.0
5.0
33.06
0.0
4.0
12.0
20.0
28.0 4.57
0.0
.5 1.5 2.5 3.5
α =
1α
= 10
0α
= 10
00α
= 10 M = 0.39
BA = 0.049
M = 0.36
BA = 0.047
M = 0.28
BA = 0.056
pfJ = 4.22 pfJ = 21.69 pfJ = 3.43
pfJ = 4.29 pfJ = 23.04 pfJ = 3.58
pfJ = 3.99 pfJ = 16.84 pfJ = 2.86
pfJ = 3.13 pfJ = 7.55 pfJ = 1.76
M = 0.40
BA = 0.040
VPSC[100] [010] [001]
4.74
.04
1.0 2.0 3.0 4.0
5.52
.00
2.0 3.0 4.0
4.30
.10
1.0 2.0 3.0
5.50
.01
1.0 2.0 3.0 4.0 5.0
6.14
.01
2.0 3.0 4.0 5.0
5.04
.12
1.0 2.0 3.0 4.0
5.55
.01
2.0 3.0 4.0
5.56
.00
2.0 3.0 4.0
4.14
.14
1.0
2.0
3.0
6.24
.01
2.0 3.0 4.0 5.0
5.16
.00
1.0 2.0 3.0 4.0
2.23
.25
.60
1.00 1.40 1.80 M = 0.13
BA = 0.670
[100] [010] [001]
pfJ = 2.40 pfJ = 2.44 pfJ = 1.13
pfJ = 2.39 pfJ = 2.33 pfJ = 1.51
pfJ = 2.44 pfJ = 2.40 pfJ = 1.85
pfJ = 2.15 pfJ = 2.29 pfJ = 1.69
α =
1α
= 10
0α
= 10
00α
= 10 M = 0.13
BA = 0.704
M = 0.14
BA = 0.642
M = 0.14
BA = 0.570
VPSC
BA C
Figure 5. Pole figures showing texture from experiments (top row), D-Rex (second through fifth rows), and VPSC (six through ninth rows) for the three starting configurations: (a) perpen-dicular, (b) oblique, and (c) parallel. Models are shown for a range of parameters: for D-Rex, M* 5 0, 10, 50 or 200, and for VPSC a 5 1, 10, 100, or 1000. Experimental data are taken fromhigh strain experiments of Boneh and Skemer [2014], and is the same as Figure 2. Scale bar to the right of each pole figure show the multiples of uniform distribution (m.u.d.). Pole figuresprojected in equal area and lower hemisphere. Texture strength of each pole figure (pfJ), the total texture strength (M-index) and texture symmetry (BA-index) are given.
Geochemistry, Geophysics, Geosystems 10.1002/2015GC005964
BONEH ET AL. OLIVINE CPO WITH DEFORMATION HISTORIES 11

the VPSC models of Tommasi et al. [2000] are the experiments of Zhang and Karato [1995] and Nicolas et al.[1973]. Both of these studies used olivine aggregates with near-random initial CPO. Hence, models parame-terized through comparison with these experiments are not optimized to account for the effects of preexist-ing texture, which should be ubiquitous in the upper mantle. In this study we have explored a range ofmodel parameter space to determine those that best simulate CPO evolution in more complex geologicscenarios (Figure 5).
As noted earlier, D-Rex includes three nondimensional parameters that influence model results—M*, k* andv. We tested a range of values for each parameter (M* 5 0–200, k* 5 0–5, and v 5 0–0.8) and found that theM* parameter has the most pronounced effect on the resulting texture while k*, and v parameters have arelatively small influence that becomes negligible when recrystallization and recovery processes are slow(i.e., at low M* values). Therefore, we use common values for grain nucleation and grain boundary slidingthreshold: k* 5 5 and v 5 0.3 [Kaminski and Ribe, 2001; Kaminski et al., 2004] throughout the present study,and focus on the effect of parameter M* on texture.
Figure 5 shows model results for M* values of: 0, 10, 50, and 200. Kaminski and Ribe [2001] showed that M*between 50 and 200 fits textures from past experiments [Nicolas et al., 1973; Zhang and Karato, 1995] withlarger values favored at higher temperatures when grain-boundary migration is more efficient. However,larger values of M* appear to erase preexisting texture efficiently or generate unexpected textures that areinconsistent with experimental results. Grain boundary migration (M*) causes each grain to grow or shrinkaccording to whether its strain energy is higher or lower than the average strain energy [Kaminski and Ribe,2001, equation (14)]. The rate of new grain nucleation (k*) increases with higher ratio of dislocation density(equation (4)). Modeling both processes enhances texture evolution: grain nucleation produces a large vol-ume fraction of strain-free nucleated grains that have the largest growth rate as they have the smalleststrain energy compared to the average strain energy of the aggregate. Because the growth rate is propor-tional to both the difference in strain energy and the grain boundary mobility (M*), the larger M* the largerthe growth rate of nucleated strain-free grains in soft orientations. For example, in Figure 5a we show CPOsgenerated in the perpendicular configuration. Experiments in this configuration produce an AG-type CPOwith axial girdles in the [100] pole figures. However in models for which M* is large (50 and 200) the girdleis largely obscured by clusters of orientations that fall outside of the axial plane. Likewise, in Figure 5b, wesee for M* 5 50 and 200 an elimination of the preexisting [100] girdle and the development of point max-ima that are nearly perpendicular to the experimental observation. Based on comparison with the Bonehand Skemer [2014] experiments we suggest that lower values of M* (i.e., M* 5 10) may be more appropriatefor modeling CPO evolution influenced by preexisting texture. Although not considered here, future effortsmay also benefit from implementation of D-Rex parameters that depend on both deformation mechanismand deformation history.
Using the VPSC model, we generate CPO pole figures with a values of 1, 10, 100, and 1000 (Figure 5). The aparameter simulates grains interactions between two end members: when grains experience equal strain(a 5 0) and when grains experience equal stress (a approaches infinity). The most commonly used valuesfor a are a 5 1, which is the tangent VPSC model [Lebensohn and Tom�e, 1993; Molinari et al., 1987], anda 5 10–100, which assumes some relaxed strain compatibility [Tommasi et al., 2000]. In Figure 5, we com-pare models for a 5 1–1000. We find that a affects mainly the strength of the CPO and has only minor effecton the symmetry. The best fit with the experimental data is found to be a 5 10–100. In the remainder ofthis study we chose to use a 5 100.
4.3. The Role of Dynamic Recrystallization and Secondary Deformation MechanismsDynamic recrystallization by both subgrain rotation and grain boundary migration is expected andobserved in experiments and nature. One of the main differences between the two numerical models isthat D-Rex simulates the effects of dynamic recrystallization by nucleation and growth, while in our versionof the VPSC model dynamic recrystallization is not modeled. Dynamic recrystallization in D-Rex is simulatedby two processes, grain nucleation and grain boundary migration. The activity of these two recrystallizationprocesses is controlled by the dislocation density. The effect of dynamic recrystallization is to increase thevolume fraction of strain-free newly nucleated grains with a soft orientation relative to the imposed defor-mation. An example of the effect of dynamic recrystallization on texture can be seen in the [001] axis of theparallel configuration (Figure 2c). For both models, there are two groups of grains that can be clearly seen
Geochemistry, Geophysics, Geosystems 10.1002/2015GC005964
BONEH ET AL. OLIVINE CPO WITH DEFORMATION HISTORIES 12

as different maxima parallel to the Y and the Z axes. The first fraction of grains with [001] parallel to Z axis,have [100] orientated parallel to Y axis, and [010] parallel to X axis. This set of grains experience minimalrotation and have stayed approximately at their original orientation. The second fraction of grains with[001] oriented parallel to Y axis, have [100] oriented in an ‘‘x’’ shape (D-Rex) or along the X-Y plane (VPSC),and [010] along the X-Z plane. These grains represent the population of grains that experienced significantreorientation. In D-Rex the two populations of grains represent a similar volume fraction of the aggregatewhile in VPSC the first fraction of grains (which represents grains with no rotation) is significantly largerthan the second fraction of grains (which represents rotated grains). The experimental data show a dis-persed [001] with a maximum around Y axis with no apparent point maxima parallel to the X axis. We inter-pret this observation to indicate that the pole figures from experiments contain very few grains from thefraction of relict orientations that experienced minimal rotation. Eliminating the extra [001] point maxima inD-Rex can be achieved by using a higher value for grain boundary mobility (M*) although that will modifyother aspects of texture and will yield a less ideal fit with the experiments.
A further element of D-Rex is a grain size threshold (v) that simulates the activity of other deformationmechanisms such as diffusion creep and/or grain boundary sliding (GBS). This is implemented in a way thatdisables the rotation of small grains, hence decreasing the rate of evolution of the CPO when grain-size isreduced. Although the influence of diffusion creep and GBS on CPO evolution is complex [e.g., Wheeler,2009], several observations have asserted that GBS acts to disperse texture [Skemer and Karato, 2008; War-ren and Hirth, 2006]. The high CPO strength in D-Rex, compared to experiments (Figure 4a), suggests thatan additional CPO weakening process for simulating GBS or diffusion creep mechanisms may be needed.Interestingly, although the pervasive recrystallization is observed in the samples from Boneh and Skemer[2014], the orientation and symmetry of the CPO simulated by VPSC is in good agreement with the experi-mental CPO (Figure 2). This suggests that under some conditions grain size reduction via dynamic recrystal-lization causes a general CPO dispersion, weakening the texture but not significantly altering its symmetryor orientation.
Future versions of texture models may benefit from subroutines that progressively randomize texture whengrain-size is reduced below a certain threshold and indeed there have been a number of recent advancesin the simulation of dynamic recrystallization processes (e.g., the CDRX-VPSC model of Signorelli and Tom-masi [2015]. Validation of new models will benefit from additional comparisons between existing models,such as the work by Castelnau et al. [2008], and comparisons with experimental results such as Boneh andSkemer [2014], applying the more stringent requirement that models must be able to reproduce a full spec-trum of deformation histories.
4.4. Development of Orthorhombic Textures: Transient or Steady State?Under uniaxial deformation conditions, steady state CPO should be characterized by radial girdles of [100]and [001] axes and a point maximum in the [010] axis [Nicolas et al., 1973; Wenk et al., 1991]. Girdles areexpected in the [100] and [001] pole figures because under these imposed deformation conditions there isno preferred kinematic direction in the X-Y plane. Interestingly, Boneh and Skemer [2014] observed thedevelopment of an unexpected asymmetry in this texture: a point maximum in the [100] axis along the Yaxis (parallel to the strike of the foliation in the sample reference frame). In both VPSC and D-Rex models,the development of this point maxima is not observed when an initial random texture is used (gray symbolsin Figures 6a–6c). However, in simulations initiated with a nonrandom texture, both VPSC and D-Rex predicta very dominant point maxima parallel to Y, in agreement with the experimental results. This is particularlyapparent in the oblique and parallel configurations (Figures 6b and 6c).
For the oblique and parallel cases, this quasi-orthorhombic texture under axial deformation can beexplained when considering the influence of the preexisting girdled texture. The [100] and [001] girdles inthe Åheim dunite, in the oblique and parallel configurations, are in unstable positions with respect to theimposed deformation. However, within this girdle, a fraction of the grains have their [100] axes orientedalong the foliation strike (Y axis). These grains, with the [100] axis already oriented parallel to the Y axis, donot need to rotate in order to align toward the X-Y plane; other grains with [100] axes oblique to the X-Yplane require some rotation to reach the steady state orientation. Rotated grains are dispersed while thegrains that do not rotate become a point maxima in the axis of rotation (Y axis). This produces a transientpseudo-orthorhombic symmetry to the CPO.
Geochemistry, Geophysics, Geosystems 10.1002/2015GC005964
BONEH ET AL. OLIVINE CPO WITH DEFORMATION HISTORIES 13

For the perpendicular case, experiments and models are initiated with strong [100] and [001] girdles alreadyoriented in accordance with the imposed deformation kinematics. Interestingly, a [100] point maxima stilldevelops with strain, both for D-Rex and VPSC (Figure 6a), although this behavior is not seen in models initi-ated with a random texture, which develop an almost ideal girdle in [100] (gray symbols in Figures 3a and3b). A likely explanation is that the Åheim dunite does not have a perfect girdle to begin with and that theobserved point maxima in models is a consequence of small initial perturbations in the natural CPO (Figure1a), which are enhanced with strain.
A critical question from the perspective of understanding CPO in the mantle is whether these textures aretransient or steady state. If these textures are transient, how long are the transient CPOs maintained? Ifunexpected CPOs are preserved over long strain intervals this significantly changes the approach that mustbe used when interpreting seismic anisotropy in terms of mantle flow. To evaluate this, we look at how tex-ture quantities vary as a function of strain. One way to quantify a coaxial texture, with a girdle in the [100]pole figure and a point maximum in the [010] pole figure, is through the BA-index defined in equation (6)[Mainprice et al., 2014]. Figure 7 shows the BA-index development with strain for D-Rex and VPSC for thethree different configurations with preexisting texture and for an initial random texture. The models with aninitial random texture exhibit a rapid decrease of the BA-index to extremely low, and apparently steadystate values (BA 5 0.01–0.03 and 0.01–0.02 for D-Rex and VPSC, respectively). The strain required to reachthis steady state value is minimal (e � 0.2–0.3). This observation would imply that evolution of CPO is rapidand predictable. The pretextured configurations also appear to reach a steady BA value however the strainrequired to reach this apparent steady state value is considerably larger, especially in the parallel configura-tion. Moreover, the magnitude in each configuration is significantly different (BA perpendicular> BA obli-que>BA parallel> 0 for both models). The fact that the BA value of different configurations do notconverge to zero illustrates the protracted effect of the initial texture on the ultimate steady state. Modelsup to strains of 2 do not eliminate the inherited point maximum, and perhaps achieve a quasi-steady stateCPO that depends on the initial model conditions. Tests using D-Rex up to strains of e 5 10 observe no addi-tional change in this observation.
4.5. Seismic Anisotropy Resulting From Transient CPO EvolutionAt the conditions prevalent in the upper mantle, convection driven flow at large or small scales will gener-ate CPO as a natural consequence of deformation [Karato et al., 2008]. Near plate boundaries, where defor-mation conditions and kinematics change rapidly, progressive deformation will continuously overprint along and complex convective history. If texture evolution is slow in comparison to these changes, seismicanisotropy will reflect the transient nature of the CPO [Kaminski and Ribe, 2002; Lassak et al., 2006]. Seismic
Figure 6. The P[100] parameter is plotted versus strain for the three configurations: dark red for (a) perpendicular, (b) orange for oblique, and (c) yellow for parallel for D-Rex (squares),VPSC (circles) and experiments (open symbols). For reference, models initiated with a random texture are shown in gray (these results are the same in Figures 6a–6c). Blue stars denotethe initial P[100] of the undeformed Åheim dunite. Numerical models initiated with random textures do not display any perceptible increase in P[100] with strain. However models andexperiments initiated using the preexisting texture show a systematic increase of P[100] with strain, reflecting the generation and strengthening of CPOs with orthorhombic symmetries .
Geochemistry, Geophysics, Geosystems 10.1002/2015GC005964
BONEH ET AL. OLIVINE CPO WITH DEFORMATION HISTORIES 14

anisotropy detects CPO strength, symmetry, and orientation but is primarily sensitive to the latter twocharacteristics.
The numerical simulations presented in section 3.2 emphasize that the details of the deformation historyaffect significantly the consequent CPO (Figure 3). In Figures 8a-8c, we show how these CPOs manifest asdifferent seismic signatures. In Figures 8d and 8e, we show for comparison the calculated seismic
Figure 7. The BA-index is plotted versus strain for (a) D-Rex and (b) VPSC for the three configurations: perpendicular in dark red, oblique in orange, and parallel in yellow. Models initi-ated with a random texture are shown in gray. Blue stars denote the initial P[100] of the undeformed Åheim dunite. Models initiated with a random texture converge rapidly to BA � 0,indicating that the CPO achieves a nearly perfect axial girdle (AG). All of the pretextured configurations appear to stabilize at some nonzero BA-index, reflecting deviations from theidealized texture. There is no convergence of BA values at high strain, indicating that deformation history influences CPO symmetry over long transient strain intervals.
Figure 8. Pole figures showing anisotropic seismic properties calculated from textures of experiments and models projected in the lower hemisphere. Three seismic properties areshown for each model or sample: (left) Vp (km/s), (right) AVs (%) (AVs 5 200 (Vsmax2Vsmin)/(Vsmax 1 Vsmin), color, and the polarization, vector, of the fast shear waves. Color contoursranges from red (low velocities) to blue (high velocities). We show experiments and models for the three sample configurations: (a) perpendicular, (b) oblique, and (c) parallel. Seismicanisotropy calculated for experiments and models are compared at the same strain, as in Figure 2. Several reference samples to be compared with the present study: (d) an AG-type fab-ric, represented by undeformed Åheim dunite, (e) an A-type fabric (sample PI-284) from the experiments of Zhang et al. [2000] deformed experimentally under anhydrous conditions insimple shear, and (f) a B-type fabric (sample JK-21), deformed experimentally by [Jung and Karato, 2001] under hydrous conditions in simple shear.
Geochemistry, Geophysics, Geosystems 10.1002/2015GC005964
BONEH ET AL. OLIVINE CPO WITH DEFORMATION HISTORIES 15

anisotropy for three other common CPOs. This illustrates how different deformation histories may yield sim-ilar anisotropies—note for example, the similarity between the anisotropy generated in the parallel configu-ration and the anisotropy generated by a ‘‘B-type’’ fabric. Experiments and models are generally inagreement although the models over-predict the magnitude of anisotropy, in some cases by a factor oftwo. Experiments and models in the perpendicular configuration show the strongest agreement, which isto be expected because there is assumed to be no change in deformation kinematics between the preexist-ing deformation and imposed deformation stages. Data for the parallel configuration are also in excellentagreement. The anisotropy in this configuration is quite distinct from the predicted steady state anisotropy,with a strong P-wave velocity maximum parallel to the Y direction (see section 4.4). The oblique configura-tion shows the greatest difference between the experiment and the models. The fastest P-wave direction inthe VPSC and in the experimental data is roughly parallel to the Y direction, as is also seen in the parallelconfiguration. However in the D-Rex model the fastest P-wave direction is subparallel to the X axis (Figure8b). Hence the two models predict anisotropy that is roughly orthogonal. In general, all three deformationor simulation configurations predict distinct seismic signatures. In Figure 9, P-wave velocities are shownwith respect to the azimuth angle along the plane normal to the shortening axis (X-Y plane) for experi-ments, D-Rex, and VPSC (Figures 9a–9c, respectively). The P-wave velocities vary significantly depending onthe direction of wave propagation for the oblique (experiments and VPSC) and parallel (experiments, D-Rex,and VPSC) data sets, reflecting the relict textures.
When CPO symmetries are orthorhombic (and hence do not exhibit transverse isotropy) a maximum in P-wave velocity along a specific radial azimuth is expected. This P-wave velocity maximum should be parallelto the X direction in A-type fabric and parallel to the Y direction for B-type fabric [Jung and Karato, 2001].Although both models and experiments have the same dominant slip system as the AG-type CPOs regard-less of the initial configuration, transient texture development produces seismic anisotropy that may besimilar signature to orthorhombic A-type or B-type textures. That suggests that the relationship betweenseismic anisotropies and mantle flow is nonunique in regimes where a transient stage of texture evolutionis expected.
Figure 9. P-wave velocity is plotted against azimuthal angle (in degrees) along the radial X-Y plane. 0 and 1808 correspond to the sample X direction; 908 corresponds to the sample Ydirection. Vp variation with respect to the azimuth angles is shown for perpendicular (dark red), oblique (orange), and parallel (yellow) configurations, in (a) experiments (hollow sym-bols), (b) D-Rex (square symbols), and (c) VPSC (circle symbols), respectively. (d) Variation of Vp with azimuth is calculated for the three reference textures shown in Figure 8D, 8E, and 8F.Samples with well-developed axial girdles exhibit the lowest azimuthal anisotropy. However many samples, especially those deformed in the parallel configuration, exhibit significantanisotropy. The anisotropy of the samples in the parallel and oblique configurations have anisotropy signatures that are very similar to the B-type reference sample, although the CPOswere generated under very different conditions.
Geochemistry, Geophysics, Geosystems 10.1002/2015GC005964
BONEH ET AL. OLIVINE CPO WITH DEFORMATION HISTORIES 16
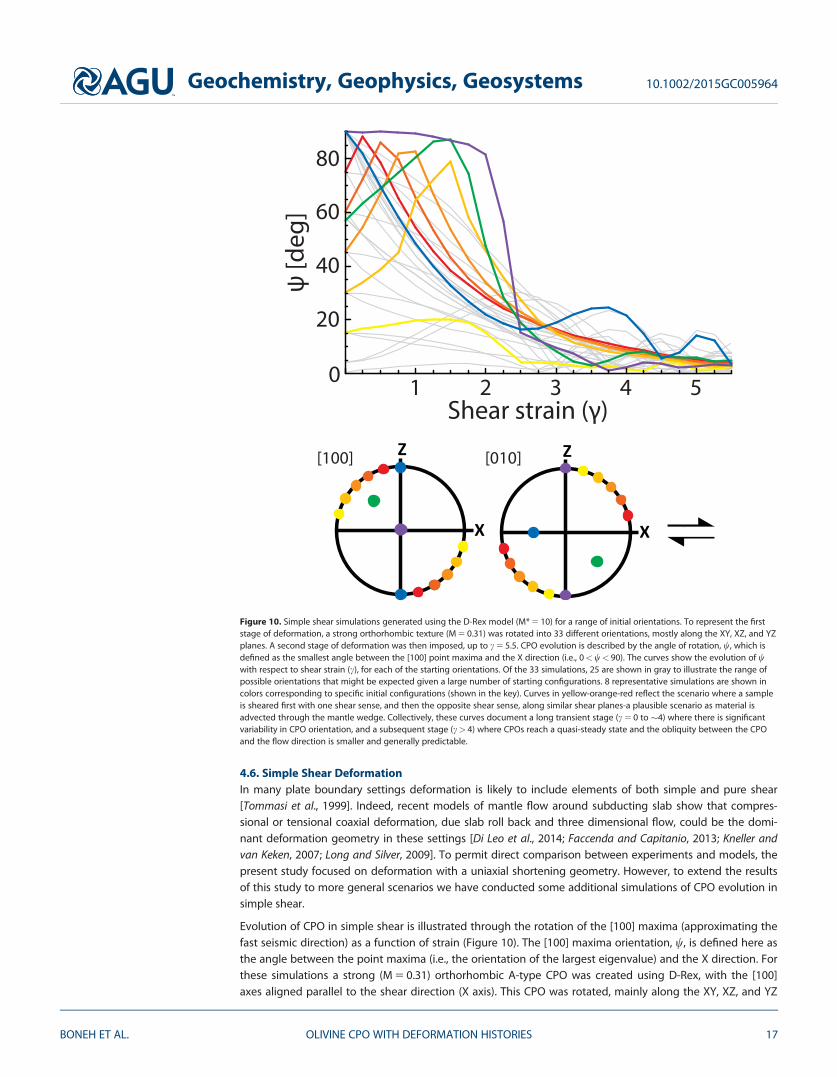
4.6. Simple Shear DeformationIn many plate boundary settings deformation is likely to include elements of both simple and pure shear[Tommasi et al., 1999]. Indeed, recent models of mantle flow around subducting slab show that compres-sional or tensional coaxial deformation, due slab roll back and three dimensional flow, could be the domi-nant deformation geometry in these settings [Di Leo et al., 2014; Faccenda and Capitanio, 2013; Kneller andvan Keken, 2007; Long and Silver, 2009]. To permit direct comparison between experiments and models, thepresent study focused on deformation with a uniaxial shortening geometry. However, to extend the resultsof this study to more general scenarios we have conducted some additional simulations of CPO evolution insimple shear.
Evolution of CPO in simple shear is illustrated through the rotation of the [100] maxima (approximating thefast seismic direction) as a function of strain (Figure 10). The [100] maxima orientation, w, is defined here asthe angle between the point maxima (i.e., the orientation of the largest eigenvalue) and the X direction. Forthese simulations a strong (M 5 0.31) orthorhombic A-type CPO was created using D-Rex, with the [100]axes aligned parallel to the shear direction (X axis). This CPO was rotated, mainly along the XY, XZ, and YZ
Figure 10. Simple shear simulations generated using the D-Rex model (M* 5 10) for a range of initial orientations. To represent the firststage of deformation, a strong orthorhombic texture (M 5 0.31) was rotated into 33 different orientations, mostly along the XY, XZ, and YZplanes. A second stage of deformation was then imposed, up to c 5 5.5. CPO evolution is described by the angle of rotation, w, which isdefined as the smallest angle between the [100] point maxima and the X direction (i.e., 0<w< 90). The curves show the evolution of wwith respect to shear strain (c), for each of the starting orientations. Of the 33 simulations, 25 are shown in gray to illustrate the range ofpossible orientations that might be expected given a large number of starting configurations. 8 representative simulations are shown incolors corresponding to specific initial configurations (shown in the key). Curves in yellow-orange-red reflect the scenario where a sampleis sheared first with one shear sense, and then the opposite shear sense, along similar shear planes-a plausible scenario as material isadvected through the mantle wedge. Collectively, these curves document a long transient stage (c 5 0 to �4) where there is significantvariability in CPO orientation, and a subsequent stage (c> 4) where CPOs reach a quasi-steady state and the obliquity between the CPOand the flow direction is smaller and generally predictable.
Geochemistry, Geophysics, Geosystems 10.1002/2015GC005964
BONEH ET AL. OLIVINE CPO WITH DEFORMATION HISTORIES 17

planes, for a total of 33 different initial orientations. This assortment of initial textures was then deformed insimple shear to a maximum strain of c 5 5.5 (Figure 10). Due to the large strains required for these simula-tions, we show results only for the D-Rex model. The collection of curves shows two stages. At low to mod-erate strains CPO evolution is transient, with the [100] orientation are distributed broadly in orientationspace. Most models exhibit a [100] maxima that is highly oblique to the shear direction, and there is signifi-cant variation amongst the different simulations. The second stage of evolution occurs at larger strains(c> 4), in which a quasi-steady state is reached, and the [100] maximum is generally within 0–108 of theshear direction. Notably, the critical strains required to reset preexisting CPO are quite consistent withobservations from natural samples [Skemer et al., 2012; Warren et al., 2008].
5. Conclusions
In this study, D-Rex and VPSC models are used to evaluate texture evolution of olivine aggregates for a vari-ety of initial conditions, simulating distinct deformation histories. These models were compared with recentexperiments by Boneh and Skemer [2014]. Both experiments and numerical models show that deformationhistory has a significant impact on the evolution of olivine CPO. For each of the initial deformation configu-rations, CPO and the consequent anisotropic signature is observed to evolve differently. Moreover, the evo-lution of CPO in each deformation configuration deviates markedly from the evolution of experiments andmodels initiated with random textures. In a uniaxial deformation geometry to strains of e 5 2, models in var-ious configurations do not converge to the predicted steady state texture. Models run to larger strains insimple shear, appear to converge to steady state textures at c> 3. This is significantly larger than previouslyassumed, but is largely consistent with observations from mantle shear zones. It should also be noted thatthese critical strains for reorientation are similar in magnitude to strains generated by corner-flow in a sub-duction setting [e.g., McKenzie, 1979]. As such, forward or inverse models that seek to relate seismic anisot-ropy to mantle flow must be cautious in their interpretations, as olivine appears to exhibit long transientintervals during which CPO has not reached steady state.
ReferencesAbramson, E. H., M. Brown, L. J. Slutsky, and J. Zaug (1997), The elastic constants of San Carlos olivine up to 17 GPa, J. Geophys. Res., 102,
12,252-12,263.Alpert, L. A., M. S. Miller, T. W. Becker, and A. A. Allam (2013), Structure beneath the Alboran from geodynamic flow models and seismic ani-
sotropy, J. Geophys. Res. Solid Earth, 118, 4265–4277, doi:10.1002/jgrb.50309.Ave Lallemant, H. (1975), Mechanisms of preferred orientations of olivine in tectonite peridotite, Geology, 3, 653.Bachmann, F., R. Hielscher, and H. Schaeben (2010), Texture analysis with MTEX–free and open source software toolbox, Solid State Phe-
nomena, 160, 63–68, doi:10.4028/www.scientific.net/SSP.160.63.Bai, Q., S. J. Mackwell, and D. L. Kohlstedt (1991), High-temperature creep of olivine single crystals 1. Mechanical results for buffered sam-
ples, J. Geophys. Res., 96, 2441–2463, doi:10.1029/90JB01723.Becker, T. W., S. Chevrot, V. Schulte-Pelkum, and D. K. Blackman (2006a), Statistical properties of seismic anisotropy predicted by upper
mantle geodynamic models, J. Geophys. Res., 111, B08309, doi:10.1029/2005JB004095.Becker, T. W., V. Schulte-Pelkum, D. K. Blackman, J. B. Kellogg, and R. J. O’Connell (2006b), Mantle flow under the western United States
from shear wave splitting, Earth Planet. Sci. Lett., 247(3–4), 235–251, doi:10.1016/j.epsl.2006.05.010.Becker, T. W., C. P. Conrad, A. J. Schaeffer, and S. Lebedev (2014), Origin of azimuthal seismic anisotropy in oceanic plates and mantle, Earth
Planet. Sci. Lett., 401, 236–250, doi:10.1016/j.epsl.2014.06.014.Ben Isma€ıl, W., and D. Mainprice (1998), An olivine fabric database: An overview of upper mantle fabrics and seismic anisotropy, Tectono-
physics, 296, 145–157, doi:10.1016/S0040-1951(98)00141-3.Blackman, D. (2007), Use of mineral physics, with geodynamic modelling and seismology, to investigate flow in the Earth’s mantle, Rep.
Prog. Phys., 70(5), 659.Blackman, D. K., and J. M. Kendall (2002), Seismic anisotropy in the upper mantle 2. Predictions for current plate boundary flow models,
Geochem. Geophys. Geosyst., 3(9), 8602, doi:10.1029/2001GC000247.Blackman, D. K., J. Kendall, P. R. Dawson, H. Wenk, D. Boyce, and J. P. Morgan (1996), Teleseismic imaging of subaxial flow at mid-ocean
ridges: Traveltime effects of anisotropic mineral texture in the mantle, Geophys. J. Int., 127(2), 415–426, doi:10.1111/j.1365-246X.1996.tb04730.x.
Boneh, Y., and P. Skemer (2014), The effect of deformation history on the evolution of olivine CPO, Earth Planet. Sci. Lett., 406, 213–222, doi:10.1016/j.epsl.2014.09.018.
Bonnin, M., A. Tommasi, R. Hassani, S. Chevrot, J. Wookey, and G. Barruol (2012), Numerical modelling of the upper-mantle anisotropybeneath a migrating strike-slip plate boundary: The San Andreas Fault system, Geophys. J. Int., 191(2), 436–458, doi:10.1111/j.1365-246X.2012.05650.x.
Casta~neda, P. P. (2002), Second-order homogenization estimates for nonlinear composites incorporating field fluctuations: I—Theory, J.Mech. Phys. Solids, 50(4), 737–757, doi:10.1016/S0022-5096(01)00099-0.
Castelnau, O., R. Brenner, and R. Lebensohn (2006), The effect of strain heterogeneity on the work hardening of polycrystals predicted bymean-field approaches, Acta Materialia, 54(10), 2745–2756, doi:10.1016/j.actamat.2006.02.014.
AcknowledgmentsData supporting Figures 3, 4, 6, and 7are available in supporting informationTables S1 and S2 and Table 1 fromBoneh and Skemer [2014]. This workwas supported by NSF EAR-1141795(to PS). The authors thank Andr�eaTommasi and two anonymousreviewers for their constructivecomments, and Andrew Cross forhelpful discussions.
Geochemistry, Geophysics, Geosystems 10.1002/2015GC005964
BONEH ET AL. OLIVINE CPO WITH DEFORMATION HISTORIES 18
Castelnau, O., D. Blackman, R. Lebensohn, and P. Ponte Casta~neda (2008), Micromechanical modeling of the viscoplastic behavior of oli-vine, J. Geophys. Res., 113, B09202, doi:10.1029/2007JB005444.
Castelnau, O., D. Blackman, and T. Becker (2009), Numerical simulations of texture development and associated rheological anisotropy inregions of complex mantle flow, Geophys. Res. Lett., 36, L12304, doi:10.1029/2009GL038027.
Castelnau, O., P. Cordier, R. Lebensohn, S. Merkel, and P. Raterron (2010), Microstructures and rheology of the Earth’s upper mantle inferredfrom a multiscale approach, C. R. Phys., 11(3), 304–315, doi:10.1016/j.crhy.2010.07.011.
Chastel, Y. B., P. R. Dawson, H. R. Wenk, and K. Bennett (1993), Anisotropic convection with implications for the upper mantle, J. Geophys.Res., 98, 17,757-17,771.
Chopra, P. N., and M. S. Paterson (1981), The experimental deformation of dunite, Tectonophysics, 78, 453–473, doi:10.1016/0040-1951(81)90024-X.
Chopra, P. N., and M. S. Paterson (1984), The role of water in the deformation of dunite, J. Geophys. Res., 89, 7861–7876.Conder, J. A., and D. A. Wiens (2007), Rapid mantle flow beneath the Tonga volcanic arc, Earth Planet. Sci. Lett., 264(1), 299–307, doi:
10.1016/j.epsl.2007.10.014.Conrad, C. P., M. D. Behn, and P. G. Silver (2007), Global mantle flow and the development of seismic anisotropy: Differences between the
oceanic and continental upper mantle, J. Geophys. Res., 112, B07317, doi:10.1029/2006JB004608.Detrez, F., O. Castelnau, P. Cordier, S. Merkel, and P. Raterron (2015), Effective viscoplastic behavior of polycrystalline aggregates lacking
four independent slip systems inferred from homogenization methods; application to olivine, J. Mech. Phys. Solids, 83, 199–220, doi:10.1016/j.jmps.2015.05.022.
Di Leo, J., A. Walker, Z. H. Li, J. Wookey, N. Ribe, J. M. Kendall, and A. Tommasi (2014), Development of texture and seismic anisotropy dur-ing the onset of subduction, Geochem. Geophys. Geosyst., 15, 192–212, doi:10.1002/2013GC005032.
Druken, K., M. Long, and C. Kincaid (2011), Patterns in seismic anisotropy driven by rollback subduction beneath the High Lava Plains, Geo-phys. Res. Lett., 38, L13310, doi:10.1029/2011GL047541.
Druken, K., C. Kincaid, and R. Griffiths (2013), Directions of seismic anisotropy in laboratory models of mantle plumes, Geophys. Res. Lett.,40, 3544–3549, doi:10.1002/grl.50671.
Durham, W. B., and C. Goetze (1977), Plastic flow of oriented single crystals of olivine 1. Mechanical data, J. Geophys. Res., 82, 5737–5753.Eshelby, J. D. (1957), The determination of the elastic field of an ellipsoidal inclusion, and related problems, in Proceedings of the Royal Soci-
ety of London A: Mathematical, Physical and Engineering Sciences, 241(1226), 376–396.Faccenda, M., and F. Capitanio (2013), Seismic anisotropy around subduction zones: Insights from three-dimensional modeling of upper
mantle deformation and SKS splitting calculations, Geochem. Geophys. Geosyst., 14, 243–262, doi:10.1002/ggge.20055.Faccenda, M., and F. A. Capitanio (2012), Development of mantle seismic anisotropy during subduction-induced 3-D flow, Geophys. Res.
Lett., 39, L11305, doi:10.1029/2012GL051988.Falus, G., A. Tommasi, and V. Soustelle (2011), The effect of dynamic recrystallization on olivine crystal preferred orientations in mantle
xenoliths deformed under varied stress conditions, J. Struct. Geol., 33(11), 1528–1540, doi:10.1016/j.jsg.2011.09.010.Hansen, L. N., M. E. Zimmerman, and D. L. Kohlstedt (2012), Laboratory measurements of the viscous anisotropy of olivine aggregates,
Nature, 492(7429), 415–418, doi:10.1038/nature11671.Hansen, L. N., Y.-H. Zhao, M. E. Zimmerman, and D. L. Kohlstedt (2014), Protracted fabric evolution in olivine: Implications for the
relationship among strain, crystallographic fabric, and seismic anisotropy, Earth Planet. Sci. Lett., 387, 157–168, doi:10.1016/j.epsl.2013.11.009.
Hedjazian, N., and E. Kaminski (2014), Defining a proxy for the interpretation of seismic anisotropy in non-Newtonian mantle flows, Geo-phys. Res. Lett., 41, 7065–7072, doi:10.1002/2014GL061372.
Higgie, K., and A. Tommasi (2012), Feedbacks between deformation and melt distribution in the crust–mantle transition zone of the Omanophiolite, Earth Planet. Sci. Lett., 359, 61–72, doi:10.1016/j.epsl.2012.10.003.
Jackson, I., M. Paterson, and J. Fitz Gerald (1992), Seismic wave dispersion and attenuation in Åheim dunite: An experimental study, Geo-phys. J. Int., 108(2), 517–534, doi:10.1111/j.1365-246X.1992.tb04633.x.
Jung, H., and S.-i. Karato (2001), Water-induced fabric transitions in olivine, Science, 293, 1460–1463, doi:10.1126/science.1062235.Kaminski, �E., and N. M. Ribe (2001), A kinematic model for recrystallization and texture development in olivine polycrystals, Earth Planet.
Sci. Lett., 189(3–4), 253–267, doi:10.1016/S0012-821X(01)00356-9.Kaminski, �E., and N. M. Ribe (2002), Timescales for the evolution of seismic anisotropy in mantle flow, Geochem. Geophys. Geosyst., 3(8),
1051, doi:10.1029/2001GC000222.Kaminski, �E., N. M. Ribe, and J. T. Browaeys (2004), D-Rex, a program for calculation of seismic anisotropy due to crystal lattice preferred ori-
entation in the convective upper mantle, Geophys. J. Int., 158(2), 744–752, doi:10.1111/j.1365-246X.2004.02308.x.Karato, S., M. S. Paterson, and J. D. FitzGerald (1986), Rheology of synthetic olivine aggregates: Influence of grain size and water, J. Geophys.
Res., 91, 8151–8176.Karato, S.-i., H. Jung, I. Katayama, and P. Skemer (2008), Geodynamic significance of seismic anisotropy of the upper mantle: New insights
from laboratory studies, Annu. Rev. Earth Planet. Sci., 36, 59–95, doi:10.1146/annurev.earth.36.031207.124120.Keefner, J. W., S. J. Mackwell, D. L. Kohlstedt, and F. Heidelbach (2011), Dependence of dislocation creep of dunite on oxygen fugacity:
Implications for viscosity variations in Earth’s mantle, J. Geophys. Res., 116, B05201, doi:10.1029/2010JB007748.Kneller, E. A., and P. E. van Keken (2007), Trench-parallel flow and seismic anisotropy in the Mariana and Andean subduction systems,
Nature, 450(7173), 1222–1225, doi:10.1038/nature06429.Knoll, M., A. Tommasi, R. E. Log�e, and J. W. Signorelli (2009), A multiscale approach to model the anisotropic deformation of lithospheric
plates, Geochem. Geophys. Geosyst., 10, Q08009, doi:10.1029/2009GC002423.Lassak, T. M., M. J. Fouch, C. E. Hall, and �E. Kaminski (2006), Seismic characterization of mantle flow in subduction systems: Can we resolve
a hydrated mantle wedge?, Earth Planet. Sci. Lett., 243(3), 632–649, doi:10.1016/j.epsl.2006.01.022.Lebensohn, R., and C. Tom�e (1993), A self-consistent anisotropic approach for the simulation of plastic deformation and texture develop-
ment of polycrystals: Application to zirconium alloys, Acta Metall. Mater., 41(9), 2611–2624, doi:10.1016/0956-7151(93)90130-K.Li, Z. H., J. F. Di Leo, and N. M. Ribe (2014), Subduction-induced mantle flow, finite strain and seismic anisotropy: Numerical modeling, J.
Geophys. Res. Solid Earth, 119, 5052–5076, doi:10.1002/2014JB010996.Long, M. D., and P. G. Silver (2009), Mantle flow in subduction systems: The subslab flow field and implications for mantle dynamics, J. Geo-
phys. Res., 114, B10312, doi:10.1029/2008JB006200.Mainprice, D. (1990), A fortran program to calculate seismic anisotropy from the lattice preferred orientation of minerals, Comput. Geosci.,
16(3), 385–393, doi:10.1016/0098-3004(90)90072-2.
Geochemistry, Geophysics, Geosystems 10.1002/2015GC005964
BONEH ET AL. OLIVINE CPO WITH DEFORMATION HISTORIES 19

Mainprice, D. (2015), 2.20—Seismic anisotropy of the deep earth from a mineral and rock physics perspective, in Treatise on Geophysics,2nd ed., edited by G. Schubert, pp. 487–538, Elsevier, Oxford, U. K.
Mainprice, D., R. Hielscher, and H. Schaeben (2011), Calculating anisotropic physical properties from texture data using the MTEX open-source package, Geol. Soc. Spec. Publ., 360(1), 175–192, doi:10.1144/SP360.10.
Mainprice, D., F. Bachmann, R. Hielscher, and H. Schaeben (2014), Descriptive tools for the analysis of texture projects with large datasetsusing MTEX: Strength, symmetry and components, Geol. Soc. Spec. Publ., 409, doi:10.1144/SP409.8.
McKenzie, D. (1979), Finite deformation during fluid flow, Geophys. J. R. Astron. Soc., 58(3), 689–715, doi:10.1111/j.1365-246X.1979.tb04803.x.
Molinari, A., G. R. Canova, and S. Azhy (1987), A self-consistent approach of the large deformation crystal polycrystal viscoplasticity, ActaMetall., 35, 2983–2994, doi:10.1016/0001-6160(87)90297-5.
Morales, L. F. G., and A. Tommasi (2011), Composition, textures, seismic and thermal anisotropies of xenoliths from a thin and hot litho-spheric mantle (Summit Lake, southern Canadian Cordillera), Tectonophysics, 507(1), 1–15, doi:10.1016/j.tecto.2011.04.014.
Nicolas, A., and N. I. Christensen (1987), Formation of anisotropy in upper mantle peridotites—A review, in Composition, Structure andDynamics of the Lithosphere-Astenosphere System, edited by K. Fuchs and C. Froidevaux, AGU, Washington, D. C.
Nicolas, A., F. Boudier, and A. M. Boullier (1973), Mechanism of flow in naturally and experimentally deformed peridotites, Am. J. Sci., 273,853–876.
Paczkowski, K., L. G. Mont�esi, M. D. Long, and C. J. Thissen (2014), Three-dimensional flow in the subslab mantle, Geochem. Geophys. Geo-syst., 15, 3989–4008, doi:10.1002/2014GC005441.
Raterron, P., F. Detrez, O. Castelnau, C. Bollinger, P. Cordier, and S. Merkel (2014), Multiscale modeling of upper mantle plasticity: Fromsingle-crystal rheology to multiphase aggregate deformation, Phys. Earth Planet. Inter., 228, 232–243, doi:10.1016/j.pepi.2013.11.012.
Ribe, N. M., and Y. Yu (1991), A theory for plastic deformation and textural evolution of olivine polycrystals, J. Geophys. Res., 96, 8325–8335.Sachs, G. (1928), Plasticity problems in metals, Trans. Faraday Soc., 24, 84–92, doi:10.1039/TF9282400084.Savransky, D., and N. J. Kasdin (2012), An efficient method for extracting Euler angles from direction cosine matrices, Unpublished manu-
script. [Available at (http://spaceisbig.net/docs/findEulerAngs.pdf.]Skemer, P., and S.-i. Karato (2008), Sheared lherzolite xenoliths revisited, J. Geophys. Res., 113, B07205, doi:10.1029/2007JB005286.Skemer, P., I. Katayama, Z. Jiang, and S.-i. Karato (2005), The misorientation index: Development of a new method for calculating the
strength of lattice-preferred orientation, Tectonophysics, 411(1), 157–167, doi:10.1016/j.tecto.2005.08.023.Skemer, P., J. M. Warren, P. B. Kelemen, and G. hirth (2010), Microstructural and Rheological Evolution of a Mantle Shear Zone, J. Petrol.,
51(1-2), 43–53, doi:10.1093/petrology/egp057.Skemer, P., M. Sundberg, G. Hirth, and R. Cooper (2011), Torsion experiments on coarse-grained dunite: Implications for microstructural
evolution when diffusion creep is suppressed, Geol. Soc. Spec. Publ., 360(1), 211–223, doi:10.1144/SP360.12.Skemer, P., J. M. Warren, and G. Hirth (2012), The influence of deformation history on the interpretation of seismic anisotropy, Geochem.
Geophys. Geosyst., 13, Q03006, doi:10.1029/2011GC003988.Signorelli, J., and A. Tommasi (2015), Modeling the effect of subgrain rotation recrystallization on the evolution of olivine crystal preferred
orientations in simple shear, Earth Planet. Sci. Lett., 430, 356–366.Taylor, G. I. (1938), Plastic strain in metals, J. Inst. Met., 62, 307–324.Tommasi, A. (1998), Forward modeling of the development of seismic anisotropy in the upper mantle, Earth Planet. Sci. Lett., 160, 1–13,
doi:10.1016/S0012-821X(98)00081-8.Tommasi, A., B. Tikoff, and A. Vauchez (1999), Upper mantle tectonics: Three-dimensional deformation, olivine crystallographic fabric and
seismic properties, Earth Planet. Sci. Lett., 168, 173–186, doi:10.1016/S0012-821X(99)00046-1.Tommasi, A., D. Mainprice, G. Canova, and Y. Chastel (2000), Viscoplastic self-consistent and equilibrium-based modeling of olivine lattice
preferred orientations: Implications for upper mantle seismic anisotropy, J. Geophys. Res., 105, 7893–7908, doi:10.1029/1999JB900411.Tommasi, A., A. Vauchez, and D. A. Ionov (2008), Deformation, static recrystallization, and reactive melt transport in shallow subcontinental
mantle xenoliths (Tok Cenozoic volcanic field, SE Siberia), Earth Planet. Sci. Lett., 272(1–2), 65–77, doi:10.1016/j.epsl.2008.04.020.Tommasi, A., M. Knoll, A. Vauchez, J. W. Signorelli, C. Thoraval, and R. Loge (2009), Structural reactivation in plate tectonics controlled by oli-
vine crystal anisotropy, Nat. Geosci., 2(6), 423–427, doi:10.1038/ngeo528.Van der Wal, D., P. Chopra, M. Drury, and J. F. Gerald (1993), Relationships between dynamically recrystallized grain size and deformation
conditions in experimentally deformed olivine rocks, Geophys. Res. Lett., 20, 1479–1482.Vauchez, A., F. Dineur, and R. Rudnick (2005), Microstructure, texture and seismic anisotropy of the lithospheric mantle above a mantle
plume: Insights from the Labait volcano xenoliths (Tanzania), Earth Planet. Sci. Lett., 232(3), 295–314, doi:10.1016/j.epsl.2005.01.024.Vollmer, F. W. (1990), An application of eigenvalue methods to structural domain analysis, Geol. Soc. Am. Bull., 102(6), 786–791, doi:
10.1130/0016-7606(1990)102< 0786:AAOEMT>2.3.CO;2.Warren, J. M., and G. Hirth (2006), Grain size sensitive deformation mechanisms in naturally deformed peridotites, Earth Planet. Sci. Lett.,
248(1–2), 438–450, doi:10.1016/j.epsl.2006.06.006.Warren, J. M., G. Hirth, and P. B. Kelemen (2008), Evolution of olivine lattice preferred orientation during simple shear in the mantle, Earth
Planet. Sci. Lett., 272(3–4), 501–512, doi:10.1016/j.epsl.2008.03.063.Webber, C., J. Newman, C. W. Holyoke III, T. Little, and B. Tikoff (2010), Fabric development in cm-scale shear zones in ultramafic rocks, Red
Hills, New Zealand, Tectonophysics, 489(1), 55–75, doi:10.1016/j.tecto.2010.04.001.Wendt, A. S., D. Mainprice, E. Rutter, and R. Wirth (1998), A joint study of experimental deformation and experimentally induced microstruc-
tures of pretextured peridotites, J. Geophys. Res., 103, 18,205-18,221.Wenk, H. R., K. Bennett, G. R. Canova, and A. Molinari (1991), Modelling plastic deformation of peridotite with the self-consistent theory, J.
Geophys. Res., 96, 8337–8349.Wheeler, J. (2009), The preservation of seismic anisotropy in the Earth’s mantle during diffusion creep, Geophys. J. Int., 178(3), 1723–1732,
doi:10.1111/j.1365-246X.2009.04241.x.Zhang, S., and S.-i. Karato (1995), Lattice preferred orientation of olivine aggregates deformed in simple shear, Nature, 375(6534), 774–777,
doi:10.1038/375774a0.Zhang, S., S.-i. Karato, J. Fitzgerald, U. H. Faul, and Y. Zhou (2000), Simple shear deformation of olivine aggregates, Tectonophysics, 316,
133–152, doi:10.1016/S0040-1951(99)00229-2.
Geochemistry, Geophysics, Geosystems 10.1002/2015GC005964
BONEH ET AL. OLIVINE CPO WITH DEFORMATION HISTORIES 20