modeling of fixed-exit porous bleed systems
TRANSCRIPT

John W. Slater and John D. SaundersGlenn Research Center, Cleveland, Ohio
Modeling of Fixed-Exit Porous Bleed Systems
NASA/TM—2008-215178
May 2008
AIAA–2008–0094

NASA STI Program . . . in Profi le
Since its founding, NASA has been dedicated to the advancement of aeronautics and space science. The NASA Scientifi c and Technical Information (STI) program plays a key part in helping NASA maintain this important role.
The NASA STI Program operates under the auspices of the Agency Chief Information Offi cer. It collects, organizes, provides for archiving, and disseminates NASA’s STI. The NASA STI program provides access to the NASA Aeronautics and Space Database and its public interface, the NASA Technical Reports Server, thus providing one of the largest collections of aeronautical and space science STI in the world. Results are published in both non-NASA channels and by NASA in the NASA STI Report Series, which includes the following report types: • TECHNICAL PUBLICATION. Reports of
completed research or a major signifi cant phase of research that present the results of NASA programs and include extensive data or theoretical analysis. Includes compilations of signifi cant scientifi c and technical data and information deemed to be of continuing reference value. NASA counterpart of peer-reviewed formal professional papers but has less stringent limitations on manuscript length and extent of graphic presentations.
• TECHNICAL MEMORANDUM. Scientifi c
and technical fi ndings that are preliminary or of specialized interest, e.g., quick release reports, working papers, and bibliographies that contain minimal annotation. Does not contain extensive analysis.
• CONTRACTOR REPORT. Scientifi c and
technical fi ndings by NASA-sponsored contractors and grantees.
• CONFERENCE PUBLICATION. Collected
papers from scientifi c and technical conferences, symposia, seminars, or other meetings sponsored or cosponsored by NASA.
• SPECIAL PUBLICATION. Scientifi c,
technical, or historical information from NASA programs, projects, and missions, often concerned with subjects having substantial public interest.
• TECHNICAL TRANSLATION. English-
language translations of foreign scientifi c and technical material pertinent to NASA’s mission.
Specialized services also include creating custom thesauri, building customized databases, organizing and publishing research results.
For more information about the NASA STI program, see the following:
• Access the NASA STI program home page at http://www.sti.nasa.gov
• E-mail your question via the Internet to help@
sti.nasa.gov • Fax your question to the NASA STI Help Desk
at 301–621–0134 • Telephone the NASA STI Help Desk at 301–621–0390 • Write to:
NASA Center for AeroSpace Information (CASI) 7115 Standard Drive Hanover, MD 21076–1320

John W. Slater and John D. SaundersGlenn Research Center, Cleveland, Ohio
Modeling of Fixed-Exit Porous Bleed Systems
NASA/TM—2008-215178
May 2008
AIAA–2008–0094
National Aeronautics andSpace Administration
Glenn Research CenterCleveland, Ohio 44135
Prepared for the46th Aerospace Sciences Meeting and Exhibitsponsored by the American Institute of Aeronautics and AstronauticsReno, Nevada, January 7–10, 2008

Acknowledgments
The authors wish to thank Dr. Charles Trefny of the NASA Glenn Research Center for benefi cial technical discussions. The authors also wish to thank the sponsors of this work including the NASA Glenn Research Center, Fundamental Aeronautics
Program, Hypersonics Project (Mr. James L. Pittman, Principal Investigator) and the Offi ce of Naval Research (ONR) (Dr. Joseph Doychak, Program Manager, Code 351). Funding by ONR for this effort used Space Act Agreement NAS3–598
between NASA Glenn Research Center and NAVAIR Propulsion and Power Engineering Department (Mr. William Voorhees, Chief Technology Offi cer).
Available from
NASA Center for Aerospace Information7115 Standard DriveHanover, MD 21076–1320
National Technical Information Service5285 Port Royal RoadSpringfi eld, VA 22161
Available electronically at http://gltrs.grc.nasa.gov
Level of Review: This material has been technically reviewed by technical management.

NASA/TM—2008-215178 1
Modeling of Fixed-Exit Porous Bleed Systems
John W. Slater and John D. Saunders National Aeronautics and Space Administration
Glenn Research Center Cleveland, Ohio 44135
Abstract A model has been developed to simulate a fixed-exit porous bleed system for supersonic inlets. The
fixed-exit model allows the amount of bleed flow to vary according to local flow conditions and fixed-exit characteristics of the bleed system. This variation is important for the control of shock-wave/ boundary-layer interactions within the inlet. The model computes the bleed plenum static pressure rather than requiring its specification. The model was implemented in the Wind-US computational fluid dynamics code. The model was then verified and validated against experimental data for bleed on a flat plate with and without an impinging oblique shock and for bleed in a Mach 3.0 axisymmetric, mixed-compression inlet. The model was able to accurately correlate the plenum pressures with bleed rates and simulate the effect of the bleed on the downstream boundary layer. Further, the model provided a realistic simulation of the initiation of inlet unstart. The results provide the most in-depth examination to date of bleed models for use in the simulation of supersonic inlets. The results also highlight the limitations of the models and aspects that require further research.
Introduction A major challenge in the design of an inlet for an air-breathing propulsion system for an aircraft
capable of sustained supersonic flight is the establishment of an efficient and stable shock system for the compression and deceleration of the flow through the inlet (refs. 1 and 2). Interactions between the shock waves and the turbulent boundary layers along the surfaces of the inlet can lead to boundary-layer separation. This can lead to decreased performance and perhaps instability in the propulsion system. For a mixed-compression, supersonic inlet, the instability will manifest itself as an “unstart” in which the internal shock system is disgorged from the inlet. This greatly increases drag and may lead to stall and blow out of the gas turbine engine.
One option for alleviating the adverse effects of shock/boundary-layer interactions is the placement of porous bleed regions on the inlet surfaces in the vicinity of the interactions—usually ahead of such interactions (refs. 1 to 5). Porous bleed consists of perforations in the surfaces through which a small fraction of the inlet core flow is extracted. The perforations are usually circular holes with a diameter much smaller than the inlet scales (e.g., inlet length or diameter). The bleed holes are usually located on the surfaces in bands or groups of rows. The number of bleed holes in a surface can be in the hundreds. The bleed flow enters a plenum and then is ducted from the plenum through a plenum exit. The extracted flow is mostly the lower-momentum flow of the boundary layer. This leaves the remaining boundary layer with a higher average momentum, which improves its ability to withstand boundary-layer separation. A secondary operation of bleed is to help stabilize the terminal shock within the inlet throat, which is the location of minimum flow cross-sectional area where the flow is slightly above sonic speed before the terminal shock. Downstream of terminal shock, the flow is subsonic. As the terminal shock encounters the bleed regions in the throat, the increased level of bleed inhibits the upstream motion of the shock.
The methods of computational fluid dynamics (CFD) have been shown to be effective for supersonic inlet design and analysis (ref. 6). The simulation of the bleed regions and their affect on the flow is a critical aspect of such analysis. Studies have been conducted to directly simulate the flow through a limited number of bleed holes (refs. 7 to 9). The flow is characterized by shock waves, regions of

NASA/TM—2008-215178 2
separation, and acceleration to supersonic speeds depending on the bleed rate. The small scale of the porous bleed holes and the shear number of bleed holes in an inlet has led to the development of global bleed models that capture the overall effect of the bleed region rather than resolving the flow through each bleed hole (refs. 10 to 13). Mayer and Paynter developed a porous bleed model, which allowed the bleed rate to vary according to local conditions and applied it to the analysis of unsteady flow in supersonic inlets (ref. 10). The Mayer-Paynter bleed model used a table lookup of empirical data (refs. 1 and 14) for flow through bleed holes as the basis of their model. This model was implemented in the Wind-US CFD code (ref. 15) and represents the current state of bleed modeling in a production CFD flow solver. The supersonic inlet analyses of reference 6 demonstrated the use of this bleed model. The bleed model assumed that the bleed plenum static pressure was maintained at a constant, specified value—a constant-pressure bleed model. Such an assumption implies that a bleed system has a control system to adjust the plenum pressure by changing the area of the bleed plenum exit (ref. 4). Such a control system adds complexity and weight to the inlet. A less complex approach is to fix the area of the plenum exit and allow the plenum pressure to vary within an acceptable range. The objective of this paper is to introduce a modification to the Mayer-Paynter, constant-pressure bleed model to impose the condition of a fixed-exit for the porous bleed plenum—a fixed-exit bleed model.
The next section will further describe the porous bleed system and its modeling using the Mayer-Paynter bleed model and the fixed-exit modification. The modification was implemented in the Wind-US CFD flow solver and then applied to the analysis of several applications involving supersonic flow with bleed. The first application was a uniform, supersonic flow over a flat plate with bleed. The second application extended the first with inclusion of an oblique shock that interacted with the bleed region. Both applications allowed examination, verification, and validation of the operation of the bleed models for basic flow fields. The third application was a Mach 3.0 axisymmetric, mixed-compression inlet that contained four porous bleed regions.
Porous Bleed System Description and Modeling A schematic of a porous bleed system representative of those found in a supersonic inlet is shown in
figure 1. The core inlet flow is shown at the bottom of the figure with a turbulent boundary layer formed on the surface of the inlet. The inlet surface contains a porous bleed region through which an amount of bleed flow Wbleed is extracted from the core inlet flow and drawn into the plenum. The porous bleed region is characterized by the bleed porosityΦ, which is the ratio of the sum of the cross-sectional area of all the bleed holes Ableed in the bleed region and the surface area of the bleed region Aregion. The arrows show the relative amount of flow through each bleed hole into the plenum. The plenum is assumed to be of a large enough volume such that the bleed flow stagnates with Mplenum ≈ 0. The plenum can be characterized by a static pressure pplenum, which is approximately equal to the total pressure in the plenum, pt plenum, due to the
Figure 1. —Schematic of a fixed-exit bleed system.

NASA/TM—2008-215178 3
stagnation of the flow. In this schematic, the inlet core flow contains a normal or terminal shock located over the bleed region. The longer arrows from the bleed holes downstream of the shock represent the larger amount of flow expected through them due to the increase in static pressure across the normal shock. The bleed flow exits the plenum through an exit characterized by an exit area Aexit, which is the minimum cross-sectional area the flow encounters as it exits the plenum. The flow leaving the bleed plenum through the exit is Wexit. While the schematic shows a short, simple exit duct, some bleed plenums may have a much longer and convoluted exit duct. For example, a bleed plenum for a bleed region on the centerbody of an axisymmetric inlet may have a duct that is directed through the centerbody and then through a support strut. The losses as the flow exits through the exit duct and exit are characterized by a discharge coefficient, CD, which is the ratio of the actual flow to the ideal flow possible with isentropic flow. The static pressure of the exit, pexit, is assumed to occur at the location of Aexit and for the schematic shown, would be approximately equal to the static pressure of the exterior flow. It is desirable to operate the bleed system such that the exit flow is choked at the exit area location. This ensures that the external flow does not enter the bleed plenum.
The development of the porous bleed model starts with the flow balance illustrated in figure 1. That is, the flow rate for the bleed region Wbleed must equal the rate of flow entering the bleed plenum through the bleed holes Wholes, which must also equal the rate of flow exiting the bleed plenum through the bleed plenum exit Wexit, or
exitholesbleed WWW == (1) The rate of flow entering the bleed plenum through the bleed holes, Wholes, is modeled with the relation
( ) ( )[ ]12/12/1
21 −γ+γ−
δδ ⎟
⎠⎞
⎜⎝⎛ +γ
⎟⎟⎠
⎞⎜⎜⎝
⎛ γ=
ttbleedsonicholes TR
pAQW (2)
The rate of flow exiting the bleed plenum through the bleed plenum exit, Wexit, is modeled with the relation
( ) ( )[ ]12/1
22/1
211
−γ+γ−
⎟⎠⎞
⎜⎝⎛ −γ+⎟
⎟⎠
⎞⎜⎜⎝
⎛ γ= exit
plenumtplenumexitDexit M
TRpACW (3)
In equation (2), Wholes is evaluated using the total conditions at the edge of the boundary layer sweeping over the bleed region. The Qsonic is the sonic flow coefficient, which is the ratio of the actual bleed flow to the reference flow based on the assumption of ideal sonic flow through the bleed holes. The Qsonic is evaluated based on empirical data collected from experiments of uniform flow over a flat plate containing porous bleed regions (refs. 1, 14, and 16). The variation of is primarily correlated to the Mach number at the edge of the approaching boundary layer, Mδ, and the plenum pressure ratio, pplenum/ptδ. The sonic flow coefficient is dependent on the geometric properties of the bleed hole, such as the angle, diameter, shape, etc., of the hole, as well as other factors not defined here. Willis, Davis, and Hingst provide a study on how the sonic flow coefficient varies with a variation of some of these factors (ref. 16). An analytic correlation for has also been the topic of research and will be the focus of future study (refs. 11 and 13).
In equation (3), Wexit is evaluated using the total conditions of the bleed plenum. Since the Mach number in the bleed plenum is assumed to be very small, the total pressure of the plenum is assumed to be equal to the static pressure of the plenum, pplenum. The total temperature in the plenum is assumed to be equal to the total temperature at the edge of the boundary layer based on an assumption of adiabatic flow. It is assumed that the area of the exit, Aexit is defined and known as an input to the model. The Mach number at the bleed plenum exit, Mexit, depends on the static pressure at the plenum exit, pexit. If pexit/pplenum

NASA/TM—2008-215178 4
<0.528, then the bleed plenum exit is choked and equation (3) is evaluated with Mexit = 1. If pexit/pplenum >0.528, the flow through the bleed plenum exit is subsonic. If it is assumed the subsonic flow through the bleed exit is isentropic, then Mexit can be found from the definition of total pressure. The discharge coefficient CD is dependent on flow conditions and exit geometry. For this model, CD is assumed to be a known constant.
The bleed plenum static pressure pplenum is the independent variable that controls the flow through the bleed holes Wholes and the flow through the bleed plenum exit Wexit. Figure 2 shows an example of how both flows vary with respect to pplenum. If the pplenum is equal to the local static pressure at the surface of the inlet, then Wholes = 0 and Qsonic = 0. As pplenum decreases, Wholes and Qsonic increase. Eventually, the flow through the bleed holes chokes and the Wholes and Qsonic reach a maximum. Equation (3) for the variation of Wexit with respect to pplenum is also plotted in figure 2. If the pplenum = pexit, then Wexit = 0. As pplenum increases, the flow through the exit is subsonic and increases until the flow chokes at the exit. As pplenum increases further, Wexit increases linearly. The flow balance of equation (1) indicates that the bleed system will operate at the pplenum at which the two curves described above intersect, as shown in figure 2. Thus, the fixed-exit bleed model is an iteration to find the intersection of equations (2) and (3).
The bleed boundary condition is imposed for all the surface grid points contained within the bleed region. The bleed model assumes a continuous bleed over the bleed region rather than identifying discrete holes. The effect of the bleed is to set the normal velocity component in the manner of
BB
holesN A
Wvρ
= (4)
The AB is the boundary surface area associated with a surface grid point. The area of the bleed holes
within AB is defined by
Bbleed AA Φ= (5)
Equation (2) defines Wholes and requires the flow conditions at the edge of the boundary layer above the surface grid point (Mδ, ptδ, and Ttδ). This is done by identifying a solution grid point at the edge of the boundary layer and evaluating the conditions at that solution point. The empirical basis for Qsonic correlates Qsonic with respect to Mδ and ptδ of the boundary layer approaching the bleed region. A major
0.00
0.05
0.10
0.15
0.20
0.0 0.1 0.2 0.3 0.4
Bleed Plenum Pressure Ratio
Son
ic F
low
Coe
ffici
ent Bleed
Subsonic Exit
Choked Exit
Choked
Subsonic
A
Eq. 2
Eq. 3, Mexit < 1
Eq. 3, Mexit = 1
B
C
0.00
0.05
0.10
0.15
0.20
0.0 0.1 0.2 0.3 0.4
Bleed Plenum Pressure Ratio
Son
ic F
low
Coe
ffici
ent Bleed
Subsonic Exit
Choked Exit
Choked
Subsonic
Choked
Subsonic
Choked
Subsonic
A
Eq. 2
Eq. 3, Mexit < 1
Eq. 3, Mexit = 1
B
C
Figure 2.—The variations of the flow through the bleed holes and
the bleed plenum exit. Point A occurs when the plenum pressure equals the exit pressure. Point B occurs when the plenum pressure equals the surface static pressure. Point C occurs when flow through the bleed holes equals the flow through the bleed plenum exit.

NASA/TM—2008-215178 5
assumption of the model is that evaluating Qsonic in this manner is suitable for general flow fields. This characteristic of the bleed model may not be ideal, especially when the edge of the boundary layer is not well defined. One example is a shock/boundary-layer interaction with boundary-layer separation. There exists a wide variation in the location of the boundary-layer edge. Further, the Mach number and pressures change discontinuously. One possible alternative approach is to correlate Qsonic with respect to surface properties. One result of computational studies was the decision to evaluate ptδ using the static pressure at the surface grid point and Mδ. This approach seemed to provide a more realistic bleed distribution than using ptδ calculated at the boundary layer edge and is used for all of the applications of this paper. The normal component of velocity evaluated by equation (4) is then combined with the tangential component of velocity, which is determined using either a slip or no-slip wall boundary condition. It is recognized that the bleed induces a tangential component of velocity in addition to the normal component. The current bleed model does not account for that tangential component. Further, the current bleed model does not allow the normal velocity component to be directed into the inlet core flow, which would involve injection of flow from the bleed plenum into the core flow. These topics will be the subject of future research.
CFD Simulation Methods The simulations of this paper were performed using the Wind-US CFD code (ref. 15). Wind-US is
being developed by the NPARC Alliance (National Program for Applications-Oriented Research in CFD), which is an alliance of the NASA Glenn Research Center, the U.S. Air Force Arnold Engineering Development Center, and the Boeing Company. Wind-US solves the Reynolds-averaged Navier-Stokes equations for turbulent, compressible flows using a cell-vertex, finite-volume, time-marching approach. The cell-face fluxes are computed using a second-order Roe flux-difference splitting upwind-biased formulation. Steady flows are solved in a time-dependant manner using a first-order, Euler implicit method with local time stepping. The fixed-exit bleed model was implemented by modifying the existing Mayer-Paynter, constant-pressure bleed model to seek the bleed plenum pressure for each bleed region such that equation (1) is satisfied.
The simulations were performed using multiblock, structured grids. The grids resolved the turbulent boundary layers to a nondimensional wall spacing of approximately y+≈4. The stretching between successive grid points was kept below 20 percent. The simulations were performed using grids of various grid cell sizes to examine grid convergence. The convergence of the bleed rates was used to assess grid convergence. A consistent finding was that a streamwise grid spacing of 0.4 times the diameter of the bleed hole was sufficient to produce an approximately grid-independent solution. This produced a much finer grid than if total pressure recovery was used to assess grid convergence. The critical aspect for grid convergence seemed to be the proper resolution of the impinging shocks of a shock/boundary-layer interaction within a bleed region.
The simulations were performed using both the one-equation Spalart-Allmaras and the two-equation Menter Shear Stress Transport (SST) turbulence models to examine possible sensitivities due to choice of model. Both models produced similar results; however, the SST model appeared to better simulate the extent of the boundary-layer separation associated with shock/boundary-layer interactions. Thus, the SST model was used to produce the results shown in this paper.
CFD Simulations of Bleed Flows CFD simulations of three flow fields with porous bleed were conducted to verify and validate the
fixed-exit bleed model. The basic objectives were to assess the ability of the bleed model to determine (1) the spatial character of the bleed flow, (2) the bleed flow rate, (3) the effect of the bleed on the boundary layer, and (4) the effect of the bleed on the shock system. The first application involved uniform,

NASA/TM—2008-215178 6
supersonic flow over a flat plate. The second application extended the first application by the inclusion of an oblique shock that interacted with the bleed region. The third application was a Mach 3.0 axisymmetric, mixed-compression inlet.
Bleed on a Flat Plate in Uniform, Supersonic Flow
The first application represented the simplest flow field involving bleed—a uniform, supersonic flow over a flat plate containing a bleed region. This application was studied in an experiment conducted by Willis, Davis, and Hingst at the NASA Glenn Research Center in the early 1990s (refs. 16 and 17). The primary objective of the wind tunnel study was to examine the effect of a variety of geometry parameters on Qsonic. The wind tunnel tests were conducted at Mach numbers of 1.27, 1.58, 1.98, and 2.46. The CFD simulations considered only one bleed configuration (C1) containing circular holes with an incidence of 90° to the plate surface. The bleed region contained 6 rows of 12 bleed holes over a streamwise distance of 2.75 in. and a width of 7.0 in. The holes had D = 0.25 in. and L/D = 1.0. The plate was mounted flush onto the side of the tunnel test section. The boundary layer over the plate was the naturally-occurring boundary layer on the sides of the wind tunnel. The bleed plenum was attached to the outside of the wind tunnel. Ducting then connected the plenum to an altitude exhaust. A mass flow plug was used to establish the bleed flow rate, which was measured using a calibrated nozzle. The uncertainty of the experimental data was reported as 0.007 psi for static pressures, 0.045 psi for total pressures, and 2.4 percent for values of Qsonic.
The computational flow domain is shown in figure 3 along with the Mach number contours of the flow field. A two-dimensional grid was used for the simulations. The bleed region is indicated by the arrows showing relative magnitudes of flow momentum at each grid point. The top of the flow domain is the centerline of the tunnel and an inviscid boundary condition was applied. The inflow conditions matched the boundary layer profile measured in the experiment. To generate this inflow boundary layer, a separate simulation was performed in which the flow conditions and length of forward duct were varied until the boundary layer edge conditions (Mδ, ptδ, and Ttδ) and velocity profile matched those of the profile of the data.
The flow field shown in figure 3 is for the Mach 1.27 simulation with the bleed flow at its maximum rate. The bleed rate across the bleed region was fairly uniform. The bleed caused a localized expansion and acceleration of the flow at the start of the bleed as the core flow was turned into the bleed region. The Mach number reached a peak of Mδ = 1.42 at the start of the bleed region with values of Mδ = 1.38 over the aft two-thirds of the bleed region. At the end of the bleed region, the flow turned back parallel to the wall and a weak shock formed. This reduced the Mach number back to Mδ = 1.27. The expansion and shock waves reflected off the top boundary of the flow domain, but this was of no consequence to the bleed flow.
Flow
Mach Number
Flow
Mach Number
Figure 3.—Flow domain, Mach number contours, and
bleed momentum vectors for Mach 1.27 flow over a porous bleed region on a flat plate.
NASA/TM—2008-215178 7
0.00
0.05
0.10
0.15
0.20
0.25
0.0 0.1 0.2 0.3 0.4Bleed plenum pressure ratio
Son
ic fl
ow c
oeffi
cien
t
Mach 1.27Mach 1.58Mach 1.98Mach 2.46QSON90
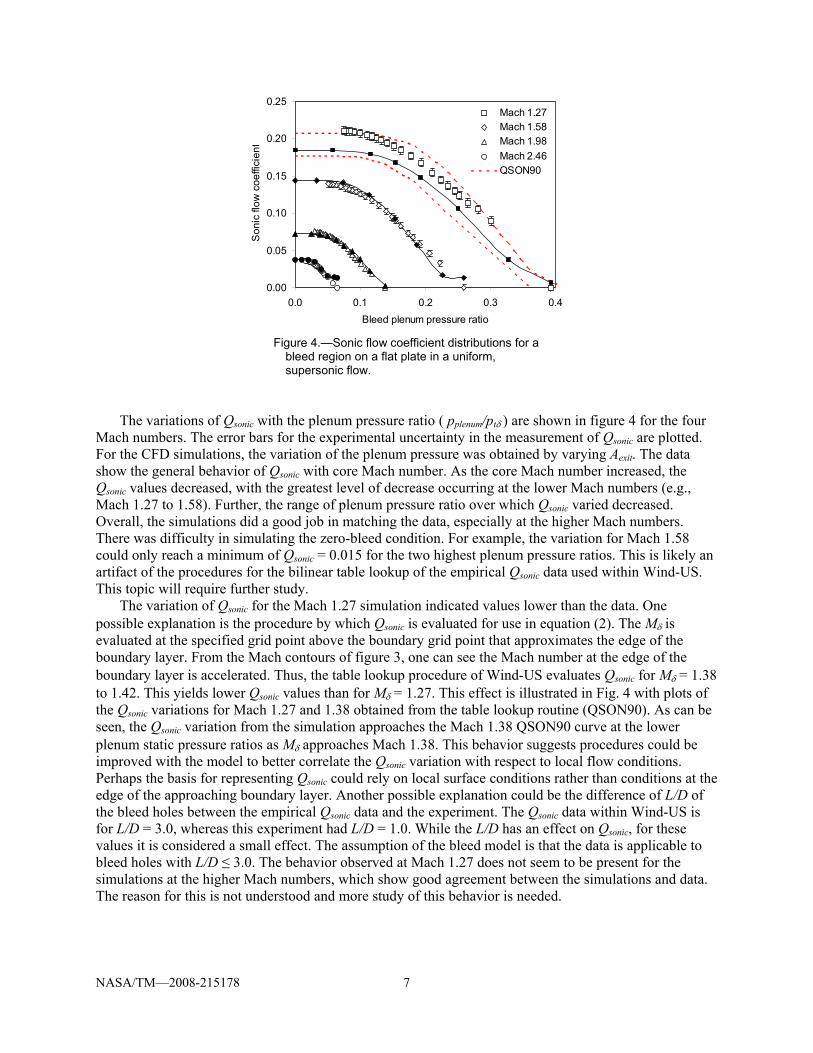
Figure 4.—Sonic flow coefficient distributions for a
bleed region on a flat plate in a uniform, supersonic flow.
The variations of Qsonic with the plenum pressure ratio ( pplenum/ptδ ) are shown in figure 4 for the four Mach numbers. The error bars for the experimental uncertainty in the measurement of Qsonic are plotted. For the CFD simulations, the variation of the plenum pressure was obtained by varying Aexit. The data show the general behavior of Qsonic with core Mach number. As the core Mach number increased, the Qsonic values decreased, with the greatest level of decrease occurring at the lower Mach numbers (e.g., Mach 1.27 to 1.58). Further, the range of plenum pressure ratio over which Qsonic varied decreased. Overall, the simulations did a good job in matching the data, especially at the higher Mach numbers. There was difficulty in simulating the zero-bleed condition. For example, the variation for Mach 1.58 could only reach a minimum of Qsonic = 0.015 for the two highest plenum pressure ratios. This is likely an artifact of the procedures for the bilinear table lookup of the empirical Qsonic data used within Wind-US. This topic will require further study.
The variation of Qsonic for the Mach 1.27 simulation indicated values lower than the data. One possible explanation is the procedure by which Qsonic is evaluated for use in equation (2). The Mδ is evaluated at the specified grid point above the boundary grid point that approximates the edge of the boundary layer. From the Mach contours of figure 3, one can see the Mach number at the edge of the boundary layer is accelerated. Thus, the table lookup procedure of Wind-US evaluates Qsonic for Mδ = 1.38 to 1.42. This yields lower Qsonic values than for Mδ = 1.27. This effect is illustrated in Fig. 4 with plots of the Qsonic variations for Mach 1.27 and 1.38 obtained from the table lookup routine (QSON90). As can be seen, the Qsonic variation from the simulation approaches the Mach 1.38 QSON90 curve at the lower plenum static pressure ratios as Mδ approaches Mach 1.38. This behavior suggests procedures could be improved with the model to better correlate the Qsonic variation with respect to local flow conditions. Perhaps the basis for representing Qsonic could rely on local surface conditions rather than conditions at the edge of the approaching boundary layer. Another possible explanation could be the difference of L/D of the bleed holes between the empirical Qsonic data and the experiment. The Qsonic data within Wind-US is for L/D = 3.0, whereas this experiment had L/D = 1.0. While the L/D has an effect on Qsonic, for these values it is considered a small effect. The assumption of the bleed model is that the data is applicable to bleed holes with L/D ≤ 3.0. The behavior observed at Mach 1.27 does not seem to be present for the simulations at the higher Mach numbers, which show good agreement between the simulations and data. The reason for this is not understood and more study of this behavior is needed.

NASA/TM—2008-215178 8
Bleed Region on a Flat Plate with an Interaction of an Oblique Shock
The second application extended the first application by introducing an oblique shock that interacted with the bleed region (ref. 18). This application has also been the subject of CFD simulations by other researchers (refs. 8 and 19). The bleed plate and holes were similar to those of the first application; however, this application contained 8 rows of bleed holes over a streamwise length of 3.75 in. The experiment was conducted at a Mach number of 2.46.
The computational flow domain is shown in figure 5 along with the Mach number contours of the flow field. A two-dimensional grid was used. The inflow boundary conditions were set to match the reference boundary-layer profile measured in the experiment. The top boundary included the shock generator, which was at an 8° incidence angle to the flow. The start of the oblique shock was positioned such that the oblique shock reflected at the midpoint of the bleed region based on an inviscid analysis; however, the boundary layer caused the pressure rise associated with the interaction to move forward of the center of the bleed region. The shock was of enough strength to result in a small region of boundary-layer separation. The flow field shown in figure 5 is for the simulation with the bleed flow at its maximum rate. The arrows indicate that the bleed rate is greater downstream of the interaction, which is expected with the higher pressure and lower Mach number.
The variations of Qsonic with the bleed plenum pressure ratio (pplenum/ptδ ) for both the experimental data and the CFD simulations are shown in figure 6. At the higher bleed rates, the CFD simulations indicated lower Qsonic values than the experimental data. One explanation may be the difficulty in defining the boundary-layer edge and evaluating Qsonic for use in equation (2) that was mentioned in the first application. The Mδ varies over the bleed region from Mδ = 2.46 to 1.83 in a discontinuous manner as
Flow
Mach Number
Flow
Mach Number
Figure 5.—Flow domain and Mach number contours for an oblique
shock interacting with a bleed region on a flat plate.
0.00
0.01
0.02
0.03
0.04
0.05
0.06
0.07
0.08
0.00 0.05 0.10 0.15 0.20
Bleed plenum pressure ratio
Son
ic fl
ow c
oeffi
cien
t
Data
CFD
Figure 6.—Sonic flow coefficient distribution for a
porous bleed region on a flat plate with an oblique-shock interaction.

NASA/TM—2008-215178 9
the flow crosses the incident and reflected shock waves. Again, the representation of Qsonic for use in the bleed model requires further study. At the higher plenum pressure ratios, the CFD simulations indicated higher values of Qsonic or a greater level of bleed flow. As mentioned in the first application, this behavior could be an artifact of the bilinear table lookup of the empirical Qsonic data. Another possible explanation is that the results highlight the inability of the bleed model to capture injection of flow from the bleed plenum into the core flow. The bleed model does not allow injection. If the plenum pressure is greater than the local static pressure, the normal velocity will be set to zero rather than compute a positive value. Thus, downstream of the shock interaction the bleed model is imposing some bleed flow; while upstream it is not allowing injection, which was observed to occur in the experiment at these higher plenum pressure ratios. This application demonstrates the need for a bleed model to simulate mixed bleed and injection and this will be a topic of future research. Overall, the comparison of the variation of Qsonic from the CFD simulations with the data was encouraging given the complexity of the interaction.
The variation of the surface static pressure along the flat plate about the bleed region is shown in figure 7. The static pressures are normalized by the static pressure at the edge of the reference boundary layer. Plotted are the variations for both the data and CFD simulations at three bleed levels: zero bleed, maximum bleed, and an intermediate bleed. For zero bleed, the CFD simulation indicated a smaller interaction region than the data. Both the data and the CFD simulations indicated that as bleed is increased, the size of the interaction region decreased and the pressures approached that of the inviscid solution. However, the CFD simulations indicated a greater decrease in the size of interaction region.
The effect of bleed on the boundary layer downstream of the bleed region is shown in figure 8. Plotted are the pitot pressure profiles for the data and CFD simulations at the three bleed levels previously mentioned. The pitot pressures are normalized by the total pressure at the edge of the reference boundary layer. There is good agreement between the data and simulations. Included in figure 8 are the values of the incompressible shape factor, Hi, as defined in reference 1. A value of Hi = 1.3 or below is a design goal (ref. 18). The effect of the bleed is to reduce Hi to acceptable values.
NASA Ames “1507” Supersonic, Mixed-Compression Inlet
The third application was the simulation of a supersonic, mixed-compression inlet. The objective was to accurately determine the performance of the inlet, including the bleed rates and plenum pressures. The inlet chosen for this study was a Mach 3.0, axisymmetric inlet designed and tested at the NASA Ames Research Center during the late 1960s (ref. 20). The inlet is referred to here as the NASA Ames “1507” inlet after its report number (NASA TM X–1507). This inlet was chosen for this study because it had a simple axisymmetric shape. The support struts were downstream of the engine-face rake location, which removed significant three-dimensional effects that would limit the use of an axisymmetric, computational
0.5
1.0
1.5
2.0
2.5
3.0
-2 -1 0 1 2 3 4 5 6Streamwise location, in.
Nor
mal
ized
sta
tic p
ress
ure
Bleed regionInviscidData: Q = 0Data: Q = 0.0342Data: Q = 0.0685CFD: Q = 0CFD: Q = 0.0330CFD: Q = 0.0642
Figure 7.—Surface static pressures for a porous bleed region on a flat plate with an oblique shock interaction.
Figure 8.—Boundary layer profiles downstream of a
porous bleed region on a flat plate with an oblique shock interaction.
0.0
0.4
0.8
1.2
1.6
2.0
0.1 0.2 0.3 0.4 0.5 0.6 0.7 0.8
Normalized pitot pressure
Dis
tanc
e fro
m w
all,
in.
Data: Qsonic = 0.0, Hi = 1.53Data: Qsonic = 0.0342, Hi = 1.39Data: Qsonic = 0.0685, Hi = 1.34CFD: Qsonic = 0.0, Hi = 1.63CFD: Qsonic = 0.0330, Hi = 1.36CFD: Qsonic = 0.0642, Hi = 1.30

NASA/TM—2008-215178 10
I
II
III
IV
Cowl
Centerbody Throat
Mach number
Flow
I
II
III
IV
Cowl
Centerbody Throat
Mach number
FlowFlow
Figure 9.—The Mach number contours and bleed momentum vectors for the
NASA Ames “1507” inlet. flow domain. This inlet was also chosen because it contained a relatively complete set of bleed data, including bleed rates and plenum pressures for each bleed region. The CFD simulations used the shorter of the two subsonic diffusers reported in reference 20. This subsonic diffuser included vortex generators; however, they were not modeled in the CFD simulations.
Figure 9 shows a portion of the flow domain from the cowl lip to the throat. The inlet contained four porous bleed regions—two on the centerbody and two on the cowl. The forward two bleed regions (I and II) helped control the boundary layer through its interactions with the oblique shock waves. The aft two bleed regions (III and IV) were in the throat and served to control the interaction of the terminal shock with the boundary layers as well as provide some control of the forward movement of the terminal shock. The bleed holes were circular and at angles of 90° to the inlet surface. The holes of bleed region I had D = 0.025 in. with L/D = 2.5. The holes of bleeds II, III, and IV had D = 0.125 in. with L/D = 0.5. The porosity of all the bleed regions was 41.5 percent. While bleed regions I and II contain multiple rows of bleed holes, bleed region III contained only two rows and bleed region IV contained only five rows spread over a considerable length of the throat. Each bleed region fed into separate plenums with separate ducting and exits. The CFD simulation results are compared to data reported for bleed exit setting B of the experiment. The report did not list the actual exit areas for bleed setting B; however, the factor CD*Aexit was estimated using equation (3) and data for the supercritical bleed rates.
Figure 9 also shows the Mach number contours. The oblique shock from the cowl lip reflected off of the centerbody. This reflected shock in turn reflected off the cowl downstream of bleed region I. The shock that interacted with bleed region II resulted in increased bleed flow downstream of the interaction. A weak shock in reflected from the centerbody. The discrete groupings of arrows for bleed region III and IV indicate the individual bleed rows. The terminal shock is shown at the downstream edge of the last row in bleed region IV.
The performance of a supersonic inlet is represented by the characteristic “cane” curve in which variation in total pressure recovery (pt2/pt0) is plotted with respect to the variation of the total bleed flow ratio (Wbleed/W0) or the engine-face flow ratio (W2/W0). Figure 10 shows the cane curves for the data along with error bars to show the level of uncertainty in the measurement of the total bleed flow ratio (±0.5 percent) and the engine-face flow ratio (±2.0 percent). At the higher engine-face flow ratios, the inlet operated in supercritical mode with the terminal shock downstream of all bleed regions. The flow was supersonic over the bleed regions and the bleed rates and engine-face flow were constant. This formed the vertical portion of the cane. As the back pressure was increased, the terminal shock moved forward and the recovery increased. As the terminal shock encountered bleed regions III and IV, the higher pressure behind the terminal shock forced more flow through the bleed holes and the engine-face flow decreased. This formed the “knee” portion of the cane curve and was the desired operating point for the inlet. With further back pressure, the bleed and recovery increased while the engine-face flow decreased. An important characteristic of an inlet is the level of back pressure that will cause the inlet to unstart. The data indicated unstart occurs when the engine-face flow ratio dips below 88 percent. At this point, the terminal shock was likely pushed forward of bleed regions III and IV.

NASA/TM—2008-215178 11
The CFD simulations were performed with both the constant-pressure and fixed-exit bleed models. The respective cane curves are presented in figure 10. The simulations were first run with supercritical flow to adjust the plenum pressures to match the supercritical bleed rates for each bleed region. The constant-pressure bleed model held constant the plenum static pressures determined at the supercritical condition. The fixed-exit bleed model held fixed the factor (CD Aexit) determined from equation (3) for the bleed rates and plenum pressures at the supercritical condition. The cane curves were generated by increasing the back pressure in the inlet by reducing the throat area of a downstream nozzle that was choked. This computational procedure mimicked the mass-flow plug used in the wind tunnel test. The cane curves from the simulations show good agreement with the data. The plots of the total pressure recovery versus the engine-face flow ratio show that the CFD simulations indicated a lower engine-face flow ratio than the data. However, there is an inconsistency in the experimental data. At the supercritical condition, the data indicates a 7 percent bleed ratio and a 95 percent engine-face flow ratio; however, added together they should not exceed 100 percent of the captured flow. The data is likely showing the artifact of the 2 percent error in measuring mass flows. The simulations with the constant-pressure bleed model were able to reach an engine-face flow ratio of 85 percent without unstart. The simulations with the fixed-exit bleed model indicated the inlet would unstart when the engine-face flow ratio dips below 89 percent, which is close to the 88 percent indicated by the data.
The distributions of the surface static pressure along the centerbody and cowl are presented in figure 11. The axial station is normalized by the cowl radius. The surface static pressures are normalized by the freestream static pressure. The data presented in figure 11 indicates that the inlet is slightly supercritical with the terminal shock downstream of the throat. The uncertainty in the measurement of the static pressures was reported in reference 20 as ±0.2 percent, which cannot be reasonably shown in figure 11. The interaction of the cowl shock with the centerbody provides the first increase in pressure on the centerbody. Capturing this interaction with a CFD simulation is essential if one expects to accurately capture the downstream flow. This follows from the generally downstream propagation of information in the supersonic flow. The wind tunnel data indicate the interaction occurs between axial stations from 3.1 to 3.3. The static pressures from the CFD simulation indicate good agreement with the wind tunnel data. On the cowl, the interaction of the reflected shock with bleed region I occurs between axial stations from 3.4 to 3.6. The CFD results indicate greater static pressure compared to the wind tunnel data, but the increase in static pressure seems to be in the correct position. As the flow encounters shock interactions further downstream, the flow becomes more complex. The static pressures from the CFD simulation show dramatic variation in the throat. Part of this variation is that the static pressure drops dramatically within bleed regions III and IV. The trend of the static pressures from the simulation does follow that of the wind tunnel data within the throat. The CFD simulation places the terminal shock at the end of bleed region IV.
0.70
0.75
0.80
0.85
0.90
0.95
0.06 0.08 0.10 0.12 0.14
Total bleed flow ratio
Tota
l pre
ssur
e re
cove
ry
DataCFD: Constant-pressureCFD: Fixed-exit
0.70
0.75
0.80
0.85
0.90
0.95
0.84 0.86 0.88 0.90 0.92 0.94 0.96 0.98
Engine-face flow ratio
Tota
l pre
ssur
e re
cove
ry
Figure 10.—The characteristic recovery cane curves for the NASA Ames “1507” inlet.

NASA/TM—2008-215178 12
Figure 11.—The static pressure distributions along the surface of the centerbody and cowl surfaces of the NASA Ames “1507” inlet.
The wind tunnel data indicates a shock further downstream. Part of this mismatch is likely due to the fact that the CFD simulation is operating at a slightly higher back pressure than the wind tunnel data.
The variation of the bleed flow ratios for bleed regions III and IV with respect to the total bleed flow ratio is presented in figure 12. As the back pressure was imposed, the bleed flow in bleed regions III and IV and the total bleed rate increased. The comparison with the data is good and suggests that the fixed-exit bleed model can accurately indicate the change in the bleed flows of individual bleed regions as the inlet flow changes. The bleed flows in bleed regions I and II matched the data and did not change with increased back pressure, since those regions were ahead of the terminal shock.
The simulations were set up to match the bleed flows of the data for each bleed region at the supercritical condition rather than match the bleed plenum static pressures. For bleed region I, the resulting plenum pressure of the simulation did match that of the data. The plenum pressure from the simulation for bleed region II was about 20 percent higher than the data. The plenum pressures for bleed regions I and II did not change with the increase in the inlet back pressure. The variations of the bleed plenum static pressures with respect to the total bleed flow ratio for bleed regions III and IV are presented in figure 13. The pressures from the simulations are higher than those indicated from the data. While the slope of the variation for bleed region IV is similar to the wind tunnel data, the slope for bleed region III
0.0
0.1
0.2
0.3
0.4
0.5
0.6
0.06 0.07 0.08 0.09 0.10 0.11 0.12Total bleed flow ratio
Ble
ed p
lenu
m p
ress
ure
ratio
Figure 13.—The variation of the bleed plenum static pressures for bleed regions III and IV of the NASA Ames “1507” inlet.
0.00
0.01
0.02
0.03
0.04
0.05
0.06
0.07
0.06 0.07 0.08 0.09 0.10 0.11 0.12Total bleed flow ratio
Ble
ed fl
ow ra
tio
Data: Bleed IIIData: Bleed IVCFD: Bleed III, Fixed-ExitCFD: Bleed IV, Fixed-Exit
Figure 12.—The variation of the bleed rates for bleed regions III and IV of the NASA Ames “1507 Inlet.
0
5
10
15
20
25
30
2.0 2.5 3.0 3.5 4.0 4.5 5.0
Normalized axial station
Nor
mal
ized
sta
tic p
ress
ure
Data: CenterbodyCFD: CenterbodyData: CowlCFD: CowlBleed IBleed IIBleed IIIBleed IV

NASA/TM—2008-215178 13
diverges sharply at the higher bleed flow ratios. The reason for this is not fully understood at this time. The differences are likely due to a combination of the complexity of the flow, uncertainties in the bleed model, and uncertainties in the turbulence model. Further, there are uncertainties in the data. For example, the report did not clearly indicate where the plenum pressures were measured. It was assumed that static pressure taps existed within the plenums. However, the schematic of the tunnel model shows total pressure probes in the exit duct for bleed region IV. The ability to simulate the plenum pressure is of importance for practical reasons since it allows estimation of the bleed drag. This topic will be studied in the future.
Conclusion A bleed model has been developed to simulate a fixed-exit bleed system for use in a CFD flow solver.
The model has been implemented in the Wind-US CFD code and was used to simulate steady flow for some fundamental bleed flows and a supersonic axisymmetric, mixed-compression inlet. The conclusions are
1. The bleed model is capable of providing realistic variations of the bleed over the bleed region in
response to local flow conditions, specifically shock waves interacting with the bleed regions. 2. The bleed model is capable of providing the variation of the bleed flow with respect to the plenum
static pressure that is of use for supersonic inlet design. 3. The bleed model is capable of creating the desired effect on the boundary layers downstream of the
bleed regions, specifically improving the velocity profile and decreasing the incompressible shape factor.
4. The fixed-exit bleed model demonstrated the realistic behavior of increased bleed and plenum pressure levels as the inlet back pressure is increased.
5. The fixed-exit bleed model demonstrated a realistic simulation of the initiation of unstart in the inlet due to limits on the bleed flow as the inlet back pressure is increased.
6. While the studies provide the most comprehensive evaluation to date of the state-of-the-art methods in a CFD flow solver for bleed modeling for application to supersonic inlets, several topics were identified for further research. These include the representation of Qsonic with respect to local surface conditions and the ability to accurately model local flow injection from the bleed region.
References 1. Syberg, J. and Hickox, T.E., “Design of a Bleed System for a Mach 3.5 Inlet,” NASA CR–2187,
1973. 2. Tjonneland, E., “The Design, Development, and Testing of a Supersonic Transport Intake System,”
AGARD–CP–91–71, 1971. 3. Sanders, B.W. and Cubbison, R.W., “Effect of Bleed-System Back Pressure and Porous Area on the
Performance of an Axisymmetric Mixed Compression Inlet at Mach 2.50,” NASA TM X–1710, 1968.
4. Sanders, B.W. and Mitchell, G.A., “Increasing the Stable Operating Range of a Mach 2.5 Inlet,” NASA TM X–52799, 1970.
5. Fukuda, M.K., Hingst, W.R., and Reshotko, E., “Control of Shock Wave-Boundary Layer Interactions by Bleed in Supersonic Mixed Compression Inlets,” NASA CR–2595, 1975.
6. Slater, J.W., Davis, D.O., Sanders, B.W., and Weir, L.J., “Role of CFD in the Aerodynamic Design and Analysis of the Parametric Inlet,” ISABE–2005–1168, 2005.
7. Rimlinger, M.J., Shih, T.I-P., and Chyu, W.J., “Shock-Wave/Boundary-Layer Interactions with Bleed Through Rows of Holes,” AIAA Journal of Propulsion and Power, Vol. 12, No. 2, 1996, pp. 217–224.

NASA/TM—2008-215178 14
8. Rimlinger, M.J., Shih, T.I-P., Chyu, W.J., Willis, B.P., and Davis, D.O., “Computations of Shock-Wave/Boundary-Layer Interactions with Bleed,” AIAA–1996–0432, January 1996.
9. Hamed, A., Yeuan, J.J., and Jun, Y.D., “Flow Characteristics in Boundary-Layer Bleed Slots with Plenum,” AIAA Journal of Propulsion and Power, Vol. 12, No. 2, 1996, pp. 231–226.
10. Mayer, D.W. and Paynter, G.C., “Boundary Conditions for Unsteady Supersonic Inlet Analyses,” AIAA Journal, Vol. 32, No. 6, 1994, pp. 1200–1206.
11. Harloff, G.J. and Smith, G.E., “Supersonic-Inlet Boundary-Layer Bleed Flow,” AIAA Journal, Vol. 34, No. 4, 1996, pp. 778–785.
12. Benson, D.B., Shih, T.I.-P., Davis, D.O., and Willis, B.P., “Boundary Conditions for CFD Simulations of Supersonic Boundary-Layer Through Discrete Holes,” AIAA–2000–0888, 2000.
13. Akatsuka, J., Watanabe, Y., Murakami, A., and Honami, S., “Porous Bleed Model for Boundary Conditions,” AIAA–2006–3682, 2006.
14. McLafferty, G. and Renard, E., “Pressure Losses and Flow Coefficients of Slanted Perforations Discharging from Within a Simulated Supersonic Inlet,” United Aircraft Corporation, Research Department, R–0920–1, East Hartford, CT, 1958.
15. Mani, M., Cary, A., and Ramakrishnan, S., “A Structured and Hybrid-Unstructured Grid Euler and Navier-Stokes Solver for General Geometry,” AIAA–2004–0524, 2004.
16. Willis, B.P., Davis, D.O., and Hingst, W.R., “Flow Coefficient Behavior for Boundary Layer Bleed Holes and Slots,” AIAA–1995–0031, NASA TM–106846, 1995.
17. Willis, B.P. and Davis, D.O., “Boundary Layer Development Downstream of a Bleed Mass Flow Removal Region,” AIAA–1996–3278, 1996.
18. Willis, B.P., Davis, D.O., and Hingst, W.R., “Flowfield Measurements in a Normal-Hole-Bled Oblique Shock Wave and Turbulent Boundary Layer Interaction,” AIAA–1995–2885, 1995.
19. Harloff, G.J. and Smith, G.E., “Numerical Simulation of Supersonic Flow Using a New Analytical Bleed Boundary Condition,” AIAA–1995–2759, 1995.
20. Sorensen, N.E., and Smeltzer, D.B., “Investigation of a Large-Scale Mixed-Compression Axisymmetric Inlet System Capable of High Performance at Mach Numbers 0.6 to 3.0,” NASA TM X–1507, 1968.

REPORT DOCUMENTATION PAGE Form Approved OMB No. 0704-0188
The public reporting burden for this collection of information is estimated to average 1 hour per response, including the time for reviewing instructions, searching existing data sources, gathering and maintaining the data needed, and completing and reviewing the collection of information. Send comments regarding this burden estimate or any other aspect of this collection of information, including suggestions for reducing this burden, to Department of Defense, Washington Headquarters Services, Directorate for Information Operations and Reports (0704-0188), 1215 Jefferson Davis Highway, Suite 1204, Arlington, VA 22202-4302. Respondents should be aware that notwithstanding any other provision of law, no person shall be subject to any penalty for failing to comply with a collection of information if it does not display a currently valid OMB control number. PLEASE DO NOT RETURN YOUR FORM TO THE ABOVE ADDRESS. 1. REPORT DATE (DD-MM-YYYY) 01-05-2008
2. REPORT TYPE Technical Memorandum
3. DATES COVERED (From - To)
4. TITLE AND SUBTITLE Modeling of Fixed-Exit Porous Bleed Systems
5a. CONTRACT NUMBER NAS3-598
5b. GRANT NUMBER
5c. PROGRAM ELEMENT NUMBER
6. AUTHOR(S) Slater, John, W.; Saunders, John, D.
5d. PROJECT NUMBER
5e. TASK NUMBER
5f. WORK UNIT NUMBER WBS 561581.02.10.03.32
7. PERFORMING ORGANIZATION NAME(S) AND ADDRESS(ES) National Aeronautics and Space Administration John H. Glenn Research Center at Lewis Field Cleveland, Ohio 44135-3191
8. PERFORMING ORGANIZATION REPORT NUMBER E-16423
9. SPONSORING/MONITORING AGENCY NAME(S) AND ADDRESS(ES) National Aeronautics and Space Administration Washington, DC 20546-0001
10. SPONSORING/MONITORS ACRONYM(S) NASA
11. SPONSORING/MONITORING REPORT NUMBER NASA/TM-2008-215178; AIAA-2008-0094
12. DISTRIBUTION/AVAILABILITY STATEMENT Unclassified-Unlimited Subject Category: 07 Available electronically at http://gltrs.grc.nasa.gov This publication is available from the NASA Center for AeroSpace Information, 301-621-0390
13. SUPPLEMENTARY NOTES
14. ABSTRACT A model has been developed to simulate a fixed-exit porous bleed system for supersonic inlets. The fixed-exit model allows the amount of bleed flow to vary according to local flow conditions and fixed-exit characteristics of the bleed system. This variation is important for the control of shock-wave/boundary-layer interactions within the inlet. The model computes the bleed plenum static pressure rather than requiring its specification. The model was implemented in the Wind-US computational fluid dynamics code. The model was then verified and validated against experimental data for bleed on a flat plate with and without an impinging oblique shock and for bleed in a Mach 3.0 axisymmetric, mixed-compression inlet. The model was able to accurately correlate the plenum pressures with bleed rates and simulate the effect of the bleed on the downstream boundary layer. Further, the model provided a realistic simulation of the initiation of inlet unstart. The results provide the most indepth examination to date of bleed models for use in the simulation of supersonic inlets. The results also highlight the limitations of the models and aspects that require further research. 15. SUBJECT TERMS Supersonic inlets
16. SECURITY CLASSIFICATION OF: 17. LIMITATION OF ABSTRACT UU
18. NUMBER OF PAGES
20
19a. NAME OF RESPONSIBLE PERSON STI Help Desk (email:[email protected])
a. REPORT U
b. ABSTRACT U
c. THIS PAGE U
19b. TELEPHONE NUMBER (include area code) 301-621-0390
Standard Form 298 (Rev. 8-98)Prescribed by ANSI Std. Z39-18

