modeling for energy future: econometric and...
TRANSCRIPT

1
Modeling for Energy Future:
Econometric and
BackcastingShaligram Pokharel
Associate Professor
Nanyang Technological University
Singapore
Various methods..
• End-use based
• SEAM- Service Energy Analysis Model - good for individual
end-use analysis- Techno-microeconomic base model
• MEDEE – large scale database oriented end-use energy
analysis model
• IREDSS
− Multiobjective method and GIS
– Excellent for Local level energy planning and
constrained by the use of GIS
• MARKAL..
• Generic models such as econometric
Suitability of model depends on the goal of modeling, data and software availability
and competence of the modeler.

2
Resource
Technology
Process
Technology
Conversion
Technology
Demand
Technology
End-use
servicePrimary Fuel
Refinery
LNG
Natural
Gas
Imported
electricity
Orimulsion
Renewable
Biomas
s waste
Coal
Gasoline
Diesel
Town
Gas
LPG
Fuel Oil
Refinery
Gas
Natural Gas
CNG
Processing
LNG
Terminal
Fuel oil
steam
turbine
Orimulsion
steam turbine
Solar
PV
Solar water
heater
Wind turbine
Incineration
Bio-fuels
technology
Supercritical
coal technology
Ultra super
critical coal
technology
Integrated
combined
gasification
cycle
Hydrogen
generator
Fuel cell
producer
Private
Car/Jeeps
Motor
cycle
Taxi
Public
Bus
Passenger
vehicles
Goods vehicle
Trucks
Sector
Residential
Transport
Industry
Commercial
(service)
sector
Others
Trains
Cooking
stoves
Lighting
appliances
Water heaters
Air
conditioners/
coolers
Industrial
boilers
Industrial
motors,
machines
Chillers
Refrigerators
Lift/escalators/
motors
Private
Transport
Public
Transport
Freight
Transport
Cooking
Water
heating
Space
cooling
Industrial
process
heating
Industrial
motive power
Industrial
cooling
Industrial
refrigeration
Industrial
lighting
Commercial
motive power
Commercial
cooling
Commercial
refrigeration
CNGs
Biofuel
processing
Gasohol
Blending
Secondary Fuel
Electricity
Bio-
diesel
Bioethanol
Hydrogen
LNG
Solar
Wind
Biomass
technology
Gasohol
Fuel cell
Diesel gas
turbine
Gas
Combined
cycle
lighting
Washing
Commercial
washing
Washing
machines
Residential
refrigeration
Commercial
water heating
Other devices Other end-uses
Waste
Processing
Briquetting
Demand analysisSupply analysis
Intermediary analysis-
mostly technology based
Possibilities have to be understood.. Present and future
Changing economic structure
http://www.sml.hw.ac.uk/logistics/Decoupling_of_Road-tonne-km_and_GDP.pdf

3
Econometric model
• Inclusion of parameters is based on a country’s socio-economic situation
• population,
• stretch of road (KM extension),
• number of vehicles,
• number of houses built,
• economic performance of the country, and
• family income.
• Based on time series data of actual consumption.
• The best model fits the actual consumption.
• The projection is based on the status of parameters assumed for the future.
Projections have been done for many years..
Econometric model
• The model exhibits
dependency
• Interdependency
among the chosen
variables
• Fit of some of the
independent variables
on dependent variables
• Dependency on the
scale of variables
cbxaxy 21
4
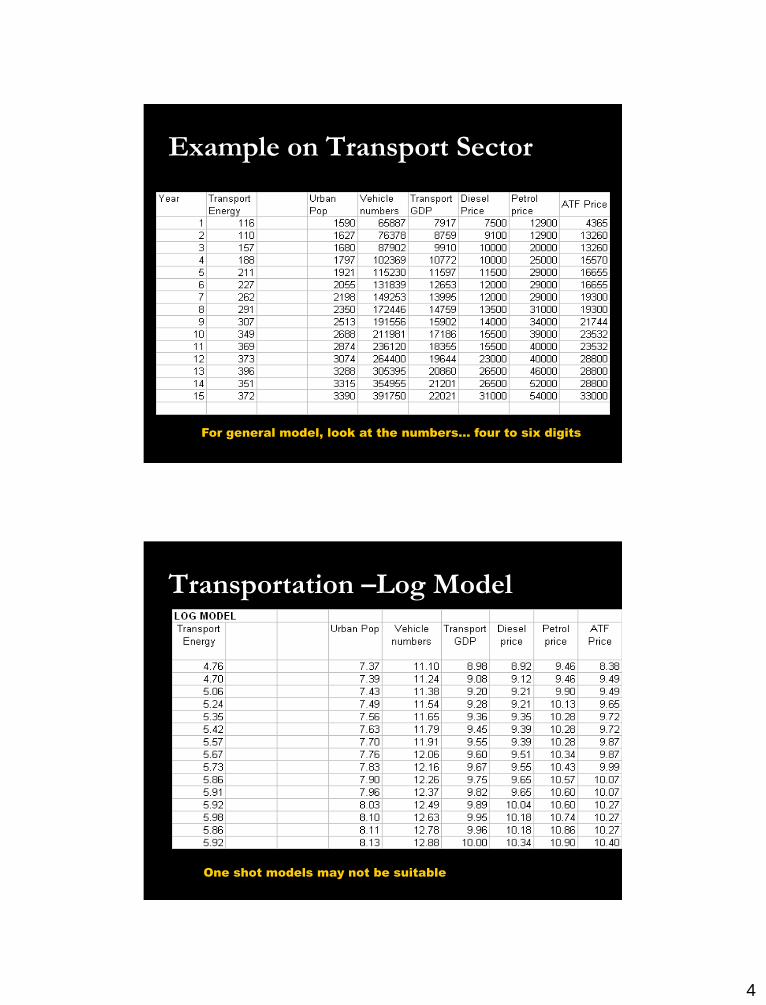
Example on Transport Sector
For general model, look at the numbers… four to six digits
Transportation –Log Model
One shot models may not be suitable

5
Model with actual values
Critical F = 3.58
Critical t= 2.145
Between
Within
P values can also be used
Min req.
Log Model
Critical F = 3.58
Critical t= 2.145

6
Improved log model
Therefore, one shot models by looking at R-squared may not give a good picture
But is this a good model? It fits well.. Because it looks at the past
Critical F = 3.89
Critical t= 2.145
Viable econometric models
Do they match?

7
Assuming everything goes well
For fuel projection

8
8
1968 1972 1976 1980 1984 1988 1992 1996
10
12
14
16
18
6
Consumption
1000 MW
1968
1972
19761980
1981/82
1983/84
WIDE
National Electricity Demand Forecasts
for the Netherlands
Backcasting!
• Energy is a dependent outcome
• Need to develop alternative paths on other sectors
like climate
• future in terms of technology and in terms of economic
structure?
• for example, should it be designed based on GHG
targets

9
Should we consider new fuels?
What about improvements in
technology?
• What about the learning rate of technology?
• In terms of efficiency
• Efficiency of refrigerator has doubled in ten years.
• In terms of cost
• The cost of refrigerator has reduced by almost one
quarter
• For example cars

10
Efficiency First costOM cost
Assumptions only
Planners have to depend on domain experts
What would be the impact of
changes in fuel availability as well?
Gasoline cars
Current technology
Gasoline cars
Future tech
CNG cars
Future tech
CNG cars
Future tech
MARKAL model could be useful for developing alternate
scenario for feasibility

11
What if there is a need for carbon-
clean technology?
If there is a need to reduce carbon emissions significantly,
would the current projection viable?
Fuel Oil
Natural GasHydrogen
What about nuclear option?
Does the technology get matured fast enough?
Other questions to answer
• How fast are the new technologies coming up?
• What would be the cost of new technologies?
• How fast are the new technologies penetrating the market?
• How fast these technologies replace the old technologies?
• What about urbanization?
• What about opportunity to supply new technology?
• These questions are not answered by Econometric models
12
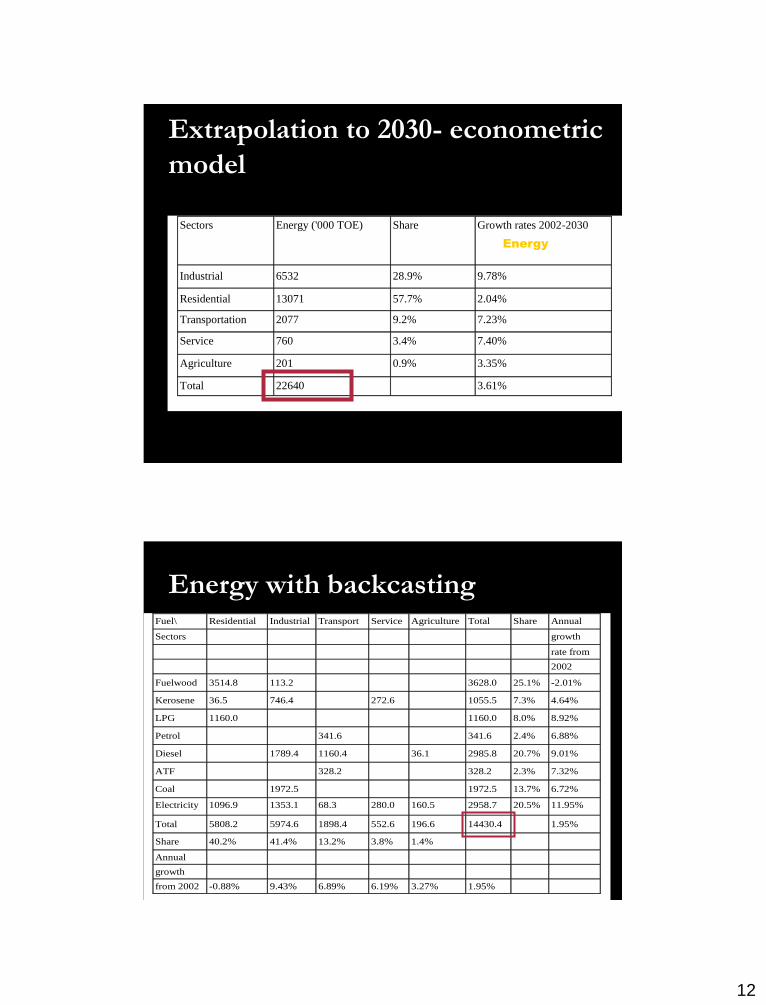
Extrapolation to 2030- econometric
model
Sectors Energy ('000 TOE) Share Growth rates 2002-2030
Industrial 6532 28.9% 9.78%
Residential 13071 57.7% 2.04%
Transportation 2077 9.2% 7.23%
Service 760 3.4% 7.40%
Agriculture 201 0.9% 3.35%
Total 22640 3.61%
Energy
Energy with backcastingFuel\ Residential Industrial Transport Service Agriculture Total Share Annual
Sectors growth
rate from
2002
Fuelwood 3514.8 113.2 3628.0 25.1% -2.01%
Kerosene 36.5 746.4 272.6 1055.5 7.3% 4.64%
LPG 1160.0 1160.0 8.0% 8.92%
Petrol 341.6 341.6 2.4% 6.88%
Diesel 1789.4 1160.4 36.1 2985.8 20.7% 9.01%
ATF 328.2 328.2 2.3% 7.32%
Coal 1972.5 1972.5 13.7% 6.72%
Electricity 1096.9 1353.1 68.3 280.0 160.5 2958.7 20.5% 11.95%
Total 5808.2 5974.6 1898.4 552.6 196.6 14430.4 1.95%
Share 40.2% 41.4% 13.2% 3.8% 1.4%
Annual
growth
from 2002 -0.88% 9.43% 6.89% 6.19% 3.27% 1.95%

13
So finally,
• Energy modeling is an important aspect in large scale planning
• Various methods can be used
• Micro methods are good for techno-economic analysis
• Macro methods like econometric modeling is good for national level planning
• Understanding the changes in energy pattern can be understood through Econometric models
• Backcasting might be easier and better if we have more plausible data on domain based projection.
Main Sources for the paper

14
Thanks!