modeling complex petrophysical … l- rodriguez n... · 3/19 modeling complex trends petrophysical...
TRANSCRIPT

1/19
Jean-Marc Chautru, Geovariances, France,Laurent Fontanelli, Repsol (Móstoles), Spain,Noelia Rodríguez-Morillas, Repsol (Móstoles), Spain,Taoufik Aït-Ettajer, Repsol (Houston), United States
MODELING COMPLEX
PETROPHYSICAL PROPERTIES TRANSITION ACROSS FACIES BORDERS

2/19
THE ISSUE

3/19
MODELING COMPLEX TRENDSPetrophysical properties may be poorly correlated to the facies 3D model : → Causes
– Sedimentological def inition of facies– Electrofacies poorly characterized in Permeability– …
→ Consequences– Properties histogram overlap from one facies to another– Smooth transition of properties from one facies to another
How to detect, characterize and account for such effects?
4/19
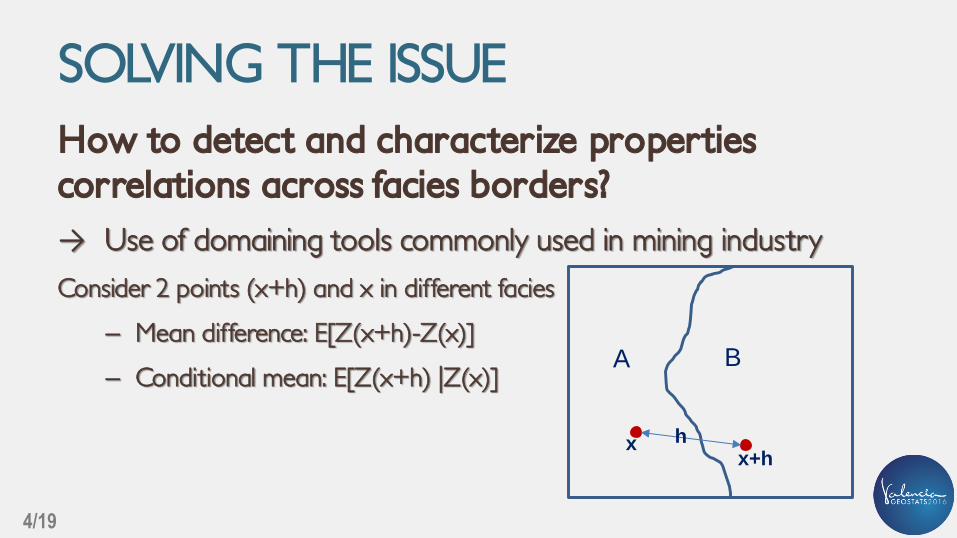
SOLVING THE ISSUEHow to detect and characterize properties correlations across facies borders?
→ Use of domaining tools commonly used in mining industry
Consider 2 points (x+h) and x in different facies
– Mean difference: E[Z(x+h)-Z(x)]
– Conditional mean: E[Z(x+h) |Z(x)]A B
hxx+h

5/19
BORDER EFFECTS
0
1
2
3
4
5
6
7
1 2 3 4 5 6 7 8 9 10 11 12 13 14 15 16 17 18 19 20 21 22 23 24 25 26 27 28 29 30 31 32 33 34 35 36 37 38 39 40 41 42 43 44 45 46 47 48 49
Different types of border effect
case1
case2
case3
case4
Facies A Facies B
0
1
2
3
4
5
6
7
12345678910
Conditional mean (domain A)
Case1
Case2
Case3
Case4
0
1
2
3
4
5
6
7
1 2 3 4 5 6 7 8 9 10
Conditional mean (domain B)
Case1
Case2
Case3
Case4
• Case 1: Independent distributions of Property in Facies A and Facies B.
• Case 2: Distributions of Property in Facies A and Facies B with different means and smooth transition. Property in A and B depends on the distance to the other facies.
• Case 3: Distributions of Property in Facies A and Facies B are partially independent, partially correlated (jump at border + trend effect.
• Case 4: Distributions of Property in Facies A and Facies B with different means and border effect in B only. Property in A does not depend of B, but property in B depends on the distance to A.

6/19
CHARACTERIZING BORDER EFFECT

7/19
EXAMPLES (SYNTHETIC DATA)Examples of typical Porosity distributions are compared:
→ Global Porosity– Continuity at f ield scale, independence from Facies
→ Facies dependent Porosity distribution– Specif ic Property histogram in each Facies, with or without overlap– Porosity distributions in different Facies are not correlated
→ Facies dependent Porosity distribution + border effect– Specif ic Property histogram in each Facies, with or without overlap– Porosity distributions in different Facies are linked

8/19
EXAMPLE 1
Conditional mean
0
1
2
3
4
5
6
7
8
9
10
5 10 15 20 25
Fre
qu
en
cy (
%)
Porosity (%)
Poro_Global
Poro_Global
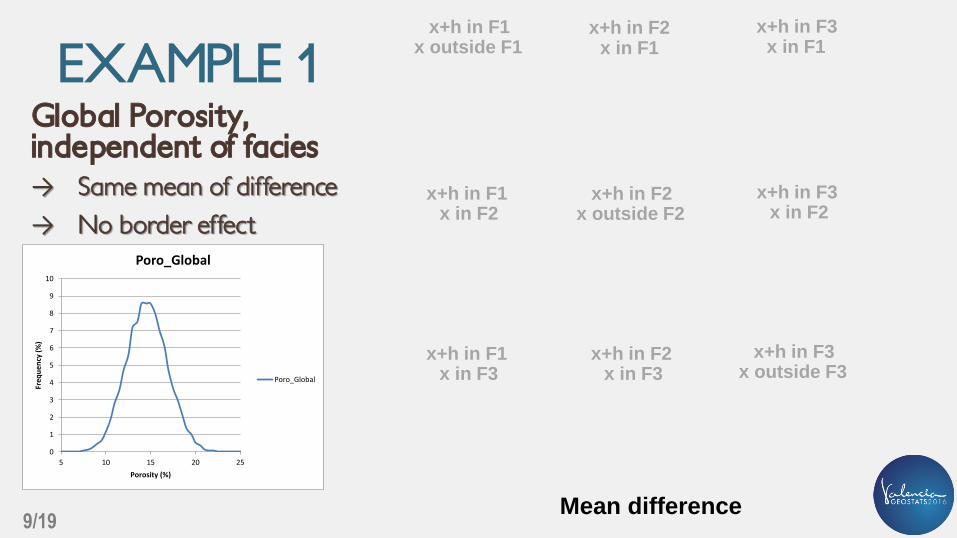
Global Porosity, independent of facies→ Same mean
→ No border effect
x+h in F1 x+h in F2 x+h in F3x outside F1 x in F1 x in F1
x+h in F2x outside F2
x+h in F1x in F2
x+h in F1x in F3
x+h in F3x in F2
x+h in F2x in F3
x+h in F3x outside F3
9/19
EXAMPLE 1
Mean difference
Global Porosity, independent of facies→ Same mean of difference
→ No border effect
0
1
2
3
4
5
6
7
8
9
10
5 10 15 20 25
Fre
qu
en
cy (
%)
Porosity (%)
Poro_Global
Poro_Global
x+h in F1 x+h in F2 x+h in F3x outside F1 x in F1 x in F1
x+h in F2x outside F2
x+h in F1x in F2
x+h in F1x in F3
x+h in F3x in F2
x+h in F2x in F3
x+h in F3x outside F3

10/19
EXAMPLE 2
0
5
10
15
20
25
5 10 15 20 25
Fre
qu
en
cy (
%)
Porosity (%)
Poro_Facies1
Poro_Facies2
Poro_Facies3
3 independent facies→ Different means
→ No border effect
Conditional mean
x+h in F1
x+h in F2 x+h in F3
x outside F1
x in F1 x in F1
x+h in F2x outside F2
x+h in F1x in F2
x+h in F1x in F3
x+h in F3x in F2
x+h in F2x in F3
x+h in F3x outside F3

11/19
EXAMPLE 2
0
5
10
15
20
25
5 10 15 20 25
Fre
qu
en
cy (
%)
Porosity (%)
Poro_Facies1
Poro_Facies2
Poro_Facies3
3 independent facies→ Different means of difference
→ No border effect
Mean difference
x+h in F1
x+h in F2 x+h in F3
x outside F1
x in F1 x in F1
x+h in F2x outside F2
x+h in F1x in F2
x+h in F1x in F3
x+h in F3x in F2
x+h in F2x in F3
x+h in F3x outside F3

12/19
EXAMPLE 3Trend from Facies1 to Facies3Facies2 independent
→ Flat conditional mean for F2– Value of F2 mean
→ From F3 to F1– Trend from 15% (at border)
to Facies mean
Conditional mean
x+h in F1
x+h in F2 x+h in F3
x outside F1
x in F1 x in F1
x+h in F2x outside F2
x+h in F1x in F2
x+h in F1x in F3
x+h in F3x in F2
x+h in F2x in F3
x+h in F3x outside F3

13/19
EXAMPLE 3Trend from Facies1 to Facies3
Facies2 independent
→ Flat mean difference for F2
→ From F3 to F1
– Trend from 0% (at border)
to Facies means difference
Mean difference
x+h in F1
x+h in F2 x+h in F3
x outside F1
x in F1 x in F1
x+h in F2x outside F2
x+h in F1x in F2
x+h in F1x in F3
x+h in F3x in F2
x+h in F2x in F3
x+h in F3x outside F3

14/19
PRACTICAL APPLICATION EXAMPLE
Validation of a genetic sedimentological model: → Border effect calculation based on acoustic impedance
with reference to genetic facies model
→ Test of relationship between facies and seismic properties– Independence -> facies model is not representative of the f ield
– Facies dependent statistics of properties -> facies model is representative of the f ield• Presence of property trend in facies indicates partial correlation between
facies and properties

15/19
MODELING BORDER EFFECT

16/19
MODELING BORDER EFFECT
Distanceto domainB (m)
Simulationwith distance asexternal drift
Calculate parameter drift from distance to
border and border effect analysis
Use this driftin KED or UK
Use each geobodyas a mask

17/19
CONCLUSION

18/19
CONCLUSION
→ Border effect analysis is a good tool for geological model QC
→ It allows characterizing complex petrophysicalproperties in Facies
→ It allows validating sedimentological models when coupled with seismic data
→ The tools are immediately available

19/19
THANK YOU FOR YOUR ATTENTION