modeling and testing of stitched composite laminates for
TRANSCRIPT

Graduate Theses, Dissertations, and Problem Reports
2004
Modeling and testing of stitched composite laminates for Modeling and testing of stitched composite laminates for
enhanced interlaminar strength enhanced interlaminar strength
Janet M. Wood West Virginia University
Follow this and additional works at: https://researchrepository.wvu.edu/etd
Recommended Citation Recommended Citation Wood, Janet M., "Modeling and testing of stitched composite laminates for enhanced interlaminar strength" (2004). Graduate Theses, Dissertations, and Problem Reports. 1473. https://researchrepository.wvu.edu/etd/1473
This Thesis is protected by copyright and/or related rights. It has been brought to you by the The Research Repository @ WVU with permission from the rights-holder(s). You are free to use this Thesis in any way that is permitted by the copyright and related rights legislation that applies to your use. For other uses you must obtain permission from the rights-holder(s) directly, unless additional rights are indicated by a Creative Commons license in the record and/ or on the work itself. This Thesis has been accepted for inclusion in WVU Graduate Theses, Dissertations, and Problem Reports collection by an authorized administrator of The Research Repository @ WVU. For more information, please contact [email protected].

Modeling and Testing of Stitched Composite Laminates for Enhanced Interlaminar Strength
Janet M. Wood
Thesis submitted to the College of Engineering and Mineral Resources
at West Virginia University in partial fulfillment of the requirements
for the degree of
Master of Science in
Mechanical Engineering
Jacky Prucz, Ph. D., Chair Ever Barbero, Ph. D.
Samir Shoukry, Ph. D.
Morgantown, West Virginia 2004
Keywords: Stitched Laminates, Interlaminar Strength
Copyright 2004 Janet M. Wood

ABSTRACT
Modeling and Testing of Stitched Composite Laminate for Enhanced Interlaminar Strength
Janet M. Wood
This research assesses the effects of stitching a four-layer E-glass/Epoxy cross-ply laminate with translaminar reinforcement consisting of E-glass yarns. Both experimental characterization and finite element analysis have been employed to accurately predict and analyze the properties of the stitched material. Tensile and Double Cantilever Beam testing indicated that translaminar stitching degrades the effective extensional modulus of the laminate by about 15.9 percent, while it enhances the opening Mode I interlaminar fracture toughness. This degradation in the effective in-plane stiffness is attributed to the localized damage inflicted on the fiber plies by the needle penetration of the sewing machine used to insert the transversely reinforcing stitch. The finite element model predicted a more rigid effective extensional modulus of 2.44 MSI, which is approximately 2.9 percent higher than the corresponding experimental value of 2.37 MSI. This difference can be attributed to slippage effects along the fiber-matrix interfaces being prevented in the model.

iii
SUMMARY
This thesis deals with the effects of stitching a four-layer E-glass/Epoxy cross-ply laminate with translaminar reinforcement consisting of E-glass yarns. The analysis is focused on both the interlaminar and in-plane properties of such a laminate. Both experimental characterization and finite element analysis (FEA) have been employed to accurately measure, predict, correlate and analyze the properties of the stitched material. Extensive tensile and Double Cantilever Beam (DCB) experiments were conducted in accordance with the American Society of Testing and Materials (ASTM) procedures for polymer matrix composite materials, on specimens fabricated on-site by using a vacuum bag process. The DCB tests were performed on both unstitched and stitched specimens with the stitch line directed either perpendicular or parallel to the initial crack opening for the onset of delamination. Results of DCB tests show that stitching improves drastically the Mode I fracture toughness, GI, of the composite laminate, from an average of 9.15 lb/in for unstitched laminates to an average of 59.04 lb/in for stitched laminates when the delamination crack propagates in the direction parallel to the line of stitching. However, the average value of the GI fracture toughness improves, in comparison, only slightly when the crack propagates in a direction perpendicular to the line of stitching, from 9.15 lb/in for the unstitched to 16.58 lb/in for the stitched laminate. Tensile tests of stitched and unstitched specimens show that stitching degrades by about 15.9 percent the effective extensional modulus of the laminate, from an average value of 2.82 MSI for unstitched specimens to an average value of 2.37 MSI for stitched specimens. This degradation in the effective in-plane stiffness is attributed to the localized damage inflicted on the fiber plies by the needle penetration of the sewing machine used to insert the transversely reinforcing stitch. A detailed micromechanical model of a representative volume element of a stitched laminate was developed by integrating a geometric model defined by using the FEMAP commercial software with finite element analysis performed with the ANSYS commercial software. Optical microscopy, combined with careful visual observation and manual measurements, were used to capture and model accurately the complex fiber architecture of the stitched laminate. The model was used to predict the equivalent extensional stiffness constants of the RVE, Ex, Ey, and Ez, in the three orthogonal directions, as well as the associated Poisson ratios. The value predicted by the finite element model for the longitudinal in-plane elastic constant of the stitched cross-ply laminate is Ez = 2.44 MSI, which is approximately 2.9 percent higher than the corresponding experimental value of 2.37 MSI. The finite element analysis predicts, therefore, a higher in-plane stiffness of the stitched laminate than the actually measured one. Such a slight difference could be linked to the fact that slippage effects along the fiber-matrix interfaces are prevented in the Finite Element Model (FEM), where tetrahedral elements are defined with common nodes between the matrix and the fibers. The theoretical model could be enhanced in the future by incorporating frictional elements at the matrix/fiber surface interface, as well as by expanding its capability to simulate the behavior and the results of DCB testing.

iv
NOMENCLATURE
a - delamination length
Acsx Acs
y Acsz - cross sectional areas of RVE faces perpendicular
to the global coordinate directions
ao - initial delamination length
ASTM - American Society of Testing and Materials Standardized Test Method
AVG - average of data values
C - confidence level
b - specimen width δ - crosshead displacement
DCB - Double Cantilever Beam
E1 - longitudinal elastic modulus (principal material direction)
E2 - transverse elastic modulus (principal material direction)
E3 - translaminar elastic modulus (principal material
direction) Ef - elastic modulus of the fibers
Em - elastic modulus of the matrix
εz - longitudinal strain (global coordinate direction) εy - transverse strain (global coordinate direction) εx - translaminar strain (global coordinate direction)
Fz - applied longitudinal force (global direction) Fy - applied transverse force (global direction)

v
Fx - applied translaminar force (global direction) FEA - Finite Element Analysis GPa - Giga Pascals (1 x 10⁹ Pa or N/m2) GI - opening Mode I interlaminar fracture toughness G12 - in-plane shear modulus (principal material
directions)
G13 - translaminar shear modulus (principal material directions)
G23 - translaminar (interlaminar) shear modulus
(principal material directions) Gm - shear modulus of the matrix Lx, Ly, Lz - length dimensions of test specimen lb/in - pound per inch
m - meter mm - millimeters
mm2 - square millimeters mm3 - cubic millimeters
MSI - mega (1 x 10⁶) pounds per square inch
n - number of data points within a set
P - applied tensile force PVA - Polyvinyl Alcohol SEM - Scanning Electron Microscope
STDEV - standard deviation S_ - stitched specimen

vi
SPerp_ - stitched specimen with crack propagating perpendicularly to the line of stitching
SPar_ - stitched specimen with crack propagating parallel to
the line of stitching
t - thickness of the specimen U_ - unstitched specimens
ux, uy, uz - elastic displacements
x, y, z - global coordinate system w - width of the specimens µm - micrometer νf - Poisson’s ratio of the fiber νm - Poisson’s ratio of the matrix
υxz - in-plane Poisson’s Ratio
υyz - translaminar Poisson’s Ratio υxy - translaminar Poisson’s Ratio
σz - in-plane longitudinal stress component
σy - in-plane transverse stress component σx - translaminar normal stress component
1, 2, 3 - material coordinate system [0°/90°]s - cross-ply lay-up architecture of 0/90/0/90 plies

vii
TABLE OF CONTENTS
CHAPTER 1 - INTRODUCTION...................................................................................... 1
1.1 Background............................................................................................................... 1 1.2 Objectives ................................................................................................................. 1 1.3 Preliminary Research ................................................................................................ 3 1.4 Research Approach ................................................................................................... 9
CHAPTER 2 LITERATURE REVIEW ........................................................................... 16 2.1 Stitching Effects on Properties of Composite Laminates ....................................... 16
2.1.1 Mechanical Properties...................................................................................... 17 2.1.2 Delamination Properties................................................................................... 19
2.2 Finite Element Modeling of Fiber Architectures in Composite Laminates............ 21 2.2.1 Modeling of Unidirectional Fabrics................................................................. 21 2.2.2 Finite Element Models of E-Glass/Epoxy Material Systems .......................... 22
2.3 Extensions to Current Research .............................................................................. 23 CHAPTER 3 THEORETICAL APPROACH, METHODS, AND TOOLS..................... 24
3.1 Software Tools for Modeling and Analysis ............................................................ 24 3.1.1 FEMAP ............................................................................................................ 24 3.1.2 ANSYS ............................................................................................................ 25
3.2 Geometric Model Using FEMAP ........................................................................... 26 3.2.1 Geometric Parameters of the Lay-up Architecture .......................................... 26 3.2.2 Individual Unidirectional Plies ........................................................................ 27 3.2.3 Through-the-thickness Stitching...................................................................... 29 3.2.4 Matrix............................................................................................................... 30
3.3 Finite Element Analysis Using ANSYS ................................................................. 31 3.4 Discussion of Modeling Results ............................................................................. 38
CHAPTER 4 EXPERIMENTAL APPROACH AND METHODS ................................. 43 4.1 Specimen Preparation ............................................................................................. 43 4.2 Tensile Testing........................................................................................................ 44
4.2.1 Tensile Test Specimen Preparation.................................................................. 45 4.2.2 Tensile Test Method ........................................................................................ 45 4.2.3 Tensile Test Results ......................................................................................... 47
4.3 Double Cantilever Beam Testing............................................................................ 49 4.3.1 Double Cantilever Beam Test Specimen Preparation...................................... 49 4.3.2 Double Cantilever Beam Test Method ............................................................ 51 4.3.3 Double Cantilever Beam Test Results ............................................................. 52
CHAPTER 5 CONCLUDING REMARKS...................................................................... 65 5.1 Conclusions............................................................................................................. 65 5.2 Recommendations................................................................................................... 67
BIBLIOGRAPHY............................................................................................................. 69

viii
LIST OF TABLES AND FIGURES
Tables Table 1: Dimensions of the RVE for Various Stitch Spacing ............................................ 4 Table 2: Equivalent Material Properties of Unidirectional In-Plane and Stitch Yarns....... 6 Table 3: Preliminary Comparison Between Predicted Values of Equivalent Elastic Moduli for Unidirectional Stitched and Unstitched Laminates (E1, E2, E3) ....................... 7 Table 4: Measurements of Fiber and Stitch Geometry ..................................................... 27 Table 5: Material Properties for Fiber and Matrix Constituents....................................... 31 Table 6: Aspect Ratios of Various Elements within the Finite Element Model............... 32 Table 7: Finite Element Results - Elastic Constants of Stitched Cross-Ply Laminate...... 40 Table 8: Dimensions of Tensile Specimens..................................................................... 47 Table 9: Results of Tensile Tests ..................................................................................... 48 Table 10: Dimensions of DCB Specimens ...................................................................... 53 Table 11: DCB Test Results for Three Unstitched Specimens........................................ 56 Table 12: DCB Test Results for Four Stitched Specimens (Perpendicular Direction).... 57 Table 13: DCB Test Results for Seven Specimens Stitched (Parallel Direction)............ 58 Table 14: Statistical Analysis of Results from DCB Tests .............................................. 62
Figures Figure 1. Preliminary Research - Geometric models with various stitch spacing .............. 5 Figure 2. Bottom view of the through-the-thickness stitching in the fabric ....................... 9 Figure 3. Cross-section view of the [0/90] s laminate showing the 0° and 90° fibers....... 10 Figure 4. Illustration of a chain stitch (www.howstuffworks.com).................................. 11 Figure 5. Top view of stitched fabric with circled regions of localized damage.............. 12 Figure 6. Cross sectional SEM view of embedded silver-coated plies within a composite laminate specimen............................................................................................................. 13 Figure 7. Meshed RVE Model used to calculate Ez by applying the uniform displacement uz to the front face and constraining the back face ........................................................... 14 Figure 8. RVE of the stitched cross-ply laminate ............................................................. 28 Figure 9. Close-up views of the through-the-thickness stitch geometry, whereby: 9 (a) illustrates the full chain stitch intertwining behavior and 9 (b) illustrates the bottom surface “loop” ................................................................................................................... 30 Figure 10. Illustration of the materials modeled in ANSYS to reveal proper mesh attribute and partition assignments.................................................................................................. 34 Figure 11. Loads and constraints applied to the ANSYS model to generate resultant forces on faces of the model, which are used to calculate corresponding elastic constants........................................................................................................................................... 37 Figure 12. Two-Dimensional Deformation plot of RVE corner when a uniform uni-axial elastic displacement is applied in the x-direction, i.e. perpendicularly to the plane of the figure ................................................................................................................................. 39 Figure 13. Convergence plot of Ez.................................................................................... 42

ix
Figure 14. Complete Setup for Creating the Composite Specimens ................................ 44 Figure 15. Tensile Test Apparatus .................................................................................... 45 Figure 16. Tensile Test Specimen Dimensions................................................................. 47 Figure 17. Comparison of Stress-Strain Curves for Stitched and Unstitched Specimens 48 Figure 18. Double Cantilever Beam Specimen................................................................. 50 Figure 19. Illustration of an actual DCB specimen properly loaded into the grips of the Instron testing machine ..................................................................................................... 51 Figure 20. Illustration of the delamination length ............................................................ 52 Figure 21. DCB Specimen with through-the-thickness stitching perpendicular to delamination opening displacement.................................................................................. 54 Figure 22. DCB Specimen with through-the-thickness stitching parallel to delamination opening displacement........................................................................................................ 54 Figure 23. Stitched specimen post DCB testing by using the Instron tensile testing machine. The figure illustrates the matrix failure before the full DCB test could be completed.......................................................................................................................... 55 Figure 24. Unstitched specimen post DCB testing by using the Instron tensile testing machine. The figure illustrates the full 25 mm delamination during the DCB test ......... 55 Figure 25. Least Square Curve Fitting of Applied Load vs. Load Point Displacement Data Points Measured through DCB Tests ....................................................................... 59 Figure 26. Least Square Curve Fitting of Applied Load vs. a – a0 Data Points Measured through DCB Tests ........................................................................................................... 59

1
CHAPTER 1 - INTRODUCTION 1.1 Background
In general, laminated composites exhibit poor out-of-plane properties due to the absence
of translaminar reinforcing fibers. Translaminar reinforcement, such as stitching or z-
pinning, is proven to be effective in improving the fracture toughness and the
translaminar strength of laminated composites. However, the effects of various
translaminar reinforcement mechanisms must be carefully investigated in order to assess
the tradeoff between the enhancement of the out-of-plane properties, versus potential
penalties in the in-plane properties.
Stitching is an attractive, cost-effective translaminar reinforcement mechanism, since it
can be applied after the original fabrication process of the laminate is completed, and
does not alter drastically the original macro-structure of the laminate. Potential
disadvantages of stitching are associated mostly with the degradation of in-plane
properties caused by fiber damage, regions of stress concentrations, and resin pockets.
Furthermore, the intertwining stitch of the through-the-thickness reinforcement creates
undulations and crimping in the laminate, which are likely to degrade its in-plane
mechanical properties.
1.2 Objectives
The main objective of this research is to assess quantitatively the effects of translaminar
reinforcement on the delamination strength of laminated composite materials, and on the

2
in-plane characteristics of such laminates. Both theoretical modeling and experimental
measurements are performed for this purpose. The equivalent elastic constants in global
Cartesian directions are predicted by performing geometric modeling and finite element
analysis on the selected case study of an E-glass/Epoxy four-layer laminate with cross-
ply lay-up of [0°/90°]s and E-glass stitching yarns for translaminar reinforcement. In
addition to the reinforcement stitching, the laminate also contains an internal tricot
binding stitch. The purpose of the tricot stitch is to simply hold the flour plies together so
that they do not slip out of position during transport or specimen fabrication. The tricot
binding stitch does not influence the delamination properties of the laminate; therefore it
is not included in the overall modeling of a Representative Volume Element (RVE).
The elastic constants and the delamination characteristics of the stitched composite
material are evaluated experimentally by using standard testing methods. The in-plane
modulus of elasticity is measured through a series of tensile tests, while the delamination
characteristics are evaluated by multiple Double Cantilever Beam (DCB) tests. Through-
the-thickness stitching has been evaluated for two different orientations, one
perpendicular and the other parallel to the initial opening and subsequent direction of
crack propagation. Discussions of the experimental results generated through these types
of testing are included in Chapter 4, where they are also used to assess the validity of the
predictions obtained through finite element modeling. It is important to note that the
current theoretical model cannot predict the delamination strength of the laminate, and
thus it cannot be utilized for correlations with results generated by the double cantilever
beam tests.

3
1.3 Preliminary Research
Preliminary research in the area of finite element modeling of a stitched unidirectional
laminate has been performed by the WVU team in order to predict expediently the
effective extensional moduli of such laminates for various stitching patterns. This model
was applied to predicting the extensional stiffness constants of an RVE in the three
different global directions, which in the case of a unidirectional lay-up are aligned with
the principal material directions, so that these constants are the equivalent elastic moduli,
E1, E2 and E3 of the material. These elastic constants were calculated for different levels
of stitching densities, as measured by the spacing parameter between adjacent stitch
yarns. Extensive comparisons were conducted between the results obtained for stitched
RVE’s and the corresponding results calculated for unstitched RVE’s.
The preliminary RVE model is a rectangular prism consisting of in-plane yarns,
translaminar stitching threads and the matrix. The in-plane yarns were assumed to be
cylindrical, with a diameter of 0.85 mm, and the stitching threads were assumed to have
circular cross-section, with a diameter of 0.3 mm. The spacing between adjacent stitches
is an indicator of stitching density, and comparative studies were conducted between
three different values of stitch spacing, (∆s), namely 2.5, 1 and 0.5 mm.
The preliminary geometric models were created using the commercial I-DEAS, Master
Series 8 software package. Table 1 shows the dimensions of the RVE, according to the
various values of stitch spacing selected for the geometric model.

4
Table 1: Dimensions of the RVE for Various Stitch Spacing
Stitch Spacing (mm) Size of RVE (mm) 2.5 4.4 x 5.0 x 6.0 1.0 4.4 x 2.0 x 5.8 0.5 4.4 x 1.0 x 5.8
The following figures depict the geometric models developed for the finite element
analysis of the three different RVE’s defined in Table 1. Since the extensional moduli
are equivalent to the elastic moduli of the material the global (x,y,z) and material (1,2,3)
coordinates coincide in Figure 1.

5
(a) ∆s = 2.5 mm
(b) ∆s = 1.0 mm (c) ∆s = 0.5 mm
Figure 1. Preliminary Research - Geometric models with various stitch spacing
The geometric models were meshed using solid parabolic tetrahedral elements available
with the free mesh option of I-DEAS and they were checked for distortion.
∆s
z (3) y (2) x (1)
Yarn Stitching

6
Transversely isotropic material properties were assigned to the yarn and stitch elements,
whereas isotropic properties were assigned to the matrix elements. The volume fraction
of the fibers inside the in-plane yarns was assumed to be equal to 0.95, while the volume
fraction of the fibers inside the stitching yarns was assumed to be equal to 0.9. The
elastic modulus and the Poisson ratio of the E-glass fibers were assumed to equal Ef =
72.35 GPa and νf = 0.22, respectively, while the elastic modulus and the Poisson ratio of
the Epoxy matrix were assumed to be Em = 3.12 GPa and νm = 0.38, respectively. Table
2 shows the equivalent material properties of the unidirectional in-plane and stitching
yarns, as calculated by using the Computer Aided Design Environment for Composites
(CADEC) software program for classical macro-mechanical analysis of composite
laminates [3].
Table 2: Equivalent Material Properties of Unidirectional In-Plane and Stitch Yarns
Parameters
E1
(GPa)
E2=E3
(GPa)
G12=G13
(GPa)
ν12=ν13 G23=Gm
(GPa)
ν23=νm
In-Plane
Yarns
69.16 35.8 13.72 0.228 1.13 0.38
Stitch
Yarns
65.42 22.46 8.46 0.236 1.13 0.38
In order to determine the equivalent longitudinal stiffness, E1, of the unidirectional
laminate, the rear surface of the RVE is fixed and a uniform normal strain, ε, equal to 1%
is applied on the front surface of the RVE. The corresponding value of the resultant
reaction force is calculated and then the average stress is determined based on the
assumption that it is uniformly distributed over the fixed face of the RVE. The
corresponding value of E1 is determined by dividing the average stress by the applied

7
uniform strain. A similar procedure is repeated for predicting the equivalent stiffness
constants, E2 and E3 in the in-plane transverse and the translaminar directions,
respectively. Different sets of boundary conditions are used for calculating the different
constants. In order to determine the value of E2, the side rear surface is fixed and a
uniform strain is applied on the front surface, while the translaminar stiffness constant,
E3, is calculated by fixing the bottom surface and applying a uniform strain on the top
surface of the RVE. The same procedure is followed for both unstitched and stitched
laminates of different stitch spacing configurations. The resulting values of E1, E2 and E3
for the stitched laminates are compared with those obtained for the corresponding
unstitched laminates, as shown in Table 3.
Table 3: Preliminary Comparison Between Predicted Values of Equivalent Elastic
Moduli for Unidirectional Stitched and Unstitched Laminates (E1, E2, E3)
Parameter E1 E2 E3
Units GPa MSI GPa MSI GPa MSI
Unstitched 40.3 5.84 8.45 1.22 10.25 1.48
∆s = 2.5 mm 38.8 5.62 9.2 1.33 10.45 1.51
∆s = 1.0 mm 39.2 5.68 9.3 1.34 11.3 1.63
∆s = 0.5 mm 40.1 5.81 9.6 1.39 12.2 1.76
The results show that the presence of stitching slightly decreases the value of E1, while
increasing the values of both E2 and E3. The percentage degradation of E1 with respect to
its value for the unstitched laminate is reduced when the stitch spacing decreases, from
around 3.7% for ∆s = 2.5 mm to about 0.4% for ∆s = 0.5 mm. The percentage of
increase in the value of E2 with respect to the unstitched laminate increases when the

8
stitch density increases, from around 8.8% for ∆s = 2.5 mm to about 13.6% for ∆s = 0.5
mm. Similarly, as one might expect, the value of the translaminar elastic modulus, E3,
increases considerably with respect to that of the unstitched laminate, as the stitch density
increases, from about 1.9% for ∆s = 2.5 mm to about 19.02% for ∆s = 0.5 mm. While
the predicted effects of stitching on the values of the translaminar stiffness constant are
evidently explained by the added stiffness of the stitch yarns, the predicted stitching
effects on the in-plane stiffness constants are probably related to the particular geometry
and size of the preliminary RVE used to generate these results. The specific
characteristics of this RVE may also explain the fact that different values are obtained for
the transverse stiffness constants E2 and E3 of the unstitched laminate.

9
1.4 Research Approach
The research approach adopted in this work balances theoretical modeling with
experimental characterization, in an effort to investigate and validate the effects of
through-the-thickness stitching on the equivalent elastic and strength properties of
composite laminates with cross-ply lay-up. Microscopy has been employed in order to
characterize the fiber geometry and dimensions of a stitched E-glass/Epoxy composite
laminate. High-resolution pictures of the laminate were obtained by using a Caltex High
Resolution Three-Dimensional microscope. They yield important information as to the
type of visible stitching geometry (Figure 2), but they do not reveal details concerning the
interior stitching geometry (Figure 3).
Figure 2. Bottom view of the through-the-thickness stitching in the fabric
0° fibers
4.7752 mm1.1938 mm
Through-the-Thickness Stitching (Type: Chain Stitch)

10
Figure 3. Cross-section view of the [0/90] s laminate showing the 0° and 90° fibers
Sewing machines typically generate two common types of stitches, chain and interlock,
both of which operate on the same principle of formulating an intertwining stitch to form
a loop of thread on the underside of the seam from the action of an eye-pointed needle
raising and lowering to pierce the material lying on the steel plate of the sewing machine.
The interlock stitch utilizes two threads, whereby the second thread is fed from a shuttle
underneath the steel plate and passes through the loop to be interlocked with the upper
thread as it is drawn tightly upwards by the rising needle. The chain stitch uses a single
upper thread that penetrates the loop on the bottom of the material to form the
interlocking stitch. The following illustration, Figure 4, is reproduced from the popular
Internet site “How Stuff Works”, and it depicts the operation of the sewing machine in
producing a chain stitch, as observed within the composite laminate.
0° fibers 90° fibers

11
Figure 4. Illustration of a chain stitch (www.howstuffworks.com)
The synchronous actions of the looping hook and the penetrating needle form the
continuous interlocking chain-like appearance of the stitch on the bottom surface of the
fabric
In order to detect the interior geometry of the stitch pattern and describe accurately the
fiber lay-up architecture, two other optical techniques are used in addition to the Caltex
High Resolution 3D Microscope, namely:
(1) high power microscopy evaluation by using a Scanning Electron Microscope
(SEM), and
(2) accurate visual measurements of key geometric characteristics of the yarn lay-up
architecture, by using high precision calipers.
Some of the pictures obtained from optical microscopy reveal the localized damage that
occurs in the plies as a result of the needle penetration during the action of the sewing
machine used for the translaminar stitching operation. The circles shown in Figure 5
mark such localized damage. Silver coated fabric plies were embedded within the
composite laminate in order to facilitate the characterization of the intricate stitching

12
Through-the-Thickness Stitching
Internal Binding Tricot Stitching
geometry revealed by using the high magnification imagery of the SEM. The high
sensitivity of the SEM pictures to microscopical flaws and localized defects in the
material (Figure 6) limits the practical value or use of such images to investigate the
geometric pattern of the fiber architecture.
Figure 5. Top view of stitched fabric with circled regions of localized damage
0° fibers
Internal Binding Tricot Stitching

13
Figure 6. Cross sectional SEM view of embedded silver-coated plies within a composite laminate
specimen
Therefore, the geometric parameters needed to generate a detailed model of the fiber
architecture of a stitched specimen were determined by combining accurate naked-eye
measurements with the information generated from the Caltex High-Resolution 3-D
Microscope pictures. The values of various measured parameters used to build this
geometric model are presented in Chapter 3.
The geometric model of the stitched laminate is generated using the commercial software
package FEMAP, which is supported by the Electronic Data Systems, Inc. [9]. Next, the
geometric model is imported into the ANSYS commercial software package, in order to
assign the elements, loads, and boundary conditions that are necessary to perform the
finite element analysis [1]. Two types of tetrahedral finite elements were used for this
purpose, namely the10-node Solid 92 element for the plies of fiber-reinforced matrix, and
the 8-node Solid 185 elements for the reinforcing stitch. In total, 15,300 solid elements
14
were employed in this model. The preprocessor menu option in ANSYS allows the user
to generate uniform elastic displacements in the global directions, (ux, uy, uz) at specific
node locations on any face of the model. By applying such a uniform displacement in the
direction normal to a particular face, while constraining the same degree of freedom at all
the nodes of the opposite face of the model, one side face of the RVE remains fixed when
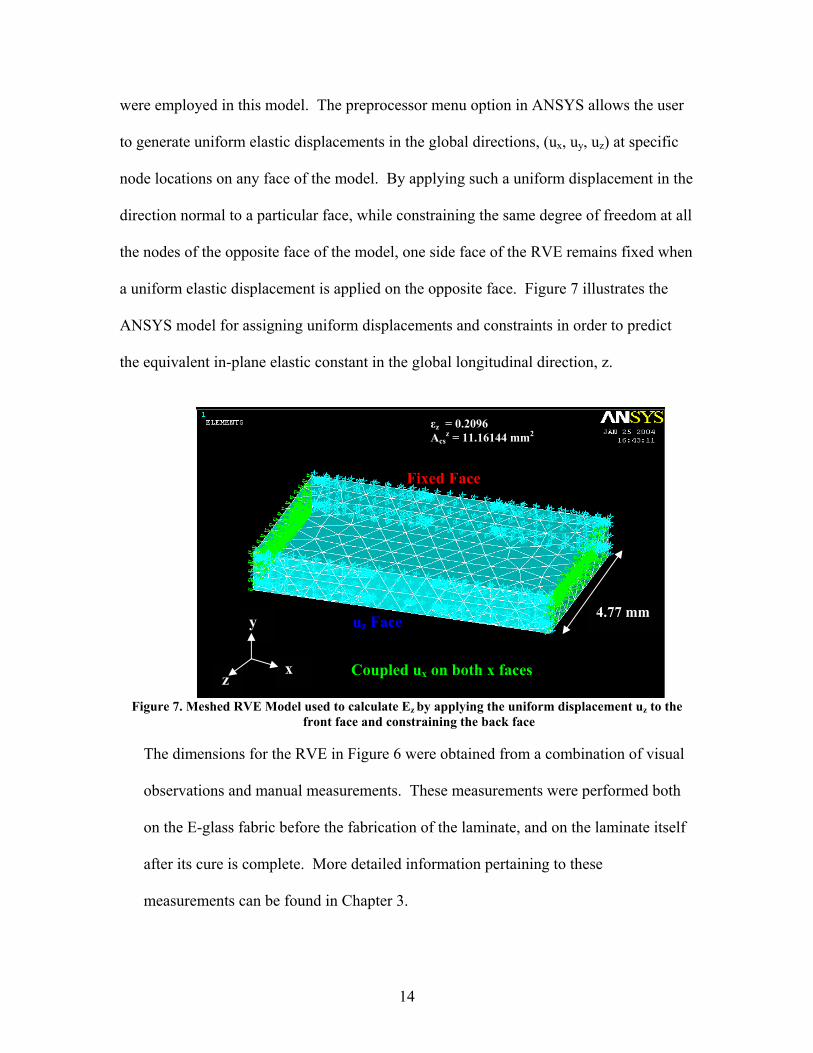
a uniform elastic displacement is applied on the opposite face. Figure 7 illustrates the
ANSYS model for assigning uniform displacements and constraints in order to predict
the equivalent in-plane elastic constant in the global longitudinal direction, z.
Figure 7. Meshed RVE Model used to calculate Ez by applying the uniform displacement uz to the
front face and constraining the back face
The dimensions for the RVE in Figure 6 were obtained from a combination of visual
observations and manual measurements. These measurements were performed both
on the E-glass fabric before the fabrication of the laminate, and on the laminate itself
after its cure is complete. More detailed information pertaining to these
measurements can be found in Chapter 3.
x
y
z
4.77 mm uz Face
Fixed Face
Coupled ux on both x faces
εz = 0.2096 Acs
z = 11.16144 mm2

15
The equivalent elastic modulus of the RVE in each global direction, x, y, z, is
calculated separately by constraining one of the faces perpendicular to that direction,
and applying a uniform extensional displacement in that direction to all the nodes of
the opposite face. The corresponding reaction force is then determined for each
global direction, (Fx, Fy, and Fz), and the corresponding average stress value (σx, σy,
and σz) is, subsequently, calculated by dividing the resultant force value by the cross-
sectional area of the particular face on which it is applied (Acsx, Acs
y, and Acsz), as
noted in Equation (1).
σi = (Fi / Acs
i) where i = x, y, z (1)
The strain value corresponding to each global direction (εx, εy, and εz) is calculated by
dividing the uniform displacement of magnitude equal to unity by the total length of
the RVE in that direction, (Lx, Ly, and Lz) as noted in Equation (2).
εi = (1/ Li) where i = x, y, z (2)
The equivalent value of the elastic modulus in each global direction, (Ex, Ey, and Ez)
was, finally obtained by dividing the average stress value by the strain value
corresponding to that global direction, as noted in Equation (3).
Ei = σi / εi where i = x, y, z (3)
In order to validate the accuracy of the finite element model, the Ez value was
compared to the experimental value obtained from the tensile testing. Additionally,
Poisson ratios for the cross-ply laminate were calculated by using the constraint
relationship between the engineering constants of an orthotropic material, as noted in
Equation (4).
υij = - εi / εj where i and j = x, y, z (4)

16
CHAPTER 2 LITERATURE REVIEW
A thorough survey of the current state-of-the-art in the areas of translaminar
reinforcement and finite element modeling of composite laminates has been conducted as
part of this research. Its main findings are summarized in this chapter, in accordance
with the primary subjects covered by the review.
2.1 Stitching Effects on Properties of Composite Laminates Translaminar reinforcement in the form of through-the-thickness stitching is a secondary
process that is performed after the initial lay-up architecture of the fiber-reinforced plies
stacked in the laminate has been manufactured. Three main potential advantages of
through-the-thickness stitching are:
(1) it is an inexpensive method for joining fabric pre-forms prior to liquid resin
injection,
(2) it is an effective method of strengthening composite materials to improve their
translaminar strengths, and
(3) it improves interlaminar fracture toughness, impact resistance and damage
tolerance composite laminates.
The most important advantage is the potential to improve the translaminar strength,
which may lead to substantial increases in the delamination resistance, especially under
Mode I loading [12].

17
2.1.1 Mechanical Properties A recognized penalty of reinforcing composite laminates through stitching is its negative
effect on the in-plane mechanical properties. In the stitching process, localized damage
occurs from the penetration of the stitching needle into the pre-form fabric or cured plies.
Damage caused by needle penetration includes both fiber breakage and misalignment of
the fibers as they are forced to spread around the stitches. The movement of the fibers to
accommodate the insertion of the stitch leads to fiber depleted regions that are likely to
be filled with resin, and thus form resin-rich pockets, during the fabrication of the
composite laminate.
Previous research has shown that stitching may degrade in-plane properties of a laminate,
to an extent depending upon the constituent materials, stitching parameters, and loading
conditions. It is rather challenging to accurately predict the in-plane mechanical
properties of a stitched laminate based upon any combination of these factors. However
earlier studies have yielded, as discussed below, some general results for in-plane tensile,
compressive, flexural, interlaminar shear, fracture and fatigue properties.
Experimental research performed by Mouritz, Leong, and Herszberg [12] regarding the
effect of stitching on tensile properties has concluded that:
(1) decreasing stitch spacing or increasing stitch density reduces by approximately
45% the tensile strength and 30% tensile modulus of the laminate
(2) increasing the diameter of the stitch yarn by a factor of eight deteriorates the in-
plane tensile properties by approximately 14%, and

18
(3) fiber spreading around the stitch yarns deteriorates in-plane strength and stiffness
due to the misalignment of fibers with respect to the direction of tensile loading.
The effect of stitching on the compressive strength of composite laminates has been
thoroughly researched in the past. Mouritz, Leong, and Herszberg [12] concluded that
the compressive strength of unstitched composites is similar to that of stitched
composites. This and other similar findings have led to the general conclusion that
stitching does not affect the compressive properties.
The degradation of flexural properties as a result of translaminar stitching, is dependent
upon the stitch type, the stitch diameter, stitch density, and the orientation of the stitch
rows. Further, Mouritz, Leong, and Herszberg [12] examined the localized damage
around the stitch loops and determined that the bending stresses were most severe near
the stitch thread.
Few studies have been performed so far in regard with the effect of stitching on the
fracture and fatigue properties of composite laminates. Roughness tests performed by
Sharma and Sankar [13] by using the notched three-point bend test, revealed that when
stitch rows are normal to the notch in the specimen, the fracture toughness is greater due
to the toughness of the stitch itself. However, when the stitch rows were parallel to the
notch direction the crack grew faster along a path parallel to the row of stitching. It is
important to note that these findings are similar to those obtained from the DCB tests
performed in the present research effort. Fatigue testing of stitched composite specimens

19
revealed that the translaminar stitching slowed the growth rate of delaminations after
such damage was induced [13].
Sharma and Sankar [13] analyzed graphite/epoxy laminates of different lay-up
configurations, namely 16-ply plain weave graphite fabric epoxy laminates stitched with
Kevlar® fibers and 24-ply AS4 Uniweave cloth epoxy laminate stitched with either
Kevlar® or glass fibers. They discovered that stitching did not have any effect on the
onset of impact damage, but it does lead to a significant increase (25 – 40%) in the
impact damage tolerance of the laminate. Mode I fracture toughness, as expressed in
terms of the critical strain energy release rate, was found to be 15 – 30 times higher than
that of unstitched laminates, while Mode II fracture toughness increased by 5 – 15 times
in the presence of stitching. DCB testing conducted as part of the current research effort
also revealed that the strain energy release rate was greater for the stitched than the
unstitched specimens of E-glass /Epoxy laminates.
2.1.2 Delamination Properties
A combined theoretical-experimental approach to study the relationships between
stitching parameters and the associated mechanical properties of composite laminates was
employed by Flanagan and Furrow [10]. The primary goal of their research was to devise
structural design guidelines for selecting the appropriate features of through-the-thickness
reinforcement to ensure that the laminates meet specific design criteria after the onset of
crack propagation.

20
Flanagan and Furrow [10] performed three- and four- point bending tests of AS4 woven
Carbon Fibers / 3501-6 Epoxy specimens, both unstitched and stitched. The stitched
specimens utilized Kevlar stitching thread and employed a lock stitch with a 0.2 inch (in)
spacing between the rows and a 0.125 in. step. The specimens were loaded in the
direction perpendicular to the stitches, similar to the longitudinal direction of the
specimens fabricated within this current research effort. A cross-head rate of 0.02 inches
per minute was used, and the load, displacement, and crack growth were monitored for
each bending specimen.
The load-displacement curves for the stitched and unstitched specimens are compared
and it was shown that the stitched specimens were 15% stronger than the unstitched
specimens for the 3-point bending test and 9% stronger for the 4-point bending test [10].
The discrepancies in stiffness values of the specimen material were attributed to the fact
that the research team assumed high values for transverse shear stiffness in the analysis.
It was realized that the strain-energy-release rate increased with the crack length, thus
indicating bridging of fibers as the crack propagates. The pull-off tests indicated that the
Mode I strain-energy-release-rate approaches a constant value asymptotically, even as the
stiffness values of the stitch threads continue to increase. The meaning of this finding is
that there is a limit on the extent to which translaminar stitches are capable to suppress
Mode I fracture of composite laminates.

21
2.2 Finite Element Modeling of Fiber Architectures in Composite Laminates
2.2.1 Modeling of Unidirectional Fabrics
An important advantage of a unidirectional composite material, as compared to a plain-
woven fabric configuration, is that minimal crimp1 is induced in the fibers during the
manufacturing process, which is likely to diminish potential degradation of in-plane
compression properties. The lay-up architecture of unidirectional fabrics consists of
layers of parallel, unidirectional fibers that are stacked on top of one another in selected
lay-up patterns. The individual layers of fibers are usually held together by cured matrix,
but in the case of stitched laminates they are also transversely reinforced by translaminar
stitching. The typical stacking sequence of such lay-ups is [+/- 45° / 0°] T, though the
specific patterns of fiber architecture may vary from one composite part to another,
depending upon design specifications. Unidirectional fabrics have been utilized also in
the specimens tested in this research project, but in different lay-up patterns than those
mentioned above.
Recent theoretical research has been directed towards predictions of compressive and
interlaminar properties of unidirectional materials by using finite element modeling of
selected Representative Volume Elements (RVEs). In the particular case of cross-ply
laminates, such RVE captures portions of both the 0 and 90 degree tows, resin, and also
the appropriate 90 degree tow spacing. The research team of Drapier and Wisnom [7]
used the ABAQUS software to configure a RVE for a laminate with a [90° / 0°/ 90° /
1 Crimp is defined as to give (synthetic fibers) a curl or wave like that of natural fibers.

22
0°/ 90°] lay-up. The researchers modeled the “nesting phenomenon”, or the ability of the
90° layers to settle in the gaps of the 0° layers, in order to predict the mechanical
properties of such a material at the mesoscale level [2]. They concluded that the resin
properties control the shear behavior of unidirectional laminates, while the cross-ply lay-
up is advantageous for buckling resistance of such laminates.
2.2.2 Finite Element Models of E-Glass/Epoxy Material Systems
An effective approach to finite element modeling of fiber architectures for structural
composites was applied by Chatterjee, Flanagan, and Kollegal of Materials Sciences
Corporation for analyzing the behavior of an unstitched plain-woven E-glass
fabric/Epoxy resin composite [4]. The researchers used three-dimensional, solid finite
elements and calculated the dissipation levels of strain energy as damage indicators, or
parameters, based on the constitutive laws of damage mechanics. They considered a
simplified yarn geometry of combined flat and sinusoidal paths of the warp and filling
yarns, by using geometric data and material properties for E-glass plain-woven fabric [4].
Chatterjee, Flanagan, and Kollegal [4] subjected the laminated specimens to off-axis
tensile and in-plane shear loading. Their experimental results from tensile testing agreed
well with the corresponding theoretical values, up to the pre-“knee” portion of the stress-
strain curve [4]. This indicates that the location of the “knee” in the stress-strain curve
corresponds to a stage in the loading process when transverse tensile failure of the filling
yarns might occur.

23
2.3 Extensions to Current Research
The findings revealed by the literature review guided the path of the research approach
followed in this thesis. The theoretical model of the fiber architecture in a stitched
composite laminate was constructed based upon geometric measurements of the laminate,
followed by employing solid three-dimensional elements to mesh the RVE. Theoretical
results of the longitudinal global elastic constant were validated with experimental
findings obtained from tensile testing of stitched specimens. Additional experiments
were conducted by using the double cantilever beam method in order to analyze the
delamination properties of the stitched specimens and quantify the effects of translaminar
stitch reinforcement on both the in-plane and the transverse properties of cross-ply
laminates.

24
CHAPTER 3 THEORETICAL APPROACH, METHODS, AND TOOLS
3.1 Software Tools for Modeling and Analysis
Two finite element modeling software packages are used for predicting the effects of
stitching on the equivalent elastic constants of fiber-reinforced, cross-ply laminates. The
geometric modeling package FEMAP has been used to create the geometric model of a
stitched E-glass/Epoxy composite laminate, while the commercial software package
ANSYS has been chosen to perform the finite element analysis on this model. The main
capabilities of each software package are summarized below:
3.1.1 FEMAP
FEMAP is a Windows-based engineering simulation tool for finite element analysis
(FEA) developed by Electrical Data Systems. FEMAP is commonly used to analyze a
wide range of models, from simple mechanical components to complex spacecraft
assemblies. FEMAP offers basic linear static analysis, as well as advanced solutions to
engineering design and analysis problems.
FEMAP boasts capabilities to form geometric shapes such as lines, arcs, circles, surfaces,
and splines. Volumes and solids can also be formed using various commands such as
surface sweep and solid extrude. Care must be taken to remove the geometrical
structures that may be initially used to construct the solids or volumes, once these have
been generated. Enhanced modification commands such as surface fillet, chamfer, break,
and extend allow the user to add further detail to the geometric model [9]. FEMAP offers
the option to define many types of materials including isotropic, orthotropic, and fluids,

25
as well as many element types such as line, plane, volume, and solid. Although FEMAP
can be used also for finite element analysis, the geometric model created in this work for
a stitched composite laminate is easily imported into ANSYS for meshing, definition of
loadings and boundary conditions, and follow-up stress analysis.
3.1.2 ANSYS
ANSYS offers a tree-structured user interface for easy navigation of the preprocessor,
solution, and postprocessor command options. Since ANSYS is being used here only for
finite element analysis, its geometric modeling capabilities are not relevant to this
investigation. However, the meshing commands, the procedures to specify loading and
boundary conditions, as well as the postprocessor commands available in ANSYS are
used in the present study and can be readily accessed using the help function within the
software package or online ANSYS manuals [1].
The three main pre-processor commands are:
(1) material models to define the material properties for the E-glass fiber yarns, the
reinforcing stitch yarn, and the Epoxy matrix,
(2) meshing commands to generate and assign mesh attributes, and
(3) load-displacement commands to apply uniform displacements and fixed end-
constraints within the meshed model.
Once the “run” phase of the ANSYS software is completed, post-processing commands
are used to analyze the solutions in terms of the resultant reaction forces and associated
stress fields.

26
3.2 Geometric Model Using FEMAP In order to model a practical and accurate RVE of a four-layer cross-ply laminate with
translaminar reinforcement in the form of stitching, it is necessary to examine
individually the three main components of the lay-up architecture, namely the in-plane
fiber plies, the through-the-thickness stitching yarns, and the matrix. Separate geometric
models have been built within the FEMAP environment for all of these three constituents
of the laminate micro-structure.
3.2.1 Geometric Parameters of the Lay-up Architecture
The details provided by the microscopy pictures help to identify localized damage caused
by the penetration of the sewing needle used for the stitching operation, but they do not
provide useful data pertaining to the through-the-thickness stitching geometry. The
pictures taken from the Caltex-High-Resolution microscope reveal, along with visual
observations, that the type of stitching produced by the sewing action is a chain stitch.
The detailed geometry of the composite material was characterized also by using close
visual observations and accurate measurements of the dimensions by means of calipers.
These measurements were performed both on the E-glass fabric before the fabrication of
the laminate, and on the laminate itself after its cure is complete. Table 4 displays the
measurement results from visual observations. An average of at least three separate
measurements is used to yield the values displayed within the table.

27
Table 4: Measurements of Fiber and Stitch Geometry
Component Parameter Measurement (millimeters, mm)
Composite Laminate Thickness 1.384 Major Radius 1.60 0 Degree Fibers Minor Radius 0.20 Major Radius 1.56
Cross-Ply Fibers (Elliptical Cross
Section) 90 Degree Fibers Minor Radius 0.13
Row Spacing 6.388 Stitching Major Radius 0.11
Minor Radius 0.02 Loop Length 4.775
Through-the-Thickness Stitch (Elliptical Cross
Section) Loop Width 1.194
Note: Values were obtained in inches and converted to millimeters for ease of geometric model construction.
The following sections describe the FEMAP commands used to create the geometric
model based on the above measured parameters. The following assumptions were made
in order to simplify the geometric representation of the lay-up architecture in the stitched
composite material:
1. Through-the-thickness stitching rows are parallel to each other and are
separated by a constant step, equal to 6.388 mm, and
2. The Epoxy matrix is represented by a distortion- free three-dimensional
rectangular solid.
3.2.2 Individual Unidirectional Plies
The representative volume element (RVE) of the composite laminate includes one chain
stitch with half of the stitch spacing, or one 0º fiber, on either side of the stitch. By
aligning a series of such RVE’s along a straight line, the actual composite lay-up can be
generated.

28
The geometry of the 0º and 90º plies is generated by using various geometric functions of
the FEMAP software, including “curve-line-coordinates”, “curve-spline-ellipse”,
“surface-sweep”, “surface-corners”, “surface-edge curves”, “solid-extrude”, and “solid-
stitch” commands [9]. The elliptical cross sections of the in-plane and the stitch yarns are
defined in the various XY and YZ coordinate work planes by entering the center point of
the desired ellipse, defining a directional vector for one radius, and entering the two radii
previously defined in Table 4. The fibers evolve into solid components by the geometric
“solid-extrude” command, whereby the elliptical surface is extruded to a desired length
[9]. Figure 8 depicts the geometric model of the four-layer E-glass/Epoxy stitched
laminate, in the form of a RVE consisting of the 0 and 90 degree fibers with elliptical
cross sections, the reinforcement stitching, and the matrix.
Figure 8. RVE of the stitched cross-ply laminate
0 Degree Yarns
90 Degree Yarns
Through-the-Thickness Stitching
(Chain Stitch) Matrix
z
y x

29
3.2.3 Through-the-thickness Stitching The geometry of the through-the-thickness stitching pattern can only be estimated since
the SEM is incapable of yielding intricate pictures of the thread path within the laminate.
The through-the-thickness chain stitch is simulated for the geometric model by
combining the details of chain stitch generation by the sewing machine, as illustrated in
Figure 4, with measurements taken from the fabric itself.
The solid component of the through- the-thickness stitching is generated by sweeping a
circular curve or cross section along a complex geometric path. The complex path of the
through-the-thickness stitching is generated using (1) the “curve-line-coordinates”
command to define straight lines and (2) the “modify-fillet” command to create the
curved sections of the stitching path [9]. Once the path and the desired cross section are
created, the surface-sweep command allows the construction of the entire stitching
thread. The stitching yarn is transformed into a solid by first placing end-caps on the
cross sectional surfaces of the stitch by using the “surface-edge curves” command, and
then by using the “solid-stitch” command to generate the solid stitch structure [9].
Figures 9a and 9b display close-up pictures of the reinforcing chain stitch within the
geometric model.

30
9 (b)
Figure 9. Close-up views of the through-the-thickness stitch geometry, whereby: 9 (a) illustrates the full chain stitch intertwining behavior and 9 (b) illustrates the bottom surface “loop”
3.2.4 Matrix
The geometric representation of the matrix is formed by using the “surface-corners”
command to generate a rectangular surface capable of being extruded along the path of
the fabric geometry by using the “solid extrude” command [9]. The four points in the x,
9 (a)
90 Degree Yarns
Through-the-Thickness Stitching
Through-the-Thickness Stitching
z
y
z
x

31
y, z coordinate system, capable of generating rectangular surfaces are (0, -0.69, 0), (0,
0.69, 0), (8.066, -0.69, 0), and (8.066, 0.69, 0). The rectangular surface is extruded to a
depth of 4.77 mm in order to form the solid matrix necessary to generate an RVE with a
volume of 4.77x8.066x1.38, or 53.09 mm3.
Once the model of the matrix was formed, two FEMAP geometric commands are used to
embed the fibers and the stitching within the solid matrix. The “solid clean-up” option is
selected to check and repair the solid components of the geometric model for eliminating
any distortions [9]. Similarly, the “solid embed” command is used to verify that all the
fiber yarns, i.e. through-the -thickness stitching, 0º plies, and 90º plies, are located within
the rectangular matrix [9].
3.3 Finite Element Analysis Using ANSYS
The geometric model created within the FEMAP environment was imported into ANSYS
in order to perform the finite element analysis. The E-glass fiber yarns within the 0 and
the 90 degrees plies, as well as the epoxy matrix, were meshed using 10-node tetrahedral
elements, while the reinforcing chain stitch was meshed using 8-node tetrahedral
elements. The material properties were assigned using two material models, one to
define the E-glass fibers and the other to define the Epoxy matrix, as shown in Table 5.
Table 5: Material Properties for Fiber and Matrix Constituents Material Properties
ANSYS Material Models E (GPa) υ (1) E-glass Fiber Tows/ Stitching 72 0.20 (2) Epoxy Matrix 3.12 0.38
Resource: Barbero, E.J., 1999 [3].

32
Once the material models and the solid 8-node and 10-node tetrahedral elements are
defined, the stitched laminate is meshed by using mesh options available within ANSYS.
The “mesh attributes” command enables the assignment of different material models to
different constituents within the laminate, while free meshing is performed using the
“mesh tool” option [1]. It is important to note that common, or coincident, nodes are
used in this model along the fiber – matrix interface, which does not allow for any
slipping to occur along these interfaces. This approach commonly generates a more rigid
model and slightly higher values of the elastic constants than the corresponding
experimental values. The aspect ratios2 of the finite elements used within this model are
given in Table 6 below.
Table 6: Aspect Ratios of Various Elements within the Finite Element Model
Number of Elements
Aspect Ratio
Percentage of Model
139 1.5 0.908 2634 2.0 17.22 4102 2.5 26.81 3002 3.0 19.62 2163 3.5 14.13 1434 4.0 9.37 723 4.5 4.72 450 5.0 2.94 233 5.5 1.52 122 6.0 0.79 75 6.5 0.49 223 +7.0 1.46
Table 6 shows that a majority of the tetrahedral elements within the finite element model
have aspect ratios within the range of 2.0 to 4.0, which means that they are
computationally stable, and indicates a low probability of unstable elements. 2 The aspect ratio of a finite element is defined as the ratio of the width to the height of that element.

33
To determine if the geometric model imported from FEMAP upheld the mesh attribute
and partition3 assignments during the meshing process in ANSYS, the different material
constituents are examined separately within ANSYS by using the “element select” and
“element plot” commands associated with each material [1]. Figures 10a and 10b
illustrate the representation in ANSYS of the two main material constituents, i.e. fibers
and matrix, forming the stitched composite laminate.
10 (a)
3 The partition command enables the fiber plies and the reinforcing chain stitching to be embedded within the matrix.
y
x
z
Through-the-
Thickness Stitching
90 Degree Yarns
0 Degree Yarns

34
10 (b)
Figure 10. Illustration of the materials modeled in ANSYS to reveal proper mesh attribute and partition assignments
To begin the finite element analysis, loads and boundary conditions must be applied prior
to running the solution procedure in ANSYS. The “preprocessor-loads-define loads-
apply-structural-displacement“ commands allow ANSYS users to generate strain
components associated with corresponding structural displacements at specified node
locations, that have been selected in advance for certain nodes on particular faces of the
model. A face is defined as edges of the RVE that contain nodes perpendicular to the
descriptive global direction that defines the face. For example, z-faces refer to the 8.088
mm edges of the RVE depicted in Figure 7 within Section 1.4, while x-faces refer to the
4.77 mm edges and y-faces refer to 1.38 mm edges. Uniform elastic displacements of
magnitude one are applied to various faces of the model in the corresponding extensional
direction, while the opposing faces are constrained to prevent any movement along the
same degree of freedom. These boundary constraints of zero extensional displacement
y
x
z
Matrix

35
imposed on the faces opposing those to which the uniform unit displacements are applied
are, essentially, equivalent to fixed-end conditions.
Additional constraints included within the finite element model are coupling conditions
that are applied to the non-free faces of the RVE, essentially the top and bottom faces.
Coupling conditions allow a specific degree of freedom, whether it be x-, y-, or z-
direction in this case, of nodes located on a non-free face to react in unison. Controlling
the nodal solution behavior in this manner forces all nodes included on non-free faces to
assume similar displacement values.
Due to the fact that the selected geometry of the RVE assumes that repetitious unit cells
have the ability to construct the complete composite laminate, compatibility in
displacement along interconnected edges of individual RVE’s is of importance in
simulating accurate nodal behavior within the finite element model. By controlling the
non-free edge (i.e. x-faces and z-faces) displacements, compatibility in displacement is
upheld and the Poisson effect is taken into account. The chosen coupled degree of
freedom along a non-free face corresponds to the global coordinate direction in which the
RVE will deform based upon an applied displacement.
For instance, when a displacement is applied in the z-direction, then an x-degree of
freedom coupling condition is applied to both of the x-faces, while the y-faces do not
receive coupling conditions. A similar scenario exists when a displacement is applied in
the x-direction, whereby z-degree of freedom coupling conditions are applied to both of

36
the z-faces, while the y-faces do not receive coupling conditions. When a displacement is
applied in the y-direction, both the x-faces and z-faces receive respective degree of
freedom coupling conditions.
Once the loads and the boundary conditions are applied and the solution is obtained,
resultant forces on the faces of interest are recorded and used to calculate global stresses,
elastic constants, and Poisson ratios, as stated previously in Equations (1) thru (4) of
Section 1.4. Figures 11a, 11b, and 11c illustrate the complete ANSYS models used to
generate analysis results for calculating the equivalent elastic moduli Ex, Ey, and Ez.
11 (a)
x
y
z
4.77 mm uz Face
Fixed Face
Coupled ux on both x faces
εz = 0.2096 Acs
z = 11.16144 mm2

37
11 (b)
11 (c)
Figure 11. Loads and constraints applied to the ANSYS model to generate resultant forces on faces of
the model, which are used to calculate corresponding elastic constants
Figure 11(a) depicts the modeling conditions associated with determining the in-plane
longitudinal elastic constant (Ez) of the stitched cross-ply laminate in which a uniform
displacement is applied to one z-face while the opposing face is fixed, and x-degree of
freedom coupling conditions are assumed for the x-faces. Figure 11(b) depicts the
x
y
z
1.38 mm
8.066 mm
ux Face
Fixed Face
Fixed Face (BOTTOM)
uy Face (TOP)
y
x z
Coupled uz on both z faces
Coupled uz on both z faces and ux on both x faces
εx = 0.1236 Acs
x= 6.5826 mm2
εy = 0.7246 Acs
y= 38.57976 mm2

38
modeling conditions associated with determining the translaminar normal elastic constant
(Ex) of the stitched cross-ply laminate in which a uniform displacement is applied to one
z-face while the opposing face is fixed, and z-degree of freedom coupling conditions are
assumed for the z-faces. Figure 11(c) depicts the modeling conditions associated with
determining the in-plane transverse elastic constant (Ey) of the stitched cross-ply laminate
in which a uniform displacement is applied to one y-face while the opposing face is fixed,
and the coupling conditions consist of x-degree of freedom coupling conditions for the x-
faces and z-degree of freedom coupling conditions for the z-faces.
3.4 Discussion of Modeling Results The “solution solve-current ls” command is used to perform the finite element analysis
[1]. To ensure that the boundary conditions specified in the model are not generating any
shear effects at the corners of the RVE, an elastic deformation plot was viewed for the
solution obtained after applying a uniaxial uniform displacement in the x-direction. A
close-up view of a corner of the RVE for this loading case is depicted in Figure 12.

39
Figure 12. Two-Dimensional Deformation plot of RVE corner when a uniform uni-axial elastic displacement is applied in the x-direction, i.e. perpendicularly to the plane of the figure
In Figure 12, the dotted line signifies the original shape of the RVE, while the continuous
line represents the deformed state once a uni-axial elastic displacement is applied in the
x-direction (i.e. perpendicular to the plane of the figure). By elongating the RVE in the
x-direction, the Poisson effect will cause compression in both the y- and z-directions to
account for the physical deformation of the laminate. Due to the laminate being more
resistant to deformation in the z-direction, the compression is less than that in the y-
direction.
Once the solution is obtained for each direction of applied extensional displacements or
constraints (Figure 11), the corresponding reaction force, Fi , where i = x, y, z, is
determined by using the “general post-processor-list results-reaction solution” commands
[1]. The total reaction force acting on a given face of the RVE is, subsequently, divided
by the cross-sectional area of that face in order to obtain the corresponding average
y
z
uy
uz
No Shear Effects

40
stress. The average tensile stress in any global direction is then divided by the
corresponding strain value in order to obtain an equivalent value for the elastic modulus
in that global direction, x, y, or z. Then results are summarized in Table 7, in terms of the
resulting global elastic constants and Poisson ratios, based upon the loading and
boundary conditions specified in Figure 11.
Table 7: Finite Element Results - Elastic Constants of Stitched Cross-Ply Laminate
Elastic
Constants
Theoretical Values
Ex 1.63 MSI Ey 0.06 MSI Ez 2.44 MSI υzx 0.079 υyx 0.455 υzy 0.172 υxy 0.265 υyz 0.271 υxz 0.037
Refer to Figure 10 for global coordinate system definition.
Since the RVE defined for this model contains more yarns in the 0 degree plies than in
the 90 degree plies, it is logical to assume that it would predict a larger extensional elastic
constant in the z direction than the x direction (refer to Figure 10(a) where the z-direction
corresponds to 0 degree yarns and the x-direction corresponds to 90 degree yarns). The
modeling results shown in Table 7 confirm, indeed, this expectation, predicting a roughly
33 percent higher value for Ez than Ex. The absence of plies oriented in the y-direction,
aside from the slight orientation of the reinforcing chain stitch, should cause very low
resistance to normal interlaminar deformation, which is reflected in a much smaller value
of Ey than the predicted values for Ez or Ex.

41
When a uniform uniaxial strain is applied on the RVE in the x direction, the Poisson
effect is expected to yield a much larger deformation in the y direction than the coupled
deformation in the z direction, due to the presence of the 0 degree plies in the lay-up of
the laminate. This physical intuition is validated by the larger value predicted for υyx than
for νzx. When a uniform uniaxial strain is applied on the RVE in the y direction, the
coupled deformation in the z direction should be slightly lower than the coupled
deformation in the x direction, since the RVE contains more fiber tows in the 0 degree
direction than in the 90 degree direction. This physical intuition is validated by the
slightly smaller value predicted for υzy than for υxy. When a uniform uniaxial strain is
applied on the RVE in the z direction, the coupled deformation in the y direction should
be much larger than the corresponding deformation in the z direction. This prediction is
validated by the much larger value obtained for υyz than the one calculated for υxz.
A convergence study was performed by analyzing the changes in the values predicted by
the finite element model for a selected parameter, such as the elastic constant Ez, when
the number of elements is gradually increased from a relatively course level, such as
13,700 elements, to a very fine mesh, including over 15,200 elements.

42
Convergence Plot of Ez
0.75
1
1.25
1.5
1.75
2
2.25
2.5
2.75
13400 13600 13800 14000 14200 14400 14600 14800 15000 15200 15400
Number of Elements in Model
Ez V
alue
(MSI
)
Figure 13. Convergence plot of Ez
The convergence plot depicted in Figure 13 shows that as the number of elements within
the model increases, the predicted value from the theoretical model for Ez approaches the
corresponding experimental value, resulting in only a 2.9 percent difference. The
experimental value is listed on the plot (Ez = 2.37 MSI) and can be found in Table 9:
Results of the Tensile Test in Chapter 4. Based upon the good agreement between the
predictions of the finite element model and experimental data, as well as the rapid
convergence of its numerical results, as illustrated in Figure 13, the conclusion can be
drawn that the theoretical model developed in this research provides an effective, reliable
tool for predicting the elastic behavior of stitched cross-ply laminates.
2.37

43
CHAPTER 4 EXPERIMENTAL APPROACH AND METHODS
This chapter describes the experimental investigation of stitched laminates, including the
specimen preparation process, the standard testing procedures employed for tensile and
double cantilever beam experiments, as well as the results generated by this effort.
4.1 Specimen Preparation
The composite specimens tested in this work were fabricated in-house by using stitched
E-glass fabric, epoxy resin and hardener, two glass plates, parting wax, polyvinyl alcohol
(PVA) release film, absorbent material, bagging film, sealant tape, and a vacuum pump.
The fabrication process begins by coating each of the two glass plates with four layers of
parting wax on one side. Two coats of wax are applied and the excess is buffed off. The
remaining two coats are applied one hour later, in order to give the solvent extra time to
evaporate, so that a tougher wax barrier can develop. After the final wax coat dries, three
mist coats of PVA are sprayed over the waxed surfaces. The first light tack coat of PVA
is sprayed over the wax, and about five minutes later, the remaining two heavier coats are
applied. The PVA is used in combination with the parting wax to aid in the release of the
composite from the mold.
The stitched E-glass fabric is placed on the waxed side of one glass plate. A proper mix
ratio of the epoxy resin and hardener is applied to the fabric. The second glass plate is
placed on top with the waxed side touching the fabric, thereby pressing the fabric
between the waxed sides of each glass plate. The absorbent material is placed over the
entire top surface of the glass, and it eventually absorbs the epoxy. The bagging film is

44
used to completely enclose the glass plates with the aid of sealant tape along each side.
Before sealing, a small hole is cut in the bagging film to attach the vacuum pump by
using a thru-bag vacuum connector. The thru-bag vacuum connector effectively couples
the pump and the bag, and provides support to mount the pressure gauge above the bag.
The vacuum connector is placed on several layers of the absorbent material to prevent the
epoxy from clogging the tube. The complete setup for creating the composite specimens
is shown in Figure 14.
Figure 14. Complete Setup for Creating the Composite Specimens
The vacuum pump is left running for approximately two days in an attempt to drive out
the air bubbles from the composite specimen. During the vacuuming process, additional
sealant tape may also be used to plug leaks and tears that might develop in the bag. Since
the bag is pressurized, such defects within the bag can be audibly detected.
4.2 Tensile Testing
The procedures used for specimen preparation and conducting tensile tests on stitched
composite laminates follow closely the provisions outlined in the ASTM (American
Society for Testing and Materials) code D 3039/D 3039M for determining in-plane
tensile properties of polymer matrix composite materials reinforced by high-modulus
fibers.
thru-bag vacuum connector

45
4.2.1 Tensile Test Specimen Preparation For the tensile test, the E-glass/Epoxy composite must have a constant rectangular cross-
section. The width, thickness, and length of the tensile specimens are determined so that
they promote failure in the gage section, while also assuring that the specimen contains a
sufficient number of fibers in the cross section to be statistically representative of the
bulk material. Grip tabs are optional in this standardized testing method and since the E-
glass/Epoxy laminate is considered to be reasonably rigid, they are not used in the present
testing procedure.
4.2.2 Tensile Test Method In order to get good test results, it is common to store the tensile test specimens in the
conditioned environment where the testing machine is located. Figure 15 depicts the
tensile testing apparatus with a mounted specimen. The tensile tests are performed on
stitched and unstitched composite specimens by using an Instron physical testing
machine.
Figure 15. Tensile Test Apparatus

46
The following steps outline the procedure followed in the tensile tests:
• Place the tensile specimen in the grips of the testing machine and assure that
the long axis of the gripped specimen is aligned with the specified test
direction.
• Tighten the grips, and set-up the Instron testing machine according to the
criteria programmed in its control and data processing software. A constant
cross-head speed of 0.05 inches/minute is recommended.
• Increase gradually the load applied on the tensile specimen while recording
the load versus strain history, until a transition region or initial ply failure is
noticed. The Instron tensile testing machine automatically records loading
force in pounds (lb) and elastic displacement in inches (in).
• Once failure occurs stop the testing.
Average stress values are calculated by dividing the incremental values of the applied
tensile force, as recorded by the Instron tensile testing machine, by the cross-sectional
area of the tensile specimens, as noted in Equation (5).
σz = Fz / Acsz (5)
The corresponding values of the average axial strain, εz, are calculated by dividing the
displacement values recorded by the LVDT extensometer by the distance between its
mounting points on the specimen. The equivalent value of the elastic constant in the
global longitudinal direction is, subsequently, calculated by dividing the incremental
stress values obtained from Equation (5) by the corresponding average strain values, as
shown in Equation (6).
Ez = σz / εz (6)

47
Averaging these experimental Ez values between several specimens tested under similar
conditions yields a reasonable estimate of the equivalent elastic constant of a stitched E-
glass/Epoxy laminate in the longitudinal z –direction.
4.2.3 Tensile Test Results
The tensile tests are performed on stitched specimens by using an Instron tensile testing
machine. Table 8 illustrates the dimensions of the stitched and unstitched specimens,
while Figure 16 illustrates the dimensions of a tensile test specimen.
Table 8: Dimensions of Tensile Specimens
Specimen w (in) t (in) L (in) Acs (in2) U1 1.031 0.070 5.468 0.072 U2 0.998 0.072 5.437 0.072 S1 0.931 0.070 5.438 0.065 S2 0.945 0.069 5.438 0.065
Note: U = unstitched and S = stitched specimen, and the Acs is defined as w multiplied by t.
Figure 16. Tensile Test Specimen Dimensions
The average global longitudinal modulus of elasticity, Ez, is found by linear regression
analysis, based on curve fitting the experimental data points shown in Figure 17, which
L
w
t
Front Side

48
depicts the stress-strain plots obtained by testing the stitched and unstitched specimens
defined in Table 8. The equation of the least-square curve fitting line is given in the
form:
y = m*x + b (7)
where the slope, m, is equal to Ez. The effect of through- the-thickness stitching on the
in-plane elastic properties of laminated composites is reflected in the tensile tests results
shown in Table 9.
y(stitched) = 2396551x + 390y (unstitched) = 3E+06x + 518.58
0
2000
4000
6000
8000
10000
12000
14000
16000
0 0.001 0.002 0.003 0.004 0.005 0.006 0.007
Strain
Stre
ss (p
si)
Unstitched Stitched Linear (Stitched) Linear (Unstitched)
Figure 17. Comparison of Stress-Strain Curves for Stitched and Unstitched Specimens
Table 9: Results of Tensile Tests
Specimen Type Ez (MSI) Average Value STDEV
U1 2.808 U2 2.826
2.817
0.013
S1 2.436
S2 2.303
2.369
0.094

49
The results shown in Table 9 indicate a significant decrease, of approximately 15.9
percent, in the longitudinal elastic modulus of a composite laminate when it is stitched in
the through-the-thickness direction and infused with an epoxy resin. The standard
deviation of the test data for the global longitudinal elastic constant of unstitched
specimens is approximately 0.013, while the standard deviation of the test data for the
global longitudinal elastic constant of stitched specimens is approximately 0.094, which
indicates low scatter and good quality of these experimental results.
4.3 Double Cantilever Beam Testing The procedures used for specimen preparation and conducting Double Cantilever Beam
(DCB) tests on stitched composite laminates follow closely the provisions outlined (is
described) in the ASTM (American Society for Testing and Materials) code D 5528-94a
for Mode I interlaminar toughness of unidirectional fiber-reinforced polymer matrix
composites.
4.3.1 Double Cantilever Beam Test Specimen Preparation
The E-glass/Epoxy composite specimens needed for the standard DCB tests must be at
least 125 millimeters (mm) (5.0 inches (in)) long and normally between 20 and 25 mm
(0.8 to 1.0 in.) wide. The laminate thickness shall normally be between 3 and 5 mm (0.12
and 0.2 in.). The variation in thickness for any given specimen shall not exceed 0.1 mm.
Specimens are cut from the fabricated panels and metal inserts that are approximately 63
mm (2.5 in.) in length are introduced in order to control the onset and growth of Mode I
fracture, or delamination in the case of a composite laminate. This distance corresponds
to an initial delamination length of approximately 50 mm (2.0 in.) plus the extra length

50
required to bond the hinges for attaching the loading blocks through which the applied
tension force is transmitted to the specimen. The end of the insert is accurately located
and marked on the panel before cutting the specimens.
Both edges of the specimen are coated just ahead of the insert with a thin layer of water-
based typewriter correction fluid to aid in visual observation of delamination onset and
growth. The first 5 mm (0.2 in.) from the insert on either edge are marked with thin
vertical lines every 1 mm (0.04 in.), while the remaining 20 mm (0.8 in.) are also marked
with thin vertical lines every 5 mm (0.20 in) in order to facilitate visual observation of the
delamination process after the testing begins.
Figure 18 depicts the specimen configuration for the DCB test, where ao is the initial
delamination length, b is the width of the DCB specimen, h denotes its thickness, and L is
the length of the DCB specimen. Figure 19 shows a photo of an actual DCB specimen,
mounted in the Instron testing machine, before the loading is applied.
Figure 18. Double Cantilever Beam Specimen

51
Figure 19. Illustration of an actual DCB specimen properly loaded into the grips of the Instron testing machine
4.3.2 Double Cantilever Beam Test Method The ASTM D 5528-94a standard describes the test procedure for determining the opening
Mode I interlaminar fracture toughness of unidirectional fiber-reinforced polymer matrix
composites by using the Double Cantilever Beam (DCB) approach. The ASTM D 5528-
94a test method describes the procedure for determining the opening Mode I interlaminar
fracture toughness of unidirectional fiber-reinforced polymer matrix composites by using
the DCB approach. The following steps outline the DCB testing method:
• Clamp one end of the specimen and mount the blocks or hinges attached to the
other end in the grips of the loading machine, making sure that the specimen
is aligned horizontally and centered.
• Apply a gradually increasing opening force to the hinges or loading blocks of
the DCB specimen, while controlling the speed of the crosshead.
• Record the incremental load values, the displacement of the crosshead and the
opening length of the delamination, as it increases to 20 mm.

52
The total delamination length (a) is the sum of the distance from the loading line to the
end of the insert (ao), as measured in the undeformed state, plus the growth increments
determined by means of the tick marks as an example is shown in Figure 20. The crack
opening is defined as the location where the metal insert ends and the crack begins to
propagate due to loading conditions.
Figure 20. Illustration of the delamination length
4.3.3 Double Cantilever Beam Test Results
The Double Cantilever Beam (DCB) tests are performed on the Instron tensile testing
machine by gripping the metallic hinges mounted on the specimen in the Instron machine
and applying a gradually rising tension load. The dimensions of the DCB test specimens
are listed in Table 10, along the initial lengths of their “built-in” delaminations.
Loading Line (Piano Hinge)
ao
1 mm Tick Marks 5 mm Tick Marks
a
Crack Opening

53
Table 10: Dimensions of DCB Specimens
Width (in) Thickness (in) Specimen
Length (in) Middle End Middle End
Initial Delamination Length (in)
U1 5.567 0.991 0.978 0.078 0.074 2.035 U2 5.542 0.958 0.955 0.074 0.071 2.038 U3 5.56 0.992 0.985 0.079 0.075 2.038
S_A1 5.545 0.954 0.932 0.079 0.076 2.040 S_B1 5.567 1.006 1.000 0.077 0.074 2.050 S_C1 5.575 1.002 1.002 0.079 0.075 2.034 S_D1 5.488 0.910 0.912 0.101 0.099 1.835 S_A2 5.497 0.963 0.961 0.082 0.082 2.011 S_B2 5.519 0.932 0.936 0.083 0.085 2.031 S_C2 5.480 0.985 0.984 0.079 0.083 2.050 S_D2 5.473 0.976 0.982 0.080 0.082 2.010 S_E2 5.419 0.905 0.912 0.075 0.078 1.925 S_F2 5.510 0.885 0.887 0.072 0.074 1.925 S_G2 5.483 0.900 0.917 0.075 0.076 1.924
U = unstitched specimen and S = stitched specimen
The DCB test is performed on three different types of specimens in order to compare the
corresponding measured values of interlaminar fracture toughness. The first group of
DCB specimens is unstitched, the second group contains stitching that is oriented
perpendicular to the direction of delamination growth, as shown in Figure 21, while the
third group contains stitching that is oriented parallel to the direction of delamination
growth, as shown in Figure 22.

54
Figure 21. DCB Specimen with through-the-thickness stitching perpendicular to delamination
opening displacement
Figure 22. DCB Specimen with through-the-thickness stitching parallel to delamination opening
displacement
Figures 23 and 24 below show actual stitched and unstitched specimens, respectively,
after the DCB testing was performed. Note the location of the premature failure of
the stitched specimen, as compared to the complete delamination of the unstitched
specimen.

55
Figure 23. Stitched specimen post DCB testing by using the Instron tensile testing machine. The
figure illustrates the matrix failure before the full DCB test could be completed
Figure 24. Unstitched specimen post DCB testing by using the Instron tensile testing machine. The
figure illustrates the full 25 mm delamination during the DCB test
The interlaminar fracture toughness, GI, for each specimen is calculated by using the
Modified Beam Theory Method described in the ASTM D 5528-94a standard for Mode I
interlaminar toughness of unidirectional fiber-reinforced polymer matrix composites.
The modified beam theory expression for the opening Mode I interlaminar fracture
toughness of a double cantilever beam with perfectly built-in delamination is given as
follows:

56
baPGI 2
3 δ= (8)
where “P” is the applied load, “δ” is the displacement of the load application point, or the
cross-head opening displacement, “b” is the specimen width, and “a” is the delamination
length. Tables 11 and 12 illustrate, respectively, the DCB test results for the unstitched
and for stitched specimens whose stitching line is aligned perpendicularly to the direction
of crack propagation. The term “compression failure” in Table 12 refers to the failure of
the stitched specimen just past the crack opening, as shown in Figure 23, whereby the
DCB test was ended before the test could be completed.
Table 11: DCB Test Results for Three Unstitched Specimens
U_1 U_2 U_3 a-a0 (mm) P (lb) δ (in) GΙ (lb/in) P (lb) δ (in) GΙ (lb/in) P (lb) δ (in) GΙ (lb/in)
0 1.82 1.684 2.280 1.79 1.650 2.269 2.49 1.261 2.330 1 2.42 1.954 3.450 1.94 1.790 2.617 2.84 1.441 2.979 2 2.57 2.098 3.861 2.24 1.890 3.132 3.14 1.644 3.688 3 2.72 2.224 4.253 2.54 2.016 3.719 3.29 1.761 4.063 4 2.73 2.278 4.293 3.03 2.294 4.957 3.34 1.833 4.217 5 2.62 2.387 4.241 3.16 2.671 5.913 3.49 1.912 4.515 10 2.97 2.972 5.501 3.33 3.010 6.454 3.73 2.610 6.054 15 3.13 3.512 6.337 2.95 3.600 6.326 4.48 3.342 8.613 20 2.61 3.998 5.596 3.14 4.189 7.289 3.57 3.628 6.932 25 2.9 4.421 6.427 3.84 4.600 9.151 4.12 4.137 8.528

57
Table 12: DCB Test Results for Four Stitched Specimens (Perpendicular Direction)
a-a0 SPerp_1 SPerp_2 SPerp_3 SPerp_4 (mm) P (lb) δ (in) GΙ (lb/in) P (lb) δ (in) GΙ (lb/in) P (lb) δ (in) GΙ (lb/in) P (lb) δ (in) GΙ (lb/in)
0 3.70 2.384 6.799 1.51 1.575 1.730 1.65 1.474 1.790 4.62 2.163 8.977 1 4.30 2.538 8.252 1.86 1.806 2.397 2.75 1.990 3.951 4.96 2.24 9.771 2 No Data 2.16 2.012 3.044 3.50 2.309 5.726 5.17 2.37 10.554 3 No Data 2.56 2.257 3.974 4.95 2.766 9.524 5.57 2.49 11.705 4 No Data 3.31 2.675 5.981 5.30 2.881 10.430 7.87 2.994 19.493 5 4.47 2.785 8.751 3.66 2.799 6.798 5.02 2.954 9.951 10.23 3.44 28.549
10 19.32 4.73 59.040 4.91 3.318 9.940 20.12 4.540 56.326 17.69 4.07 53.250 15 7.32 4.417 18.257
20 25 Compression Failure Compression Failure Compression Failure Compression Failure
The specimens stitched along a direction perpendicular to that of the crack growth
experience premature failure just past the crack opening, which is attributed to the large
compressive stresses generated in the outer surfaces of the specimen by the high bending
moment induced at the crack tip location. Table 13 illustrates the DCB test results for
stitched specimens where the stitching line is parallel to the direction of crack
propagation.

58
Table 13: DCB Test Results for Seven Specimens Stitched (Parallel Direction)
SPar_1 SPar_2 SPar_3 SPar_4 a-a0 (mm) P (lb) δ (in) GΙ (lb/in) P (lb) δ (in) GΙ (lb/in) P (lb) δ (in) GΙ (lb/in) P (lb) δ (in) GΙ (lb/in)
0 2.16 1.620 2.710 3.63 2.427 6.981 3.98 2.701 7.986 2.82 1.947 4.198 1 2.71 2.056 4.233 3.63 2.500 7.055 5.07 3.143 11.614 5.12 2.883 11.070 2 2.53 2.290 4.318 3.73 2.618 7.449 5.20 3.151 11.722 4.53 3.087 10.289 3 2.62 2.290 4.389 3.93 2.843 8.367 5.52 3.275 12.698 5.51 3.363 13.382 4 2.67 2.290 4.392 4.00 2.989 8.793 5.98 3.373 13.915 6.04 3.507 15.020 5 3.47 2.780 6.806 5.00 3.256 11.761 5.53 3.437 12.882 6.31 3.600 15.820
10 4.81 3.560 11.092 6.73 3.891 17.382 5.68 3.792 13.422 6.77 3.903 16.895 15 6.29 3.850 14.499 6.01 4.290 15.829 5.36 4.143 12.807 3.92 4.150 9.614 20 6.82 4.357 16.540 4.97 4.460 12.658 7.25 4.620 17.977 4.43 4.593 11.179 25 5.82 4.667 14.125 6.21 4.827 16.000 6.23 5.010 15.665 5.29 5.037 13.677
SPar_5 SPar_6 SPar_7 P (lb) δ (in) GΙ (lb/in) P (lb) δ (in) GΙ (lb/in) P (lb) δ (in) GΙ (lb/in) 0 4.340 2.687 10.041 3.680 2.647 8.577 2.490 1.960 4.228 1 5.460 2.920 13.452 3.990 2.790 9.605 2.780 2.212 5.220 2 5.700 2.940 13.862 4.000 2.850 9.643 3.890 2.652 8.585 3 6.030 3.096 15.145 5.540 2.870 13.190 5.100 2.980 12.404 4 6.240 3.190 15.843 4.500 2.910 10.658 4.750 3.040 11.562 5 4.400 3.218 11.060 3.250 3.150 8.178 3.450 3.060 8.296
10 3.780 3.667 9.908 5.320 3.670 14.272 6.120 3.610 15.887 15 4.030 4.001 10.624 4.720 4.190 13.325 8.120 3.895 20.963 20 6.460 4.423 17.460 6.320 4.650 18.364 6.030 4.372 16.205 25 6.260 4.630 16.513 4.500 4.740 12.427 6.320 4.579 16.585
The results shown in the above tables are used to plot graphs of load versus crosshead
displacement (Figure 25) and load versus crack opening length, a – a0 (Figure 26). These
plots illustrate the interlaminar fracture toughness characteristics of the three different
types of specimens tested through the DCB method. (Note: Specimen SPerp_2 is not
graphed in Figures 25 and 26, because the DCB results for this specimen are inconsistent
with the other specimens stitched in the perpendicular direction.)

59
0
5
10
15
20
25
30
0 1 2 3 4 5 6 7
Load Point Displacement (in)
Load
(lb)
UnstitchedperpendicularparallelPoly. (parallel)Poly. (Unstitched)Poly. (perpendicular)
Figure 25. Least Square Curve Fitting of Applied Load vs. Load Point Displacement Data Points
Measured through DCB Tests
0
20
40
60
80
100
120
0 5 10 15 20 25
a - ao (mm)
Load
(lb)
Unstitched
Perpendicular
Parallel
Poly. (Unstitched)
Poly. (Perpendicular)
Poly. (Parallel)
Figure 26. Least Square Curve Fitting of Applied Load vs. a – a0 Data Points Measured through
DCB Tests
It is evident that the DCB specimens stitched in the direction perpendicular to the
direction of crack growth exhibit higher delamination resistance than unstitched

60
specimens, by sustaining a maximum load of approximately 20 lbs before the onset of
compressive failure. This maximum load is significantly higher than the maximum load
of about 7-8 lb reached by the specimens stitched in the direction parallel to that of the
crack growth, or the maximum load of 3 to 4 lb sustained by the unstitched specimens
before failure. The low scatter level of the test results displayed in Figures 25 and 26
indicate that the DCB tests were performed well, without noticeable errors caused by
slippage of the piano hinges between the grips of the Instron machine.
A basic statistical analysis was performed on the results obtained from the DCB tests that
are listed in Tables 11, 12, and 13. The standard deviation is calculated by using the
“nonbiased” or “n-1” method, in accordance with the following equation:
)1(
)( 22
−
−= ∑ ∑
nnxxn
STDEV (9)
where “n” is the number of data points, and “x” is the value of an arbitrary data point. A
confidence level was set at 95%, which means that the range around the average within
which any new data points are expected to fall with a probability of 95% can be evaluated
by solving the following equation for C:
)(96.1n
STDEVAVGC ±= (10)
where AVG is the average of the data values measured in the experiment. The higher the
C value, the wider this range is, which implies lower confidence in the accuracy of the
average value. The basic statistical characteristics were calculated for the fracture

61
toughness value corresponding to every incremental growth value of the crack length, (a-
a0), and the results are given in Table 14 below:

62
Table 14: Statistical Analysis of Results from DCB Tests
Unstitched Specimens: U_1 U_2 U_3 Confidence
a-a0 (mm) GΙ (lb/in) GΙ (lb/in) GΙ (lb/in) STDEV Avg. at 95%
0 2.280 2.269 2.330 0.032 2.293 0.037 1 3.450 2.617 2.979 0.418 3.016 0.473 2 3.861 3.132 3.688 0.381 3.560 0.431 3 4.253 3.719 4.063 0.271 4.012 0.306 4 4.293 4.957 4.217 0.407 4.4890 0.461 5 4.241 5.913 4.515 0.897 4.890 1.015 10 5.501 6.454 6.054 0.479 6.003 0.541 15 6.337 6.326 8.613 1.317 7.092 1.490 20 5.596 7.289 6.932 0.892 6.606 1.010 25 6.427 9.151 8.528 1.427 8.036 1.615
Stitched Perpendicular: SPerp_1 SPerp_3 SPerp_4 Confidence
a-a0 (mm) GΙ (lb/in) GΙ (lb/in) GΙ (lb/in) STDEV Avg. at 95%
0 6.799 1.790 8.977 3.542 5.855 4.008 1 8.252 3.951 9.771 3.041 7.325 3.441 2 - 5.726 10.554 3.414 8.140 4.731 3 - 9.524 11.705 1.543 10.615 2.138 4 - 10.430 19.493 6.408 14.962 8.881 5 8.751 9.951 28.549 11.100 15.750 12.561 10 59.040 56.326 53.250 2.897 56.205 3.278 15 20
25 Compression Failure
Stitched Parallel: SPar_1 SPar_2 SPar_3 SPar_4 SPar_5 SPar_6 SPar_7 Confidence
a-a0 (mm) GΙ (lb/in) GΙ (lb/in) GΙ (lb/in) GΙ (lb/in) GΙ (lb/in) GΙ (lb/in) GΙ (lb/in) STDEV Avg. at 95%
0 2.710 6.981 7.986 4.198 10.041 8.577 4.228 2.709 6.389 2.007 1 4.233 7.055 11.614 11.070 13.452 9.605 5.220 3.465 8.893 2.567 2 4.318 7.449 11.722 10.289 13.862 9.643 8.585 3.067 9.410 2.272 3 4.389 8.367 12.698 13.382 15.145 13.190 12.404 3.701 11.368 2.742 4 4.392 8.793 13.915 15.020 15.843 10.658 11.562 3.992 11.455 2.958 5 6.806 11.761 12.882 15.820 11.060 8.178 8.296 3.150 10.686 2.334 10 11.092 17.382 13.422 16.895 9.908 14.272 15.887 2.854 14.123 2.114 15 14.499 15.829 12.807 9.614 10.624 13.325 20.963 3.754 13.952 2.781 20 16.540 12.658 17.977 11.179 17.460 18.364 16.205 2.769 15.769 2.051 25 14.125 16.000 15.665 13.677 16.513 12.427 16.585 1.601 14.999 1.186

63
The values shown in Table 14 indicate that the results obtained for unstitched specimens
and for those stitched along a direction perpendicular to that of the crack growth appear
to be more accurate than those obtained from the specimens stitched in a direction
parallel to that of the crack growth, since they exhibit smaller standard deviations and
narrower scatter ranges for data points within the 95% confidence levels.
Through-the-thickness stitching significantly improves the interlaminar fracture
toughness of composite laminates when a crack is propagated in the direction
perpendicular to the direction of stitching. Results show that if a crack is propagated in a
direction parallel to the stitching line, the value of the GI fracture toughness improves
only slightly in comparison with the unstitched composite laminate. The maximum (GI )
value measured for the fracture toughness of specimens stitched in the direction
perpendicular to that of the crack growth is 59.04 lb/in, while the specimens stitched in
the direction parallel to that of the crack growth, and the unstitched specimens exhibit
maximum fracture toughness values of 16.585 lb/in and 9.151 lb/in, respectively.
Since the confidence level of the DCB test results obtained for the fracture toughness of
specimens stitched in the direction parallel to that of crack growth are apparently low,
additional specimens of this type should be tested in order to obtain more accurate
results. The interlaminar fracture toughness of laminates stitched in the direction parallel
to the direction of crack growth could be improved by employing an additional through-
the-thickness stitch line, in a direction perpendicular to the stitch line that already exists.
However, by adding additional stitching to the fabric, the in-plane properties will further

64
deteriorate. Increasing the spacing between adjacent stitch lines, in order to reduce the
levels of in-plane fiber damage could potentially alleviate this problem, those it is likely
to limit the translaminar benefits of stitching.

65
CHAPTER 5 CONCLUDING REMARKS
5.1 Conclusions The experimental investigation reported in this thesis provides useful information as to
the effects of translaminar stitching on the degradation of the in-plane elastic constants
and the enhancement of the opening Mode I interlaminar fracture toughness (GI) of fiber-
reinforced composite laminates as compared to the corresponding properties of similar
laminates without through-the-thickness stitching. Tensile testing of stitched and
unstitched specimens shows that the global elasticity constant in the longitudinal
direction of stitched laminates is degraded by approximately 15.9 percent, as a result of
the localized damage inflicted on the fiber plies by the needle penetration of the sewing
machine used to insert the reinforcing stitch.
Experimental results obtained from DCB tests show that through-the-thickness stitching
significantly improves the interlaminar fracture toughness of composite laminates by
approximately 545%, or five and a half times, when a crack is propagated in the direction
perpendicular to the line of stitching in comparison with that of an unstitched laminate.
On the other hand, experimental results from DCB tests show that if a crack is propagated
in a direction parallel to the line of stitching, the GI fracture toughness improves by
approximately 81% in comparison with that of an unstitched laminate.
A detailed, microstructural finite element model of the stitched laminate was developed
in two stages by using available FEMAP commercial software for geometric modeling
and ANSYS commercial software for finite element analysis. The first stage generated a

66
realistic geometric model of a representative volume element (RVE) of a cross-ply
stitched laminate. Optical microscopy combined with careful visual observation and
measurements were used to capture and model accurately the complex fiber architecture
of the stitched composite material. The second stage of the theoretical analysis was to
construct a finite element model by using an appropriate mesh of tetrahedral finite
elements in the ANSYS commercial software. The geometric model is imported into
ANSYS and finite element analysis is performed once the laminate is meshed and various
loading conditions and constraints are applied. The specific types of finite elements used
in this study were Solid 92 (10-node) elements for the fiber plies and matrix, and Solid
185 (8-node) elements for the reinforcing stitch. The model was used to predict the
extensional stiffness constants of the RVE in the three orthogonal directions, namely the
equivalent global elastic constants, Ex, Ey, and Ez, as well as the associated Poisson ratios.
The value predicted by the finite element model for the longitudinal elastic constant of
the stitched composite laminate is Ez = 2.44 MSI, which is approximately 2.9 percent
higher than the corresponding experimental value of Ez = 2.37 MSI. The finite element
analysis appears, therefore, to predict a more rigid stitched laminate than the real one. A
plausible explanation of such a slight difference is that the effect of possible slipping at
the frictional interfaces between adjacent fiber tows or between fibers and matrix is
removed in the model by meshing the stitched composite laminate with tetrahedral
elements that have common nodes between the matrix and the fibers. Slippage may
actually occur during the experiments along these interfaces, which could be the rationale

67
for lower experimental values measured for the longitudinal elastic constant than the
corresponding theoretical predictions.
5.2 Recommendations
The primary goal of this research work was to evaluate the global elastic properties of
stitched E-glass/Epoxy composite laminates through theoretical predictions of a
geometric and finite element model developed specifically for such materials, as well as
experimental results obtained from standard material characterization tests.
Since the double cantilever beam (DCB) test results reveal that the relative orientation of
the stitching line for translaminar reinforcement with respect to the crack opening
direction at the onset of delamination affects drastically the measurements of opening
Mode I interlaminar fracture toughness characteristics, it is recommended that additional
DCB testing be performed to improve the reliability of the test results, especially for
stitching in the parallel direction to that of crack growth. Further, the interlaminar
fracture toughness corresponding to a stitch line oriented in the direction perpendicular to
that of the crack propagation could be improved by employing an additional through-the-
thickness stitch line in the same direction, besides the one that already exists. However,
the benefits associated with any increase of stitch density by the addition of stitching
lines have to be carefully weighed against potential degradation of the in-plane elastic
properties of the laminate, as demonstrated by the findings reported in this thesis.

68
Furthermore, it is recommended that future DCB experiments be conducted by using a
new testing fixture developed by Chen, Ifju, and Sankar [5]. Their proposed fixture is
expected to enhance the accuracy of DCB test results by alleviating the high bending
moments that often arise at the tip of the delamination during the Mode I crack opening
process, thus ensuring that the recorded failure occurs through delamination, and not by
compressive microbuckling of the outer layers of the specimen. A modified analysis
method for establishing the necessary relationships between the applied load, the opening
deflection and the energy release rate has to be applied in conjunction with the new
testing fixture [5].
The theoretical model developed in this research is capable of predicting the global
elastic constant of the stitched laminate in the longitudinal direction to a good degree of
accuracy, as proven by the fact that the theoretical value is different by only 2.9 percent
approximately from the corresponding experimental value. The theoretical model could
be further enhanced in the future by incorporating frictional elements at the matrix- fiber
interfaces. An additional enhancement could be formulating the model so it can
accurately simulate the behavior and results of DCB testing through (1) the simulation of
an insert for a portion of the RVE and (2) provide proper boundary conditions and loads
that correspond to the actual testing procedure described in Chapter 4.

69
BIBLIOGRAPHY 1. ANSYS, Inc., “ANSYS Online Manuals Release 5.5”, Tenth Edition ANSYS Release 5.5,
1998, http://euler.cesup.ufrgs.br/ansys/realtoc.html 2. Avila-Dominguez, Rafael, Ph. D. “Composites Manufacturing Using Non-Crimp Fabrics
(NCF)”. Structures and Materials Centre, United Kingdom, www.instmat.co.uk/iom/organisations/escm/newsletter4/fabrics.pdf
3. E. J. Barbero, Introduction to Composite Materials Design, Taylor & Francis,
Philadelphia, 1999. 4. Chatterjee, S.N., Flanagan, G, and Kollegal, M. “Progressive Failure Analysis of Plain
Weaves Using Damage Mechanics Based Constitutive Laws”. Materials Sciences Corporation, www.materials-sciences.com/papers/textiles.pdf
5. Chen, Leishan, Sankar, Bhavani V. Ifju, Peter G. “A new mode I fracture test for
composites with translaminar reinforcements”, Composites Science and Technology, Vol. 62, 2002, pp. 1407 – 1414.
6. Dasgupta, A., Bhandarkar, S., Pecht, M., and Barkar, D., 1990, "Thermo-elastic properties
of woven-fabric composites using homogenization techniques", Proceedings of the American Society for Composites. Fifth Technical Conference, Lansing, Michigan, pp. 1001 - 1010.
7. Drapier, S. and Wisnom, M.R. “Finite Element Investigation of the Non-Crimp Fabrics
Compressive and Interlaminar Behaviours”. Mechanical and Materials Engineering Department of Ecole Nationale Superieure des Mines de Saint-Etinne, France, and Department of Aerospace Engineering, University of Bristol, United Kingdom, www.emse.fr/~drapier/ficPDF/NCF%201CCM12.pdf
8. Electrical Data Systems (EDS), “FEMAP”. http://www.eds.com/products/plm/femap/ June
29, 2003 9. FEMAP Commands Version 8.0, Structural Dynamics Research Corporation (SDRC),
1989 – 2000, Exton, PA. 10. Flanagan, Gerry and Furrow, Keith. “Parametric Studies of Stitching Effectiveness for
Preventing Substructure Disbond”, Mechanics of Textile Composites Conference, NASA, October 1955, pgs. 539 – 554.
11. Ishikawa, T., Y. Iwahori, Y., Nishii, N., and Watanabe, N. “FEM Simulation of DCB
Tests for Stitched CFRP Laminates”, American Institute of Aeronautics and Astronautics, Inc., 2001, pp. 2418 – 2426.
12. Mouritz, A.P., Leong, K.H., and Herszberg, I. “A review of the effect of stitching on the
in-plane mechanical properties of fibre-reinforced polymer composites”, Composites, Part A: Applied Science and Manufacturing, May 1997, pp. 979 - 991.

70
13. Sharma, S.K., Sankar, B. V. “Effect of Stitching on Impact and Interlaminar Properties of Graphite/Epoxy Laminates”, Journal of Thermoplastic Composite Materials, Vol. 10, May 1997, pp. 241 - 253.
14. “Standard Test Method for: Mode I Interlaminar Fracture Toughness of
Unidirectional Fiber-Reinforced Polymer Matrix Composites.” American Society for Testing and Materials, Designation: D 5528-94a, Annual Book of ASTM Standards, Vol. 15.03, 2000.
15. “Standard Test Method for: Tensile Properties of Polymer Matrix Composite
Materials.” American Society for Testing and Materials, Designation: D 3039/D 3039M – 00, Annual Book of ASTM Standards, Vol. 15.03, 2000.
16. Tsai, G. C. “Stitched Composite Laminates”, 23rd International SAMPE Technical
Conference, October 21 – 24, 1991, pp. 297 –313.