modeling and simulation of evacuation plan for hancock stadium · illinois state university isu...
TRANSCRIPT

Illinois State UniversityISU ReD: Research and eData
Theses and Dissertations
3-23-2015
Modeling and Simulation of Evacuation Plan forHancock StadiumNirmal Neranjan WeerasekaraIllinois State University, [email protected]
Follow this and additional works at: http://ir.library.illinoisstate.edu/etd
Part of the Business Administration, Management, and Operations Commons, Civil EngineeringCommons, Computer Sciences Commons, and the Management Sciences and QuantitativeMethods Commons
This Thesis and Dissertation is brought to you for free and open access by ISU ReD: Research and eData. It has been accepted for inclusion in Thesesand Dissertations by an authorized administrator of ISU ReD: Research and eData. For more information, please contact [email protected].
Recommended CitationWeerasekara, Nirmal Neranjan, "Modeling and Simulation of Evacuation Plan for Hancock Stadium" (2015). Theses and Dissertations.Paper 389.

MODELING AND SIMULATION OF THE EVACUATION PLAN FOR HANCOCK
STADIUM
Nirmal N. Weerasekara
67 Pages August 2015
The goal of this study is to use Modeling and Simulation of Evacuation Plan
(MSEP) to support management to execute proper evacuation plan in case of emergency
at Hancock Stadium in Illinois State University. Analyses of the research literature and
evacuation scenarios are used to build a simulation system that will connect a description
of emergency and evacuation situation with its context. It shows how an evacuation plan
actually functions. The results of the study will help safety managers to understand the
current situations of evacuation according to the specific simulation scenarios. The
evacuation simulation is categorized according to the types of emergent situations and the
number of evacuees. Each simulation is validated according to the real time data
collected through observations and the published literatures. The practical implications of
the research include the developed system to be used in case of emergencies and the
experience gained will help future design of large-scale venues and facilities. This
research innovatively used Building Information Modeling (BIM) technology, Dijkstra
and Open Cleared Path algorithms, and Pedestrian Dynamics® simulation system for an
open-space, steel structure in evacuation routes.

MODELING AND SIMULATION OF THE EVACUATION PLAN FOR HANCOCK
STADIUM
NIRMAL N. WEERASEKARA
A Thesis Submitted in Partial Fulfillment of the Requirements
for the Degree of
MASTER OF SCIENCE
Department of Technology
ILLINOIS STATE UNIVERSITY
2015

© 2015 Nirmal N. Weerasekara

MODELING AND SIMULATION OF THE EVACUATION PLAN FOR HANCOCK
STADIUM
NIRMAL N. WEERASEKARA
COMMITTEE MEMBERS:
Haiyan Xie, Chair
Klaus Schmidt
Anu Gokhale
i
ACKNOWLEDGMENTS
I would like to express my appreciation to my committee chair, Dr. Haiyan Sally
Xie, who has been helping me to complete my thesis successfully. She suggested the
thesis title, which was unique and with high research significance. The success of this
thesis would not be possible without her guidance and support. Her advice and ideas were
valuable inputs which made the thesis professional and of high quality.
I would like to express my sincere gratitude to committee members, Dr. Klaus
Schmidt and Dr. Anu Gokhale who also have been supporting me to complete the thesis.
I learned the essentiality of using models and simulations for the evacuation plan of the
Hancock Stadium of Illinois State University from them. Their engagement in the study
helped me to organize the literature review and to explore the techniques of the research.
In addition I would like to thank my mother (Lalitha Withanachchi), farther
(Ranjith Weerasekara), sister( Rangani Weerasekara), and my wife( Harhsani De Silva
who have been supporting me since I started my graduate-level studies in Illinois State
University. Special gratitude also goes to Kanishka Wickramanayake, Reina Ikemoto,
Hansani Pathmakumara and Madhusha Sarathchandra for supporting and providing
expert knowledge for the thesis. I would also like to thank Ramitha Dabare and Bimsara
Ranasinghe for providing valuable resources to my thesis.
N. N. W.

ii
CONTENTS
Page
ACKNOWLEDGMENTS i
CONTENTS ii TABLES iv
FIGURES v
CHAPTER
I. INTRODUCTION 1
Background of the Research 1 Purpose of the Thesis and Research Question 3 Significance of the Study 4 Assumptions 5 Hypothesis 5 Definitions of Terms 6 Limitations 6 Delimitations 7 Summary 7
II. LITERATURE REVIEW 8
Public Safety and Simulation 8 Related Studies and Researches Simulation of Crowd Behavior 11 Algorithms and Theories 16 BIM for Large Structures 19 Safety Issues in Large Crowd Areas 22 Comparison of Simulation Software 24 Case Studies 28
Phillips Stadion Soccer Stadium Case Study 28
University of Southern Mississippi Football Stadium Case Study 29
iii
III. METHODOLOGY 30
Materials, Equipment, and Procedure 31 Data Collection 33 Calculation Methods 34
IV. SYSTEM DESIGN AND RESULTS ANALYSIS 37
System Design 37 Results Analysis 38
V. DISCUSSION 50
Current Simulation with Pedestrian Dynamic System 50 Range of Validity 55
VI. CONCLUSIONS 58
VII. RECOMMENDATIONS AND FUTURE WORK 60
REFERENCES 61

iv
TABLES Table Page
1. Comparison of Simulation Software 27
2. Observed Evacuation Time from a Randomly Selected Seat 34
v
FIGURES
Figure Page
1. BIM Framework 13 2. Example Grid View for Calculating the Shortest Path 17
3. Computing Algorithm of a Sample Route 18
4. CAD Model of Philips Stadion Soccer Stadium 28
5. North Pavilion 31
6. Hancock Stadium Seat Layout 31
7. Example of Density Calculation 35
8. Design of the Simulation System 38
9. Density of an Exit during an Evacuation 39
10. Evacuation Behaviors of Agents 40
11. Number of Agents Moving Across a Specific Place 41
12. Evacuation Behavior in 1000EVAC 42
13. Evacuation Behaviors in 2500EVAC 43
14. Density of Exits 44
15. Density of the Crowd During the Evacuation 44
16. TET of Evacuation Scenarios 45
17. Crowd Density Dynamics of Two Random Locations 46
18. Flow Counts of Two Different Places of the Stadium 46

vi
Figure Page
19. Flow Count of the West Access of the Members’ Area 47
20. The Current Pedestrian Dynamics System 51
21. Process of Formulas Development 53
22. Pseudo Codes for Development of the Formula 54

1
CHAPTER I
INTRODUCTION
Background of the Research
Sport stadiums provide iconic locations for sporting, entertaining, performance,
exhibition, and other social or cultural events, which attract people from all around. Some
people may travel hundreds of miles to watch an important event, such as a football
championship game. But there is a public safety issue with all sport stadiums. Stadiums
create an enormous space to hold a large crowd. There are potential risks of mass
distraction conditions. In stadiums, large groups of people gather together in a limited
space for extended periods of time. Under the circumstances of natural disasters or
anthropogenic (human-made) hazards, such as fire or structural collapse, the crowd inside
a stadium needs to be evacuated. Stadium facility management needs to have a valid and
qualitative evacuation plan to evacuate the crowd safely and effectively. Historically,
people had to manage both natural and man-made emergencies to ensure the protection of
lives and properties. In order to avoid the losses caused by the disasters or hazards,
governments and private agencies have been spending their time and money to develop
specific safety evacuation plans for individual facilities to ensure the safety of people
and/or important goods. With the emerging of visual simulations and 3D modeling
techniques, researchers can now use modeling and simulation tools to gain increased
understanding of a crowd’s social-psychological behaviors.

2
Particularly, parametric models of buildings and facilities can be used together
with evacuation software, to improve the numerical simulation of evacuation plans.
Those new technologies increase the power, accuracy, and ease of the evacuation
processes in planning and designing of large crowd-gathering places. Immediate results
of the evacuation simulations are becoming possible by using real-time systems. The
results can be used to predict the best plan for an emergency situation with computed
reliability. But researchers and practitioners are still concerned with the reliability of the
modeling and simulations because the calculations are performed in virtual conditions.
Because of the various situations in the real world, observations, studies, comparisons,
and analyses must be conducted to calibrate the mathematical modeling and simulation
results for emergency plans.
Many organizations have emergency plans or guidelines. According to the
Campus Safety and Security statement of Illinois State University (Illinois State
University, 2014), the university “is committed to providing a secure and welcoming
campus environment for students, faculty, staff and visitors” (Illinois State University,
2014). The evacuation-route planning is the major and critical objective of the evacuation
plan of the Hancock Stadium on ISU campus. The stadium is capable of facilitating
almost 10,000 audiences. It might become a high risk of hazardous condition when the
large number of crowds suddenly moving out of the facility. In order to build a well-
organized evacuation plan, efficient methods are needed to identify the exit routes and
schedules.

3
Purpose of the Thesis and Research Question
The purpose of this research is to provide mathematical calculations to analyze
the evacuations methods. Using evacuation simulation models lead to the optimization of
possible evacuation routes in the stadium. The evacuation models are built according to
some advanced algorithms and including the parameters of crowd-moving characteristics.
Identifying the evacuation parameters is critical to any evacuation plan. The objectives
of this research include the following (1) study the parameters of evacuation plan by
using Hancock Stadium of ISU: (2) use Building Information Modeling (BIM)
technology and Pedestrian Dynamics® software to design and implement a simulation
system for the improvement of evacuation plans; (3) provide optimized egress-route
suggestions in real time.
The research question in this study is: “Do the results calculated by the proposed
simulation model reflect the real situations in Hancock Stadium?” Particularly, the author
used Tekla® as the BIM tool to provide highly detailed, 3-dimensional parametric
structure models of the facility. The Tekla® model can be combined with the basic
evacuation algorithms, such as the Dijkstra’s algorithm, open shortest path algorithm, and
open-cleared-path algorithm, to build the simulation models. In this research, the
algorithm included two major parameters, which were Shortest Cleared Route (SCR) and
Total Evacuation Time (TET). The research results showed the optimization of the
escape routes based on SCR and the shortest time from the location of each individual in
the audience. The author also considered the horizontal and vertical travels of the
evacuation, which could provide more advanced and effective exit routes. The final
product of the Modeling and Simulation of Evacuation Plan (MSEP) for the Hancock
4
Stadium would improve the emergency management process for disaster preparedness
and response.
Significance of the Study
Since disasters are unpredictable, it is an impossibility to simulate an evacuation
in case of a real emergency. In this research, the author studied the evacuation
simulations for the Hancock Stadium at Illinois State University to remedy the lack of
information and reduce the uncertain variables, when building a simulation model. In this
study, expert knowledge and experiences are reviewed to create evacuation simulations.
The study has high significance to both the design and the implementation of an
evacuation system for large gathering spaces. Safety is always the first priority in a public
event such as a football game. The Hancock Stadium should have a high-quality
evacuation plan to avoid hazardous situations or to minimize potential damage.
The objectives of safety in a business include saving lives, reducing injuries, and
protecting assets. It’s a law to have evacuation plans and procedures according to OSHA
(Occupational Safety and Health Administration) for public facilities (OSHA, 2015).
Hancock Stadium already has an evacuation plan for emergency and regular conditions.
But it has never been tested or used in a true emergency situation, because it’s difficult to
simulate a real emergency situation. This research on the Modeling and Simulation of
Evacuation Plan (MSEP) establishes a comprehensive plan based on these simulations
and helps to catch latent emergent situations. The research findings also suggest that
people should pay more attention to the handicapped areas in the stadium. In the future,
people can add to this research with the variables to reflect human behaviors, such as the
behavior affected by alcohol and a potential state of panic when an emergency occurs.

5
Assumptions
The assumptions made in the study are listed below:
1. All the exit routes are clear.
This assumption is made to ensure that the evacuation routes are ready-to-use in
the process of evacuation according to the simulation.
2. The crowd is aware of exit doors and evacuation procedures.
This assumption is to avoid the unexpected crowd bottleneck in exit routes.
3. Emergency power supply is ready or in use.
This assumption is made to ensure the visibility of the exit routes to avoid crowd
panic. The assumption assures clear views in case of emergency.
Hypothesis
The main purpose of this thesis is to suggest an evacuation system using
simulation models for the Hancock Stadium’s emergency management. The main
research question is based on the Total Evacuation Time (TET). The author will compare
the results calculated by the proposed simulation model with a real situation of
emergency evacuation. To perform the comparison, average real evacuation time and
average simulated evacuation time will be compared to verify whether the calculated data
reflect a real evacuation. Statistical one tail T- test and Mann-Whitney U-Test be used to
analyze the two means, which are real evacuation time (TET1) and simulated evacuation
time (TET0) with 90% confidence level.
H0: TET1 = TET0 H1: TET1 ≠ TET0

6
Definitions of Terms
H0- Null hypothesis
H1-Hypothesis
Dx- Distance to a nearest exit from and each individual location
Tx- Time taken to reach to an exit
Cx-Capacity of exits
Vx Volume of the crowd in an exit
SCP- Shortest Cleared Path
TET- Total Evacuation Time
Limitations
The following items are the limitations of the research:
1. There was no real field data to verify the simulation results of Hancock Stadium.
At the time of this research, there had not been any serious emergent evacuation
in the history of Hancock Stadium at ISU. According to an interview with the stadium’s
safety officers, Dan Hite and Eric Hodges (M.A., CEM), on April 3rd 2015, there were no
surveillance cameras installed in the facility. It was an obstacle of the research because
the author was unable to analyze any video data recorded at the stadium for validating the
evacuation simulation scenarios.
2. Expensive software.
Pedestrian Dynamics Studio software is industrial level software for simulations.
It is expensive for the student users. The price of the annual subscriptions is $9,950.00.
3. Data might be skewed. The site data are measured from young adults. But general
audience includes people of all ages.

7
4. The simulation did not consider power-outage situation.
Delimitations
The following items are the delimitations of the research:
1. The author used literature, data from other stadiums, and field tests.
2. The author used the trial version of the software.
3. The author added adjustment factors to the field data.
4. The simulation had both a power system and an emergency-backup system.
Summary
The purpose of this thesis is to study evacuation scenarios for Hancock Stadium
using models and simulations. The main goal is to implement BIM-based simulations to
enhance the evacuation plan of the stadium. The simulation is compared with real-time
evacuation behaviors to ensure the accuracy and the validity of the parameters. The
simulation and the model are built with assumptions based on unavoidable limitations.
The evacuation model can assist safety authorities to compute the shortest path from
different locations of the stadium with minimum bottleneck. It also calculates the shortest
evacuation time. The study on the evacuation plans of buildings and structures provides
safety and protection to the players and the audiences.
8
CHAPTER II
LITERATURE REVIEW
Public Safety and Simulation
Public safety is becoming one of the critical factors in every business. The field is
getting more complex and expanding everyday due to the rapid development of the
human activities. Scientists get more interested on the evacuation research. It becomes a
necessary service in every facility because even buildings are identical; they have unique
structural designs and geographical differences. Therefore evacuation plans vary from
one building to another. An architect needs to understand the evacuation plan when he or
she is planning the building design. The essentiality of an evacuation plan is to vacate a
crowd safely as soon as possible. If a facility doesn’t have a proper evacuation plan, a
tragedy may happen with the losses of lives and property damages. The purposes of an
evacuation plan are the safety of evacuees and properties. History provided best
examples of the essentiality of a proper evacuation plan. For example, 21 persons died in
a nightclub incident in Chicago, IL in 2003 (CNN, 2005). There were 602 people died in
a fire Iroquois Theater in Chicago, IL in 1903 (EASTLAND MEMORIAL SOCIETY,
2007). In the 2001 stampede in the Kinshasa Soccer Stadium, 120 people died because
of police tear gas fire to control the trouble crowd in the stadium (NYDailyNews, 2015).
Disasters could occur in any facility with a poorly designed evacuation plan.

9
Sport games attract the people from everywhere in the world and its getting more
professional and interesting over the time. Sport games bring the unity and connection
between nations globally. On the other hand, because of the huge sizes of audiences in
sport games, people in the sport facilities could be the potential terrorist targets. The
terrorist attack in Boston Marathon on April 15, 2013 (Massachusetts Medical Society,
2015), is an example that the terrorists wanted to get public attention by targeting on
sport events. Three people were killed and 264 were injured from two improvised
explosive devices (IEDs) in the 2013 Boston Marathon. It was the first incident to cause
live lost and massive injuries in the history of the United States. Natural incident and
man-made hazardous emergencies could also occur, which cause the potential life-
threatening incidents to both sport teams and audiences. Sport stadium provides enough
space to gather a large number of people for a limited times, hence the risk of mass
destruction is high. That is the reason why a sport stadium should have proper safety and
evacuation plans. The proper evacuation plans should be deployed to evacuate the teams
and the audiences in a stadium without provoking damages to the properties and human
beings. A stadium usually provides the following functions: (1) seating space for
audiences; (2) space for teams in a game; (3) lighting, audio, video, and security devices;
(4) space and functions for public media; (5) food service; (6) restrooms; (7) lockers; (8)
entrance and exit control; etc. The multiple functions of a stadium makes the inside
design of it complex and confusing to ordinary people. When evacuating a large number
of crowds in case of emergency, it is very easy for people to get lost and panic if effectual
and efficient evacuations plan is not deployed. Among the large-size facilities, sport
stadiums are much different from other ones because their interior designs need to

10
provide enough slopes for the audiences to watch the game fields. The steps and slopes in
the stadiums could cause more hazardous than other facilities. When an incident occurs,
the whole crowd in a stadium can catch the sight of the incident or disturbance. They all
could be panic at the same time. Without any indication, the directions to leave the spot
are not clear to the audience because of the interior design of the facility. That is the
reason why a stadium should have a valid evacuation plan to avoid causalities and
property damages (Graham & Johns, 2012). For incident prevention and avoidance
purposes, governments also established the corresponding safety measurements and
guidelines for crowd control at stadiums (Department of Homeland Security , 2008). The
uncoordinated motion of the crowd may lead to jamming, pushing, crushing and
trampling. In any of these circumstances, an individual’s control over his or her own
movement becomes impossible (Wang, Lo, Wang, Sun, & Mu1, 2013). Shock waves
may propagate through the crowd mass and cause uncontrollable surges (Wong, Lo,
Wang, Sum, & Mu, 2013). Hazardous incident could be generated during an unregulated
evacuation process. Crowd density plays a critical role in the evacuation process.
Relationships between the evacuation time, the nearest path, and the crowd density are
the keys to build a proper evacuation plan. The speed of moving crowd should be
regulated during evacuation because one of reason for the crowd bottleneck is the
unregulated speed. Exits have limited spaces. Hence the crowd should move at certain
speed. Sometimes evacuation path can be intentionally made a little longer to minimize
the crowd bottleneck in a stadium in order to control crowd density.
Computerized evacuation-simulations have been identified as integrated solution
for evacuation plans. They are created based on the recommended requirements by the
11
authorities, such as FIFA (Fédération Internationale de Football Association), UEFA
(Union of European Football Associations), and the government safety-enforcement
officers. Software applications of simulations are capable of generating realistic crowd
movements with 3D visualization. They provide the detailed output results based on
industrial standards of drawings and models. Simulation software, which is specially
designed for stadiums and arenas, can provide insight into visitor flows and possible
bottlenecks in the modeled situation (INCONTROL, 2015).
Related Studies and Researches Simulation of Crowd Behavior
Evacuation simulations are built for each individual facility. Different evacuation
models are based on various design strategies or data types. For example, Geographical
Information System (GIS), Agent, Cellular Automata Model and BIM, are used to assist
simulations. Various approaches are proposed for modeling movement and simulating
multiple human beings (Manmarus & Zarboutis, 2007). In addition, researchers are
studying the simulations of virtual or constructive agents. Virtual agents mean that real
people operate simulated systems. Constructive simulations mean that simulated agents
operating simulated systems. Agent-based methods can generate fast simulations using
simple local rules that can create visually plausible flocking behavior (Manmarus &
Zarboutis, 2007). Agent based models provides significant advantages for crowd
simulations. The agent-based models are flexible and save time and cost. An agent-based
system also provides a natural description of a crowd simulation. It can capture emergent
phenomena, which means that the interaction between two or multiple agents can be
identified. There are two types of techniques for the agent-based models: time-sliced and
event oriented models. They are used to schedule the functions based on the time or
12
corresponding queue of instructions. The microscopic and macroscopic techniques used
in the models build the simulations based on the levels of details needed. Macroscopic
technique uses group-level mathematical models to simulate the continue simulations.
Microscopic technique uses the details of individual agents with more functions.
Therefore, the agent-based methods offer attractive benefits, i.e. producing realistic and
detailed simulations. In this case, agent-based methods are recommended for modeling
the large-scale evacuation. Basically an evacuation model focuses on 3 major tasks,
which are (1) move to the nearest exit, (2) try to move to the area with low crowd density,
and (3) try to avoid obstacles on evacuation route (Xie & Li, 2014). The 3 tasks become
complex with the increase of the size, capacity, and design of a floor plan of a stadium.
The speed of an individual and the direction of the movement are used as the parameters
of the simulation of an evacuation process. The walking speed of a pedestrian is
determined solely by the density of the surrounding pedestrians according to their moving
speed, and the behavioral characteristics of the pedestrians (Wong, Lo, Wang, Sum, &
Mu, 2013). The major objective of the evacuation simulation in this research is to identify
a model, which has the least time taken during an evacuation process. One problem of the
studies on evacuation simulation is to identify the smoothest evacuation route and
simulate the evacuation situations on real-time. The evacuation process may differ due to
the cause of an evacuation, such as fire, lightning strike, and man-made incidents.
Researchers argued that the multi-model and multi-agent system could generate an
evacuation simulation close to real evacuation process. It’s necessary to have a smooth
connection between models and evacuation strategies to make an evacuation process
productive and efficient.

13
Various kinds of modeling and tools are built for evacuation simulations. For
example, using CD ++ took kit; the Cell-DEVS modeling environment can be
implemented to run the evacuation simulations remotely (Wang, Gabriel, Goldstein, &
Khan, 2013). It can load IFC files through the BimServer.org. Figure 1 describes the how
BIM framework works.
Figure 1: BIM Framework
The approach described in Figure 1 aimed at the real-time crowd behavior at a
facility. The feature of the evacuation software included collision-avoiding and crowd
behavior functions. Cell-DEVS model was an indoor navigation system. It was similar to
such as GPS, but with more accurate details of the positions of the agents, which are
14
virtual representations of audience. In the situation when everyone uses a smart phone or
a smart device, this technology can broadcast evacuation routes to every device.
Cellular Automata model was a simple and smart model that was built using the
concept of distance map (Xie & Li, 2014). The advantage of the Cellular Automata
model was the features of avoiding obstacles and calculating the shortest path to handle
the evacuation simulation efficiently. The disadvantage of the model was that the
distance map concept only defined a two-dimensional grid cell. The distance calculated
cannot be used for a multi-floor building. The distance map concept was one of the basic
theories of a indoor navigation system. The programming language was usually Visual
Studio C++ for this Cellular Automata model. Since C++ language doesn’t have the
automatic memory allocation for stack handling, the author of this thesis recommends
Java for programming purpose.
Evacuation management projects need to connect well between the layers of
hardware, communications, and applications. Evacuation simulations can be built with
not only to display the crowd behavior but also to simulate the operations of alarm
systems, dynamic signage, and other operations (Chiu, Zheng, Villalobos, & & Gautam,
2007). These simulations are based on various methods such as discrete method, agent
based, Cellular Automata, particle dynamic, and continuous method. One of the most
widely used methods is agent-based simulation method. Its techniques include collision
avoidance and behaviors modeling. The agent-based system combined with Local-
Versus-Global technique can produce an indoor and outdoor navigation for agents.
The simulation can be compared with the observable data such as the surveillance
video for crowd behaviors to check the accuracy of a model (Ballan, Bertini, De Bimbi,

15
Seidenari, & Serra, 2011). People can validate the simulations of evacuations under
normal conditions using the data related to the normal evacuations. But in case of
emergency, it’s hard to validate due to the lack of knowledge of the unpredictable
variables. Therefore researchers have been trying to design hybrid simulation models for
evacuation simulations. For example, the real-time feeds from the surveillance footages
are monitored to investigate the behavior dynamic for the simulations. (Tissera, Printista,
& Luque, 2012). It is also possible to include the social and psychological factors of the
evacuees into the models. Agents were profiled with various human behaviors according
to the variables of the state of mind such as anger, happy, fear, etc. More discussion of
those agents are included in Chapter 7 for recommendations and future work.
Almeida and colleagues implemented multi-agent system model in evacuation
simulations using the Beliefs, Desires, Intention (BDI) techniques (Almeida, Rosseti, &
Coelho, 2013). The model calculated the profiles of the agents according to the social
behaviors of human beings. BDI is where agents are capable of fulfilling the desires
according to the beliefs (i.e. set of rules and knowledge) and intentions (or actions). It
means calculating the functions of how to leave the place from where they are, using the
shortest path and taking necessary actions programs the behaviors of agents. The agents’
attributes are profiled according to the some social related factors, such as knowledge and
experience. The attributes also depend on gender, age, vision and other personal factors.
A Computer Fluid Dynamic (CFD) model, such as the Fire Dynamic Simulator (FDS),
will define the interaction between the environment and the agent. FDS is developed by
the National Institute of Standards and Technology to build a fire evacuation environment
16
in a simulation. The same technology could be used to develop other environmental
behavior simulators for various emergencies.
The simulation software can generate detour routes. But the routes are limited
during an evacuation simulation. The field of evacuation studies is attracting more
scholars’ attentions due to the high needs for the public safety. Therefore there is a high
demand for this type of software applications. Most of the simulation software
applications are expensive in the market. The cost is a major limitation of the software
product.
Algorithms and Theories
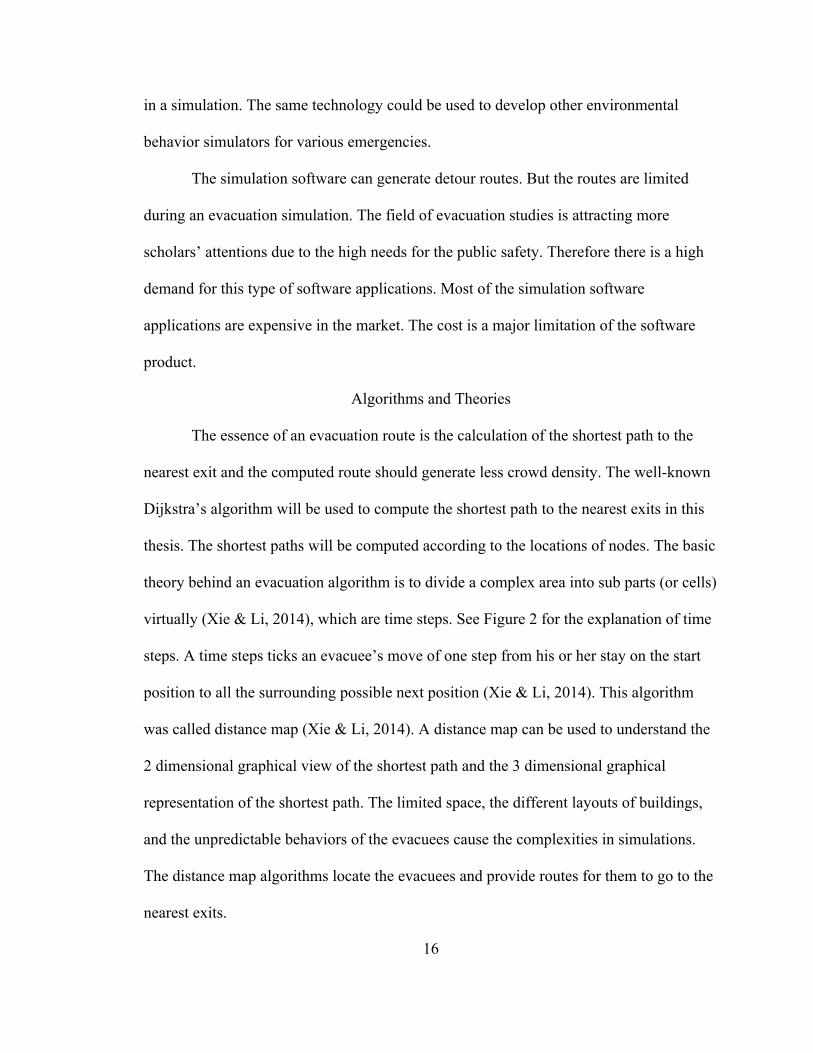
The essence of an evacuation route is the calculation of the shortest path to the
nearest exit and the computed route should generate less crowd density. The well-known
Dijkstra’s algorithm will be used to compute the shortest path to the nearest exits in this
thesis. The shortest paths will be computed according to the locations of nodes. The basic
theory behind an evacuation algorithm is to divide a complex area into sub parts (or cells)
virtually (Xie & Li, 2014), which are time steps. See Figure 2 for the explanation of time
steps. A time steps ticks an evacuee’s move of one step from his or her stay on the start
position to all the surrounding possible next position (Xie & Li, 2014). This algorithm
was called distance map (Xie & Li, 2014). A distance map can be used to understand the
2 dimensional graphical view of the shortest path and the 3 dimensional graphical
representation of the shortest path. The limited space, the different layouts of buildings,
and the unpredictable behaviors of the evacuees cause the complexities in simulations.
The distance map algorithms locate the evacuees and provide routes for them to go to the
nearest exits.
17
Figure 2 shows a simple grid view of the calculation of the shortest path to an
exit. The capacity of the exit is one egress. Therefore the example model demonstrates
the evacuation of one person at a time. Each time the steps that an evacuee moves to the
exit direction will be one cell. In this example the movement follows the least number of
steps in each route. If there is an obstacle, it follows the next least number of steps in the
grid. This basic concept of calculating shortest path is implemented in most of the
software of modern evacuation simulation. The advanced version of the program has
been introduced in the Pedestrian Dynamics (PD) evacuation simulation software to
calibrate a smooth flow of evacuation using global route algorithms (GR) (a.k.a. Shortest
Path ) and indicative route method (IRM), which is capable of managing the broad range
path, avoiding obstacles, and computing smooth path (INCONTROL, 2014).
Figure 2: Example Grid View for Calculating the Shortest Path
Cognitive science approach was introduced to create a realistic spread of crowd
flow. This method is based on the vision and the behavioral heuristics. The method
applies line of sight, visual information, and obstacles details to pedestrian walking speed
and directions to calibrate the action of the avoidance of obstacles and create a smooth
18
flow of evacuation. Navigation technology creates a choice to avoid obstacles, which
gives a clear view of the in-door geometry.
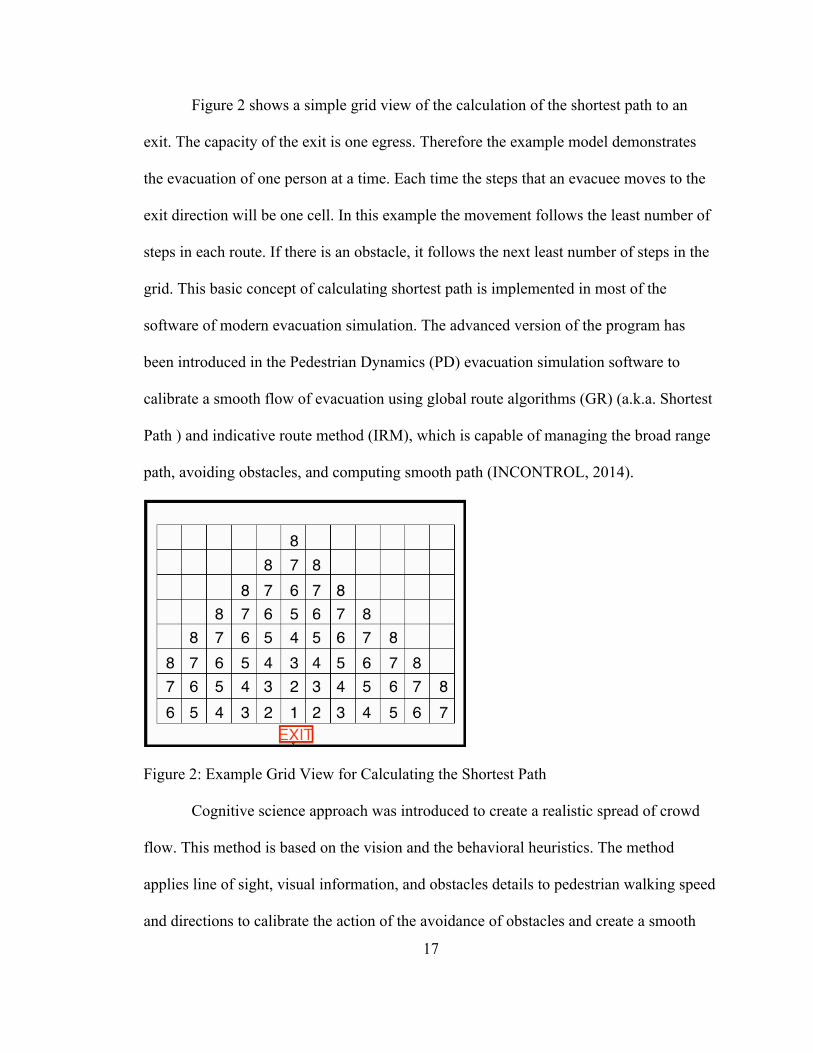
The development of an algorithm needs to consider every definable factor in a
particular environment. Even though Dijkstra algorithm calculates the shortest path, it
cannot define some advanced evacuation routes with shortest paths in the real world.
Such a system needs to have the capability to run multiple algorithms concurrently to
identify the best route for the situations in the real world. Multi-agent simulation should
have the capability to generate various agents with different behaviors for the diverse
situations. The algorithms identify the indoor geometry and generate nodes automatically
for every location. If there are no obstacles between nodes, the location nodes are
connected. Figure 3 shows the algorithm of how to guide an agent through a suggested
evacuation route.
Figure 3: Computing Algorithm of a Sample Route

19
BIM for Large Structures
Building Information Modeling (BIM) technology furnishes a digital and
integrated representation of the actual physical characteristics of a building. It is used in
computer-based fabrications and to share knowledge for resources utilization, design
optimization, technology innovation, and process breakthrough and operations
transformation purposes. When industries deal with large structures, sharing information
is critical to manage projects. In order to run large-scale projects successfully,
information should be shared among designers, constructors, and operators. Presently,
BIM platform introduces the reliable and effective functions for the productive
communication technologies between departments for construction projects. It is a
centralized system. BIM improves communication and the operational efficiency. It cuts
down the time for cross-referencing review and approval. It leads to high productivity
and reduced cost. BIM decreases major reworks of a project (Ahankoob, Khoshnava,
Rostami, & Preece, 2012). Unclear information between the departments of a project is
corrected and updated. As a benefit of BIM, most fabrications can be modeled,
documented and manufactured off site. BIM can provide documents with improved
quality, which are the most related parts to evacuation plans. Infrastructural designers
document 2D and 3D drawing and drafts, with all the information of projects. These 2D
and 3D drawings are be used to identify and define the evacuation routes. Evacuation
simulators can use BIM models as simulation environment. For example, Revit models
and Tekla models can be used as imports to the software. Evacuation plan could also be a
part of BIM. As a centralized platform, BIM also add the safety performance into the

20
system. The evacuation and safety measures could be calculated and arranged before a
project is done.
BIM provides a perfect platform for sharing the information. It is critical for
large-scale emergencies. Stadiums are capable of seating a large number of crowds. Their
evacuation plans should be capable of evacuating a large scale of crowd in the least
amount of time. BIM provides comprehensive building information for visualizations of
the interior design of the stadiums, which helps to build a productive evacuation
simulation. Well-defined information will be gathered by the BIM platform to define the
basic safety measurements. The information will be used to identify the real details of the
exit route, exit doors, and the seat layout of the stadiums. The information can also be
used to compute the capacity, distance, average evacuation time of the exit routes, and
the number of doors. In order to manage the crowd in a stadium, interior designers should
consider the safety measurements. Managing crowd means to divide the seats into
sections and manage the access to the section. Many interior designs of stadiums are
symmetric in layouts. This type of layouts helps to provide the balanced crowd
evacuation from each side of a stadium. In order to avoid crowd bottleneck, the seats in
each section are also managed to have the same capacity.
The approach to develop an evacuation plan for a stadium depends on the features
of the BIM platform. Using the visualization methods, safety management can deploy the
proper evacuation plans for the facilities. Observing real-time human behaviors in an
emergent situation should validate evacuation simulation. It is almost impossible to
validate. BIM plays a significant role of providing real-time and accurate building

21
information in an emergency. But the lack of studies is a major issue to embed the human
behavior modeling into simulation models (Wang , Li , Rezgui, Bradley, & Ong, 2014).
Emergency management of a building is a major part of its life-cycle process. The
emergency plans will be activated in response to particular onsite incidents. It reacts to
real-time human behaviors and facilitates timely information for communications. To
prepare for urgent situations, the common approach is to execute emergency drills
following an emergency plan. The new approach using BIM-based simulations is a major
breakthrough of the industry. It saves money and time (Wang , Li , Rezgui, Bradley, &
Ong, 2014). Computer-based evacuation simulations enable people to utilize databases
and file systems to explore the human behaviors during evacuations. In this research, the
author used a revised Pedestrian Dynamics system to study human behaviors with file
systems following Dijstra and Open Cleared Path algorithm, during evacuations in the
virtual BIM model of Hancock Stadium.
BIM-based simulations have a number of advanced features, such as integrity
analysis and the behavior predictions of occupants. Model driven (MD) architecture and
the Restful Interoperability Simulation Environment (RISE) provide the framework for
the BIM-based simulations. Industry Foundation Classes (IFC) enables the
interoperability of BIM data. Many BIM platforms use IFC to transfer models. For
example, Autodesk Revit, Autodesk 3D Max, Bentley Architecture and Graphisoft
ArchiCAD are all using IFC and its domains to enable the interoperability among BIM
models (Wang, Gabriel, Goldstein, & Khan, 2013). Because of the implementation of
IFC in BIM software, almost all files can be imported to any BIM software. Evacuation
simulations need to have 3D visualizations to check the safety performance of the

22
designs. New evacuation simulation software with BIM functions has been introduced to
the market. The new systems have the following features: (1) they depend on IFC. (2)
Any file of BIM can import to the software. (3) 3D visualization and advanced
evacuation features have been implemented. (4) They can identify the shortest paths and
possible exit doors automatically without manual definition. (5) They have the modes of
active and passive collision avoidances. (6) They use agent profiling and dramatic
human-behavior profiling.
Safety Issues in Large Crowd Areas
Handling a large number of crowds in a limited area is critical and essential for
the safety of people. Especially the places, where a large number of crowds get together
such as stadiums and arenas, should have proper plans to avoid the catastrophic incidents
in case of emergencies. The plan should focus on the evacuation of everyone within
safety time fame and without damaging properties (or with a minimum damage). Every
possible onset event of emergency has to be defined. The evacuation scenarios should be
implemented. The scenarios for fire and for tornado are different and their variables vary
as well. Issues have been found where a large number of crowds get together where the
limited access routes and exit doors. This thesis will highlight some of the issues by
categorizing them to technical, sociological, physical, and resources aspects.
Even though safety management is essential for the most commercial buildings,
the lack of studies and resources decreases the development of the evacuation
technology. One of the major reasons of the lack of studies is the difficulty to define the
variables and evacuation situations. Defining the variables is extremely critical. But their
accuracy of the predictions is not hundred-percent correct. High uncertainty is the hurdle

23
in the path of searching for the best evacuation plan in case of emergency. The
optimization of the possible evacuation scenarios includes using proper algorithms to
generate a productive evacuation plan. Emergency situations happen randomly. It’s
important to hire a safety expert and use his knowledge to prepare for emergencies in
large events.
Stadiums and arenas have designated access routes and exits. Problems may
happen when there is limited space at evacuation routes and exits comparing to the
number of people in the crowd. When the number of evacuees is beyond the capacity of
the limited space of the exits, it causes crowd bottlenecks. It’s difficult to predict where a
crowd bottleneck may occur. But the bottleneck must be handled before it happens. The
layout of a facility, such as a stadium, influences the judgments of crowd and may lead to
crowd panic in case of an emergency, particularly when the open visibility of a person is
affected in the facility. Changing indoor-layout of a facility may prevent crowd
bottleneck. . In a facility when a large number of crowds start to gather at a spot, it is the
time to broadcast the proper navigation system to guide the people to the nearest exits
safely. Currently, there is no effective system or technology that can be used at every
building or a proper device to either send or collect the information to or from evacuees.
The sociological issues in large-scale emergencies are the most vulnerable matters
for safety managers. It’s complicated to determine the psychological situation of the
whole crowd. People tend to panic when they see an incident and try to escape from the
hazard as soon as possible. It’s a natural reaction of a human being to get away from any
life-threatening situation. The reaction is different from each other. It’s hard to believe
that everyone follows the same rules in case of emergencies, let alone that everyone has

24
the awareness of evacuation procedures. The characteristics of social vulnerability
include age, gender, class, people with disabilities, and education. Yet, the various
characteristics in evacuation situations and simulations are not developed in virtual
agents of the simulation systems. The virtual agents don’t have categories according to
those aspects. Children and adults with disabilities in a large crowd need to have
guardians to guide them to evacuate out of the premises. One issue in computer
simulations is to profile agents with weaknesses. The situations make the safety
management complex.
Stadiums should be fully equipped with the Closed-Circuit Television (CCTV),
fire sensors and other safety devices in order to provide complete safety service to
minimize damage in case of emergency. Electricity must be supplied continuously. Even
though almost all stadiums are capable of providing safety service, these are no guarantee
that all the technological devices will be functioning in case of emergencies. Since the
tech-devices are powered by electricity, their services may not be available in case of the
break -down of the power supply in emergencies, such as earthquakes, tornado, and fire.
It is hard to manage a large crowd manually by human. This emergency management
depends on technology when developing evacuation scenarios; experts have to design the
plans under some critical assumptions.
Comparison of Simulation Software
Powerful crowd-simulation software has been introduced in the past couple of
years. The author compared the following simulation software in the study: Massive
Prime, An(i)ma Axyz, Golaem Crowd Generator, Miarmy, Legion, CrowdFX, Pedestrian
Dynamics, 3Ds Max Populate, which are the most powerful simulation software in the

25
market today (VFX, 2015). Massive Prime has been rated as one of best simulation
software in the market, but its primary usage is simulating graphic effects for movies and
games. It also has the engineering applications for emergency evacuations, which provide
accurate imitation of motion and behavior. It is also capable of generating agent-based,
unique, artificial intelligence technology. On the aspect of cost, the product is expensive
(VFX, 2015).
An(i)ma is for architectural visualizations. It’s the cheapest, performance-cost-
balanced software in the market. It works through a plug-in for Autodesk 3Ds Max,
which is leading 3D modeling software in the market. The software is capable of proving
advanced features of crowd simulation, such as crowd cloning and collision handling. Its
most important capability is importing other BIM files (AXYZ, 2015). The populate tool
of Autodesk 3Ds Max is an inbuilt simulation feature. It has crowd behavior options as
well. But the populate tool doesn’t have the advanced features of agent profiling or agent
dynamics based on artificial intelligence. It impersonates crowd movement in a single
floor area. Some real-time features, such as stair climbing behavior, cannot be generated
in the populate tool.
Miarmy and Golaem are animation engine plug-ins, which are capable of creating
realistic crowd behaviors for Maya animations software. They are not specifically made
for the usage of crowd evacuation simulation. Even though they have graphical
capabilities, they do not simulate real-time evacuations in emergencies. Both plug-ins are
not for safety evacuations. One major weakness of Miarmy is that it is incapable of
handling more than 100 characteristics at once. It cannot simulate a large crowd

26
evacuation. The main advantage of it is that it can generate agents with much advanced
behaviors.
Crowd FX, Legion EVAC (or Legion), and PD are the most productive and user-
friendly software for the crowd simulations comparing to the aforementioned ones.
Crowd FX is capable of generating Interactive Creative Environment (ICE) nodes for
crowd simulation, in which, the agents can follow an intelligent navigation process. It
also has the advanced features such as collision avoidance and agent profiling. As an
Autodesk product, Crowd FX gives can import and export the files with other BIM
software. Legion is for operation safety with crowd visualization and security assessment.
Legion is capable of providing advance crowd movement features which can be plugged
into Autodesk 3ds Max. Legions is capable of simulation and analysis to provide
statistical data for decision-making support. It is also compatible with National Institute
of Standards and Technology ’s (NIST) Fire Dynamic Software (FDS).
Pedestrian Dynamic (PD) is ideal for the simulation of emergency evacuation
because it has functional features to generate a real-time evacuation simulation. It
satisfies technical requirements by the demands of safety authorities. It can generate
crowd flows, predict bottlenecks and imitate real-time agent behaviors. It is capable of
developing different emergency scenarios and evaluating mobility of the evacuation
scenarios and infrastructure plans of the facility (Barrett, Beckman, Channakeshava,
Huang, Kumar, & Marathe, 2010). This software is for evacuation simulation inside the
facilities such as stadiums, airports, stations, etc. where large crowds interact.
(INCONTROL, 2015). PD is able to calculate simulations of large crowds up to 100,000
persons. It can import industry standards in various formats, such as CAD, XML, and

27
CityGML. It provides explicit corridor mapping, microscopic and macroscopic
simulations (INCONTROL, 2014). In this research, PD software was chosen because it
offered fully functional, free trial version. It made the research possible to study the
details of simulations with a full functional version of PD. PD software meets the high-
level expectations of industrial needs. But the software itself is the most expensive one in
the field of emergency simulation.
Table 2.1 is the comparison of the functions, advantages, disadvantages, and
applicable areas of the aforesaid software products. Based on the comparison, the author
chose In Control Pedestrian Dynamics to develop the simulation for the Hancock
Stadium at ISU.
Table 1: Comparison of Simulation Software
Name Especially designed for
crowd simulations
Price Technical knowledge
needed
Standard CAD supports
Massive Prime NO Medium-High Moderate NO
an(i)ma® axyz YES Low High YES
CrowdFX YES Medium Low YES
PEDESTRIAN DYNAMICS
YES Expensive High YES
Legion YES Medium Moderate YES

28
Case Studies
Philips Stadion Soccer Stadium Case Study
Philips Stadium has the capacity to host 35,000 soccer fans (Stadiums, 2015) in
an event. The safety management, especially evacuation plans, of the stadium was
optimized using simulation software. PD was introduced as a simulation tool for the
solution of complex safety management in the stadium. It included every scenario of the
possible or imaginable emergencies and regular evacuations. Figure 4 shows the CAD
model of Philips Stadion Stadium.
Figure 4: CAD Model of Philips Stadion Soccer Stadium ( Source:
http://www.bibliocad.com/library/stadium-plan_67932 )

29
After the validation of the exits and access routes of the stadium, evacuation
parameters were designed using the PD of the stadium. Crowd flows; bottlenecks, and
risks were simulated during different evacuation scenarios. From the analysis of the data,
people can find out how the crowds respond to different evacuation scenarios in the
stadium and where the crowd bottleneck occurs.
University of Southern Mississippi Football Stadium Case Study
Geographic Information System (GIS) based, macro-simulation was introduced to
calculate the evacuation time of the Football Stadium of University of Southern
Mississippi (Kar & Zale). The stadium is capable of providing 33,000 of seats for sport
fans. There are 16 exit doors and emergency exits, which allow 25 persons to exit per
second from each door according to the calculations. Simulations were calculated for the
total evacuation times for different evacuation scenarios of emergencies and regular
situations. Normal walking speed of a human being is 1.5 meters per second
(Hoogendoorn & Daamen, 2003). If the evacuation is smooth the stadium could be
evacuated in 200 seconds in an ideal situation. The simulation software used to build the
simulations was with high profile, which is not available to the public use. The GIS-based
platform is currently used only for military and government needs.
30
CHAPTER III
METHODOLOGY The proposed approach to develop an evacuation route would produce optimal
solutions based on the simulation results for proper evacuation plans. The models and
simulations were categorized based on the number of evacuees. Particularly, there are
1000EVAC, 2500EVAC, and 7500EVAC respectively, for the audience groups of 1,000;
2,500; 7500, people. Each simulation generated a different evacuation process, which
was best for that situation. Dijkstra’s algorithm was used to find the shortest path to an
exit. The open-cleared-path-first algorithm was used to execute crowd control with
minimum bottleneck in the shortest path. Combination of those two algorithms would
generate a possible evacuation path with shortest travel time.
According to the aforementioned algorithms, the access routes of Hancock
Stadium would be detoured to the recommended paths. Any of the recommended paths
composed the movement in 3 directions, which are X, Y, and Z-axes of a space
coordinate system. The stages and steps that the bleachers attached to in the stadium
caused the 3-directional movements. Figure 5 shows the section detail and structural
design of the stadium. Moving characteristics of the vertical and horizontal evacuation
may be changed in each simulation. For the simulation purpose in this research, the
crowd was grouped according to their seats.

31
Figure 5: North Pavilion
Figure 6 shows the general seating groups of the stadium. The seats were divided
in to subgroups for the evacuation plan. The simulation results were compared with the
regular evacuation. The detailed discussion of the results of this comparison is included
in Chapter IV. If the results match, the proposed evacuation model and the simulation
could be used in a real time scenario.
Figure 6: Hancock Stadium Seat Layout (Source: Illinois State University)
Materials, Equipment, and Procedure
The modeling and simulation of the evacuation plan for Hancock Stadium have
three major tasks, which are: (1) building the simulation, (2) collecting video surveillance
of events, and (3) comparing and validating the simulation with real-time data. The

32
simulation needs simulation modeling software and high performance computers. The
hardware configuration of the computer used in this research included core i7 processor,
16 GB RAM and NVidia graphics processing unit. The floor plan and the 3D drawing of
the Hancock stadium were needed for the information of the building measurements. Seat
layout graphs were also helpful to divide the crowd into groups.
In the second phase of the research, site data were collected to analyze the real
crowd behavior. The video footages of several events were analyzed for the crowd
behavior in regular evacuations. A digital storage drive and a computer with10GB hard
drive were used to store the video files of the evacuation.
In the final phase of the research, the author compared the differences between
crowd simulations and proposed suggestions for the emergency evacuations in Hancock
Stadium. In this research, the author used Pedestrian Dynamic software for crowd
analysis.
A major task of the project was to calculate TET (Total Evacuate Time) for each
evacuation scenario. The simulation software calculated the capacity of the exits, crowd
density, TET, and Shortest Cleared Path (SCP). The calculations of TETs and crowd
densities of real situations were critical and were done manually. The precision of the
calculation of density was set to 10 seconds in time frames. The first time frame started
when the first person evacuated from an exit. To calculate the SCP for the crowd from
real emergency situations, the author used the same movements of the crowd in regular
conditions. Pedestrian Dynamics software automatically generated the calculations for Tx
(Time take to reach to an exit), Cx (Capacity of exits), Vx (Volume of the crowd in an
exit), and SCP (Shortest Cleared Path) for every phase of the project.

33
The final phase of the research was to validate the evacuation scenarios according
to the real situations. The author identified and validated the crowd movements, response
time, total evacuation time, and crowd bottleneck behaviors in the simulations. The
author also downloaded and imported the real-time videos to the crowd analyzing
software to get the different levels of details of crowd behaviors using microscopic and
macroscopic approaches. The simulation of evacuations automatically generated the
detailed reports of the evacuations. The author then performed the task to identify the
differences between the simulation reports and the reports from real situations. Although
the average response time and the total evacuation time could be validated according to
real records, the validations of the exact crowd-behavior patterns and the locations where
the crowd bottlenecks occur remain a challenge.
Data Collection
The major data for the project was a collection of surveillance video footages
from Hancock Stadium. Since the study focused on evacuation, the video footage with
the records of how people are being evacuated from the facility in special events were
collected. (i.e. home coming and major football games). Since the stadium did not have a
history of emergencies, video footage of emergencies were collected from published
sources. According to the published sources, most of stadium disasters happened due to
crowd crush or pile ups (Lee & Hughes, 2005). The video resources were difficult to
collect when stadiums were in fires or other emergency situations.
Several types of data were collected from the video footage for analysis. The
details of the crowd behaviors, such as where the crowd bottleneck occurs, were collected
using microscopic and macroscopic graphs. It was hard to measure the density of the

34
crowd from with the bare eye. The author used the microscopic and macroscopic graphs
to identify the crowd patterns and the density of the crowd. The average response time
was collected for the further development of the evacuation plan. The average TET was
calculated to validate the simulation scenario of evacuations in regular situations.
The author collected data through an onsite survey about how long it took a
regular person to vacate from one random seat in Hancock Stadium in different ideal
conditions. In this research, the ideal conditions meant that an individual was able to
move freely without any crowd interactions. According to the collected data, the author
discovered that an individual could vacate the stadium between15 and 97 seconds with no
crowd interaction. Table 3.1 shows the sample data collected from the survey.
Table 2: Observed Evacuation Time from a Randomly Selected Seat
Seat Number Scenario 1
Time To Nearest Exit Scenario 2
Scenario 3
5/22 56/8 23/5 39/9 5/11
00:13:86 00:36:98 00:56:32 01:06:65 01:36:60
00:14:66 00:34:00 00:58:20 01:04:12 01:37:91
00:15:80 00:36:44 00:57:90 01:06:12 01:36:45
The data were collected three times for each situation in the survey. The shortest
time happens to those people who stayed at the corner bottom rows of the bleachers. The
people at the members’ areas took longer time to evacuate in the ideal conditions.
Calculation Methods
The calculations on the collected data through observations and the simulation results are
to generate the TET (Total Evacuation Time) for every scenario. The simulations

35
automatically indicated the TET at the end of each process. But the calculation on the
TET based on the data collected through observations for the validation purposes was
conducted manually. The crowd density was calculated for the crowd-handling purposes.
The simulation automatically calculated the average time from every exit. Figure 7 shows
an example of the manual calculation of a real situation from a survey.
Figure 7: Example of Density Calculation
The maximum, minimum, and average distances were also calculated for the
enhancement of the evacuation plan of Hancock Stadium. Calculations were done for
both the evacuation simulations and observation data. If the evacuation has occurred due
to an emergency, the response time was calculated for the analysis. The response time is
the time taken for the first evacuee to reach an exit after the evacuation is triggered.
When the response time decreases, the quality of the evacuation increases. Cx (Capacity
of exits) was calculated manually. It was a permanent value. Vx (Volume of the crowd in
an exit) was a dynamic value, which changed in every evacuation scenario. Pedestrian

36
Dynamics calculated the Vx for every evacuation scenario. Some manual calculations
were done for the validation of the parameters. Because of the random and dynamic
behaviors of the crowd, it was a challenge to manually calculate the SCP (Shortest
Cleared Path) for every timeframe.

37
CHAPTER IV
SYSTEM DESIGN AND RESULTS ANALYSIS
System Design
The flow chart in Figure 8 shows the design of the simulation system. The first
step was to identify the numbers of occupant in the stadium. The author categorized them
into three groups according to the number of occupants (1000, 2500 and 4500). When the
number of evacuees is getting higher, it is riskier to form up certain hazardous conditions
in the facility. The above numbers were selected to provide the good understanding of the
mass behaviors in a large-crowd-evacuation process. The next step was to check whether
the data was from a real time observation or a simulation. The simulation results were
automatically generated after the simulation was done. But the video files had to be
analyzed manually. The next step was to select the cause of the evacuation, which could
be an emergency or a regular evacuation. If it is an emergency evacuation, the reason of
the evacuation should be provided. After that, the system got the data when a random exit
was blocked. The final part of the research was to obtain the data and generate reports.
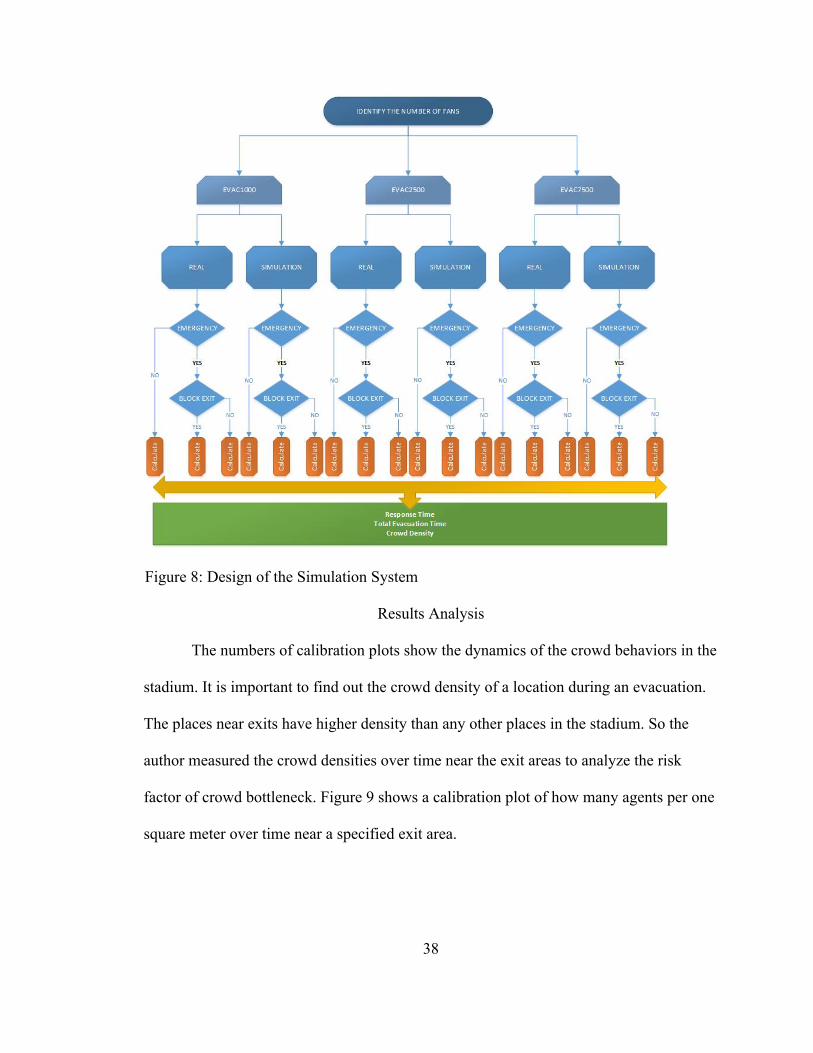
38
Figure 8: Design of the Simulation System
Results Analysis
The numbers of calibration plots show the dynamics of the crowd behaviors in the
stadium. It is important to find out the crowd density of a location during an evacuation.
The places near exits have higher density than any other places in the stadium. So the
author measured the crowd densities over time near the exit areas to analyze the risk
factor of crowd bottleneck. Figure 9 shows a calibration plot of how many agents per one
square meter over time near a specified exit area.

39
Figure 9: Density of an Exit during an Evacuation
One of the major objectives of this research is to calculate the total evacuation
time of each evacuation scenario. Optimizing the data from each evacuation scenario can
produce better opportunities to obtain accurate data. It is important to have the records of
how total evacuation time varies over the numbers of evacuees. The calibration plots in
Figure 10 show the evacuation behaviors of agents during evacuations over time. It also
generates the maximum and minimum time taken for an agent to evacuate from the
facility. The important statistical data such as the standard deviation (SD) and the mean
are also displayed in the plot.

40
Figure 10: Evacuation Behaviors of Agents
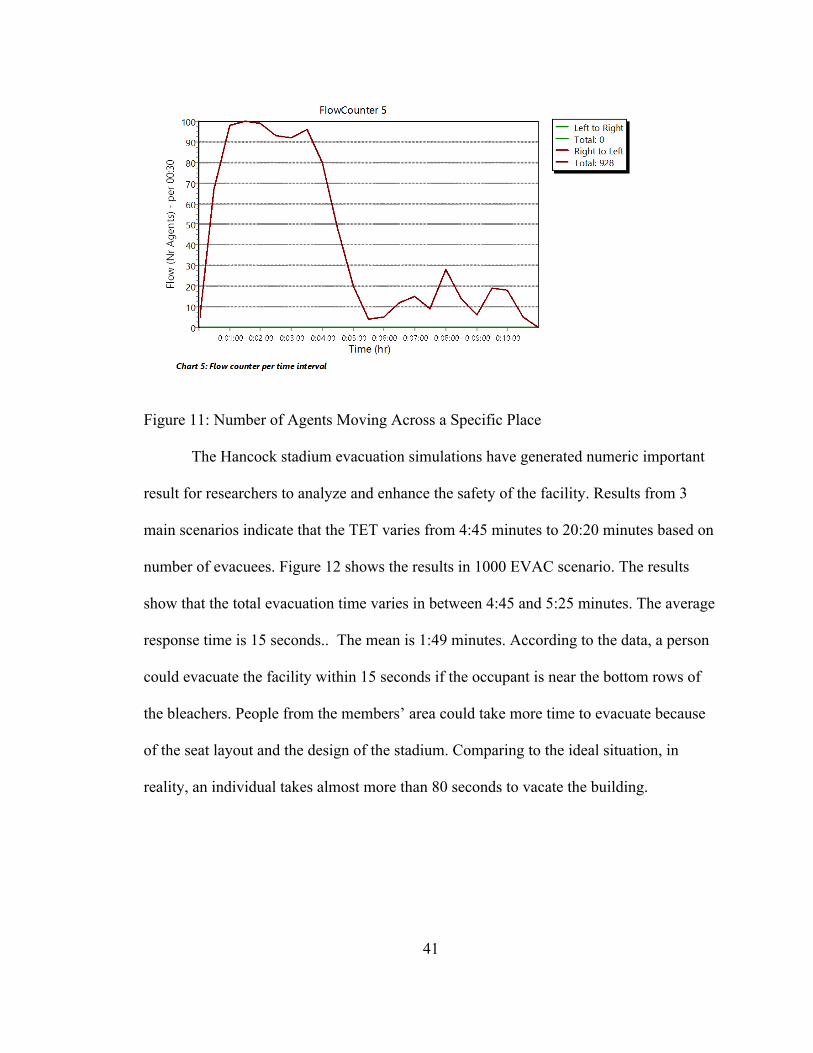
The author used the floor counter to understand the crowd behavior dynamics at
different places in the facility, such as stairs, corridors, and exits. The plot in Figure 11
shows the numbers of the agents moving across a specific place over time. The data in
the graph show how the crowd density changes over time and location. The graph also
indicates the directions of the flow. For example, how many people move across the line
to one direction and how many people move across the line to the opposite direction.
Since this is an evacuation process, it is important to know whether the crowd moves to
the same direction, which is the direction to go out of the facility. The calibration plots in
Figure 11 shows the crowd behaviors when moving toward the direction of exits during
evacuation.
41
Figure 11: Number of Agents Moving Across a Specific Place
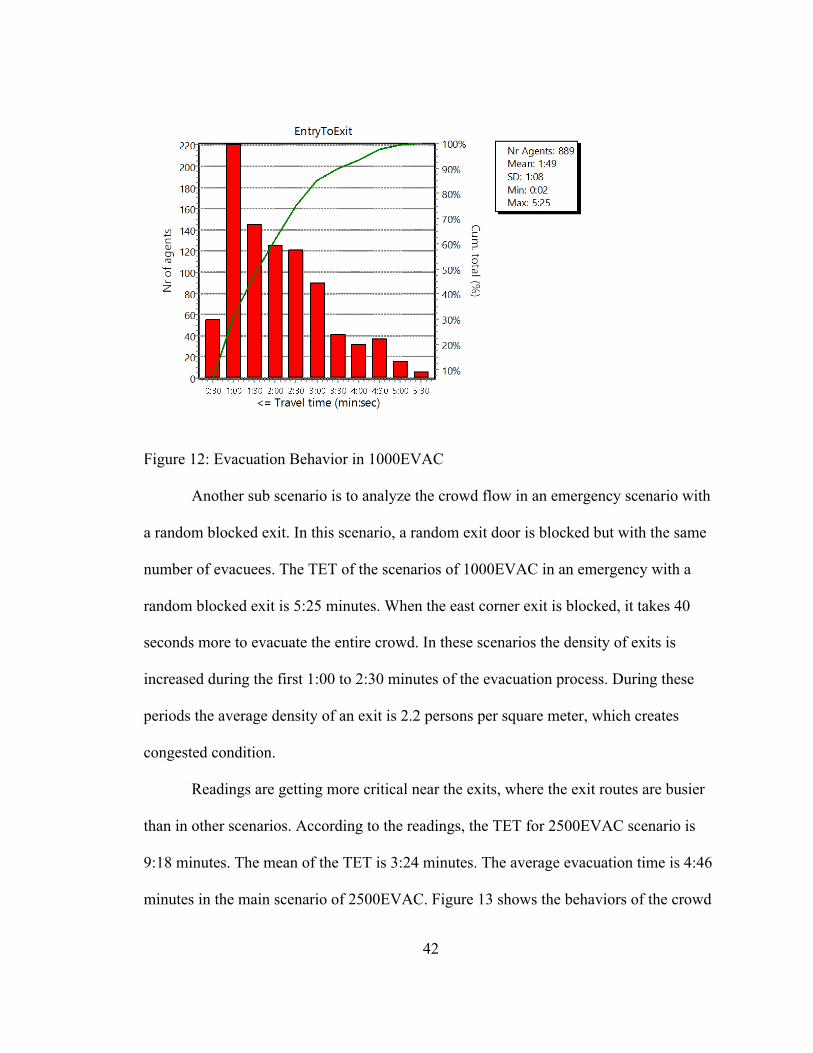
The Hancock stadium evacuation simulations have generated numeric important
result for researchers to analyze and enhance the safety of the facility. Results from 3
main scenarios indicate that the TET varies from 4:45 minutes to 20:20 minutes based on
number of evacuees. Figure 12 shows the results in 1000 EVAC scenario. The results
show that the total evacuation time varies in between 4:45 and 5:25 minutes. The average
response time is 15 seconds.. The mean is 1:49 minutes. According to the data, a person
could evacuate the facility within 15 seconds if the occupant is near the bottom rows of
the bleachers. People from the members’ area could take more time to evacuate because
of the seat layout and the design of the stadium. Comparing to the ideal situation, in
reality, an individual takes almost more than 80 seconds to vacate the building.
42
Figure 12: Evacuation Behavior in 1000EVAC
Another sub scenario is to analyze the crowd flow in an emergency scenario with
a random blocked exit. In this scenario, a random exit door is blocked but with the same
number of evacuees. The TET of the scenarios of 1000EVAC in an emergency with a
random blocked exit is 5:25 minutes. When the east corner exit is blocked, it takes 40
seconds more to evacuate the entire crowd. In these scenarios the density of exits is
increased during the first 1:00 to 2:30 minutes of the evacuation process. During these
periods the average density of an exit is 2.2 persons per square meter, which creates
congested condition.
Readings are getting more critical near the exits, where the exit routes are busier
than in other scenarios. According to the readings, the TET for 2500EVAC scenario is
9:18 minutes. The mean of the TET is 3:24 minutes. The average evacuation time is 4:46
minutes in the main scenario of 2500EVAC. Figure 13 shows the behaviors of the crowd

43
over time. It’s interesting that nearly 50% of the crowd evacuate during the second and
third minutes of the evacuation. There are more than 200 people evacuating during the
second minute of the evacuation process. Figure 14 shows the density of some exits
during evacuations. It shows how serious the crowd bottlenecks at random exits are in
2500EVAC scenarios.
Figure 13: Evacuation Behaviors in 2500EVAC
The stairs near the exits are congested between 2nd minute and 6th minute of the
evacuation process. The average density of the exits is 3.6 persons per square meter
during that period of the evacuation, which creates a potentially hazardous condition on
the stand. The two exits doors are the west corner exit and center east exit of the stadium.
According to the graphs that the west corner exit is congested more times than the center
east exit but the density is higher than the west corner exit.
44
West Exit Center-East Exit
Figure 14: Density of Exits
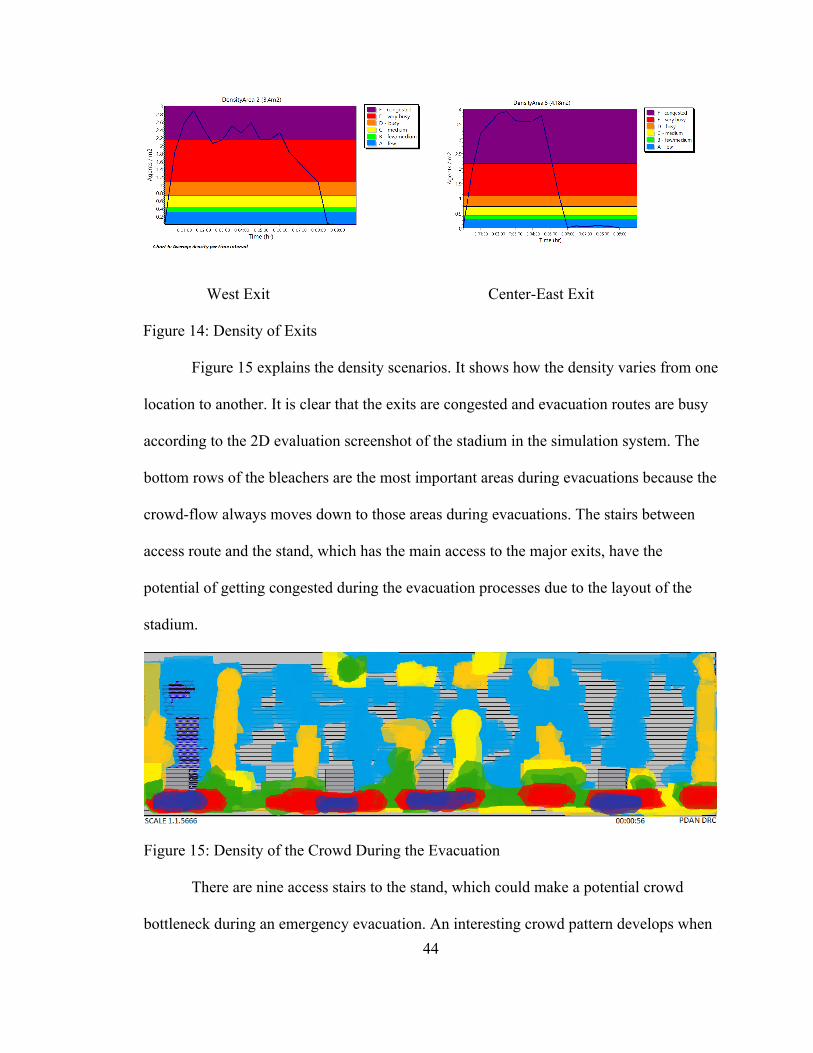
Figure 15 explains the density scenarios. It shows how the density varies from one
location to another. It is clear that the exits are congested and evacuation routes are busy
according to the 2D evaluation screenshot of the stadium in the simulation system. The
bottom rows of the bleachers are the most important areas during evacuations because the
crowd-flow always moves down to those areas during evacuations. The stairs between
access route and the stand, which has the main access to the major exits, have the
potential of getting congested during the evacuation processes due to the layout of the
stadium.
Figure 15: Density of the Crowd During the Evacuation
There are nine access stairs to the stand, which could make a potential crowd
bottleneck during an emergency evacuation. An interesting crowd pattern develops when

45
the crowd starts moving in the members’ area of the stadium. The members are located at
the upper center of the stadium. At the beginning of an evacuation process, they should
move upward to get to an access stair and move down to get to the exits. According to the
survey this area takes the longest evacuation time in ideal conditions. When the center-
west exit gets blocked in the sub-scenario of 2500EVAC, the total evacuation time rises
to 9:28 minutes, which is just 10 seconds more than the regular evacuation time.
It is always critical and challenging when evacuating a full stadium. The capacity
of the main pavilion of Hancock Stadium is up to 7500 individuals. The audience may
reach to the full capacity of the stadium in events such as homecoming. Unlike other
scenarios, in the 7500EVAC, there are more interacts of crowd and exits routes. The
doors are more congested than other scenarios. The 7500EVAC scenario takes 20:20
minutes to perform a full evacuation, which is twice longer than the TET of the 2500
EVAC scenario. According to the graph in Figure 16, the TET increases rapidly with the
growth of the number of evacuees.
Figure 16: TET of Evacuation Scenarios
0
500
1000
1500
1000EVAC 2500EVAC 7500EVAC
Time ( in seconds)
Time ( in seconds)

46
When the numbers of evacuee are high, it takes much time to evacuate people due
to the limited spaces in evacuation routes. Figure 17 shows the crowd densities of two
random locations in the stadium where they could be congested during evacuations.
Figure 17: Crowd Density Dynamics of Two Random Locations
According to the results, the crowd is congested during the first 15 minutes of the
evacuation when accessing the stairs to the exits. The average density of those locations
is around 2.5 evacuees per square meter. Figure 18 describes the flow count of two
different places of the stadium.
Figure 18: Flow Counts of Two Different Places of the Stadium
The first graph of Figure 18 shows the flow counts near the access stairs and the
second graph describes the flow counts of one of a main stairs. According to the first
graph, evacuees are moving in two directions to find the exits. The evacuees are
47
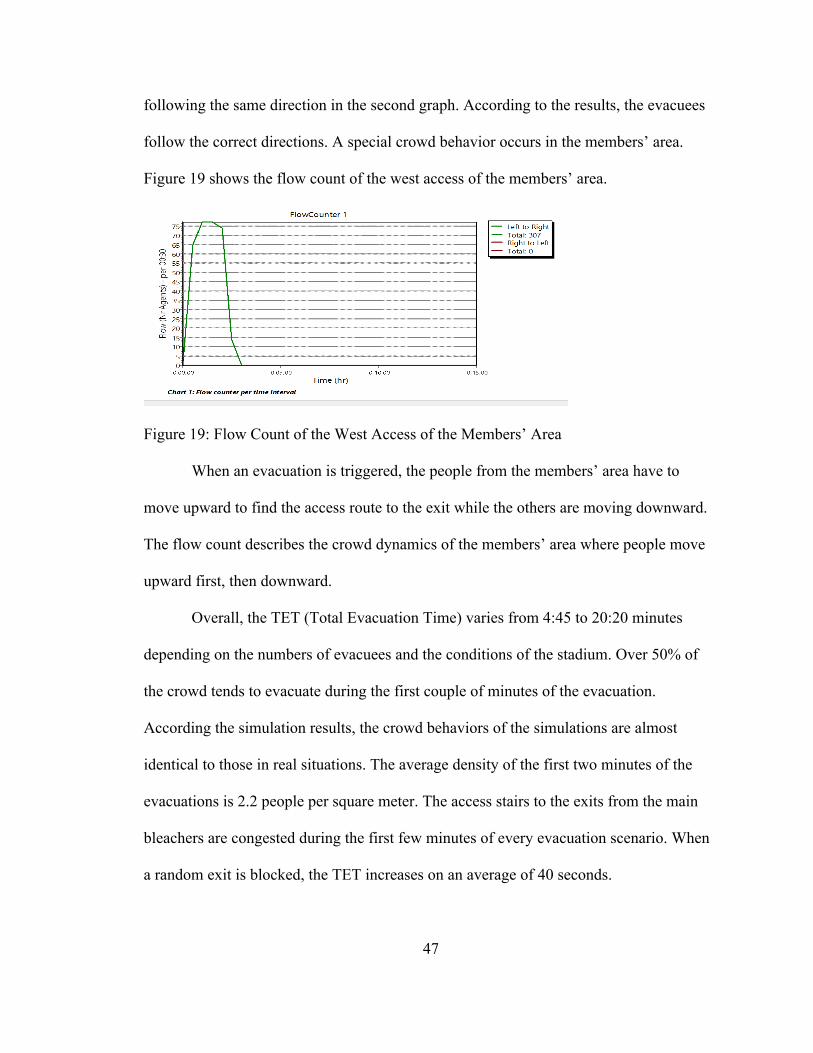
following the same direction in the second graph. According to the results, the evacuees
follow the correct directions. A special crowd behavior occurs in the members’ area.
Figure 19 shows the flow count of the west access of the members’ area.
Figure 19: Flow Count of the West Access of the Members’ Area
When an evacuation is triggered, the people from the members’ area have to
move upward to find the access route to the exit while the others are moving downward.
The flow count describes the crowd dynamics of the members’ area where people move
upward first, then downward.
Overall, the TET (Total Evacuation Time) varies from 4:45 to 20:20 minutes
depending on the numbers of evacuees and the conditions of the stadium. Over 50% of
the crowd tends to evacuate during the first couple of minutes of the evacuation.
According the simulation results, the crowd behaviors of the simulations are almost
identical to those in real situations. The average density of the first two minutes of the
evacuations is 2.2 people per square meter. The access stairs to the exits from the main
bleachers are congested during the first few minutes of every evacuation scenario. When
a random exit is blocked, the TET increases on an average of 40 seconds.

48
Pedestrian Dynamics (PD) software uses a different scheme but generates the
same results as what SCP and Dijkstra algorithms do. The author changed the variable of
the evacuating speed of crowd to improve the accuracy of the simulation. PD uses the
triangular distribution for the speed variable of the algorithm (TRI (0.5, 1.75, 0.86)). The
0.5 meters per second is the average walking speed of people traveling on stairs. The
speed of 1.75 meters per second is the average walking speed of a human being on
ground. The speed of 0.86 meter per second is the average crowd moving speed (C,
Browning, Baker, A.Herron, & Kram, 2006). In this research, normal distribution was
used to get more accurate walking speed for the simulation: (NOML (1.15,0.2)). The
author used µ as 1.15 and σ as 0.2.
According to the safety officials, the average TET of real evacuations is 20
minutes for the 7500 EVAC evacuation scenario. The standard deviation is 3minutes.
According to the simulation results, for the same scenario the average TET is 23 minutes
with the standard deviation as 2 minutes. The T- test results are listed below:
Mean1-Mean2=20.5-23=-2.5
SD=6.5955; SE=6.5955
90% Confidence
p= 0.35234
According to the T test results p (0.352) >0.1, therefore the difference is not
significant at 10% confidence level. The simulation results do not reflect the real-world
evacuations of Hancock Stadium. Mann-Whitney U test results are,

49
Z score = -0.3676
P = 0.35569
U Value = 28
P < or = 0.1
According to the Man-Whitney U test the p is less than or equal to 0.1
(0.35567>0.1). It means the results are not significant at 10% confidence level. Therefore
fail to reject the null hypothesis. The simulation results do not reflect the real-world
evacuations of Hancock Stadium.

50
CHAPTER V
DISCUSSION
Current Simulation with Pedestrian Dynamic System
The development of the system of the Pedestrian Dynamic involves the drawing
of the stadium, the moving behaviors, and path calculating. Figure 20 shows the process
of the current system design. The beginning of the project is to identify the geometric
physical data of the design of the stadium. The software automatically generates the
access route and walking area during the compile process. The entry and exit have to be
defined manually according to the physical design of the stadium. There is a special
feature in Pedestrian Dynamics, which is to enable agent to identify where to show up
and disappear. The next step is to change the parameters such as the number of evacuees,
walking speed, and the distribution method of crowd according to the simulation
scenarios. In the third step, the simulation is performed 10 times per scenario to make
sure the accuracy of the results. Finally the system generates the reports to identify the
crowd behaviors in the stadium, such as density area, time taken to evacuate, where the
crowd bottleneck occurs, etc.

51
Figure 20: The Current Pedestrian Dynamics System
Researchers have implemented equations to calculate the path and the time for
evacuation. The potential function used to compute the evacuation path of the crowd is
shown in equation (1).
α∫p1ds+ β∫p1dt+γ∫p1gdt (1)
Where ds means that the integral is taken with respect to path length. dt means the
integral is taken with respect to time. The letters of α,β,γ are constants for the equation. (
Treuille, Seth , & Zoran , 2006). The first phase (α∫p1ds) describes the path how path
length effect to the evacuation. β∫p1dt solves the time of an evacuation and γ∫p1gdt means

52
the discomfort level in an evacuation. The three factors stated above which are distance,
time and discomfort level are considered to calculate the optimized path in an evacuation
(Same as the calculation of the SCP).
A formula to calculate the evacuation time Ttet for fans to escape from the stadium
is stated below.
Ttet= 1/(fpB’)*(Na-N) + Ks/V (2)
Where the fp is moving rate from an exit, B’ is the width of the exit door, Na is
total number of evacuees. N is who can escape, which can be expressed in terms of the
flow rate of people moving from the building (Candt & Chow, 2006). Ks is the distance to
the location of first evacuee. V is the speed of the evacuee. Figure 21 shows the flow
chart of how the formulas have been developed and used for the evacuation process.

53
Figure 21: Process of Formulas Development
The combination of the two formulas provides the end results of Total Evacuation
Time for the simulation. TET is used in the equations of the calculations of Shortest
Cleared Path. Figure 22 shows the pseudo codes of the development of the formula.
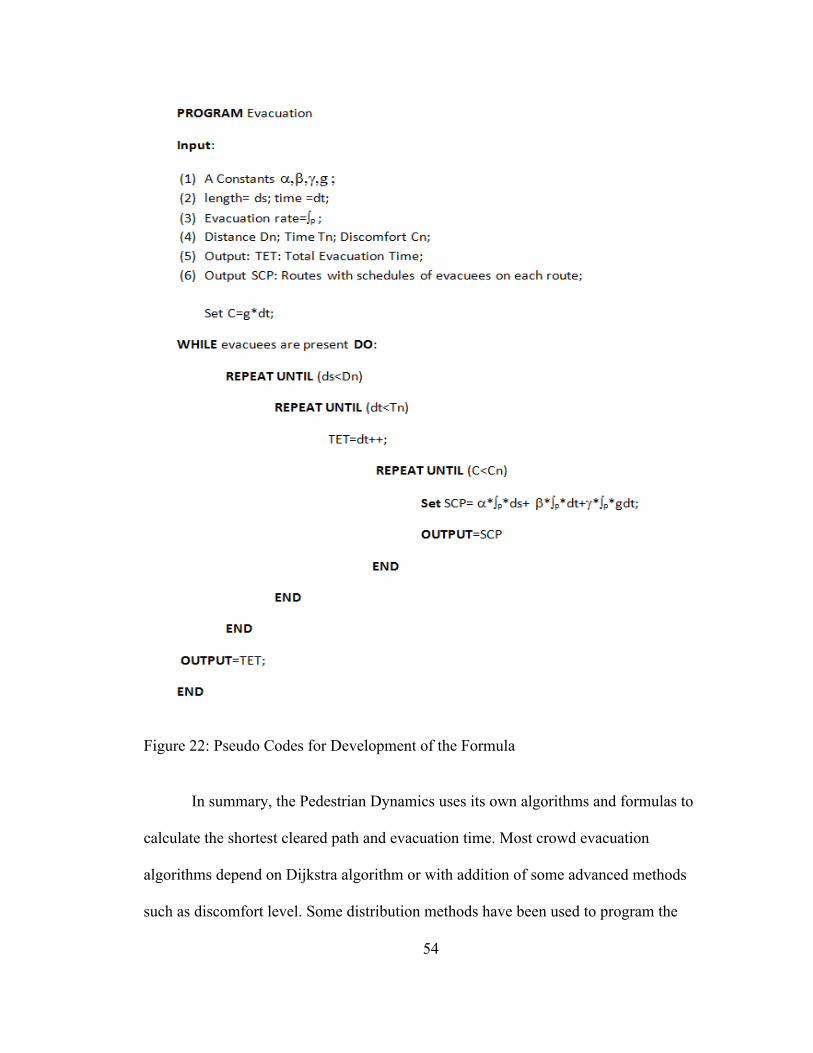
54
Figure 22: Pseudo Codes for Development of the Formula
In summary, the Pedestrian Dynamics uses its own algorithms and formulas to
calculate the shortest cleared path and evacuation time. Most crowd evacuation
algorithms depend on Dijkstra algorithm or with addition of some advanced methods
such as discomfort level. Some distribution methods have been used to program the

55
walking speed and the crowd behavior of the evacuation simulation. Triangular
distribution and normal distribution have been using to calculating the walking speed of
the stair and access routes. Empirical distribution has been used to program the crowd
behavior of the evacuation simulation. The SCP calculation assists to calculate the TET
by adding a count to the time factor of the algorithms which is more accurate than using
the formula of Ttet= 1/(fpB’)*(Na-N) + Ks/V.
Range of Validity
PD simulations can imitate reality like evacuation models for specific evacuation
scenarios. However the simulation does not exhibit some of the risks, behaviors that we
would fine in real emergency evacuation. Even simplified simulation models to study the
complex behaviors of large number of people in different evacuation scenarios, will lack
realistic or unexpected limitations. One of the major limitation is there is no proper way
to profile an agent with social and psychological intelligence assessment capabilities. The
simulation software is capable of performing almost real evacuation using advanced
features such as collision detection, collision avoiding and intelligent movement
dynamics.
In many stadiums, people with disabilities could also be in evacuation. Some
facilities are capable of providing designated evacuation routes for people with
disabilities. PD simulation software has no proper way to design evacuation methods for
people with disabilities. In this research, the author assumed that the people with
disabilities would follow the evacuation protocols and instructions the same as normal
people do.
56
Many audiences are not aware of some evacuation procedures and where the
emergency exits are. To generate a smooth evacuation for the stadium, people must be
aware of the evacuation protocols and procedures. Otherwise crowd patterns will be
changed, resulting in crowd bottlenecks and pile-ups. Therefore another assumption is
that the whole crowd is fully aware of the evacuation protocols and procedure of the
building.
Range of validity of the parameters may vary from one evacuation to another.
Mostly validity of the parameters is moderate in same evacuation scenarios. SCP
(shortest cleared path), TET (Total evacuation time), response time can be validated
according to the situation.
Due to the lack of availability of concrete data regarding the crowd flow of the
stadium, the author performed both Mann-Whitney U-test and one-tailed T-test to
analyze the results. Both tests generated results, which indicated that the P value is not
significant at 90% confidence level. Due to the varying dynamics such as alcohol and
state of emotions, the agent cannot be programmed to include all the necessary variables,
which in turn generates the 90% confidence level. Therefore, the author failed at rejecting
the null hypothesis. The simulation results do not reflect the real-world evacuations of
Hancock Stadium. The author believes that one of the reasons that the simulation results
do not reflect the real-world evacuations is due to the fact that all the agents have not
been programmed individually. Behaviors of individuals vary from one another. However
if the option of feeding specific data per agent was available for the given software,
different results could be expected from the Mann-Whitney U-test and One-tail T-test.

57
During this research, the author gained more knowledge about the essentiality and
the time saving opportunities of the software utilized. It was a great challenge to develop
algorithms, which reflects the actual human behavior, which could be fed into the
software. During the conduction of this research the author detected the presence of
numerous uncertainties of which it was difficult to determine the factors. However, the
following data was collected, fluctuations in the speed of walking, emotional levels,
levels of intoxication, visibility, the layout of the stadium and physical strength. In
addition to these, it is possible that other factors would exist which would also need to be
evaluated to develop a more accurate system.

58
CHAPTER VI
CONCLUSIONS In order to evaluate and improve the evacuation plans of stadiums, this paper
proposed the evacuation simulations to predict the crowd behaviors for crowd evacuation
scenarios based on Pedestrian Dynamics multi-agent software solution. The simulation
model reflected the characteristics, laws, regulations, and standards of crowd evacuation.
This simulation model was capable of dynamically changing to the local conditions. This
model could generate valuable statistical graphs of crowd dynamics. It gathered the data
such as crowd bottleneck areas, the density of the crowd, and the average speed of the
crowd. The content of the paper provides the scientific and ethical analysis of crowd
evacuations in stadiums.
The research results showed the significant change of evacuation durations when
the number of crowds gets increased. The risk of crowd bottleneck is high in an event
such as homecoming, when 7,500 spectators occupy the stadium. The simulation results
demonstrated that it took nearly 20 minutes to evacuate the whole crowd out of the
building. Using the density histogram, the development of a crowd bottleneck in the area
with congestion could be identified. According to the conversations with the safety
management officials of Hancock Stadium of ISU and the observations of the author, the
access routes and exits of the stadium have enough space to evacuate the crowd from the
building. But some places such as the access stairs to the benchers tend to be easily
59
blocked during the full-scale evacuation. According to the one-tailed T test and Mann-
Whitney U-test, the null hypothesis was rejected because it showed that the simulation
results did not reflect the real evacuations in Hancock Stadium. The reason for the
difference is that the virtual agents are not programmed with enough capabilities to
reflect the moving dynamics. Also the agents have one defined moving speed during
evacuations. It needs to be changed according to the characteristics of the location such
as stairs, walking areas, elevated access routes, etc. Changes were made to simulate the
real walking speed of the stadium. In the revised model, the walking parameters were
defined based on the characteristics of the access routes. For example the upward walking
speed on stair is 0.5ms-1. The upward walking speed of the elevated route is 1.2ms-1.After
the adjustment; the simulation could reflect the real simulations better, which contributes
to the effectiveness of the safety management plan.

60
CHAPTER VII
RECOMMENDATIONS AND FUTURE WORK
One recommendation for the safety management of Hancock Stadium is to have the
real-time video data to evaluate the crowd behaviors and to compare the situations with
the simulations. The simulations would be validated by using the video footages, which
makes the simulation more realistic. Having video footages of the crowd also creates
opportunities to detect the states of audiences’ minds, such as angry, happy, and
excitement, by analyzing the micro expression of the body. There is some software in the
market with the capability of detecting micro expressions. Some software systems can
detect the micro expressions of a human’s face. For example, iMortion® is capable of
gaining the emotional insight from the analysis of a person’s facial expressions. It can
detect the emotions such as joy, anger, feat, and sadness (Inc, 2015). The condition of the
mental status of a human being may affect the time when the person makes a sudden
decision. Another task of future research is to validate the walking speed and the agents
with advanced feature, such as emotional related behavior. In this case, the speed of the
individuals becomes a significant factor of the evacuation. The walking speed of a human
being can be changed by many factors during an evacuation, i.e. characteristics of the
walking path, visibility, crowd flow, etc.

61
REFERENCES
Adeyemi, S., & Salami, A. (2010). A Tool of Optimizing Resources in a Manufacturing Industry. (K.-R. 2010, Ed.) Inventory Management:A Tool of Optimizing Resources in a Manufacturing Industry: A Case Study of Coca-Cola Bottling Company, Ilorin Plant, 135-142.
Ahankoob, A., Khoshnava, S. M., Rostami, R., & Preece, C. (2012). BIM
PERSPECTIVES ON CONSTRUCTION WASTE REDUCTION. Management in Construction Research Association (MiCRA).
Ali, A. N., & Fournier, R. (2012). Signal and image processing for biometrics. London:
Wiley. Almeida, J., Rosseti, R., & Coelho, A. (2013). Crowd Simulation modeling applied to
emergency and evacuation simulations using multi agent system. AXYZ. (2015). Crowd Simulation Software . Retrieved from https://secure.axyz-
design.com/: https://secure.axyz-design.com/anima-crowd-simulation-software-home/buy_anima
Ballan, L., Bertini, M., De Bimbi, A., Seidenari, L., & Serra, G. (2011). Ballan, L.,
Bertini, M., Del Bimbo, A., Seidenari, L., & Serra, G. (2011). Event detection and recognition for semantic annotation of video. Multimedia Tools and Applications.
Banks, J., Hanny, D., Pachano, M., & Thompson, L. (2007). RFID Applied. Hoboken,
New Jersey: John Wiley & Sons, Inc. Bayraktar, A., Yılmaz, E., & Erdem, S. (2011). Using RFID Technology for
Simplification of Retail Processes. Designing and Deploying RFID Applications. Brown, D. (2007). RFID Implementation. New York: McGraw-Hill Companie. C, R., Browning, Baker, E. A., A.Herron, J., & Kram, R. (2006). Effects of obesity and
sex on the energetic cost and preferred speed of walking. Applied Physiology. Castro, L., & Wamba, S. F. (2007). Inside look at RFID Technology. Journal of
Technology Management & Innovation, 128-141.

62
Chapman, T. A. (2006). Smart Start To RFID: Initiating A Smart Label Pilot. 108(1), 16-19.
Chen, Yu Yi; Jan, Jinn Ke; Tsai, Meng Lin; Ku, Chun Ching; Huang, Der Chen;. (Feb
2012). On The Security of RFID-based Monitoring Mechanism for Retail Inventory Management. KSII TRANSACTIONS ON INTERNET AND INFORMATION SYSTEMS VOL. 6, NO. 2.
Chisholm-Burns, M. A., Vaillancourt, A. M., & Shepherd, M. (2014). Phamacy
Management, Leadership, Marketing, and Finance. Burlington, MA: John & Barlett Learning LLC.
Chiu, Y. C., Zheng, H., Villalobos, J., & & Gautam, B. (2007). Modeling no-notice mass
evacuation using a dynamic traffic flow optimization model. IIE Transactions. CNN. (2005). Chicago overwhelmed by nightclub deaths. Retrieved from CNN:
http://www.cnn.com/2003/US/Midwest/02/18/btsc.flock/ Commerce, U. D. (2012, july 25). U.S., Census Bureau Reports. Retrieved from
https://www.census.gov/newsroom/releases/archives/miscellaneous/cb12-134.html
Communication, A. (1995). All about UPC barcode and EAN Barcode. Retrieved 2014,
from Barcode 1. Department of Homeland Security . (2008). Evacuation planning guide. Retrieved from
Homeland Security: http://www.dhs.gov/publication/evacuation-planning-guides Dhanalakshmi, M., & Mamatha, U. (2009). RFID Based Library Management System.
Proceeding of ASCNT, 227-234. Dutta, A., Lee, H., & Whang, S. (2007). RFID and operations management:Technology,
value, and incentives. Production and Operations Management, 16(5) EASTLAND MEMORIAL SOCIETY. (2007). IROQUOIS THEATRE FIRE. Retrieved
from http://www.eastlandmemorial.org: http://www.eastlandmemorial.org/iroquois.shtml
EPCglobal. (2004-2008). EPC Radio-Frequency Identity Protocols class-1 Generation-2.
EPCglobal Inc. Glover, B., & Bhatt, H. (2006). RFID Essentials. Sebastopol, CA: O'Reilly Media, Inc. Graham, D. B., & Johns, &. (2012). The Corporate Emergency Response Plan: A Smart
Strategy. Natural Resources & Environment.

63
GS1. (2012). Case Study: Asset Management in Fresh Food with EPC/RFID. GS1- AISBL.
Hansen, W.-R., & Gillert, F. (2008). RFID for the Optimization of Business Processes.
Retrieved from http://www.eblib.com Heim, G. R., Wentworth, W., & Xiaosong, P. (2009). The Value to the Customer of RFID
in Service Applications, 40(3), 37. Hickman, L. J., Davis, L. M., & Wells, E. (2010). Tracking Inmates and Locating Staff
with Active Radio-Frequency Identification (RFID): Early Lessons Learned in One U.S. Correctional Facility. Santa Monica, CA: RAND Corporation.
Hoogendoorn, S., & Daamen, W. (2003). Controlled experiments to derive walking
behavior. Europian Journal of transport and infrastructure research. Hunt, D. V., Puglia, A., & Puglia, M. (2007). RFID guide to Radio Frequency
Identification. Hoboken New Jersey: John Wiley & Sons. Illinois State University. (2014). Campus Safety and Security. Retrieved from Illinois
State University: http://security.illinoisstate.edu Inc, I. (2015). iMotions. Retrieved from Imotion biometric research platform:
http://imotionsglobal.com/software/add-on-modules/attention-tool-facet-module-facial-action-coding-system-facs/?ibp-adgroup=adwords&ibp-keyword=%2Bfacial%20%2Bdetection%20%2Bsoftware&ibp-matchtype=b&gclid=CjwKEAjwpYeqBRDOwq2DrLCB-UcSJAASIYLjNBsOCtB9W7sG72Zup7ktbJKlvYKIgWAPrPVZwQ7mERoCSxjw_wcB
INCONTROL. (2014). Pedestrian Dyanamic. INCONTROL. (2015). appilication area stadium crowd simulation . Retrieved from
incontrolsim.com: www.incontolsim.com Johnsons, C. W. (2006, april). The application of computational model for simulation of
large scale evacuation. Kar, B., & Zale, J. (n.d.). GIS based football stadium evacuation model. Kaur, M., Sandhu, M., Mohan, N., & Sandhu, P. (2011). RFID Technology Principles,
Advantages, Limitations & Its Applications. International Journal of Computer and Electrical Engineering, 151-157.
64
Kök, G. A., & Shang, K. H. (2007). Inspection and Replenishment Policies for Systems with Inventory Record Inaccuracy. Manufacturing and service operations management, 9(2), 185-205.
Lee, R. S., & Hughes, R. L. (2005). Exploring trampling and crushing in a crowd. Journal of transportation engineering, 131(8), 575-582. Li, T., Chen, S., & Ling, Y. (2010). Identifying the Missing Tags in a Large RFID
System. MobiHoc'10, 1-10. Manjulata, A. K. (2014). Survey on Lightweight Primitives and Protocols for RFID in
Wireless Sensor Networks . International Journal of Communication Networks and Information Security , 29-43.
Manmarus, N., & Zarboutis, N. (2007). Design of formative evacuation plan using agent
based simulation. safety science. Massachusetts Medical Society. (2015). New England journal of medicine. Retrieved
from NEJM knowledge: http://www.nejm.org/doi/full/10.1056/nejmp1305480 Mishra, D., & Mishra, A. (2010). Improving Baggage Tracking, Security and Customer
Services with RFID in the Airline Industry. Acta Polytechnica Hungarica, 139-154.
Najork, E. (2009). Rechtshandbuch Facility Management. Springer. Ngai, E., To, C. K., Moon, K. K., Chan, L., Yeung, P. K., & Lee, M. C. (2009). RFID
systems implementation: a comprehensive framework and a case study. NYDailyNews. (2015). Sport. Retrieved from Dailynews:
http://www.nydailynews.com/sports/soccer/15-killed-soccer-stadium-stampede-article-1.1788886
Omer, A. A. (2007). Mutual Authentication Protocols for RFID systems. OSHA. (2015). Evacuation plans and procedures tools . Retrieved from
www.OSHA.com: https://www.osha.gov/SLTC/etools/evacuation/index.html Overview. (2013). Retrieved 07 2014, from GS1 The Global Language of Business:
http://www.gs1.org Oztekin, A., Mahdavi, F., Erande, K., Swim, L., & Bukkapatnam, S. (2010). Criticality
index analysis based optimal RFID reader placement models for asset tracking. International Journal Of Production Research, 48, 2679-2698.

65
Pesonen, N., Jaakkola, K., & Lamy, J. (2009). Smart RFID Tags. Development and Implementation of RFID Technology, 159-178.
productive partnership. (2014, 07). New Zealand BIM book. Ramsey, L. F., & Cotton, C. (2014, 04 25). Assistant Director of Inventory Management,
Inventory Manager of Inventory Management. (R. Sarathchandra, Interviewer) Rekik, Y. (2010). Inventory Inaccuracies in Supply Chains: How can RFID Improve the
Performance? Wiley Encyclopedia of Operations Research and Management Science.
Rekik, Y., & Sahin, E. (2012). Exploring Invntory Systems Sensitive to Shrinkage-
Analysis of a eriodic review Inventory under a service level constrant. International Journal of prosduction Research, 50(13), 3529-3546.
Schster, E. W. (2005). Auto ID Technology: creating an intelligent Infrastructure for
business report. MIT. Schuster, E. W. (2005). Auto- ID Technology: Creating an Intelligent Infastructure for
Business. Cambridge, MA: Massachusetts Institute of Technology. Shepard, S. (2005). RFID Radio Frequency Identification. United States of America:
McGraw- Hills. Stadiums, W. o. (2015). worldofstadiums. Retrieved from www.worldofstadiums.com:
http://www.worldofstadiums.com/europe/netherlands/philips-stadion/ Statements, D. (2014). Barcodes. Retrieved 2014, from Dynamic Statements Professional
Software Solutions. Sumi, M., Dinesh, R., Nijas, C., Mridula, S., & Mohanan, P. (2014). Frequency Coded
Chipless RFID Tag using Spurline Resonators. Radio Enginnering, 203-208. Sutrop, M., & Laas-Mikko, K. (2012). From Identity Verification to Behavior Prediction:
Ethical Implications of Second Generation Biometrics. Review of policy research, 21-36.
Teicholz, E. (2013). Technology for facility managers. Hobokn, New Jrsey: John Wiley
& Sons. Tissera, P., Printista, M., & Luque, E. (2012, 04). A Hybrid Simulation model to test
behavior desings in an emergency evacuation. Science Direct.

66
University, I. S. (2012). Illinois State University Policy & Procedures. Retrieved from University Property Control: http://policy.illinoisstate.edu/facilities/6-1-38.shtml
Vasishta, S. (2009). Roadmap for RFID Implementation in Central Library, PEC
University of Technology. 300-306. Verdonkschot, S. (2007). Design and Implementation of a trusted RFID reader. 102. VFX. (2015). top 10 simulation software. Retrieved from bestvfxsoftware.com:
http://bestvfxsoftware.com/top-crowd-simulation-software-2014/
Visich, J. K., Powers, J. T., & Roethlein, C. J. (2009). Empirical applications of RFID in the manufacturing environment. Int. Journal Radio Frequency Identification Technology and Applications, 116-132.
Visich, J., Suhong, L., & Khumawala, B. (2007). Enhancing Product Recovery Value in
Closed-loop Supply Chains with RFID. ournal Of Managerial Issues, 436-452. Vries, J. D. (2005). The complexrelationship between inventory control and
organisational setting: Theory and practice. Int. J. Production Economics, 93-94. Wang , B., Li , H., Rezgui, Y., Bradley, A., & Ong, H. (2014). BIM based virtual
environment for fire emergency evacuations. (Hindavi, Producer) Retrieved from Scientific world journal: www.hindavi.com
Wang, J., Lo, S., Wang, Q., Sun, J., & Mu1, a. (2013). Risk of Large-‐Scale Evacuation
Based on the Effectiveness of Rescue Strategies Under Different Crowd Densities. Risk Analysis.
Wang, S., Gabriel, W., Goldstein, R., & Khan, A. (2013). Soulution for scalability in
building information modelig. Autodesk Research. Weinstein, R. (2005). RFID: A Technical Overview and its Application to the Enterprise.
IT Pro, 27-33. Wong, J., S Lo, Q Wang, J Sum, & H Mu. (2013, 8). Risk Analysis . Risk of large scale
evacuation based on the effectiveness of rescure stratergies. Wyatt, J. (2012). TRF7960A RFID Multiplexer Example report. Texas: Texas
Instruments. Xie, R., & Li, L. (2014, june). Simulation of optimized evacuation process in complex
building using cellular automata model. Journal of software .

67
Yeung, C., Kwok, S., & Mui, H. (2011). An Investigation of an RFID-based Patient-tracking and Mobile Alert System. International Journal of Engineering Business Management, 50-56.