modeling, analysis and control of fuel cell hybrid power...
TRANSCRIPT

Department of Mechanical Engineering
The University of Michigan, Ann Arbor, Michigan
Modeling, Analysis and Control
of Fuel Cell Hybrid Power Systems
Kyung Won Suh
1`
CMLoad
H2 Tank
AirCompressor
FF+FB
Load
FB
M
λO2
Ist
Ist
Icm
Wcp
vcm
Inet
Inet
vbus
vst
Inet, vbus
d
DC/DCConverter
Fuel CellSystem

Modeling, Analysis and Control of Fuel Cell Electric Hybrid Power Systems
by
Kyung Won Suh
Chair: Anna G. Stefanopoulou
Transient performance is a key characteristic of fuel cells, that is sometimes more critical than
efficiency, due to the importance of accepting unpredictable electric loads. To fulfill the transient
requirement in vehicle propulsion and portable fuel cell applications, a fuel cell stack is typically
coupled with a battery through a DC/DC converter to form a hybrid power system. Although
many power management strategies already exist, they all rely on low level controllers that realize
the power split. In this dissertation we design controllers that realize various power split strategies
by directly manipulating physical actuators (low level commands). We maintain the causality of
the electric dynamics (voltage and current) and investigate how the electric architecture affects the
hybridization level and the power management.
We first establish the performance limitations associated with a stand-alone and power-autonomous
fuel cell system that is not supplemented by an additional energy storage and powers all its auxiliary
components by itself. Specifically, we examine the transient performance in fuel cell power delivery
as it is limited by the air supplied by a compressor driven by the fuel cell itself. The performance
limitations arise from the intrinsic coupling in the fluid and electrical domain between the compres-
sor and the fuel cell stack. Feedforward and feedback control strategies are used to demonstrate
these limitations analytically and with simulations. Experimental tests on a small commercial fuel
cell auxiliary power unit (APU) confirm the dynamics and the identified limitations.
The dynamics associated with the integration of a fuel cell system and a DC/DC converter is then
investigated. Decentralized and fully centralized (using linear quadratic techniques) controllers are
designed to regulate the power system voltage and to prevent fuel cell oxygen starvation. Regulating
these two performance variables is a difficult task and requires a compromise due to the conflicting
objectives. The compromise can be mitigated by augmenting the fuel cell power system with an
energy buffer such as a battery. We consider two different and popular ways of connecting the
battery and the fuel cell to the load and we refer to them as electric architectures. Various controller
gains are used to span the fuel cell operation from load-following to load-leveling, and hence, to
determine adequate fuel cell-battery sizing (hybridization level) and the associated trends in the
system efficiency.
i


Contents
Abstract i
List of Figures v
List of Tables vii
1 Introduction 1
1.1 Background . . . . . . . . . . . . . . . . . . . . . . . . . . . . . . . . . . . . . . . . . 2
1.2 Literature review . . . . . . . . . . . . . . . . . . . . . . . . . . . . . . . . . . . . . . 4
1.3 Thesis overview . . . . . . . . . . . . . . . . . . . . . . . . . . . . . . . . . . . . . . . 6
1.3.1 Control of power-autonomous fuel cell system . . . . . . . . . . . . . . . . . . 6
1.3.2 Fuel cell power management . . . . . . . . . . . . . . . . . . . . . . . . . . . . 7
1.3.3 Electric configuration of FC hybrid power . . . . . . . . . . . . . . . . . . . . 9
1.4 Contributions . . . . . . . . . . . . . . . . . . . . . . . . . . . . . . . . . . . . . . . . 11
2 PEM fuel cell system model 13
2.1 Fuel cell system model . . . . . . . . . . . . . . . . . . . . . . . . . . . . . . . . . . . 14
2.1.1 Dynamic states . . . . . . . . . . . . . . . . . . . . . . . . . . . . . . . . . . . 15
2.1.2 Nonlinear static relations . . . . . . . . . . . . . . . . . . . . . . . . . . . . . 16
2.1.3 Input and output in the fuel cells . . . . . . . . . . . . . . . . . . . . . . . . . 19
2.2 Simulation validation . . . . . . . . . . . . . . . . . . . . . . . . . . . . . . . . . . . . 20
3 Air flow control of power-autonomous FC system 23
3.1 Power-autonomous fuel cell system . . . . . . . . . . . . . . . . . . . . . . . . . . . . 24
3.2 Control problem formulation for FC air supply . . . . . . . . . . . . . . . . . . . . . 26
3.3 Performance measures and constraints . . . . . . . . . . . . . . . . . . . . . . . . . . 29
3.4 Feedforward control design . . . . . . . . . . . . . . . . . . . . . . . . . . . . . . . . 30
3.4.1 Feedforward cancellation controller . . . . . . . . . . . . . . . . . . . . . . . . 31
3.4.2 Dynamic and static feedforward control . . . . . . . . . . . . . . . . . . . . . 31
3.4.3 Static feedforward control with filtered command . . . . . . . . . . . . . . . . 35
3.5 Feedback control design . . . . . . . . . . . . . . . . . . . . . . . . . . . . . . . . . . 37
3.5.1 Cancellation with feedback control . . . . . . . . . . . . . . . . . . . . . . . . 37
3.5.2 Proportional integral feedback controller . . . . . . . . . . . . . . . . . . . . . 38
4 Experimental confirmation 41
4.1 System operation . . . . . . . . . . . . . . . . . . . . . . . . . . . . . . . . . . . . . . 41
4.2 Experimental comparisons . . . . . . . . . . . . . . . . . . . . . . . . . . . . . . . . . 43
4.2.1 Net current input . . . . . . . . . . . . . . . . . . . . . . . . . . . . . . . . . . 43
4.2.2 Stack voltage input . . . . . . . . . . . . . . . . . . . . . . . . . . . . . . . . . 44
iii

5 DC/DC converters for fuel cell system 475.1 DC/DC converter . . . . . . . . . . . . . . . . . . . . . . . . . . . . . . . . . . . . . . 48
5.1.1 DC/DC converter model . . . . . . . . . . . . . . . . . . . . . . . . . . . . . . 485.1.2 DC/DC converter control . . . . . . . . . . . . . . . . . . . . . . . . . . . . . 505.1.3 Bidirectional DC/DC converter model . . . . . . . . . . . . . . . . . . . . . . 525.1.4 Bidirectional DC/DC converter control . . . . . . . . . . . . . . . . . . . . . 54
5.2 Coordination of the DC/DC converter with the fuel cell . . . . . . . . . . . . . . . . 565.2.1 Decentralized control . . . . . . . . . . . . . . . . . . . . . . . . . . . . . . . . 565.2.2 Full state feedback control . . . . . . . . . . . . . . . . . . . . . . . . . . . . . 585.2.3 Observer design . . . . . . . . . . . . . . . . . . . . . . . . . . . . . . . . . . . 61
6 Control of FC hybrid electric vehicle 656.1 Fuel cell hybrid vehicle models . . . . . . . . . . . . . . . . . . . . . . . . . . . . . . 66
6.1.1 Motor, motor control unit and vehicle model . . . . . . . . . . . . . . . . . . 676.1.2 Battery model . . . . . . . . . . . . . . . . . . . . . . . . . . . . . . . . . . . 68
6.2 Control of FC hybrid power - part (a) . . . . . . . . . . . . . . . . . . . . . . . . . . 696.2.1 Hybrid power management . . . . . . . . . . . . . . . . . . . . . . . . . . . . 706.2.2 Effects of control strategy on fuel efficiency and hybridization level . . . . . . 716.2.3 Centralized control . . . . . . . . . . . . . . . . . . . . . . . . . . . . . . . . . 78
6.3 Control of FC hybrid power - part (b) . . . . . . . . . . . . . . . . . . . . . . . . . . 806.3.1 Hybrid power management . . . . . . . . . . . . . . . . . . . . . . . . . . . . 816.3.2 Battery sizing . . . . . . . . . . . . . . . . . . . . . . . . . . . . . . . . . . . . 82
7 Conclusions 877.1 Air flow control in power-autonomous FCS . . . . . . . . . . . . . . . . . . . . . . . 887.2 Control design of FC hybrid power system . . . . . . . . . . . . . . . . . . . . . . . . 887.3 Future Study . . . . . . . . . . . . . . . . . . . . . . . . . . . . . . . . . . . . . . . . 89
List of Symbols 91
Bibliography 95
iv

List of Figures
1.1 Configuration of a typical fuel cell hybrid power system . . . . . . . . . . . . . . . . 21.2 Electric configurations for fuel cell hybrid power system . . . . . . . . . . . . . . . . 10
2.1 Stack polarization . . . . . . . . . . . . . . . . . . . . . . . . . . . . . . . . . . . . . 142.2 Fuel cell reactant supply system . . . . . . . . . . . . . . . . . . . . . . . . . . . . . . 152.3 Simulation validation of fuel cell reactants supply models . . . . . . . . . . . . . . . 21
3.1 Power-autonomous FC stack system . . . . . . . . . . . . . . . . . . . . . . . . . . . 243.2 Interaction between the air compressor and the FC variable in a power-autonomous
FC stack system . . . . . . . . . . . . . . . . . . . . . . . . . . . . . . . . . . . . . . 253.3 Compressor load in the FC system - steady state . . . . . . . . . . . . . . . . . . . . 253.4 General control formulation . . . . . . . . . . . . . . . . . . . . . . . . . . . . . . . . 263.5 Plant transfer function from Inet to λ
O2(Gzw) and from vcm to λ
O2(Gzu) . . . . . . 27
3.6 Plant transfer function from Inet and vcm to air flow error W refcp − Wcp which are
denoted as Gyw and Gyu, respectively . . . . . . . . . . . . . . . . . . . . . . . . . . 283.7 Control configuration with feedforward/feedback control . . . . . . . . . . . . . . . . 303.8 Feedforward control configuration when the disturbance is measured directly . . . . 313.9 Frequency responses of the feedforward controllers, Kreal
uw , Kidealuw and Kstatic
uw . . . . 323.10 Disturbance rejection performance with Kreal
uw and Kstaticuw feedforward controller . . 33
3.11 Disturbance rejection performance of Ist-based control . . . . . . . . . . . . . . . . . 353.12 Disturbance rejection with a filtered feedforward controller . . . . . . . . . . . . . . 353.13 Disturbance rejection performance of static feedforward with filtered command . . . 363.14 Oxygen excess ratio excursion versus recovery time comparison . . . . . . . . . . . . 363.15 Control configuration with feedback control . . . . . . . . . . . . . . . . . . . . . . . 383.16 Disturbance rejection performance of feedback control with KP and KI variation . . 393.17 Magnitude of sensitivity function of the system with feedback and feedforward control 403.18 Schematic of the fuel cell stack system with air flow control using compressor . . . . 40
4.1 Experimental setup . . . . . . . . . . . . . . . . . . . . . . . . . . . . . . . . . . . . . 424.2 Steady-state performance of the Nexa FC system . . . . . . . . . . . . . . . . . . . 434.3 Experimental comparion - net current step . . . . . . . . . . . . . . . . . . . . . . . . 444.4 Experimental comparison - voltage step . . . . . . . . . . . . . . . . . . . . . . . . . 45
5.1 DC/DC boost converter . . . . . . . . . . . . . . . . . . . . . . . . . . . . . . . . . . 485.2 Bidirectional DC/DC converter [65] . . . . . . . . . . . . . . . . . . . . . . . . . . . 495.3 Open-loop dynamics of Gd for different load levels . . . . . . . . . . . . . . . . . . . 505.4 DC/DC boost converter control . . . . . . . . . . . . . . . . . . . . . . . . . . . . . . 515.5 Simulation results of the DC/DC converter . . . . . . . . . . . . . . . . . . . . . . . 535.6 Bidirectional DC/DC converter model . . . . . . . . . . . . . . . . . . . . . . . . . . 535.7 Open-loop simulation of the bidirectional DC/DC converter . . . . . . . . . . . . . . 555.8 Bidirectional DC/DC converter control . . . . . . . . . . . . . . . . . . . . . . . . . . 56
v

5.9 Control schemes for fuel cell power system . . . . . . . . . . . . . . . . . . . . . . . . 575.10 Simulation results of the nonlinear fuel cell power system model - decentralized control 595.11 Simulation results of the linear fuel cell power system model - centralized control . . 625.12 Observer state error . . . . . . . . . . . . . . . . . . . . . . . . . . . . . . . . . . . . 635.13 Simulation results of the nonlinear fuel cell system model - observer based control . 64
6.1 FC HEV powertrain causality flowchart (a) . . . . . . . . . . . . . . . . . . . . . . . 666.2 FC HEV powertrain causality flowchart (b) . . . . . . . . . . . . . . . . . . . . . . . 676.3 Battery model . . . . . . . . . . . . . . . . . . . . . . . . . . . . . . . . . . . . . . . 696.4 Vehicle speed on the FTP cycle . . . . . . . . . . . . . . . . . . . . . . . . . . . . . . 716.5 Power split in the FTP driving cycle with respect to control calibration . . . . . . . 726.6 System efficiency (-x-), FC response (· · ·) and distribution (bar) for the FTP cycle . 736.7 Vehicle speed on a portion of the US06 cycle . . . . . . . . . . . . . . . . . . . . . . 736.8 Power split in a portion of US06 driving cycle with respect to control calibration . . 746.9 Fuel cell and battery operating characteristics of hybrid vehicles for a portion of the
US06 cycle - load-leveling FC . . . . . . . . . . . . . . . . . . . . . . . . . . . . . . . 756.10 Fuel cell and battery operating characteristics of hybrid vehicles for a portion of the
US06 cycle - load-following FC . . . . . . . . . . . . . . . . . . . . . . . . . . . . . . 766.11 Battery usage and fuel economy with respect to controller calibration and the cycle . 776.12 Battery usage and oxygen excess ratio with respect to controller calibration and the
cycle . . . . . . . . . . . . . . . . . . . . . . . . . . . . . . . . . . . . . . . . . . . . . 776.13 Compressor transient response(blue line) on static compressor map(x) with load-
following FC power . . . . . . . . . . . . . . . . . . . . . . . . . . . . . . . . . . . . . 786.14 Centralized control architecture in fuel cell hybrid power . . . . . . . . . . . . . . . . 796.15 Fuel cell and battery operating characteristics of hybrid vehicles for a portion of the
US06 cycle - centralized control . . . . . . . . . . . . . . . . . . . . . . . . . . . . . . 816.16 Power split in a portion of US06 driving cycle . . . . . . . . . . . . . . . . . . . . . . 836.17 Fuel cell and battery operating characteristics of hybrid vehicles for a portion of US06
cycle . . . . . . . . . . . . . . . . . . . . . . . . . . . . . . . . . . . . . . . . . . . . . 846.18 System efficiency (-x-), FC response (· · ·) and distribution(bar) for a portion of US06
cycle . . . . . . . . . . . . . . . . . . . . . . . . . . . . . . . . . . . . . . . . . . . . . 84
vi

List of Tables
2.1 Fuel cell stack system parameters . . . . . . . . . . . . . . . . . . . . . . . . . . . . . 20
3.1 Performance measures ‖ 1sRzw‖2
2 and JλO2
during step disturbance . . . . . . . . . . 37
6.1 Traction motor parameters . . . . . . . . . . . . . . . . . . . . . . . . . . . . . . . . 686.2 Baseline vehicle characteristics . . . . . . . . . . . . . . . . . . . . . . . . . . . . . . 686.3 Battery parameters . . . . . . . . . . . . . . . . . . . . . . . . . . . . . . . . . . . . . 686.4 Battery usage comparion . . . . . . . . . . . . . . . . . . . . . . . . . . . . . . . . . . 83
vii


Chapter 1
Introduction
Hydrogen is considered as one of the best alternative fuels for augmenting fossil fuels due to high
net energy density1 and its potential for zero local pollution. Proton exchange membrane (PEM),
also known as polymer electrolyte membrane fuel cells (FCs) use hydrogen and are considered for
vehicular power and portable applications because of high efficiency, low operating temperature, and
simplicity in construction. The PEM fuel cells employ hydrogen and oxygen from the air to produce
electricity, water and heat. In PEM FC, hydrogen and air are supplied to the inlet manifolds and
flow fields, and then diffuse through porous media to the polymer membrane. The membrane in
the middle of the cell contains catalyst layers, one in anode and the other in cathode. The catalyst
layer at the anode separates hydrogen molecules into protons and electrons. The membrane permits
transfer of protons, enabling the electrons to flow through an external circuit before recombining with
protons and oxygen at the cathode to form water. This migration of electrons produces electricity.
The anode and cathode reactions in PEM fuel cells are shown below
Anode reaction H2 −→ 2H+ + 2e−
Cathode reaction1
2O2 + 2H+ + 2e− −→ H2O.
The electrical characteristics of fuel cells are normally given in the form of a polarization curve
which is a relation of cell voltage versus cell current density (current per unit cell active area). The
cell voltage varies from the ideal voltage of about 1.2 V to usually below 1 V. Stack temperature and
membrane water content affect the fuel cell voltage, as do reactant pressures and flows. The voltage
decreases as more current is drawn from the fuel cell, due to fuel cell electrical resistance, inefficient
reactant gas transport, and low reaction rate. Lower voltage indicates lower efficiency of the fuel
cell. The loss in the cell turns into heat which can damage the polymer membrane. Many cells are
typically combined in a stack to satisfy the power requirements of the targetted application.
Various power applications impose stringent requirements on the transient performance of PEM
1Net energy density (including average engin/motor efficiency) for diesel is 3.2 kWh/kg, for gasoline 2.8 kWh/kgand hydrogen 2.0 kWh/kg [30].
1
2 Introduction
LOADFUEL CELLDC/DC
CONVERTER
DC BusH2 Supply
Air Supply
Battery
BALANCE OFPLANT
Coolant / Humidity
FUEL CELL
CONTROLLER
DC/DC
CONTROLLER
DutyCycle
PARASITICLOADS
Fuel Cell System
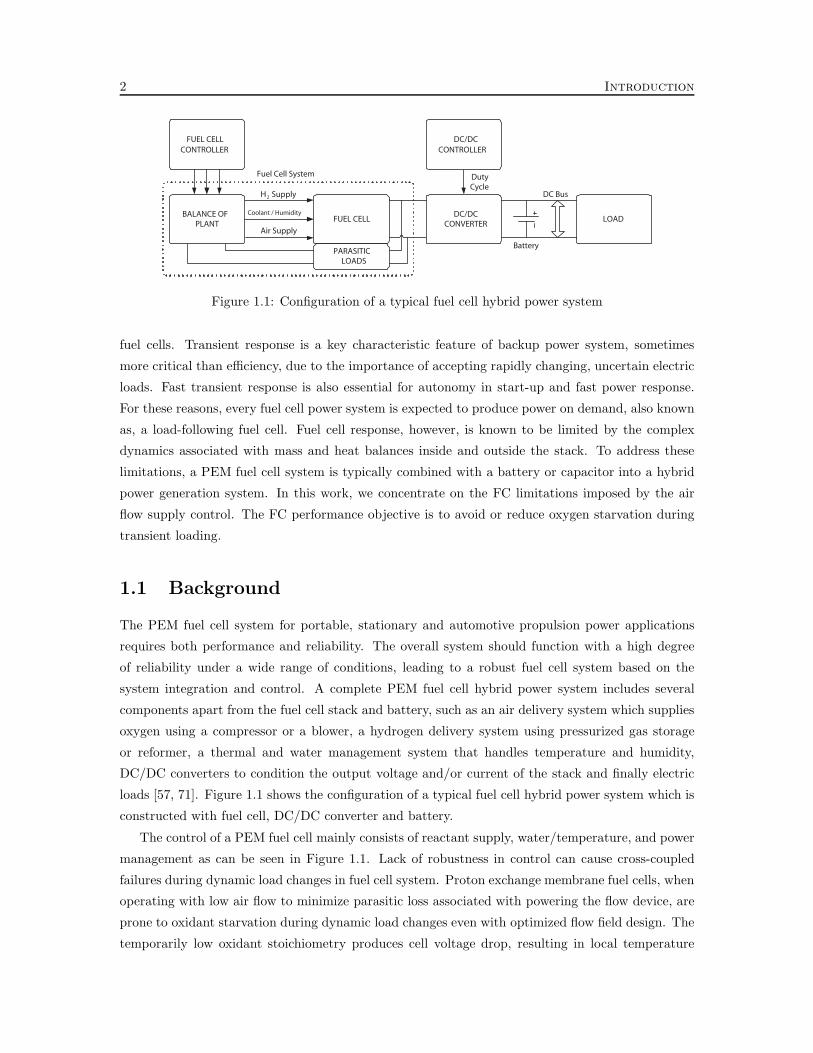
Figure 1.1: Configuration of a typical fuel cell hybrid power system
fuel cells. Transient response is a key characteristic feature of backup power system, sometimes
more critical than efficiency, due to the importance of accepting rapidly changing, uncertain electric
loads. Fast transient response is also essential for autonomy in start-up and fast power response.
For these reasons, every fuel cell power system is expected to produce power on demand, also known
as, a load-following fuel cell. Fuel cell response, however, is known to be limited by the complex
dynamics associated with mass and heat balances inside and outside the stack. To address these
limitations, a PEM fuel cell system is typically combined with a battery or capacitor into a hybrid
power generation system. In this work, we concentrate on the FC limitations imposed by the air
flow supply control. The FC performance objective is to avoid or reduce oxygen starvation during
transient loading.
1.1 Background
The PEM fuel cell system for portable, stationary and automotive propulsion power applications
requires both performance and reliability. The overall system should function with a high degree
of reliability under a wide range of conditions, leading to a robust fuel cell system based on the
system integration and control. A complete PEM fuel cell hybrid power system includes several
components apart from the fuel cell stack and battery, such as an air delivery system which supplies
oxygen using a compressor or a blower, a hydrogen delivery system using pressurized gas storage
or reformer, a thermal and water management system that handles temperature and humidity,
DC/DC converters to condition the output voltage and/or current of the stack and finally electric
loads [57, 71]. Figure 1.1 shows the configuration of a typical fuel cell hybrid power system which is
constructed with fuel cell, DC/DC converter and battery.
The control of a PEM fuel cell mainly consists of reactant supply, water/temperature, and power
management as can be seen in Figure 1.1. Lack of robustness in control can cause cross-coupled
failures during dynamic load changes in fuel cell system. Proton exchange membrane fuel cells, when
operating with low air flow to minimize parasitic loss associated with powering the flow device, are
prone to oxidant starvation during dynamic load changes even with optimized flow field design. The
temporarily low oxidant stoichiometry produces cell voltage drop, resulting in local temperature

1.1 Background 3
increase. Insufficient gas flow associated with dynamic load may cause accumulation of excess water,
possibly blocking reactant diffusion. Anomalous operating conditions can cause not only reversible
performance decrease but irreversible degradation [40, 61].
Hybridization in various electric power configurations with the fuel cell stack, DC/DC converter
and battery offers flexibility in managing the power demand from the fuel cell, and thus protects the
FC from transient loading [57]. For instance, a load-following fuel cell supplies the majority of power
to the load with a small energy buffer responsible for parasitic losses or start-up procedures [21]. In
a load-leveling fuel cell hybrid system, the battery complements the fuel cell power during transient
loading. Hybridization in the fuel cell power system may protect the fuel cell from harmful transition
and in addition may achieve higher fuel cell efficiency by leveling peak power demand from the FC.
The DC/DC converter is a key component for the hybridization. It is a power electric device
that transforms unregulated DC power to regulated DC bus power in the hybrid configuration. The
DC/DC converter is mostly dedicated to regulate the output voltage, masking the voltage variation
of the fuel cell stack. The wide FC voltage imposes difficulties in efficiency and reliability. Typically
less knowledge of the fuel cell dynamics forces the use of secondary energy storage such as battery
or ultracapacitor for transient response [50]. Then DC/DC converter can be a current limiter or a
filter for fuel cells to avoid transients that can lead to FC failure or degradation. In this case, the
difference between load power demand and fuel cell power is covered by the other energy sources.
Although splitting the power is an obvious way of explaining the operation of a hybrid system,
dynamic interaction arises among fuel cells, power electronics devices and battery. Specifically, the
coupled dynamics of current and voltage in the fuel cell and the DC/DC converter affect the system
performance.
The stationary fuel cell power that is tied to an external grid can provide a certain amount of
constant power, while other power sources on the grid will supply additional power that meets a
transient response. This approach leads to the idea of load-leveling with a constant load to the fuel
cell [5]. This is possible to the power conversion units. Namely, the DC/DC converter and DC/AC
inverter can operate in nearly constant power, enabling constant load to the fuel cells. Another
example of FC load-leveling is found when fuel cells are used in communication and computer
products. For example, the electric load of radio communication can be characterized as randomly
applied specific pulses with a constant power load [36]. In this configuration, active control of the
fuel cell components is not necessary because battery power covers the most transients. The load
to the stack is mostly constant power and slowly varying battery charging load. The control of
the DC/DC converter is concentrated on the battery charging/discharging [34]. In these cases, the
reactant supply system and other fuel cell conditioning units are optimally designed for the specific
power and dynamic aspects in the balance of plant for the fuel cells can be neglected.
The fuel cells for an auxiliary power unit (APU) or vehicle propulsion require dynamic power over
wide range even though battery or ultracapacitor is combined. The performance analysis of the FC
hybrid system is mostly based on specific load profiles. For example, the specific APU load profile
is presented with passively controlled hybrid fuel cell with a battery in [27]. Various electric loads

4 Introduction
for tactical truck, although mostly for randomly processed pulse load, are discussed in [17]. The
vehicle propulsion load is derived from specific driving cycles such as federal urban driving schedule
and US06 [21, 45]. However, these analysis results are mostly based on non-causal modeling, thus
being incapable of predicting dynamic interaction among the hybrid system components.
1.2 Literature review
To fulfill the performance requirement in vehicle propulsion and portable fuel cell applications, a fuel
cell stack is typically coupled with a battery through a DC/DC converter to form a hybrid power
system. Defining the fuel cell performance and identifying the limitation are critical in designing fuel
cell hybrid power applications. Otherwise, unnecessary protection with conservative FC operation
may results in lower overall efficiency. However, FC system identification and performance validation
outside the safe limits might cause stack degradation or failure. Therefore, physics-based model is
necessary in designing a FC hybrid power system.
The fuel cell model developed in the literature can be classified into two main categories, namely,
microscopic and macroscopic model. The microscopic model deals with performance of the local
area in the cell. For example, the FC model predicts spatial distribution of current density [66].
Due to computational load, the microscopic model is not suitable in system integration studies. The
macroscopic model is generally defined by global pressure, temperature and flow conditions. The
electrochemical reactions are considered instantaneous [1]. Recent research also shows a lot of results
in modeling the transient behavior of fuel cells based on reactants supply dynamics [52], temperature
dynamics [3] and humidity [70]. Amphlett et al. [3] showed the temperature dynamics of fuel cells.
Wang et al. [70] also presented that the fuel cell dynamics associated with humidity exhibit a time
constant that is far slower than the ones of reactants supply even though humidity has direct effect
on the membrane conductivity and thus internal resistance. Transient power performance is highly
related with the reactant pressure and flow dynamics [60]. Modeling and control of the air supply
that can respond to transient load is emphasized in [52].
The past models consider exogenous input to interface the FC with the external power demand.
In most fuel cell models, exogenous input is current and the resulting output is either cell or stack
voltage [1, 52, 60]. Rarely voltage is defined as the input load [66]. Independently from the input,
the internal dynamics of the FC follow the same physical principles.
Performance limitations due to the air supply in PEM FC have been reported previously. Reg-
ulating air flow based on the flow rate measurement at the supply manifold inlet introduces a
limitation because the actual air flow at the cathode inlet is not the same as the one at the com-
pressor outlet [48, 52, 60]. This mismatch introduces a significant complexity in tuning the air flow
controller for the actual in-stack performance objective. On the other hand, high compressor control
effort, which draws current directly from the stack, can cause instabilities in the FC power delivery
system [49]. Two performance variables, air flow and cathode pressure, become both critical to
the fuel cell performance and the system efficiency [4, 46]. Note that the hydrogen supply is more

1.2 Literature review 5
important than the air supply when reformer is used due to the slow dynamics of the reformer [55].
The integration and associated dynamics of the fuel cells in the hybrid power system depend
highly on the electric architecture and specific load conditions. Various electric connections between
the fuel cell and battery have been proposed in literature. Parallel connection between the fuel
cell and the battery with the electric load without any DC/DC converter is originally proposed
for submarine applications [2]. Although parallel connection does not provide active control in
power management, this design provides a first-order RC (resistor-capacitor) filter to the fuel cell
stack [50]. This way, the battery can cover the transient power demand. However, this passive
connection limits the fuel cell stack and battery size and imposes constraints in their operation, and
hence, performance [27].
The DC/DC converter isolates the voltage range of the fuel cell from the battery, offering more
flexibility and the potential for optimized performance. Hence a DC/DC converter is almost always
considered in FC hybrid system studies. A large number of studies on the DC/DC converters for
fuel cells is focused on soft voltage sources, which accounts for the cell voltage variation due to the
electrochemical characteristic at different operation conditions [67]. There is another functionality,
however, that a DC/DC converter has to perform. The DC/DC converter in FC hybrid system
handles power split and active fuel cell management. The operation principles of power split in FC
hybrid vehicle power are well summarized in [57]. In the same paper, several electric architectures
are presented with signal flows associated to interacting current and voltage, pointing to the lack of
appropriate dynamic model for analysis and control design.
Since the control bandwidth of the DC/DC converter is faster than any other dynamics in the FC,
battery and electric load, the DC/DC converter is sometimes modeled as static conversion of power.
Based on quasi-steady state assumption, noncausal optimization methods have been used to evaluate
the supervisory control in energy storage and regenerative braking strategies [13, 39, 58, 59, 64].
Most hybrid strategies associated with fuel cell applications mainly focus on protection of the
FC stack. Therefore the control command to the DC/DC converter is determined by the fuel cell
system. To prevent abrupt changes in current load to the fuel cell, first-order current load filter is
proposed in [29]. Load governors [63, 68] and model predictive control [69] have been also proposed
for current control. The control objective of the DC/DC converter varies with the specification of
the electric loads. The duty cycle control of the DC/DC converter is proposed for the purpose of
maintaining battery stage of charge [34]. Two different DC/DC converters are proposed with its own
control objective, namely, fuel cell objective and power bus objective [44]. Specifically, conventional
DC/DC converter manages the current drawn from the fuel cell based on a supervisory control
command, whereas a bidirectional DC/DC converter draws power from the battery to maintain the
DC bus voltage. The small volume and weight of a bidirectional DC/DC converter make it lucrative
for FC hybrid vehicle [18]. The bidirectional DC/DC converter controls fuel cell voltage instead of
current load [37].
In most of FC hybrid power studies, the fuel cell stack is modeled with a static polarization
relationship assuming fixed fuel cell operating parameters and avoiding the dynamical variations.

6 Introduction
Thus, the major objective of protecting the fuel cell from harmful transition cannot be evaluated.
1.3 Thesis overview
This dissertation focuses on the fuel cell hybrid power system which is composed of active control in
oxidant air supply, DC/DC converter and battery. Control challenges arise with a highly dynamic
electric load applied to the fuel cell hybrid power system. To define achievable performance and
limitations of the FC system, modeling and analysis of the electric architectures for FC hybrid power
system combining fuel cell system, DC/DC converter and battery are presented.
Control of energy conversion from the chemical energy of hydrogen to the electric energy results
electron flows from the fuel cell stack to the load. On the electric load side, the flow of electrons is
considered as the current, producing electric power. On the other hand, flow of electrons in the fuel
cell is equivalent to the reaction of hydrogen and oxygen molecules that is supported by the reactant
supply system. Thus current and reactant flow are considered in the same domain, and the current
drawn to the load and the reactants supplied to fuel cell need to be precisely controlled.
The electrically connected FC and compressor allow us to design a realistic air delivery con-
troller for regulating the oxygen excess ratio and to capture the FC performance limitation during
abrupt changes in the current drawn (load) from the fuel cell. The electric load in FC system is
controlled by DC/DC converter following certain objectives, for instance, regulating bus voltage or
charging/discharging battery. The interaction and tradeoff between generating the electric power
on demand and protecting the stack in dynamic load are examined. Model-based control design
is performed to regulate both the air supply into the FC and the voltage/current of the DC/DC
converter and the battery.
1.3.1 Control of power-autonomous fuel cell system
In PEM fuel cell application, dynamic performance in the range of 0.1-1 second mainly depends on
the air supply sub-system [12]. In the case of pressurized pure hydrogen supply, oxygen kinetics and
mass transport become the limiting dynamic factor. Excluding start-up and shut down periods, the
transient response associated with controlling air and avoiding oxygen starvation is an improtant
factor in PEM fuel cell system.
In Chapter 2, a low-order fuel cell system model with reactants supply dynamics is presented,
following and extending the work in [52]. Fuel cell stack and reactant flow model is based on elec-
trochemistry, mass balances for lumped volumes in the stack and auxiliary, and rotational dynamics
of compressor and motor. It is assumed that the fuel cell stack is conditioned to be in desirable
operating range of temperature and humidity using thermal and water management system. The
temperature and humidity dynamics are in general slower than the pressure, flow, voltage and current
dynamics observed during power transient [6]. The effect of transient dynamic response of electro-
chemical double-layer discharging in the stack is sufficiently short to be safely ignored [42]. The
simulation comparisons in Section 2.2 confirms the developed low-order model accurately predicts

1.3 Thesis overview 7
the air dynamics in the fuel cell stack system including the flow coupling among the air compressor,
manifolds, volumes and nozzles.
The importance of the air delivery system in PEM fuel cell is recognized with several limitations
on air supply control repeatedly reported in [48, 49, 52, 60]. The significance of the air management
arises due to its considerable parasitic losses [12]. The compressor power affects the net power of
the fuel cell significantly. For example, the air supply compressor load consumes up to 14% of stack
power [11].
In Chapter 3, we introduce another important aspect of air flow control, namely, the electric
coupling between the air supply compressor and the fuel cell when the compressor motor is driven
by the stack power and connected directly on the fuel cell stack voltage bus. A compressor driven
directly by the fuel cell bus voltage (before the DC/DC converter in Figure 1.1) introduces another
limitation to the fuel cell operation. The effect of the compressor power is simple subtracted by the
fuel cell power in order to calculate the net power in [53]. In Section 3.1, we connect the compressor
motor directly to the stack so that compressor driving current is a portion of the stack current.
Thus the stack performance is affected by the air supply control through the current drawn by the
compressor. In Section 3.3, it is shown that the oxidant air supply, consists of air compressor/motor
and flow manifold, in FC system has inherent limitations on the control of air flow to the stack
with respect to dynamic current load due to the non-minimum phase zeros. The analysis results
show us fundamental design limitations on both feedforward and feedback controller in Section 3.4
and 3.5. The electric coupling and the effects on fuel cell system performance due to parasitic losses
are qualitatively confirmed with an experimental setup of a commercial fuel cell stack system in
Chapter 4.
1.3.2 Fuel cell power management
Although hybridization of a fuel cell system mainly focuses on protection of the FC stack, the study
of FC system efficiency is also raised [33]. The anticipated benefits of hybridization for fuel cell
vehicle differ from those for internal combustion engine (ICE) vehicle. Hybridization in ICE vehicle
enables the decoupling of the instantaneous torque and speed demands from the wheels, and in this
way, it enforces the optimum engine operation. The fuel cell hybrid electric vehicle, on the other
hand, has high efficiency at wide range of power levels so it is not clear if hybridization increases
efficiency in any significant manner to justify the increase in weight and complexity associated with
the addition of the batteries.
The efficiency of fuel cells is generally calculated by the produced electric energy as the output
and heating value of hydrogen as the input [42]. The cell voltage also can be used as indication of
the fuel cell efficiency. However, battery efficiency cannot be calculated directly because the losses
in battery during charging-discharging are varying with current. Total vehicle level efficiency can
be compared through the consumed hydrogen fuel during specific driving cycles [59].
On the other hand, efficiency of fuel cells and battery can be interpreted with internal resistance
which can be assumed to be static or dynamic impedance following the paradigm of electric circuits.

8 Introduction
The overall efficiency of a hybrid fuel cell power system without regenerative braking is expected to
be improved by adding battery when the demanded current is drawn from the power source which
has smaller internal resistance. Otherwise the overall efficiency of the system becomes lower even
when the fuel cell is at its optimal operating condition. For example, the fuel cell impedance in
an automotive size stack varies from 0.05 to 0.3 Ω [54] in certain operating point and the internal
resistance of high voltage battery pack for fuel cell hybrid vehicle is about 0.3 to 0.4 Ω [35, 51]. In
this case, using the energy in battery that is charged from the fuel cells is obviously inefficient. Note
here that the loss due to the current drawn from a battery should be calculated twice because there
is charging and discharging losses to maintain the battery state of charge. Of course this comparison
is not valid for transient operation, but it raises several questions about the overall efficiency of
hybridization in PEM fuel cells.
The regenerative braking helps capture and reuse the energy improving fuel economy. Indeed a
battery-hybrid fuel cell vehicle equipped with regenerative braking improves efficiency up to 15% [13].
The efficiency gain in a fuel cell hybrid vehicle depends on the hybridization level or the degree of
hybridization [33]. The hybrid system efficiency can be worse than the stand-alone fuel cell in some
driving cycles [21, 58, 64]. Also, efficiency of a hybridized auxiliary power unit (APU) or distributed
power generation, which has no energy recovery apparatus like regenerative braking, is not yet
addressed.
These unexplored issues highlight the importance of defining the achievable performance and
limitation of a fuel cell power system before hybridization. Hybridization in fuel cell power system
is achieved through filtering the current from the fuel cells to avoid imposing transients that can
lead to FC failure or degrade its life. This conservative approach may lead to unnecessarily lower
overall efficiency. Therefore our goal in Chapter 5 is to first examine the capability and limitation
of fuel cell power system first before adding secondary power source such as battery or capacitor.
In Section 5.1, the dynamic behavior of voltages and currents between the input source and the
output load of the DC/DC converter is explained by a simple transient model. The actual converter
operates by switching pulse devices, but it is approximated here by an average model that captures
transient dynamics within the bandwidth of the switching frequency.
In the controller design stage presented in Section 5.2, the DC/DC converter controller is treated
separately from the fuel cell controller and is responsible for meeting the fuel cell requirement
during power transient. In other words, the boost converter controller is first designed for the best
performance, and then in Section 5.2.1 each controller is re-tuned sequentially in favor of the other
because there is a direct conflict between the performance objectives of the fuel cell and the converter.
Specifically, limiting the current drawn from the fuel cell with DC/DC converter enhances fuel cell
performance but degrades the voltage regulation performance in DC/DC converter. In Section 5.2.2
we introduce coordination in a combined system controller with optimal gains. The coordinated
control accounts for the interactions between the two systems and allows us to construct a controller
for the optimum performance. The result of the dynamic model analysis and control study in this
work provides the insight on the fundamental system controllability and limitations in handling

1.3 Thesis overview 9
transient load in a fuel cell power system.
1.3.3 Electric configuration of FC hybrid power
Managing the power split between the fuel cell and the battery in a hybrid system depends on the
connection of the FC with the battery. We refer to the various configurations of connecting the fuel
cell and the battery as electric architectures. There are several electrical configurations that have
been considered for hybrid (FC and battery/ultracapacitor) systems [57, 67].
Figure 1.2(a) shows a typical load-sharing or load-leveling fuel cell hybrid vehicle configuration
that extends FC power using the high voltage battery. The DC/DC converter boosts the stack
voltage of the FC to the battery voltage, drawing the current from the stack. The battery current
supplements the FC current in order to satisfy the power demand. In automotive propulsion appli-
cation, regenerative braking is used to charge battery. The DC/DC converter control problem gets
simplified when a high voltage battery is connected in parallel between the DC/DC converter and
the load. The battery supports the main electric bus voltage, and the duty cycle of the DC/DC
converter controls the current drawn from the fuel cell.
Direct-hydrogen PEM fuel cell system can be used as load-following power source for various
applications. Load-following FC without high power buffer battery is already applied to the vehicle
propulsion [24]. The purpose of the electric architecture in the hybrid fuel cell power system in
Figure 1.2(b) is to avoid large-size batteries and to meet the electric load mostly with the fuel cell.
In configuration (b), the major power flows from the FC to the load directly without DC/DC con-
verter. A small amount of battery current flows through the bidirectional DC/DC converter during
charging/discharging. This configuration can be more efficient than configuration in Figure 1.2(a)
because it avoids the DC/DC converter losses and weight. However it relies more than configuration
(a) on the ability of the FC to follow the load demands. In any FC electric hybrid configuration,
the coupled dynamics of currents and voltages in fuel cells and DC/DC converter will affect the
overall dynamics and ultimately dictate the final control calibration independently of steady-state
efficiency.
The dynamic coupling between the voltages and currents among the fuel cell, battery and the
traction load is captured in Chapter 6. A converter controller is then designed to boost and regulate
the voltage at the converter output. Good regulation of the voltage at the converter output is
typically achieved by large current drawn from the fuel cell and it is typically followed by small
currents drawn from the battery. The converter controller can be tuned to avoid causing abrupt
current draw from the fuel cell. In Section 6.2, various DC/DC converter controller gains result
in different levels of power split between the fuel cell and the battery, spanning load-following to
load-leveling. It is thus possible to assess the effects of control calibrations on the power split, FC
oxygen excess ratio, compressor behavior, and vehicle efficiency.
In Section 6.3, we introduce coordination between the bidirectional DC/DC converter and the
FC into a combined system in the electric hybrid configuration of Figure 1.2(b). To address the
control of the FC hybrid system, a fuel cell model with voltage input is applied. The bidirectional

10 Introduction
LOADFUEL CELLDC / DC
CONVERTER
DC Bus
Current control
Power demand
CONTROLLER
Reactants flow
control
Hydrogen
Air
AUXILIARYLOADS
Battery
(a) FC+DC/DC converter with a high voltage battery
LOADFUEL CELL
BIDIRECTIONAL
DC / DCCONVERTER
DC Bus
Current control
Battery
CONTROLLER
Power demand
Reactants flowcontrol
AUXILIARY
LOADS
Hydrogen
Air
(b) FC directly connected to the load with bidirectional converter+battery
Figure 1.2: Electric configurations for fuel cell hybrid power system

1.4 Contributions 11
DC/DC converter control with optimal gains emulates the FC load-following power split scenario as
in Section 6.2, but with smaller-size battery. The control design accounts for the limitations in the
fuel cell system and allows us to construct a controller for the smallest possible power assist level
without compromising the fuel cell operation. The results of fuel economy and battery sizing with
the dynamic model and control in this work provide insight on the necessary hybridization of a fuel
cell power system without employing cycle-dependent optimization.
1.4 Contributions
System-level design is not only valuable design tool, but also the key to successful FC applications.
While the PEM FC system has been studied from different disciplinary perspectives as we have
reviewed in literature, the interdisciplinary features of fuel cell systems have remained unexamined.
In this dissertation, fuel cell system is explained on multidisciplinary basis, connecting the weakest
link between the fuel cells’ own dynamics and power electronics with modeling and control design.
The electric architecture and configuration study in this work provides a comprehensive approach
to evaluating the control performances in fuel cell hybrid power.
The major contributions of the dissertation are as follows. A simple but accurate, low-order FC system model has been developed to describe the dy-
namic performances, which is adequate to apply in hybrid power system analysis. Control
design limitations of a power-autonomous fuel cell system in air supply arise when the air
supply compressor is powered directly from the FC. The coupling between the power and flow
paths through a compressor driven fuel cell stack is clarified. It is shown that the inherent
design limitations due to the non-minimum phase zeros dictate the performance of the system.
A control strategy combining feedback and feedforward controller is proposed and used to
demonstrate those limitations in the FC air supply in simulations. The direct conflict between FC oxygen excess ratio and the output voltage of the DC/DC con-
verter is elucidated when the FC is augmented with a DC/DC converter to form a stand-alone
power generation. A model-based controller is designed to achieve the two performance objec-
tives using decentralized control and compared with multivariable control architectures. An
average continuous-in-time modeling approach that approximates the converter switching dy-
namics is applied. It is shown that coordination between the air compressor and the converter
controllers provides a small improvement over a decentralized controller. The control coordination in the fuel cell system and DC/DC converter is expanded to the
applications in FC-battery hybrid system in light of the two configurations in Figure 1.2.
– The control problem is reformulated for FC power system with a battery connected di-
rectly to the high voltage DC bus. It is shown that adding a secondary power source
mitigates the tradeoffs between the FC and the DC/DC converter, while another tradeoff

12 Introduction
between the FC and the battery performance arises. Controller design is performed for
the FC-battery hybrid system to define the hybridization level. It is shown that the model
developed for FC hybrid power application is capable of evaluating the system efficiency
as well as transient performances.
– The controller design of FC hybrid with low voltage battery is performed. The controlla-
bility and performance limitation are revisited for minimum size of battery. It is shown
that a small battery achieves adequate load buffering without compromising the fuel cell
protection and system efficiency.

Chapter 2
PEM fuel cell system model
We first develop a phenomenological model of the PEM fuel cell stack, mainly focusing on air supply
dynamics. The fuel cell stack and reactant flow models are based on electrochemistry, mass balances
for lumped volumes in the stack and peripheral volumes, and rotational dynamics of compressor
and motor. Electrochemical models are basically developed for the relation between equilibrium cell
voltage versus current density of the cell. The empirical equations have been established for cell
voltage of PEM fuel cells from electrochemical theory and experiments [1]. The results presented
the steady-state voltage-current relation for a particular set of operating conditions include reactant
gas concentration, pressures and operating current.
In a dynamic model for fuel cell voltage and current, the reactants supply has an important
role in fuel cell performance because characteristics of PEM fuel cells are dominated by kinetics of
hydrogen and oxygen. To concentrate on air (oxygen) dynamics of the fuel cell system, we assume
that the fuel cell system is fed by pressurized high-purity hydrogen and the hydrogen supply control
is perfect for tracking the anode pressure to the cathode pressure.
We also neglect humidity and temperature dynamics because they are slower than the air flow
dynamics. The temperature and humidity dynamics in fuel cells are slower than the dynamics
observed during fuel cell power changes which are the condition we focused in the study. Temperature
and humidity models are developed with heat and mass balance equations in fuel cells. However, fast
transient in temperature humidity excursion do not occur within the dynamics of transient power [3,
70]. Additional considerations associated with controlling the system humidity and temperature
depending on the operational pressure are still under debate [22]. To concentrate on the dynamics
of the air supply, the humidity and temperature of the fuel cell stack is assumed to be controlled
perfectly by dedicated hardware and controller.
13

14 PEM fuel cell system model
0 50 100 150 200 250 3000
50
100
150
200
250
300
350
Stack current (A)
Sta
ck v
olta
ge (
V)
pca
(a) pca = 1 bar, 2 bar, 3 bar, 4 bar
0 50 100 150 200 250 3000
50
100
150
200
250
300
350
Stack current (A)
Sta
ck v
olta
ge (
V)
Tst
(b) Tst = 20, 40, 60, 80Figure 2.1: Stack polarization
2.1 Fuel cell system model
We consider a fuel cell stack with active cell area of Afc = 280 cm2 and n = 381 number of cells with
75 kW gross power output that is applicable for automotive and residential use. The performance
variables for the FC power system are (i) the stack voltage vst that directly influences the stack
power generated, Pfc = vstIst, when the load current Ist is drawn from the stack, and (ii) the
oxygen excess ratio λO2
in the cathode that indirectly ensures adequate oxygen supply to the stack.
Stack voltage is calculated as the product of the number of cells and cell voltage vst = nvfc. The
combined effect of thermodynamics, kinetics, and ohmic resistance determines the output voltage of
the cell, as defined by
vfc = E − vact − vohm − vconc (2.1)
where E is the open circuit voltage, vact is the activation loss, vohm is the ohmic loss, and vconc
is the concentration loss. The detailed formulation of the FC voltage, also known as, polarization
characteristic can be found in [52].
In steady state, FC voltage is given as static function of current density ifc = Ist/Afc and
several other variables such as oxygen and hydrogen partial pressures pO2
and pH2
, cathode pressure
pca, temperature Tst and humidity λm. Although we assume instantaneous electrochemical reaction
and negligible electrode double layer capacity, the FC voltage has a rich dynamic behavior due
to its dependance on dynamically varying stack variables (pO2
, pca, pH2, Tst, λm). Figure 2.1 shows
examples of the stack polarization with different cathode pressure and stack temperature conditions.
In this thesis, we assume compressed hydrogen supply as shown in Figure 2.2, which simplifies the
control of anode reactant flow. We also assume that the stack temperature and humidity is controlled
accurately and with negligible lag. The cooler and humidifier are neglected for this work because
their power requirement are smaller than the compressor power [8].
In this study, we concentrate on the dynamic behavior of the variables associated with the air

2.1 Fuel cell system model 15
Hydrogen Tank
CompressorMotor
M
Hu
mid
ifier
an
dT
em
pe
ratire C
on
trolle
r
Hydrogen PressureControl
Fuel Cell Stack
Hydrogen
Air & Water
Air
Air FlowControl
Supply Manifold
Air
vcm
patm
patm
Wcp
Wca,inpca
psm Wca,out
vst
Ist
Figure 2.2: Fuel cell reactant supply system
flow control, namely, oxygen pressure pO2
, total cathode pressure pca, and oxygen excess ratio in
the cathode λO2
, which is a lumped parameter that indicates the amount of oxygen supplied versus
oxygen consumed. All variables associated with the air supply and the stack performances are
defined in the following sections. The transient voltage excursions in the stack are minimized with
precise control of reactants. However, the flow dynamics of the oxygen and hydrogen reactants are
governed by pressure dynamics through flow channels, manifolds and orifices. Also, fuel cells are
required to have an excessive amount of oxygen and hydrogen flow into the stack to avoid stagnant
vapor and nitrogen films covering the electrochemical area.
Depending on the load (current) drawn from the fuel cell and the air supply to the fuel cell, the
stack voltage varies between 220 V to 350 V. The air is supplied by a compressor that is driven
by a motor with maximum power of 15 kW. At its maximum rotational speed of 100 kRPM the
compressor provides 95 g/sec of air flow and generates a pressure increase of 3.5 atm. The maximum
compressor air flow is twice the air flow necessary to replenish the oxygen consumed from the stack
when the maximum current is drawn Ist,max = 320 A. The maximum FC current is defined as the
current at which the maximum FC power is achieved. Drawing more current from the fuel cell
results in rapid decrease of the stack voltage, and thus power due to concentration losses [42].
2.1.1 Dynamic states
Details of the model used in this study can be found in [52, 54]. Several simplifications and mod-
ifications have been employed to allow us to concentrate on the fast dynamics associated with the
integration of a fuel cell with a DC/DC converter, by mainly focusing on the air dynamics. Specifi-
cally, the following assumptions are made: (i) All gases obey the ideal gas law; (ii) The temperature
of the air inside the cathode is equal to the bulk stack temperature which is, in turn, equal to the
temperature of the coolant exiting the stack; (iii) The properties of the flow exiting the cathode such
as temperature and pressure are assumed to be the same as those inside the cathode and are the

16 PEM fuel cell system model
ones that dominate the reaction at the catalyst layers in the membrane; (iv) The gases in the anode
and cathode are fully humidified and the water inside the cathode is only in vapor phase assuming
any extra water turns to liquid and is removed from the channels; (v) We neglect flooding of the gas
diffusion layer; (vi) Finally, the flow channel and the gas diffusion layer are lumped into one volume,
i.e., the spatial variations are neglected. Note here that all these assumptions are made to isolate the
potential problems associated with non-hybridized load-following fuel cell that supports its external
and auxiliary loads through its bus. By assuming perfect humidity and temperature regulation, we
do not wish to underestimate their importance nor the challenges associated with the specific control
task. We present the model dynamic states first and then in Section 2.1.2, we describe the nonlinear
relationships that connect the inputs with the states and the outputs (performance variables and
measurements for control).
The mass continuity of the oxygen and nitrogen inside the cathode volume and ideal gas law
yield
dpO2
dt=
RTst
MO2
Vca
(W
O2 ,in − WO2 ,out − W
O2 ,rct
), (2.2)
dpN2
dt=
RTst
MN2
Vca
(W
N2,in − W
N2,out
)(2.3)
where Vca is the lumped volume of cathode, R is the universal gas constant, and MO2
and MN2
are
the molar mass of oxygen and nitrogen, respectively.
The rate of change of air pressure in the supply manifold that connects the compressor with the
fuel cell (shown in Figure 2.2) depends on the compressor flow into the supply manifold Wcp, the
flow out of the supply manifold into the cathode Wca,in and the compressor flow temperature Tcp.
dpsm
dt=
RTcp
Ma,atmVsm
(Wcp − Wca,in) (2.4)
where Vsm is the supply manifold volume and Ma,atm is the molar mass of atmospheric air.
The compressor motor state is associated with the rotational dynamics of the motor through
thermodynamic equations. A lumped rotational inertia is used to describe the compressor with the
compressor rotational speed ωcp
dωcp
dt=
1
Jcp
(τcm − τcp) (2.5)
where τcm is the compressor motor torque and τcp is the load torque of the compressor.
2.1.2 Nonlinear static relations
The nonlinear relations that connect the dynamics states (pressure and rotational speed) through
the right-hand side of equations (2.2) - (2.5) are described in this section.
The inlet mass flow rate of oxygen WO2
,in and nitrogen WN2
,in can be calculated from the inlet

2.1 Fuel cell system model 17
cathode flow Wca,in as follows
WO2 ,in =
xO2
,atm
1 + watm
Wca,in, (2.6)
WN2
,in =1 − x
O2 ,atm
1 + watm
Wca,in (2.7)
where xO2
,atm is the oxygen mass fraction of the inlet air
xO2
,atm =y
O2,atmM
O2
yO2
,atmMO2
+ (1 − yO2
,atm)MN2
(2.8)
with the oxygen molar ratio yO2
,atm = 0.21 and the humidity ratio of inlet air
watm =Mv
yO2
,atmMO2
+ (1 − yO2
,atm)MN2
φatmpsat
patm − φatmpsat
(2.9)
where psat = psat(Tst) is vapor saturation pressure and φatm is the relative humidity at ambient
conditions which is preset to the average value of 0.5.
The supply manifold model describes the mass flow rate from the compressor to the outlet mass
flow. A linear flow-pressure condition is assumed for the flow calculation due to the small pressure
difference between the supply manifold and the cathode
Wca,in = kca,in(psm − pca) (2.10)
where kca,in is the supply manifold orifice flow constant and spatially invariant cathode pressure pca
is the sum of oxygen, nitrogen and vapor partial pressures
pca = pO2
+ pN2
+ psat. (2.11)
The rate of oxygen consumption WO2
,rct in (2.2) from the stack current Ist is given by
WO2
,rct = MO2
nIst
4F(2.12)
where n is the number of cells in the stack and F is the Faraday number.
The outlet mass flow rate of oxygen WO2
,out and nitrogen WN2
,out used in (2.2) and (2.3) are
calculated from the mass fraction of oxygen and nitrogen in the stack after the reaction
WO2 ,out =
MO2
pO2
MO2
pO2
+ MN2
pN2
+ Mvpsat
Wca,out, (2.13)
WN2
,out =M
N2p
N2
MO2
pO2
+ MN2
pN2
+ Mvpsat
Wca,out. (2.14)

18 PEM fuel cell system model
The total flow rate at the cathode exit Wca,out is calculated by the nozzle flow equation [31]
because the pressure difference between the cathode and the ambient pressure is large in pressurized
stacks.
Wca,out =CDAT pca√
RTst
(patm
pca
) 1γ
2γ
γ − 1
[
1 −(
patm
pca
) γ−1γ
] 12
forpatm
pca
>
(2
γ + 1
) γγ−1
(2.15)
and
Wca,out =CDAT pca√
RTst
γ12
(2
γ + 1
) γ+12(γ−1)
forpatm
pca
≤(
2
γ + 1
) γγ−1
(2.16)
where γ is the ratio of the specific heat capacities of the air, CD is the discharge coefficient of the
nozzle, AT is the opening area of the nozzle.
The compressor flow Wcp is modeled by applying the Jensen and Kristensen nonlinear fitting
method [52] as functions of the pressure ratio psm/patm, the upstream temperature Tatm, and the
compressor rotational speed ωcp. The temperature of the air leaving the compressor is modeled
based on [52] with a map of the compressor efficiency ηcp
Tcp = Tatm +Tatm
ηcp
[(psm
patm
) γ−1γ
− 1
]
. (2.17)
The compressor motor torque τcm is calculated assuming a simplified DC motor model with a
static electromechanical relation of applied motor input voltage vcm and back emf
τcm = ηcm
kt
Rcm
(vcm − kvωcp) (2.18)
where kt, kv, and Rcm are motor constants and ηcm is the motor mechanical efficiency. The as-
sumption of a voltage-controlled DC motor instead of frequency/amplitude controlled AC motor
implies instantaneous generation of motor torque (vcm to τcm relationship), neglecting all the high
frequency dynamics associated with more realistic and modern switching drive. Our assumption can
be justified because the switching frequency of the drive and the motor flux dynamics are faster than
the dynamics of the combined motor-compressor inertia in Equation (2.5). Even the implementation
of a filter that minimizes the switching ripples preserves the highly dynamic (almost instantaneous)
relationship between the motor control command (vcm in our case) and the torque generation τcm.
One will need to convert the voltage control command vcm derived to current or frequency/amplitude
control command when specific motor and drive design are specified. The torque consumed by the
compressor is calculated from the thermodynamic equation
τcp =Cp
ωcp
Tatm
ηcp
[(psm
patm
) γ−1γ
− 1
]
Wcp (2.19)
where Cp and correspond to the specific heat capacities of the air.

2.1 Fuel cell system model 19
The compressor motor power Pcm provided by the compressor motor is calculated using the
compressor motor voltage input vcm and its rotational speed ωcp
Pcm =vcm
Rcm
(vcm − kvωcp). (2.20)
This power can be supplied directly from the fuel cell or from an auxiliary power source.
We assume vapor is saturated in the anode without flooding or nitrogen diffusion. We also assume
that the anode pressure is regulated to follow the cathode pressure. Controlled anode pressure can
be achieved either with anode recirculation [38] or dead-ended anode outlet [52]. Based on these
assumptions, the hydrogen pressure that affects the FC voltage is calculated
pan = pca, (2.21)
pH2
= pan − psat. (2.22)
The oxygen excess ratio
λO2
=W
O2,in
WO2
,rct
(2.23)
corresponds to the ratio between the oxygen supplied and the oxygen reacted in the cathode. The
oxygen excess ratio is typically regulated at λrefO2
= 2 to reduce the formation of stagnant vapor and
nitrogen films in the electrochemical area. Values of λO2
lower than 1 indicate oxygen starvation
and has serious consequences in the stack life.
2.1.3 Input and output in the fuel cells
The nonlinear model based on the state equations (2.2)-(2.5) involves the four states
x =[
pO2
pN2
ωcp psm
]T
. (2.24)
Given the four states, we can formulate state equations with the control actuator signal vcm, and a
exogenous input from the electric load outside.
Traditionally, the current have been chosen as an input in the fuel cell model. Thus Equation
(2.1) produces the cell voltage vfc, and the stack voltage vst given the stack current Ist or current
density ifc. The input of the fuel cell model is actually the controlled electric load with external
device and the choice of the electric load is depends on the applications. For example, the voltage
of the cell can be an input of the fuel cells to analyze spatially distributed current density [66]. The
resistance input may be more realistic to define the electric load to the stack [6].
In the causal model described in this chapter, either the stack current or voltage can be chosen
to be the input of the system. When the stack current is used as the input, the stack voltage shows
dynamic behavior with respect to the current density and the pressure conditions. If the stack
voltage is used as the input of the system, the dynamic behavior of the stack current represent the
performance of the fuel cell system. The input current or voltage is implemented as a boundary

20 PEM fuel cell system model
Table 2.1: Fuel cell stack system parametersSymbol Variable Value
n number of cell in fuel cell stack 381Afc fuel cell active area 280 cm2
Jcp compressor and motor inertia 5 × 10⁻⁵ kg·m2
Vca cathode volume 0.01 m3
Vsm supply manifold volume 0.02 m3
CD cathode outlet throttle discharge coefficient 0.0124AT cathode outlet throttle area 0.00175 m2
ksm,out supply manifold outlet orifice constant 0.3629× 10⁻⁵ kg/(s·Pa)
condition, which is shown in dynamic model for battery cell [28]. When the input is the current
from the fuel cell stack, the stack current calculation is straitforward from Equation (2.1) given the
pressure conditions. If the stack voltage is chosen as an input, the stack current is calculated by
solving Equation (2.1) implicitly as is in [66].
The decision of input and output for the fuel cell system model here is dependent to the specific
electric architecture of the fuel cell hybrid. In the case of electric architecture shown in Figure 1.2(a),
the current from the fuel cell stack is determined by the DC/DC converter, thus the current is used
as an input to the fuel cell model. On the other hand, fuel cell is controlled by it own voltage instead
of current in the electric architecture shown in Figure 1.2(b) [32, 58]. The details of integration and
control in electric architecture are presented in Chapter 5 and 6.
2.2 Simulation validation
Model validation is performed through simulation comparisons between the 4 state model developed
in Section 2.1.1 and 2.1.2, and the originally developed 9 states1 model [52, 54]. The parameters
used in the four state model are summarized in Table 2.1. The dynamic response of the performance
variables, which are the stack voltage vst, the stack and net power, Pst and Pnet and oxygen excess
ratio λO2
, are compared.
To demonstrate the FC model characteristics, a series of step changes in stack load (current)
and compressor motor input voltage are applied to the stack in Figure 2.3. During the first four
steps, the compressor voltage is controlled so that the oxygen excess ratio at 2 is maintained using a
simple static feedforward controller. The remaining steps are then applied independently, resulting
in different levels of oxygen excess ratios. Also the same current and actuator inputs are applied to
the nine state model.
During a positive load step, the oxygen excess ratio drops due to the depletion of oxygen, that
correlates well with the drop in the stack voltage. The step at t = 18 seconds shows the response
due to an increase in the compressor input while keeping the stack current constant. The opposite
scenario is shown at t = 22 seconds. The response between the 18th and 22th seconds shows that
1The nine states are x =[
mO2
mH2
mN2
ωcp psm msm mw,an ww,ca prm
]Tin [52]. Note here
that the mass and the pressure of O2 or N2 are equivalent terms based on the assumption of the ideal gas law.

2.2 Simulation validation 21
0 5 10 15 20 25 30
100
200
300
Sta
ck C
urre
nt (
A)
0 5 10 15 20 25 30100
150
200
250
Com
pres
sor
Mot
or In
put (
V)
0 5 10 15 20 25 30200
220
240
260
Sta
ck v
olta
ge (
V)
Time (sec)
4 state9 state
0 5 10 15 20 25 3020
40
60
80
Sta
ck p
ower
(kW
)
0 5 10 15 20 25 3020
40
60
Net
pow
er (
kW)
0 5 10 15 20 25 301
1.5
2
2.5
λ O2
Time (sec)
0 5 10 15 20 25 300.1
0.2
0.3
p O2 (
bar)
0 5 10 15 20 25 30
1
2
3
p N2 (
bar)
0 5 10 15 20 25 30
50
100
cp (
kRP
M)
0 5 10 15 20 25 301
2
3
p sm (
bar)
Time (sec)
4 state9 state
ω
Figure 2.3: Simulation validation of fuel cell reactants supply models

22 PEM fuel cell system model
even though the stack voltage vst and power Pst increase, the net power Pnet = Pst − Pcm actually
decreases due to the increased parasitic loss (Pcm).
The comparison shows that the equations (2.2) - (2.22) capture the dynamics of voltage and
starvation characteristics when humidity and temperature are well controlled. The assumptions
in this work eliminate the states of the model in [52], which are return manifold (prm), hydrogen
and vapor pressures (or mass) (mH2
, mw,an and mw,ca), and supply manifold mass msm, but all
performance variables and remaining states in (2.24) match well with the original nine state model.
Several other control-oriented fuel cell model derivatives of [52] can be found in literature. The
simplest is a two-state model [9, 43], where one dynamic state is cathode pressure used for stack
voltage calculation and the other is for compressor dynamics. This two-state model is adequate
to model stack power and parasitic losses, and thus is used for vehicle power management system.
Drawback of the two state model is, however, that the dynamics inside the fuel cell system, for
example, the oxygen excess ratio, can not be captured. The lack of compressor model in another
simplified model [63] renders it incapable of describing auxiliary power losses. Finally, another four-
state model in [60] has no distinction between oxygen and nitrogen species; thus dynamics of the
oxygen excess ratio can not be captured.
We will next analyze the performance limitation and design the controller based on the model
developed in this chapter. Also experimental confirmation will be performed in Chapter 4.

Chapter 3
Air flow control of
power-autonomous FC system
The purpose of this chapter is to examine the dynamic limitation associated with the air supply to a
high-pressure FC power system which will be augmented with DC/DC converter. To investigate the
coupling between the electric requirements and the FC power constraints, it is desirable to establish
an analytic model for the fuel cell with DC/DC converter and design the overall system. Then
the dynamic behavior for fuel cell power system and associated control issues will be covered in
Chapter 5 and 6.
The transient response associated with controlling air supply and avoiding oxygen starvation is
a key performance factor in PEM fuel cells fed by compressed high-purity hydrogen. The oxygen
is supplied through the air supply system and it is typically forced by a blower or a compressor.
Although the compressor absorbs a significant amount of power and increases the fuel cell parasitic
losses, it is preferred to a blower due to the higher achievable power density (kW/m3). A blower
is typically not capable of pushing high flow rates through the small channels associated with high
power density FC stacks. Analysis of the tradeoff between FC power density and parasitic losses
from the air supply device can be found in [11]. Comparison of the dynamic flow capabilities of
an FC system with a blower and a compressor can be found in [23]. It is shown that the two
systems are dynamically similar in providing air flow through the cathode channels. The blower
spends time spinning its rotor inertia, which is typically larger than the compressor inertia, whereas
the compressor needs time to push the air and elevate the supply manifold pressure. Compressor
produces significantly higher operating pressures than a blower.
The goal of this chapter is to examine the performance limitations and tradeoffs associated
with the compressor-driven air supply in a high-pressure power-autonomous FC system as shown
in Figure 3.1. The importance as well as the limitations of the air supply system in PEM FC is
recognized. Regulating air flow based on the flow rate measurement at the supply manifold inlet
has a potential limitation because the actual air flow at the cathode inlet is not the same as the
23

24 Air flow control of power-autonomous FC system
M
Air
Compressor
FC Stack Ist
vst
vcm
Inet
IcmWcp
Pcm
Figure 3.1: Power-autonomous FC stack system
one at the compressor outlet [48, 52, 60]. On the other hand, high compressor control effort to force
faster air in the stack can cause instabilities when the compressor draws current directly from the
stack [49]. The tradeoff between satisfying net power requirements and maintaining optimum air
supply in the stack during load changes is first defined in [54]. We show here that this difficulty is
more critical when the compressor motor draws its power directly from the fuel cell as in the case
of an autonomous fuel cell. The control limitations achieving fast air flow control in the stack is the
result of two non-minimum zeros in the air supply control system. We clarify and quantify these
limitations and design controllers that illustrate these limitations in simulations.
The performance limitations are analyzed based on a low-order fuel cell model described in
Chapter 2 and Section 3.1. In Section 3.2, the physical problem is formulated into the general
control form. The performance measures and control difficulties are summarized in Section 3.3. In
Section 3.4, we discuss various feedforward control architectures based on load current measurement
and compare them analytically and with simulation. Finally the design of feedback control based
on air flow measurement is presented in Section 3.5.
3.1 Power-autonomous fuel cell system
In the high pressure PEM fuel cell system described in Chapter 2, a compressor supplies the air flow
necessary for the reaction which depends on the current drawn from the fuel cell, Ist as shown in
Figure 3.1. The air supplied to the cathode should exceed the air necessary for reaction for several
reasons [7, 54]. The oxygen excess ratio (OER), defined as λO2
in Equation (2.23) of Chapter 2, is
a convenient lumped variable to define the control objective in FC air supply. Regulation of λO2
to
a higher enough value can provide enough oxygen into the FC stack to prevent oxygen starvation,
but the overall efficiency may decrease due to unnecessary power losses in the air compressor. In
this study, we consider the air flow control problem associated with regulating oxygen excess ratio
at a fixed desired value (λrefO2
= 2), which has been shown to provide adequate supply of oxygen and
optimum power generation in the fuel cell stack in [52].
We focus on the dynamic oxygen excess ratio during transient loading. We consider the regulation
problem where the compressor is driven directly by the fuel cell, as is shown in Figure 3.1. The total

3.1 Power-autonomous fuel cell system 25
Compressor FC Stack
λO2Ist
vst
vcm
Inet
Icm
Wcp
psm
Σ
Figure 3.2: Interaction between the air compressor and the FC variable in a power-autonomous FCstack system
0 50 100 150 200 2500
10
20
30
40
50
60
Net Current (A)
Net
Pow
er (
kW)
0
15
30
45
60
75
90
CM
Cur
rent
(A
)
Net power and compressor load
Pcm
Pnet
Icm
Figure 3.3: Compressor load in the FC system - steady state
current drawn from the fuel cell stack, Ist is defined as the sum of the net current Inet, which is the
current delivered to the load, and the current drawn by all of the FC auxiliaries, particularly the
compressor load, Icm
Ist = Inet + Icm (3.1)
as shown schematically in Figure 3.1 and in a signal flow diagram in Figure 3.2.
Here it is considered that the compressor motor contributes to the largest percent of FC parasitic
losses through the current drawn Icm directly from the stack bus1. Figure 3.3 depicts the compressor
motor power Pcm and net FC power Pnet when the net current load Inet is drawn in steady-state.
To calculate the current consumed by the compressor, we assume that the compressor motor has
an ideal power transformer. The transformer supplies the necessary power Pcm dictated by the DC
motor control signal vcm in (2.20) by drawing a current Icm at the FC stack bus voltage vst
Icm = Pcm/vst. (3.2)
Thus, the compressor motor current is implemented so that Pcm is simply drawn from the stack
through a DC motor control unit instantaneously.
1A 75 kW fuel cell stack is typically supplied by 15 kW compressor power [12, 52].

26 Air flow control of power-autonomous FC system
u
w
y
z
-
-
-
-G
Figure 3.4: General control formulation
The FC air supply interacts with the FC stack through an electrical and an air flow path as
shown in Figure 3.2. The electrical coupling is established by the stack voltage vst through Equation
(3.2). The FC stack voltage vst is given by the polarization curve in [52, 54]. The air flow through
the compressor depends on the FC stack supply manifold pressure psm through Equation (2.5) in
Chapter 2. As can be seen in Figure 3.2, the effect of the compressor voltage command vcm to the
oxygen excess ratio λO2
is also influenced by the interaction between the compressor and FC stack
through the air flow path and the electric path.
3.2 Control problem formulation for FC air supply
The control objective of regulating the oxygen excess ratio λO2
in the fuel cell stack can be achieved
by a feedforward and/or feedback control using a compressor motor voltage command vcm during the
load (current) changes. Since the performance variable λO2
is not directly measured, we regulate
λO2
based on two measurements, namely, the demanded load Inet, and the air flow rate at the
compressor, Wcp.
Linear control techniques are used throughout this paper to analyze the inherent control dif-
ficulties and to design a controller for the system. A nominal operating point of 40 kW FC net
power (67% of the maximum FC net power) is used for the linearization of the nonlinear FC stack
system. Deviations from the nominal net current Ionet = 169 A, compressor motor voltage command
vocm = 164 V and associated nominal oxygen excess ratio λo
O2= 2 are considered to define the control
problem in the general control configuration [ z y ]T = G [ w u ]T with
G =
[
Gzw Gzu
Gyw Gyu
]
(3.3)
as shown in Figure 3.4. Specifically, the control of the FC air supply can be described as a disturbance
rejection problem with performance variable z = δλO2
= λO2
− λoO2
, control input u = δvcm =
vcm − vocm and disturbance input w = δInet = Inet − Io
net.
The plant transfer functions Gzu from u to z, and Gzw from w to z of the power-autonomous
FC are
Gzu =−0.00741(s + 101)(s− 19.2)(s + 3.15)(s + 3.09)
(s + 71.3)(s + 19.6)(s + 3.28)(s + 3.12)(3.4)
Gzw =−0.0103(s + 67.7)(s + 19.4)(s + 3.29)(s + 3.09)
(s + 71.3)(s + 19.6)(s + 3.28)(s + 3.12). (3.5)

3.2 Control problem formulation for FC air supply 27
10−1
100
101
102
103
100
101
Mag
nitu
de
10−1
100
101
102
103
−150
−100
−50
0
Frequency (rad/sec)
Pha
se (
deg)
Gzw
Gzu
Figure 3.5: Plant transfer function from Inet to λO2
(Gzw) and from vcm to λO2
(Gzu)
As can be seen in (3.4) and (3.5) Gzu and Gzw are both stable and have zero relative degree. The
transfer function Gzw indicates a minimum phase system while Gzu has a non-minimum phase
(NMP) zero ζz = 19.2.
Figure 3.5 shows the frequency responses of the normalized plant transfer functions Gzw and Gzu.
As can be seen in the frequency response plot, Gzu has a phase lag associated with non-minimum
phase behavior, whereas Gzw resembles a static gain. The flat frequency response of the Gzw can
be physically explained by the direct effect of the net current Inet on the stack current Ist, which
statically affects the mass flow rate of the oxygen reacted in the cathode WO2 ,rct, which, in turn,
affects the OER defined by Equation (2.23). Note that while Inet affects statically the WO2
,rct which
is the denominator of OER in (2.23), it barely affects the cathode pressure pca (by depleting oxygen)
and thus causes insignificant variation in oxygen flow in the cathode WO2
,in, which is the numerator
of OER in (2.23).
The non-minimum phase zero in Gzu is unavoidable in power-autonomous fuel cell system. The
actuator u affects performance variable λO2
through the flow path and the electric path (see Fig-
ure 3.2), with mutual conflicting results. An increase in the compressor command increases the
air flow to the FC, and consequently increases the oxygen excess ratio λO2
, but an increase in the
compressor command also increases the FC parasitic load Icm, thus decreases the oxygen excess
ratio. The interaction of these two and opposite contributions introduces the non-minimum phase
behavior. Moreover, it is important that the NMP behavior is always present independently of the
type of compressor or blower in air supply, as long as the power for the air supply component is
from the stack itself without an energy buffer such as battery.
Regulating the oxygen excess ratio can be implemented by a feedforward controller since the
disturbance input Inet can be measured directly. The design limitations associated with NMP
dynamics in Gzu and the design of feedforward control are discussed in Section 3.3 and 3.4.
Besides the feedforward control, additional measurement from the plant can be used to improve
the performance and/or the robustness. Specifically, a feedback controller based on the compressor

28 Air flow control of power-autonomous FC system
10−1
100
101
102
103
100
101
Mag
nitu
de
10−1
100
101
102
103
−150
−100
−50
0
Frequency (rad/sec)
Pha
se (
deg)
Gyw
Gyu
Figure 3.6: Plant transfer function from Inet and vcm to air flow error W refcp −Wcp which are denoted
as Gyw and Gyu, respectively
flow measurement Wcp will be considered in Section 3.5 similarly to [49] and [53]. The feedback
control can be applied so that Wcp tracks the reference air flow command W refcp , thus defining the
measurement y
y = W refcp − Wcp (3.6)
for the general control configuration in Figure 3.4. The demanded air flow rate W refcp is based on
the stack load measurement, Ist, and the desired oxygen excess ratio λrefO2
, as defined in [53]
W refcp = W ref
cp (Ist, λrefO2
) (3.7)
so that the oxygen excess ratio can be regulated to the desired value λrefO2
at steady-state when the
compressor air flow Wcp satisfies the reference value W refcp . The plant transfer functions Gyu and
Gyw are
Gyu =0.198(s− 81.9)(s + 68.3)(s + 3.13)(s + 1.07)
(s + 71.3)(s + 19.6)(s + 3.28)(s + 3.12)(3.8)
Gyw =0.274(s + 71.9)(s + 19.2)(s + 3.34)(s + 2.9)
(s + 71.3)(s + 19.6)(s + 3.28)(s + 3.12)(3.9)
for the same operating point defined previously.
Figure 3.6 shows the frequency responses of the normalized plant transfer functions Gyw and
Gyu. As can be seen in the figure, Gyw resembles a static gain similarly to Gzw in Figure 3.5.
This flat frequency response is consistent with the system physics because the net load current Inet
disturbance directly affects W refcp (Ist) through Equation (27) of [53], but it causes minor changes in
the compressor air flow Wcp, in the open-loop plant.
The existence of a non-minimum phase zero in Gyu is unavoidable in a power-autonomous fuel
cell system. The control command u affects the measurement y = W refcp (Ist) − Wcp through the

3.3 Performance measures and constraints 29
flow path and the electric path. Specifically, an increase in the compressor command increases the
air flow at the compressor Wcp, whereas an increase in the compressor command increase the FC
parasitic load Icm and consequently the demanded air flow W refcp (Ist). The NMP zero ζy = 81.9
in the response from u to y imposes feedback bandwidth limitation on the ability to track the air
flow requirement W refcp (Ist). Therefore, high gain control on the compressor command can cause
instabilities when the compressor draws current directly from the stack, which is empirically observed
in [49].
The differences in performance z and measurement y as shown by the frequency responses in
Figure 3.5 and 3.6 introduce more difficulties in the control design. The differences in Gyu and Gzu
characterize the different dynamic behavior of z and y, and thus the design of the feedback controller
using the measurement y needs to take into account the performance variable, i.e., the oxygen excess
ratio λO2
. Prior work in [48, 52, 60] reports in a qualitative manner that regulating the cathode
oxygen flow based on the compressor air flow rate measurement has a potential limitation because
the actual air flow at the cathode of the FC stack is not the same as the one at the compressor,
thus causing significant problems in regulating oxygen excess ratio inside the stack. The detailed
design limitations on feedback control and control design that takes these limitations into account
are covered in Section 3.5.
3.3 Performance measures and constraints
While the controller architecture for FC air supply already has been described in [49, 52] as a com-
bined feedforward and feedback control based on the load current and air flow rate measurement,
this paper examines the fundamental limitations for the first time. Generalized bounds on con-
trol performances are established to clarify and quantify the control difficulties. For performance
evaluation, we consider the disturbance response ratio [19]
Rzw =Tzw
Gzw
(3.10)
which is the ratio of the closed-loop response Tzw to the open-loop response Gzw . The disturbance
response ratio is a measure of the performance of the controller in rejecting the disturbance w = δInet.
Given a feedforward controller Kuw and feedback controller Kuy as in Figure 3.7, the closed-loop
response Tzw is
Tzw = Gzw + GzuKuw + GzuKuy(1 − GyuKuy)−1(Gyw + GyuKuw). (3.11)
We consider the integral constraints upon Rzw for the control system of the plant (3.4)-(3.5)
because there exists a non-minimum phase zero in Gzu. Since the system is open-loop stable, Gzw
is minimum phase, and Gzu has a NMP zero ζz, if Tzw is minimum phase2 then the Poisson integral
2The existence of non-minimum phase zero in Tzw cannot be determined without the controller, so that the

30 Air flow control of power-autonomous FC system
w -
kΣ- - -GzuKuw
Kuy
Gzw
? zu -
GyukΣ -y- -
Gyw-
?-
kΣ-
6
Figure 3.7: Control configuration with feedforward/feedback control
for NMP zeros of Gzu (from Proposition V.7 in [19]) is
∫∞
0
log |Tzw(jω)|W (ζz , ω)dω = 0 (3.12)
and ∫∞
0
log |Rzw(jω)|W (ζz , ω)dω = 0 (3.13)
where
W (ζz , ω) =2ζz
ζ2z + ω2
. (3.14)
Integral constraints upon Rzw due to the NMP zero in Gzu in (3.13) dictate that if |Rzw| < 1 over
any frequency range, then necessarily |Rzw| > 1 at other frequencies since W (ζz, ω) > 0, ∀ω. Design
tradeoffs imposed by Poisson integral in (3.13) are valid with arbitrary measurements, thus they can
be applied with any feedforward and feedback controller.
Also we examine the step response of the disturbance response ratio Rzw with the normalized
integral square output error
‖1
sRzw‖2
2, (3.15)
and compare the closed-loop performance associated with various controllers using the cost function
JλO2
=
∫∞
0
z2dt. (3.16)
3.4 Feedforward control design
Since the disturbance input Inet is measured, we can apply feedforward control. In the case of a
feedforward controller Kuw using the disturbance measurement directly as shown in Figure 3.8, the
response of z to w is
Tzw = Gzw + GzuKuw. (3.17)
Using the performance measures and the insight from the integral constraints in the previous section,
various feedforward controllers are compared and analyzed.
condition of Tzw will be confirmed after the control design.

3.4 Feedforward control design 31
w -
kΣ- - -GzuKuw
Gzw
? zu -
Figure 3.8: Feedforward control configuration when the disturbance is measured directly
3.4.1 Feedforward cancellation controller
A cancellation control that perfectly regulates the performance variable z in the presence of distur-
bance w may be achieved with a dynamic feedforward controller. The ideal dynamic feedforward
controller Kuw = Kidealuw , that yields Tzw = 0, can be derived based on a plant inversion
Kidealuw = −G−1
zu Gzw . (3.18)
The resulting cancellation controller Kidealuw is, however, unstable due to the non-minimum phase zero
ζz of Gzu. Implementation of the controller in (3.18) is not desirable due to the exact cancellation
of NMP zero. As perfect disturbance cancellation using feedforward controller Kidealuw is not a robust
option, it is necessary to evaluate the disturbance rejection performance of various other feedforward
controllers.
3.4.2 Dynamic and static feedforward control
Since the ideal feedforward controller in (3.18) is unstable due to the non-minimum phase zero ζz
in Gzu, a minimum-phase approximation Gzu such that
Gzu = Gzu
ζz − s
ζz + s, (3.19)
can be applied to replace Gzu in (3.18). The transfer function Gzu is minimum phase, but maintains
the magnitude of Gzu. The resulting quasi-cancellation controller Krealuw is
Krealuw = −G−1
zu Gzw. (3.20)
The frequency response of dynamic feedforward controller Krealuw and Kideal
uw can be seen in Figure 3.9.
The magnitudes of two controller transfer functions are identical, though the phase of Krealuw differs
by 180 degrees at high frequency from the phase of Kidealuw .
It is shown in [26] that assuming Gzw is approximated by a static function the feedforward
controller, Krealuw realizes the minimum achievable normalized integral square output error (using
Theorem 2 in [56]) due to a unit step disturbance
min ‖1
sRzw‖2
2 =2
ζz
= 0.1044. (3.21)

32 Air flow control of power-autonomous FC system
10−1
100
101
102
103
100
100.1
Mag
nitu
de
10−1
100
101
102
103
0
50
100
150
Pha
se (
deg)
Frequency (rad/sec)
Kuwreal
Kuwideal
Kuwstatic
Figure 3.9: Frequency responses of the feedforward controllers, Krealuw , Kideal
uw and Kstaticuw
In our case, the load disturbance directly affects the oxygen excess ratio, thus Gzw can be approxi-
mated as a static gain indicated by the near pole-zero cancellation in (3.5) (see Figure 3.5). Therefore
it is expected that the Krealuw can achieve very good disturbance rejection as indicated by the small
values for the measures ‖ 1sRzw‖2
2 and JλO2
in Table 3.1.
We also compare the performance of dynamic feedforward control with a static feedforward
controller. The static feedforward controller
Kstaticuw = −Gzw(0)
Gzu(0)(3.22)
has the desired property that the disturbance is completely rejected at DC. The feedforward con-
troller Kstaticuw is realizable only if the DC gain of Gzu is not zero, as in the case for this system.
Also static feedforward control can be easily implemented by a look-up table.
The disturbance response ratio Rzw for Krealuw and Kstatic
uw feedforward control is shown in Fig-
ure 3.10(a). The closed-loop frequency response of each controller explicitly shows tradeoffs due to
the Poisson integral in (3.13). At low frequency ranges, both controllers perform well with |Rzw| < 1,
while |Rzw| > 1 at high frequency ranges. The similarity in the disturbance response at low fre-
quency between the dynamic and static feedforward controller can be explained by the frequency
response of Krealuw and Kstatic
uw as shown in Figure 3.9. The magnitude and phase of the dynamic
controller Krealuw are similar to the ones of Kstatic
uw below the frequency of 10 rad/sec. The distur-
bance response with dynamic feedforward Krealuw is slightly larger than the one obtained by the static
feedforward at high frequency due to the small improvements achieved between 6–40 rad/sec.
The disturbance response of both the dynamic and static feedforward controllers to a 20 A step
change in load current, corresponding to a power step from 40 to 45 kW, is shown in Figure 3.10(b).
Both feedforward controllers show similar oxygen excess ratio λO2
recovery after the initial excursion.
The two controller also achieve similar values for the measures JλO2
and ‖ 1sRzw‖2
2 as shown in
Table 3.1. The initial disturbance responses following a load step change at 0.2 seconds shows a

3.4 Feedforward control design 33
10−1
100
101
102
103
10−2
10−1
100
101
Disturbance response ratio Rzw
Mag
nitu
de
Frequency (rad/sec)
Kuwstatic
Kuwreal
open−loop
(a) Disturbance response ratio
0 0.2 0.4 0.6 0.8 1−0.45
−0.4
−0.35
−0.3
−0.25
−0.2
−0.15
−0.1
−0.05
0
0.05
Time (sec)
δ λ O
2
Inet
20A step
Kuwstatic
Kuwreal
open−loop
(b) Step response
Figure 3.10: Disturbance rejection performance with Krealuw and Kstatic
uw feedforward controller
larger excursion in oxygen excess ratio with Krealuw than the one observed with Kstatic
uw matching the
high frequency behavior in Figure 3.10(a).
The initial excursion of λO2
corresponds to the largest λO2
deviation from the nominal value,
and thus is the most critical value for oxygen starvation and stack life. This excursion is important
enough to warrant further analytic investigation of its value and occurrence. The initial excursion
of z = δλO2
during a load step change with Krealuw controller can be determined analytically from
Tzw
Tzw = Gzw + GzuKrealuw
= Gzw − Gzu
Gzw
Gzu
ζz − s
ζz + s
= Gzw
(
1 − ζz − s
ζz + s
)
. (3.23)
Then the H∞ norm of Rzw with dynamic feedforward control is
‖Rzw‖∞ = supω
∣∣∣∣1 − ζz − jω
ζz + jω
∣∣∣∣= 2 (3.24)
attained at infinite frequency. This value implies that the disturbance response of dynamic feedfor-
ward control is twice as large at high frequencies (ω > 100 rad/sec in our problem) as the initial
excursion of the uncontrolled plant for a given step disturbance. The ‖Rzw‖∞ is independent of the
location of the non-minimum phase zero ζz and always equals 2 with dynamic feedforward control
if there exists a NMP zero in the plant Gzu. Since all air flow devices powered directly by the
FC cause a NMP behavior in the Gzu response, all autonomously powered FC system will, thus,
have a significant drop in oxygen excess ratio response if a similar dynamic feedforward controller
is applied.

34 Air flow control of power-autonomous FC system
In the case of the static feedforward controller that exactly cancels the current disturbance at DC
(zero frequency), the initial excursion depends solely on the mismatch between the dynamics from
the disturbance to the performance Gzw and the dynamics from the control input to the performance
Gzu. The initial excursion of λO2
during a load step change with Kstaticuw controller can be calculated
from Tzw
Tzw = Gzw + GzuKstaticuw
= Gzw − Gzu
Gzw(0)
Gzu(0). (3.25)
This time, the H∞ norm of Rzw
‖Rzw‖∞ = supω
∣∣∣∣1 − Gzu/Gzu(0)
Gzw/Gzw(0)
∣∣∣∣= 1.87 (3.26)
attained at ω = 60 rad/sec, while the infinite frequency response of the |Rzw| is
lims→∞
|Rzw| = 1.71. (3.27)
This corresponds to the initial excursion of the oxygen excess ratio with static feedforward control
Kstaticuw , which is 1.71 times larger than the one observed in the uncontrolled plant as shown in
Figure 3.10(b). Due to the smaller initial λO2
excursion and ease of implementation, the stack
feedforward control Kstaticuw is more preferable than the dynamic feedforward control Kreal
uw .
Note here that a static feedforward controller which regulates λO2
at steady-state can be imple-
mented by measuring the FC stack current Ist, instead of the net (load) current Inet. The Ist-based
feedforward control has been proposed in [53] for the case where the compressor was not powered
by the FC stack. When the compressor current is drawn from the fuel cell stack, a portion of the
stack load is proportional to the control effort. Therefore the total stack load current is no longer
pure disturbance.
The disturbance response ratio of Ist-based controller is compared with static feedforward con-
troller in Figure 3.11(a). The response with Ist-based control shows larger disturbance amplification
than the one with Kstaticuw at high frequency ranges (over 10 rad/sec). In mid frequency, the dis-
turbance rejection performance is better with Ist-based control. This tradeoff between the better
mid frequency response versus the worse high frequency responses follows the integral constraints in
(3.13). There is a small DC error with the Ist-based controller because linearization is not accurate
away from the nominal operating point. The step response in Figure 3.11(b) reflects the frequency
responses of Ist-based control. The initial excursion to step load using the Ist-based controller is
larger than the one of the static Inet-based feedforward controller and recovery time is reduced.

3.4 Feedforward control design 35
10−1
100
101
102
103
10−2
10−1
100
101
Disturbance response ratio Rzw
Mag
nitu
de
Frequency (rad/sec)
Kuwstatic
Ist
−based
open−loop
(a) Disturbance response ratio
0 0.2 0.4 0.6 0.8 1−0.4
−0.35
−0.3
−0.25
−0.2
−0.15
−0.1
−0.05
0
0.05
Time (sec)
δ λ O
2
Inet
20A step
Kuwstatic
Ist
−based
open−loop
(b) Step response
Figure 3.11: Disturbance rejection performance of Ist-based control
w -
kΣ- - -GzuKstatic
uw
τfilter
s+1
Gzw
? zu -
Figure 3.12: Disturbance rejection with a filtered feedforward controller
3.4.3 Static feedforward control with filtered command
The NMP zero dynamics of Gzu and the associated integral constraints impose a stringent tradeoff
between our ability to achieve simultaneously a small initial excursion and a fast recovery in λO2
during step change in the load current. A compromise in favor of reducing the initial excursion can
be achieved by filtering the static feedforward controller as shown by the schematic of Figure 3.12.
Integral relations applied to Equation (3.13) are still valid even after adding a filter to the control
command. The disturbance response ratio in Figure 3.13(a) shows the disturbance attenuation over
all frequency ranges. The disturbance attennuation at high frequency improves as the time constant
of the filter, τfilter
, increases. Meanwhile, the disturbance rejection performance at low frequency
deteriorates following the Poisson integral constraint in (3.13). The step responses in Figure 3.13(b)
show the tradeoff in time domain as well. An increased τfilter
reduces the amount of initial excursion,
but decreases the recovery time after the initial excursion occurs. Figure 3.14 summarizes the tradeoff
between the initial excursion and the recovery time in oxygen excess ratio during step disturbances.
The integral square output error JλO2
also increases as τfilter
increases (in Table 3.1). Larger
τfilter
increases the recovery time and JλO2
despite the reduced initial excursions. The deterioration
in JλO2
can be seen by comparing the areas in Figure 3.13(b). The performance measure ‖ 1sRzw‖2
2
is similar to JλO2
as shown in Table 3.1. Although Krealuw and Kstatic
uw are not necessarily the optimal
controllers since Guw is not exactly static, the associated closed-loop performance is better than the

36 Air flow control of power-autonomous FC system
10−1
100
101
102
103
10−2
10−1
100
101
Disturbance response ratio Rzw
Mag
nitu
de
Frequency (rad/sec)
Kuwstatic
τfilter
=0.01
τfilter
=0.1
τfilter
=0.4
open−loop
(a) Disturbance response ratio
0 0.2 0.4 0.6 0.8 1−0.4
−0.35
−0.3
−0.25
−0.2
−0.15
−0.1
−0.05
0
0.05
Time (sec)
δ λ O
2
Inet
20A step
Kuwstatic
τfilter
=0.01
τfilter
=0.1
τfilter
=0.4
open−loop
(b) Step response
Figure 3.13: Disturbance rejection performance of static feedforward with filtered command
0.2 0.3 0.4 0.5 0.6 0.7 0.8 0.9 10.1
0.15
0.2
0.25
0.3
0.35
0.4
0.45
0.5
recovery time to |δ λO
2
| < 0.05
max
|δ λ
O2|
Kuwstatic
Kuwreal
Ist
−based
τfilter
=0.01~0.4
τfilter
Figure 3.14: Oxygen excess ratio excursion versus recovery time comparison

3.5 Feedback control design 37
Controller ‖ 1sRzw‖2
2 JλO2
Krealuw 0.1044 0.0632
Kstaticuw 0.1051 0.0633
Kstaticuw with τ
filter= 0.01 0.1114 0.0650
Kstaticuw with τ
filter= 0.1 0.1551 0.0760
Kstaticuw with τ
filter= 0.4 0.3008 0.1052
Table 3.1: Performance measures ‖ 1sRzw‖2
2 and JλO2
during step disturbance
one obtained after the filtering.
3.5 Feedback control design
While the best performance can be achieved with the feedforward control proposed in Section 3.4,
feedforward control is sometimes sensitive to uncertainties. Feedback control based on additional
measurements could mitigate the sensitivity to modeling error and device aging, so the performance
of feedback controllers are studied next.
3.5.1 Cancellation with feedback control
Cancellation control that perfectly attenuates disturbance response in the performance variable z
may be achieved with a feedback controller. For the general control configuration with a feedback
controller Kuy depicted in Figure 3.15, the closed-loop response from w to z, Tzw, is given by
Tzw = Gzw + GzuKuy(1 − GyuKuy)−1Gyw (3.28)
where Gzw, Gzu, Gyw and Gyu correspond the plant transfer functions in (3.4) and (3.5) of Sec-
tion 3.2. Since Gzu 6= 0, Gyw 6= 0, and GzwGyu −GzuGyw 6= 0 in our problem, a feedback controller
Kuy = KCuy, where
KCuy =
Gzw
GzwGyu − GzuGyw
(3.29)
yields Tzw = 0, and thus may achieve perfect cancellation from the Lemma III.5 in [19]. However,
the NMP zero ζz of Gzu does not satisfy the multiplicity bound
mzw(ζz) ≥ mzu(ζz) + myw(ζz) (3.30)
that ensures stability from Proposition IV.6 in [19]. Notably, the closed-loop system with the
cancellation controller KCuy in (3.28) is unstable internally.

38 Air flow control of power-autonomous FC system
w -
kΣ- - -GzuKuy
Gzw
? zu -
GyukΣ -y-
Gyw-
?-
Figure 3.15: Control configuration with feedback control
3.5.2 Proportional integral feedback controller
The oxygen excess ratio λO2
regulation with feedforward control Kstaticuw or Kreal
uw shows the best
integral square output errors from the results in Section 3.4. A simple, proportional and integral
(PI) controller
Kuy = KP
(
1 +KI
s
)
(3.31)
is added to the static feedforward controller Kstaticuw , based on measuring the difference between Wcp
and W refcp in (3.6), so that a zero steady-state flow error and oxygen excess ratio can be achieved
despite model uncertainties.
The disturbance response ratios and step responses in Figure 3.16 show the differences between
the measurement (compressor flow) and the performance output (oxygen excess ratio) with different
feedback control gains KP and KI . As can be seen in Figure 3.16(a), the disturbance response
increases at both low and high frequency ranges as KP increases. Larger feedback gain KP leads to
fast settling in compressor air flow (in Figure 3.16(e)), but overcompensates λO2
and thus results in
larger λO2
excursion and slow recovery in Figure 3.16(c).
Increase in KI also leads to increased disturbance response, but only at low frequency ranges
as can be seen in Figure 3.16(b). With small KI the feedback control looses its control authority
and the feedforward controller determines the performance. The feedback control gains are chosen
as KP = 0.01 and KI = 10. The closed loop system performance with these feedback gains is very
similar with the response obtained with the static feedforward controller in Section 3.4.
The feedback control designed in this section reduces the sensitivity function S = 1/(1+L) as can
be seen in Figure 3.17. In a case of feedforward control, the sensitivity of the system with respect
to uncertainties is equal to unity at all frequencies. Although it is hard to notice in the figure,
there exist the frequency ranges where the sensitivity function |S| > 1 in the case of combined
feedforward/feedback control, which follows the Bode integral relations [20].
The non-minimum phase zero ζy in Gyu affects the closed-loop stability, so that the bandwidth of
a stable closed-loop system with feedback control is limited by the NMP zero, e.g., ωBW,y < ζy [47].
However, this feedback control limitation only implies control bandwidth bounds on regulating
the measured output y, and does not necessarily imply degradation in the performance output z
because there are differences between the response of Gzu and Gyu. As can be seen in Figure 3.16,
although high feedback gain improves the tracking of the compressor flow (measurement output y),

3.5 Feedback control design 39
10−1
100
101
102
103
10−2
10−1
100
101
Disturbance response ratio Rzw
Mag
nitu
de
Frequency (rad/sec)
Kuwstatic
KP=0.01
KP=0.1
KP=1
open−loop
(a) Disturbance response ratio with respect to KP (KI =10)
10−3
10−2
10−1
100
101
102
103
10−3
10−2
10−1
100
101
Disturbance response ratio Rzw
Mag
nitu
de
Frequency (rad/sec)
Kuwstatic
KI=1
KI=10
KI=100
open−loop
(b) Disturbance response ratio with respect to KI (KP =0.01)
0 0.2 0.4 0.6 0.8 1−0.45
−0.4
−0.35
−0.3
−0.25
−0.2
−0.15
−0.1
−0.05
0
0.05
Time (sec)
δ λ O
2
Inet
20A step
Kuwstatic
KP=0.01
KP=0.1
KP=1
open−loop
(c) Step response with respect to KP (KI = 10)
0 0.2 0.4 0.6 0.8 1−0.4
−0.35
−0.3
−0.25
−0.2
−0.15
−0.1
−0.05
0
0.05
Time (sec)
δ λ O
2
Inet
20A step
Kuwstatic
KI=1
KI=10
KI=100
open−loop
(d) Step response with respect to KI (KP = 0.01)
0 0.2 0.4 0.6 0.8 1−8
−6
−4
−2
0
2
4
6
8
10
12
Wcpre
f − W
cp (
g/se
c)
Time (sec)
Kuwstatic
KP=0.01
KP=0.1
KP=1
(e) Error in Wcp with respect to KP (KI = 10)
0 0.2 0.4 0.6 0.8 1−8
−6
−4
−2
0
2
4
6
8
10
Wcpre
f − W
cp (
g/se
c)
Time (sec)
Kuwstatic
KI=1
KI=10
KI=100
(f) Error in Wcp with respect to KI (KP = 0.01)
Figure 3.16: Disturbance rejection performance of feedback control with KP and KI variation

40 Air flow control of power-autonomous FC system
10−3
10−2
10−1
100
101
102
103
10−2
10−1
100
101
Frequency (rad/sec)
Mag
nitu
de
FeedbackFeedforward
Figure 3.17: Magnitude of sensitivity function of the system with feedback and feedforward control
Setpoint
Map
Feedback
Controller
Feedforward
Controller
- Compressor FC Stack
λO2Ist
vst
vcm
vffcm
vfbcm
Inet
Icm
Wcp
psm
W refcp
ΣΣ Σy
Figure 3.18: Schematic of the fuel cell stack system with air flow control using compressor
it deteriorates the regulation of oxygen excess ratio (performance output).
In conclusion, a low gain feedback controller combined with static feedforward map could provide
a control design with adequate performance, robustness and complexity. The compressor control
command can be written as
vcm(t) = vffcm(t) + vfb
cm(t)
= f(Inet)
+KP
[(W ref
cp (Ist(t)) − Wcp(t))
+ KI
∫ t
0
(W ref
cp (Ist(τ)) − Wcp(τ))dτ
]
(3.32)
and the air flow control architecture is shown in Figure 3.18. The feedforward control is implemented
as a look-up table, whereas the linear feedback control is based on the nominal operating point.

Chapter 4
Experimental confirmation
In this chapter, the model developed in Chapter 2 and the limitations identified in Chapter 3 are
qualitatively confirmed with experiments. The experimental setup consists of a small and com-
mercial fuel cell system (Nexa by Ballard Power System Inc.), an electric load and measurement
devices installed at the Fuel Cell Control Laboratory in the University of Michigan. Nexa fuel
cell stack system is an example of power-autonomous fuel cell system supplying power to all its
auxiliary components from its own stack power except during start-up and shutdown. Nexa has
its own dedicated proprietary controller and safety systems so the experimental data collected cor-
respond to the closed-loop behavior of the system. An external controllable load is used to test the
Nexa behavior.
Using this experimental setup, the closed-loop system response with the model and control design
developed in Chapter 2 and 3 is compared with the response of the Nexa system and a qualitative
confirmation of the model and controller is achieved. Although the qualitative confirmation is a
weaker result than a full validation, the comparison presented here provides some level of confidence
in the simulation model. Moreover, the comparison shows that all the previous modeling and
control analysis results can be applied to a much smaller fuel cell stack system (1.2 kW) than the
one originally used (75 kW).
4.1 System operation
The Nexa is fully automated, air cooled fuel cell system with internal air humidification, and is
designed to be integrated into portable and back-up power. The rated net power is 1200 W at full
load with the stack voltage at 26 V. The stack has a total of 47 cells connected in series. Hydrogen is
supplied from the compressed tank through the safety system and ambient air is used as oxidant to
the cathode through a built-in blower. The supply pressures to the stack are 5.0 psig for the anode
and 2.2 psig for cathode. The operating temperature is 65 which is controlled by another blower
in an air-cooled configuration. The operating pressure at fuel supply inlet is chosen at 20 psig.
41

42 Experimental confirmation
Figure 4.1: Experimental setup
Figure 4.1 depicts the Nexa fuel cell system, measurement and safety hardware. The ex-
perimental setup consists of the following equipment. An electric load (RBL488 TDI Transistor
Devices–Dynaload Division), an analog-to-digital converter board (National Instruments PCI-
6024E with 12 bit resolution, 200 kS/s maximum sampling rate) and NI LabVIEW are used.
The RBL488 load is adequate to test and analyze fuel cells with constant and transient power capa-
bilities. Sensors are designed and installed to measure the stack voltage, and the current of the fuel
cell stack and also the auxiliary load current. To accommodate the high voltage of the stack (from
26 to 50 V) to the adequate range for the A/D board, a simple resistor ladder with precision power
film resistors (in 21:1 ratio) is implemented. Two closed-loop hall effect sensors (CLSM-50LA from
F.W. Bell), which can pick up the current up to the frequency of 200 kHz, are installed for the net
current and auxiliary current measurement. During the experiment, the oxygen excess ratio is not
measured since there is no available space for the measurement of air flow rate before the cathode
inlet. Also typical air flow rate measurement, for example, the thermal anemometry (hot wire) flow
sensor can not be used for humid air after the humidifier.
Figure 4.2(a) shows the steady-state relation between the stack current and the stack voltage, or
the polarization curve, of the experimental FC. The regions of activation, ohmic and concentration
losses in voltage can be discerned in the voltage versus the stack current plot. The overall trend
in the polarization curve is similar to Figure 2.1, which is determined by Equation (2.1). In the
power-autonomous FC system, the auxiliary load affects the performance of the FC system. The
power performance is determined by the stack characteristics and auxiliary power for the air blower
and the cooling fan. As can be seen in Figure 4.2(b), the steady-state net power to the load is a
function of the net load current of the FC, which is similar to Figure 3.3. The net power of the
experimental FC increases monotonically as the net current increases to the rated maximum. Note
here that the current density of the experimental FC is not shown because the active area of the cell
is not disclosed from the manufacturer.

4.2 Experimental comparisons 43
0 10 20 30 40 50 600
5
10
15
20
25
30
35
40
45
Stack Current (A)
Sta
ck V
olta
ge (
V)
(a) Stack polarization
0 10 20 30 40 500
200
400
600
800
1000
1200
Net Current (A)
Pow
er (
W)
Net Power
Auxiliary Power
(b) Fuel cell net power
Figure 4.2: Steady-state performance of the Nexa FC system
4.2 Experimental comparisons
Various models have been already proposed for the Nexa fuel cell stack system. A steady-state
polarization model is presented and the cell-to-cell voltage variations are observed in [72]. System
identification techniques are used for the parameterization of an equivalent electric circuit based on
electrochemistry principles [10]. The parameters for the equivalent electric circuit of the Nexa are
identified with impedance spectrum measurement. An equivalent electric circuit with static correc-
tion for the temperature effects is proposed [62].
The experiment is designed to show the transient responses of the voltage or the current of the FC
during the net current or the voltage changes, respectively. Due to the differences in the power and
the flow device used by FC in the model and the FC in the experiment, the experimental validation
is performed qualitatively instead of comparing the exact measurement.
We achieve here only a qualitative confirmation of the model and controller using the experi-
mental setup due to the differences between the fuel cells considered in the 75 kW fuel cell stack
system model and the 1.2 kW power experimental set-up. Although the difference in the power
range is important, the most important difference in the two systems is the operating pressure. The
compressor-driven FC in the model operates at high pressures whereas the blower-driven FC in the
Nexa experimental apparatus operates at low pressures. To compare the response of the two sys-
tems, the current and voltage load ranges for the simulation are chosen to be low (60/300 Amperes
and 250/350 Volts) in order to ensure operation of low pressure range to avoid the effect of the
cathode pressure variation.
4.2.1 Net current input
The experimental data during a command of net current input are shown in Figure 4.3(a). A net
load current increase from 20 to 30 A is applied to the experimental FC within 0.02 second at
0.2 second. A pure step change in net current is not applied in order to avoid the effects of the

44 Experimental confirmation
0 0.2 0.4 0.6 0.8 115
20
25
30
35
Net
Cur
rent
(A
)
0 0.2 0.4 0.6 0.8 10
2
4
Aux
iliar
y C
urre
nt (
A)
0 0.2 0.4 0.6 0.8 115
20
25
30
35
Sta
ck C
urre
nt (
A)
0 0.2 0.4 0.6 0.8 126
28
30
32
34
Sta
ck V
olta
ge (
V)
Time (sec)
(a) Experimental result
0 0.2 0.4 0.6 0.8 1
60
80
100
I net (
A)
0 0.2 0.4 0.6 0.8 10
2
4
6
I cm (
A)
0 0.2 0.4 0.6 0.8 1
60
80
100
I st (
A)
0 0.2 0.4 0.6 0.8 1230
240
250
260
v st (
V)
Time (sec)
(b) Simulation result
Figure 4.3: Experimental comparion - net current step
control logic in the electric load and the power cable between the stack and the load. The rate
of change of 10/0.02 = 500 A/sec is fast enough to excite the dynamics of the experimental fuel
cell. When the net current load increases, the stack voltage immediately drops following the current
input. Then there is a slow voltage decrease that matches the response of the measured auxiliary
current which increases rather slowly as shown in Figure 4.3(a). Due to the slow auxiliary current
increase, we postulate that a filtered feedforward controller similar to the one analyzed in Section 3.4
is used by the Nexa control system. In Nexa FC system, the air supply blower and cooling
fan are actually controlled by a pulse width modulation (PWM) command and thus the auxiliary
current measurement exhibits continuously pulsing results. The averaged current is calculated and
plotted over the measured current.
Simulation is also performed during a change in net current from 60 to 90 A. The air supply con-
trol is based on feedforward control from the net current measurement. The first order filter is added
to the feedforward control, which is shown in Section 3.4. The filter time constant τfilter
= 0.4 sec-
ond is chosen to match the dynamics of the auxiliary current load. As can be seen in Figure 4.3(b),
the voltage dynamic behavior of the FC model is similar to the results of the experiment. The
simulation result in the compressor motor load Icm, the stack current Ist and voltage vst supports
our conjecture about the air supply control strategy in the Nexa .
4.2.2 Stack voltage input
A stack voltage input is also applied to the experimental FC, which is shown in Figure 4.4(a). When
the stack voltage is used as the input of the system, the dynamic behavior of the stack current

4.2 Experimental comparisons 45
0 0.2 0.4 0.6 0.8 115
20
25
30
35
Net
Cur
rent
(A
)
0 0.2 0.4 0.6 0.8 10
2
4
Aux
iliar
y C
urre
nt (
A)
0 0.2 0.4 0.6 0.8 115
20
25
30
35
Time (sec)
Sta
ck C
urre
nt (
A)
0 0.2 0.4 0.6 0.8 126
28
30
32
34
Sta
ck V
olta
ge (
V)
(a) Experimental result
0 0.2 0.4 0.6 0.8 1230
240
250
260
v st (
V)
0 0.2 0.4 0.6 0.8 1
60
80
100
I net (
A)
0 0.2 0.4 0.6 0.8 10
2
4
6
I cm (
A)
0 0.2 0.4 0.6 0.8 1
60
80
100
I st (
A)
Time (sec)
(b) Simulation result
Figure 4.4: Experimental comparison - voltage step
represents the performance of the fuel cell system. Simulation results with voltage input are shown
in Figure 4.4(b). Although the input of the fuel cell stack system is the stack voltage, the air
supply dynamics of the fuel cell system are same as in the case of the current input model. The
same air supply control is applied with filtered feedforward command based on the net load current
measurement. Most features of the dynamic behavior of the experiment are predicted well with the
simulation. The net current shows overshoot after the step voltage decrease, followed by the increase
in auxiliary current load.
In the experimental comparisons with two different input situations, the model developed in
Chapter 2 and the control design analyzed in Chapter 3 shows the ability to describe transient
power performance of the FC. Here the oxygen excess ratio behavior is not verified experimentally
due to the lack of OER sensor. Based on the transient responses in the net load current and the
auxiliary load current, the changes in oxygen excess ratio are expected to be as in Figure 3.13(b).
In the case of the experimental FC system, reducing the occurrence of large excursions in oxygen
excess ratio is more critical due to the unknown pulsating loads typically observed in power supply
applications. Thus, we postulate that the feedforward control is passed through a slow filter, and
hence the initial excursion of the oxygen excess ratio is not affected by the air supply control during
step changes in current or voltage. The advantage of filtered command in air supply is reduced
disturbance ratio at high frequency current input (see Figure 3.13(a)), while the disadvantage is
slower recovery after the initial excursion, as can be seen in Section 3.4. If there exists a supervisory
controller that manages power drawn from the FC, high frequency current input can be filtered by
the DC/DC converter while low frequency current disturbance rejection in regulating λO2
can be

46 Experimental confirmation
achieved by the air supply control. The final two chapters cover these issues on integration of the
FC with DC/DC converter and battery.

Chapter 5
DC/DC converters for fuel cell
system
In this chapter, we present controller design and performance analysis of an autonomous FC power
system which is augmented with a DC/DC converter for regulated voltage power source. We show
that there is a tradeoff between the bus voltage regulation and oxygen excess ratio in the FC without
hybridization. This combination of FC and DC/DC converter is applicable for the stationary system
for back-up power or distributed power generation. In this case, the control objective of DC/DC
converter is dedicated to boosting varying FC voltage to constant output voltage at the power bus.
To investigate the coupled dynamics with currents and voltages in the fuel cell power system, it
is necessary to establish an analytic model for the fuel cell with DC/DC converter and design the
integrated system. In this chapter, it is shown that the dynamics of the DC/DC converter represents
the coupling of currents and voltages of the fuel cell and the DC/DC converter.
We also present the control design for the bidirectional DC/DC converter. The control problem of
bidirectional DC/DC converter arises when charging/discharging the battery to buffer the FC load.
Control effects of the bidirectional DC/DC converter are not known yet, because the bidirectional
DC/DC converter manifests the FC stack voltage and not the current, and the voltage dynamics
of the fuel cell have not been discussed before. We show here control design of the bidirectional
DC/DC converter for the FC hybrid architecture.
In the last part of this chapter, the effects of the DC/DC converter control on the fuel cell system
and the DC/DC converter are shown. The decentralized control scheme is applied to individual
controllers for the fuel cell system and the DC/DC converter. The current drawn from the fuel
cell is determined by the closed-loop performance of the DC/DC converter. Using the DC/DC
converter to shape the FC current can resolve the oxygen excess ratio regulation problem. Filtering
the current from the FC limits the ability of the DC/DC converter to regulate the bus voltage,
and thus it introduces a new tradeoff between oxygen excess ratio and bus voltage. The simulation
results show that there is a tradeoff between the two performance objectives, FC oxygen excess ratio
47

48 DC/DC converters for fuel cell system
D Cvst
Inet Idc
d
Lin
Cout Rload
vbus
Figure 5.1: DC/DC boost converter
and the output voltage of the converter. Finally, a model-based, multivariable optimal controller is
designed to moderate the performance conflict.
5.1 DC/DC converter
In this study, two kinds of DC/DC converter for fuel cell application are considered. First, the
unidirectional DC/DC converter transforms the DC fuel cell stack power to output voltage-current
requirements of the external power devices that connect to an FC system. Here we consider a boost
converter (shown in Figure 5.1) that can be used in PEM fuel cell applications. The voltage and
current at the DC/DC converter input are the FC stack voltage vst and the net FC current Inet,
respectively. In steady-state, the converter functionality can be described by
vstInet = vbusIdc,
(1 − d)Inet = Idc. (5.1)
The bus voltage vbus and the output current Idc are associated with the duty cycle d of the solid state
switch in the circuit. The inductance of input inductor Lin, the capacitance of output capacitor
Cout and the resistance of the load Rload are shown in Figure 5.1.
In the area of fuel cell power applications, bidirectional DC/DC converter is considered, specif-
ically in a load-following fuel cell system that the FC power meets most of power demand while
small-sized battery covers some transients and start-up/shutdown [70, 72]. Bidirectional converter
has an ability to match high voltage fuel cells with low voltage battery when fuel cell is directly
connected to the DC bus in a hybrid configuration, as shown in Figure 1.2(b). Figure 5.2 depicts
one of the bidirectional converter topology for low voltage battery and high voltage DC bus.
5.1.1 DC/DC converter model
In this study, the DC/DC boost converter is selected for 50 kW power and based on 400 V output
voltage with nominal input voltage is 250 V and thus nominal input current is 200 A. Ideally the
input power is processed in a converter with 100 % efficiency. Actual efficiency is slightly less than
100 % due to the losses in the inductor, capacitor, transformer, switch and controller circuit. A

5.1 DC/DC converter 49
Figure 5.2: Bidirectional DC/DC converter [65]
typical boost converter for PEM fuel cell application has about 95 % efficiency when the voltage
boost ratio is approximately two [67].
Increasing Lin reduces the ripple of the input current. Although large Lin protects the stack
from high frequency AC current, the associated increase in resistance might decrease the converter
efficiency. The size of Cout is usually determined by the ripple specification of output voltage.
Other considerations such as the voltage and current limit of the capacitor should also be accounted
especially due to high voltage and current values associated with FC applications. For the subsequent
dynamic analysis, the values of inductor and capacitor are selected to be as Lin = 1 mH and
Cout = 1200 µF.
An average nonlinear dynamic model can be used to approximate the boost converter switching
dynamics [41]
Lin
dInet
dt= vst − (1 − d)vbus,
Cout
dvbus
dt= (1 − d)Inet −
vbus
Rload
. (5.2)
The inputs to the converter, based on realistic FC operation, are the duty cycle d, the input
voltage vst, and the output current, Idc = vbus/Rload. Linearization and Laplace transformation
from these inputs to the output voltage vbus provide the following transfer functions [15]
vbus = Gd(s)d + Gv(s)vst − Zout(s)Iout (5.3)
Gd(s) =
vbus,n
(1−dn)Rload,nCout
[(1−dn)2Rload,n
Lin− s
]
s2 + 1Rload,nCout
s + (1−dn)2
LinCout
Gv(s) =1−dn
LinCout
s2 + 1Rload,nCout
s + (1−dn)2
LinCout
Zout(s) =1
Couts
s2 + 1Rload,nCout
s + (1−dn)2
LinCout
where dn is the nominal duty cycle and Rload,n is the nominal load resistance. The transfer function
Zout is called converter impedance and represents the effect of small load (current) changes to vbus.

50 DC/DC converters for fuel cell system
0
20
40
60
80
100
Mag
nitu
de (
dB)
101
102
103
104
−270
−180
−90
0P
hase
(de
g)
Bode Diagram
Frequency (rad/sec)
5kW25kW50kW
Figure 5.3: Open-loop dynamics of Gd for different load levels
As can be seen in the zero at the origin of Zout, the steady-state output voltage is not affected
by changes in load. This capability to reject load disturbances (variation in Iout) and regulate the
output voltage (vbus) is desirable. However, a zero at s = 0 corresponds to a derivative of the
disturbance input causing large deviation in vbus during a step change in load. Thus, although the
zero at the origin helps the steady-state performance, it deteriorates the transient performance. The
impedance can also represent the dynamics of Rload to vbus when the electric load is purely resistive
which is typical for automotive or backup power applications.
The output voltage dynamics depends on nominal power level and input voltage which are re-
flected in the open-loop transfer function through different dn and Rload,n values. It can be shown
that the characteristic equation given by the denominator of the transfer function of the transfer func-
tions in (5.3) has under-damped behavior for typical combinations of Lin, Cout, dn and Rload,n. The
damping ratio decreases when power increases or Rload,n decreases in ζ = 12Rload,n(1−dn)
√
Lin/Cout.
The gain and phase Bode plots of the transfer function Gd in (5.3) shown in Figure 5.3 describes
the open-loop dynamics (from control input d to performance variable vbus).
Low damping of the open-loop dynamics causes undesirable output oscillations that can be
reduced with judicious control design as discussed below. As the Bode plots indicate, the open loop
converter has fast dynamics with natural frequency ωn = (1− dn)/√
LinCout approximately at 1000
rad/sec. The fast converter dynamics cause abrupt changes in Inet and act as a disturbance to the
fuel cell. Therefore, the converter control design has to reduce this high frequency disturbance to
the fuel cell by providing damping, or in other words, filtering the current Inet drawn from the FC.
5.1.2 DC/DC converter control
The converter control objective is to maintain constant bus voltage despite variations in the load
and the input (fuel cell) voltage. In the fuel cell application, the converter operates in large range of

5.1 DC/DC converter 51
power. We thus consider disturbances in Gload = 1/Rload that can capture the large load variation
better than the output current Iout formulation in Equation (5.3). Nonlinear control techniques
in [16] were employed to handle large variations in converter loads. We employ linear control tech-
niques similar to [15] and formulate the bus voltage regulation problem using the control structure
in [25].
In the DC/DC converter model described in Figure 5.1 and Equation (5.2), the only control
input is the duty cycle of the DC/DC converter. The duty cycle, the actual control command to
the DC/DC converter, is controlled in order to achieve the following objectives: (i) protect the fuel
cell system from abnormal load including transient and (ii) maintain the DC-bus voltage vbus. In
our case, the fuel cell is augmented with the DC/DC boost converter, matching the voltage of the
DC-bus, vbus to the desired value vrefbus . By changing the duty cycle, the net current of the fuel cell
and the bus voltage can be regulated, but not independently from each other.
Figure 5.4 shows the controller design for a DC/DC converter. Dual loop control (voltage/current
control) can be implemented for the DC/DC boost converter [41]. Both current of the fuel cell, Inet
and voltage of the bus, vbus are controlled by the feedback controller.
vref
bus
- kΣ-
- Cv- k
Σ-
- CI-d DC/DC
Converter
-
6
vbus
Inet
6
?
vst Rload
?
Figure 5.4: DC/DC boost converter control
In this control scheme, the outer loop controller Cv is composed of a proportional-integral (PI)
controller for zero steady-state error in DC-bus voltage vrefbus . Then the output from Cv can be the
virtual reference of Inet, which becomes the current drawn from the fuel cell when the converter
connects to the fuel cell. Nonlinear logic such as slew rate limiter, saturation or any kind of filter
can be added to shape the current from the fuel cell stack [67]. A proportional controller (P) is used
for the net fuel cell current controller CI . Both P and PI controllers for Cv and CI , respectively,
can be tuned sequentially using classical control techniques. The Cv and CI controllers can also be
tuned using single-input, single-output classical proportional, integral and derivative (PID) control
tuning techniques for regulating vbus. Indeed, adding a proportional feedback CI around the Inet
measurement is equivalent to a derivative controller around vbus which is needed to dampen the
typically under-damped DC/DC converter dynamics, which is shown in Section 5.1.1.
We choose to apply a model-based linear quadratic regulator approach after transforming the
Cv and CI controllers to state feedback as follows. The controlled duty cycle d is
d(s) = −KDvInet(s) − KPvvbus(s) −KIv
svbus(s) (5.4)
and formulated as state feedback when an integrator q, where dq/dt = vbus, is added for the vbus
regulation objective. The optimal state feedback gains KDv, KPv and KIv can be selected from a

52 DC/DC converters for fuel cell system
linear quadratic regulator design [25]. The controller gains are derived based on the minimization
of a quadratic cost function
J =
∫∞
0
[
Inet vbus
]
Q
[
Inet
vbus
]
+ uT Ru + qT QIq dt. (5.5)
With known gains, two equivalent controllers, Cv and Ci are separated
Cv(s) =KPv
KDv
+KIv
KDvsCI(s) = KDv. (5.6)
Figure 5.5 shows simulation results of the boost converter with two degree of freedom controllers
(solid line) and the open-loop performance (dashed line). The feedback controller gain is determined
by the LQR weight matrix Q = I, QI = 10000 and R = 0.1. First, a step decrease of input voltage
from 250 V to 225 V is applied to emulate fuel cell voltage which corresponds to 70 mV average cell
voltage drop. During this change, shown in (a), the duty cycle d increases and draws more current
from the input source. The performance variable vbus recovers within 0.1 second. The controller
can be tuned to handle the input voltage change faster at the expense of faster transient in current
drawn from the fuel cell Inet. The graphs in column (b) show the closed-loop response during a load
change. The load change corresponds to increase in power from 50 kW to 55 kW. In this situation,
steady-state voltage regulation is not a problem because the DC gain of the impedance transfer
function Zout is zero as discussed in Section 5.1.1. Nevertheless, the controller we design reduces
d for a short time. This decrease helps filter the sharp and oscillatory current in Inet that would
have occurred otherwise (shown in dashed line). Here it can be observed that the closed-loop Inet
increases and settles to the next steady-state level in both input voltage change and output power
change. This behavior clarifies the causality between the fuel cell and converter dynamics, where
the fuel cell becomes a current source in the output voltage regulation problem.
5.1.3 Bidirectional DC/DC converter model
In a case of load-following fuel cell hybrid system depicted in Figure 1.2(b), the major power flows
from the FC to the load directly without a DC/DC converter. Here a small amount of battery current
flows through the DC/DC. This configuration has an advantage on efficiency because it avoids the
DC/DC converter losses. The size and power requirement for bidirectional DC/DC converter is thus
relatively smaller than the ones for the DC/DC converter in Section 5.1.1. Here we consider 10 kW
power bidirectional DC/DC converter that boosts 24 V battery power to the stack bus voltage, or
charging the battery with fuel cell power.
Given the topology in Figure 5.2, the switches of the converter operate only in two different
switching states, leading to the simplified analytic model shown in Figure 5.6. An averaged model

5.1 DC/DC converter 53
0 0.02 0.04 0.06 0.08 0.1220
230
240
250
260
v st (
V)
0 0.02 0.04 0.06 0.08 0.1340
360
380
400
v bus (
V)
0 0.02 0.04 0.06 0.08 0.1
160
180
200
220
Time (sec)
I net (
A)
Closed−loopOpen−loop
0 0.02 0.04 0.06 0.08 0.10.35
0.4
0.45
d
(a) input voltage change
0 0.02 0.04 0.06 0.08 0.12.8
2.9
3
3.1
3.2
Rlo
ad (
Ohm
)
0 0.02 0.04 0.06 0.08 0.1380
390
400
410
v bus (
V)
0 0.02 0.04 0.06 0.08 0.1190
200
210
220
230
Time (sec)
I net (
A)
Closed−loopOpen−loop
0 0.02 0.04 0.06 0.08 0.10.35
0.36
0.37
0.38
d
(b) load resistance change
Figure 5.5: Simulation results of the DC/DC converter
+
+
-
Lin
Cout
vst
Inet
vbt
Ibt
Rload FC
(a) Switching state 1
+1:N
+
-
Lin
Cout
vst
Inet
vbt
Ibt
Rload FC
(b) Switching state 2
Figure 5.6: Bidirectional DC/DC converter model

54 DC/DC converters for fuel cell system
based on duty cycle d can be described in [65]
Lin
d
dtIbt = −1 − d
Nvst + vbt (5.7)
Cout
d
dtvst =
1 − d
NIbt −
1
Rload
vst + Inet (5.8)
where vbt is the battery voltage and Ibt is the battery current, respectively. For the subsequent
dynamic analysis of the bidirectional DC/DC converter, the values of inductor and capacitor are
selected to be as Lin = 13 µH, Cout = 10000 µF and the transformer ratio of N = 5.
Figure 5.7 shows open-loop dynamics of the bidirectional converter with respect to changes in
load resistance Rload, fuel cell current Inet, battery voltage vbt and duty cycle d. During the changes
in the load resistance or fuel cell current, the stack voltage varies abruptly, which may increase in
the fuel cell current also. The battery current changes much and stays away from zero when the
other operating conditions vary. This can cause aggressive battery use especially when we consider
small-sized, low voltage battery for load-following fuel cell configuration. By changing the duty
cycle, the fuel cell stack voltage and the battery current can be regulated, but no independently
from each other.
5.1.4 Bidirectional DC/DC converter control
The control objectives of the bidirectional DC/DC converter depend on the electric architecture. It
was qualitatively described that the controller that splits load to the FC and battery can be achieved
indirectly by adjusting bus the stack voltage using battery and bidirectional DC/DC converter [58].
The dynamics of bidirectional DC/DC converter are tied with the load current, fuel cell net current,
battery voltage, and the control input, duty cycle d as can be seen in Equation (5.8).
Figure 5.8 shows the controller design for a bidirectional DC/DC converter. Dual loop control
(voltage/current control) can be implemented, which is similar to the one shown in Section 5.1.2.
Here both current of the battery, Ibt and voltage of the fuel cell, vst are determined by the feedback
controller. We can again choose to apply a model-based linear quadratic regulator approach after
transforming the Cv and CI controllers to state feedback as follows. The controlled duty cycle d is
d(s) = −KPIIbt(s) − KPvvst(s) −KII
sIbt(s) (5.9)
and formulated as state feedback when an integrator q is added for the Ibt regulation objective. The
optimal state feedback gains KPI , KPv and KII can be selected from a linear quadratic regulator
design. With known gains, the two equivalent controllers, Cv and CI , are separated
CI(s) =KPI
KPv
+KII
KPvsCv(s) = KPv. (5.10)
The details in control results are shown with the hybrid configuration in Section 6.3.

5.1 DC/DC converter 55
0 0.1 0.2 0.3 0.4 0.5 0.6 0.7 0.8
1.25
1.3
1.35
1.4
Rlo
ad
0 0.1 0.2 0.3 0.4 0.5 0.6 0.7 0.8220
230
240
v st
0 0.1 0.2 0.3 0.4 0.5 0.6 0.7 0.80
100
200
300
I bt
Time (sec)
(a) load resistance change
0 0.1 0.2 0.3 0.4 0.5 0.6 0.7 0.8160
180
200
I net
0 0.1 0.2 0.3 0.4 0.5 0.6 0.7 0.8230
240
250
v st
0 0.1 0.2 0.3 0.4 0.5 0.6 0.7 0.8−400
−200
0
200
I bt
Time (sec)
(b) fuel cell current change
0 0.1 0.2 0.3 0.4 0.5 0.6 0.7 0.820
22
24
v bt
0 0.1 0.2 0.3 0.4 0.5 0.6 0.7 0.8180
200
220
240
v st
0 0.1 0.2 0.3 0.4 0.5 0.6 0.7 0.8−400
−200
0
200
I bt
Time (sec)
(c) battery voltage change
0 0.1 0.2 0.3 0.4 0.5 0.6 0.7 0.80.48
0.49
0.5
d
0 0.1 0.2 0.3 0.4 0.5 0.6 0.7 0.8230
235
240
245
v st
0 0.1 0.2 0.3 0.4 0.5 0.6 0.7 0.80
20
40
60
I bt
Time (sec)
(d) duty cycle change
Figure 5.7: Open-loop simulation of the bidirectional DC/DC converter

56 DC/DC converters for fuel cell system
Iref
bt
- kΣ-
- CI- k
Σ-
- Cv-d Bidirectional
Converter
-
6
Ibt
vst
6
?
Inet Rload
?
Figure 5.8: Bidirectional DC/DC converter control
5.2 Coordination of the DC/DC converter with the fuel cell
Here we first consider the integration of the fuel cell with the controlled compressor, and the con-
trolled DC/DC converter in autonomous power supply. This integration exactly follows the hybrid
configuration of the FC in Figure 1.2(a) except battery is not included. In an industrial application,
the fuel cell with its compressor and compressor controller is viewed as one component and the
DC/DC converter with its controller as another as shown in Figure 5.9(a). Typically, these two
components are provided by different manufacturers based on some initial specifications. The two
controllers are calibrated separately and small corrections are performed after the two components
are connected. This control architecture is called decentralized, and the calibration is called sequen-
tial, because one controller is tuned and then the other is re-tuned to minimize interactions between
the two components. The process is sometimes tedious and can be suboptimal even after many
iterations.
Another tuning methodology that chooses the right calibration by taking into account the com-
ponent interaction is called multivariable and results in a centralized controller as shown in Fig-
ure 5.9(b). Decentralized control is successful if there is minimal coupling between the two systems.
In our case, the performance variables λO2
and vbus are conflicting with each other and result in a
challenging calibration problem.
5.2.1 Decentralized control
When the fuel cell with its compressor and compressor controller is viewed as one sub-system and
the converter with its controller as another, two different control objectives, oxygen excess ratio
regulation in the fuel cell and bus voltage regulation in the DC/DC converter are pursued by two
controllers.
The control objective of regulating the oxygen excess ratio λO2
can be achieved by a combination
of feedback and feedforward control by measuring the compressor air flow rate Wcp and the demanded
load current Inet. Figure 3.18 in Chapter 3 shows the feedback and feedforward controllers which
are designed to regulate the oxygen excess ratio in an autonomous fuel cell power system.
Regulating air flow in power-autonomous fuel cell system has inherent performance limitations.
The volume of supply manifold including humidifier and heat exchanger after the flow meter causes
significant lag or delay on regulating oxygen excess ratio inside the stack [52, 60]. On the other
hand, using a large compressor control effort may overcome the limitation above at the risk of

5.2 Coordination of the DC/DC converter with the fuel cell 57
1`
CMLoad
H2 Tank
AirCompressor
FF+FB
Fuel CellSystem
DC-DCConverter
Load
FB
M
λO2
Ist
Ist
Icm
Wcp
vcm
Inet
Inet
vbus
vst
Inet, vbus
d
Lin
Cout
(a) Decentralized control scheme
1
CMLoad
H2 Tank
AirCompressor
MMIMOController
Fuel CellSystem
states
DC-DCConverter
Load
λO2
Ist
Ist
Icm
Wcp
vcm
Inet
vbus
vst
Inet, vbus d
Lin
Cout
(b) Coordinated control scheme
Figure 5.9: Control schemes for fuel cell power system

58 DC/DC converters for fuel cell system
causing instabilities when the compressor draws current directly from the stack [49]. These control
performance and limitations in the FC air supply are analyzed in Chapter 3. The oxygen excess
ratio λO2
regulation with combined feedforward/feedback control shows the best results within the
inherent limitations. Then the load current to the fuel cell stack is shaped (filtered) to improve the
performance of the closed-loop air supply dynamics. The selection of control gains in the DC/DC
converter mainly handles the bus voltage regulation. This calibration allows us to modify the fuel
cell current request based on its impact on oxygen starvation.
Figure 5.10 shows the simulation results of the fuel cell power system with two decentralized
controllers during a step load resistance change to the DC/DC converter input. The step size of the
resistance load change matches with the increase of the output power from 40 kW to 45 kW so that
the output power reaches to the 45 kW when the bus voltage vbus of the DC/DC converter settles to
nominal value of 400 V. The net fuel cell current Inet, which is the output of the DC/DC converter
and the input to the FC in Figure 5.10, is filtered as a results of the integration with DC/DC
converter, but the net current overshoot with the effort of regulating the bus voltage, consequently
affecting the oxygen excess ratio, that is the performance output of the FC. The compressor command
vcm is determined by the controller designed in Section 3.5.
As can be seen in dashed line in Figure 5.10, when the converter controller acts fast to regulate
vbus, there exists large excursion in λO2
. The control gain of the case DEC1 is determined by LQR
weight matrix of Q = I, QI = 1000 and R = 0.1. The duty cycle d reacts faster after the step load
change in Rload in order to regulate vbus. The following increase in d causes a sudden current load
Inet increase, which causes unacceptable λO2
excursion. The effect of load increase becomes severe
due to the compressor current Icm drawn from the FC, which can be estimated by observing the
compressor input vcm, the stack current Ist, and the net current Inet.
Detuning of the converter controller is necessary to avoid this fast interaction in the fuel cell.
As can be seen from the result of the fuel cell controller in Chapter 3, reducing high frequency
current load by changing the bandwidth of the DC/DC converter control is desirable to reduce large
excursion in the oxygen excess ratio (see Figure 3.16). The solid line (DEC2) shows the simulation
results after the detuning by the LQR weight matrix of Q = I, QI = 100 and R = 0.1. Now the
duty cycle reacts slower than the tune of DEC1, filtering the FC net current and avoiding the large
λO2
excursion. For these converter gains, the output voltage vbus recovers slowly demonstrating
performance tradeoffs between the oxygen excess ratio regulation and the bus voltage regulation.
Full state feedback control is introduced in the next section to allow coordination between the
DC/DC converter and the compressor controller and check if it is possible to improve further both
performance variables λO2 and vbus.
5.2.2 Full state feedback control
As we have seen in the previous section, the two performance outputs are conflicting. It is, thus, not
clear if any control design can improve the performance of both outputs. A centralized, model-based
controller is designed to define the optimal signals within the conflict. The approach is known as

5.2 Coordination of the DC/DC converter with the fuel cell 59
0.6 0.8 1 1.2 1.4 1.6 1.83.4
3.6
3.8
4
4.2
Rlo
ad (
Ohm
)
0.6 0.8 1 1.2 1.4 1.6 1.80.38
0.4
0.42
0.44
0.46
0.48
d
Time (sec)
(a) DC/DC converter inputs
0.6 0.8 1 1.2 1.4 1.6 1.8380
385
390
395
400
405
v bus (
V)
DEC 1DEC 2
0.6 0.8 1 1.2 1.4 1.6 1.8160
170
180
190
200
210
I net (
A)
Time (sec)
(b) DC/DC converter outputs
0.6 0.8 1 1.2 1.4 1.6 1.8160
170
180
190
200
210
v cm (
V)
Time (sec)
Inet
(c) Fuel cell system input
0.6 0.8 1 1.2 1.4 1.6 1.8
1.6
1.8
2
2.2
λ O2
0.6 0.8 1 1.2 1.4 1.6 1.8180
200
220
240
260
I st (
A)
Time (sec)
(d) Fuel cell system outputs
Figure 5.10: Simulation results of the nonlinear fuel cell power system model - decentralized control

60 DC/DC converters for fuel cell system
linear quadratic regulator (LQR). We employ linearization of the state-space representation of the
FC model in Chapter 2 and the static feedforward control design in Chapter 3, and the DC/DC
converter of Section 5.1 at 40 kW power level
x = Ax + Buu + Bww
y = Cyx + Dyuu
z = Czx + Dzuu (5.11)
where the state x, input u, disturbance w, measurement y, and performance variable z, are
x =[
pO2 pN2 ωcp psm Inet vbus
]T
w = Gload
u =[
vcm d]T
y =[
W refcp − Wcp vm
bus
]T
z =[
λO2 vbus
]T
. (5.12)
The units are pressure in bar, rotational speed in kRPM, mass flow rate in g/sec, voltage in V, and
current in A. Note here that the static feedforward control from Inet measurement to the compressor
control from Section 3.4 is included into the plant model above.
To eliminate steady-state error, integrators on the two measurements, W refcp −Wcp and vm
bus, are
added to the controller. And it is assumed that two outputs can be directly and instantaneously
measured. The state equations of the integrators are
d
dt
[
q1
q2
]
=
[
W refcp − Wcp
vmbus
]
(5.13)
where W refcp from Equation (3.7). The augmented plant, which combines the original states, x, and
the integrator, q, is represented by
xa =
[
x
q
]
=
[
A 0
Cy 0
] [
x
q
]
+
[
Bu
Dyu
]
u +
[
Bw
0
]
w = Aaxa + Buau + Bwaw. (5.14)
The optimal control law uses a state feedback with integral control
u =
[
vcm
d
]
= −KLQR
pO2
...
vbus
− KI,LQR
[
q1
q2
]
. (5.15)
The sixteen unknowns elements of the controller gain KLQR and KI,LQR are derived based on the

5.2 Coordination of the DC/DC converter with the fuel cell 61
minimization of a quadratic cost function
J =
∫∞
0
zT Qzz + uT Ru + qT QIq dt
=
∫∞
0
xTa
[
CTz QzCz 0
0 QI
]
xa + uT Ru dt =
∫∞
0
xTa Qxa + uT Ru dt (5.16)
that explicitly depends on the performance variables λO2
and vbus through the weights Qz, QI
and R. The actuator cost is added to the cost function through the weight R to prevent excessive
actuator inputs, which is especially useful for the air compressor controller. Different coefficient in
Qs and R can be applied in J for tuning the optimal control law (5.15), so that the control gain is
[
KLQR KI,LQP
]
= R−1BTa P (5.17)
where P is the solution to the Algebraic Riccati Equation (ARE)
PAa + ATa P + Q − PBaR−1BT
a P = 0 (5.18)
which can be solved using MATLAB.
The linear simulation result of the coordinated controller is shown in Figure 5.11. The detuned
decentralized controller (DEC2) is also shown with dash-dot line for comparison. Same step re-
sistance change input is applied intending to increase output power from 40 kW to 45 kW. The
centralized controller CEN is tuned to match the vbus settling of the detuned, decentralized con-
troller DEC2, but performs considerably better than the decentralized controller in regulating λO2
.
The relatively slow recovery of λO2
from CEN controller is a drawback, but λO2
excursion is reduced
significantly. The voltage recovery of the centralized controller CEN1 ensures 5 kW power increase
in 0.4 seconds same as the decentralized controller. The control strategy based on LQR design can
be observed with the response the duty cycle d in the solid line. The duty cycle initially drops to
protect the FC while waiting for the air supply to increase. When the compressor ramps up then d
increases rapidly to recover the output voltage vbus.
The responses shown in this section is based on the assumption that all system states x are
known. In practice, a state estimator (or observer) is needed to estimate the system state x from
available measurements y. The design of a state observer is presented in the following section.
5.2.3 Observer design
The estimate of the state x, used in the calculation of the control input (Equation (5.15)) is deter-
mined by a state observer based on Kalman filter design. Besides the measurements for integrator
states, which are y1 = Wcp and y2 = vbus, the FC system and the DC/DC converter has available
measurements such as y3 = Ist, y4 = vst and y5 = Inet. Also supply manifold pressure y6 = psm is

62 DC/DC converters for fuel cell system
0 0.2 0.4 0.6 0.8 13.4
3.6
3.8
4
4.2
Rlo
ad
0 0.2 0.4 0.6 0.8 10.36
0.38
0.4
0.42
0.44
0.46
d 1
Time (sec)
(a) DC/DC converter inputs
0 0.2 0.4 0.6 0.8 1370
380
390
400
410
v bus
DEC 2CEN
0 0.2 0.4 0.6 0.8 1170
180
190
200
I net
Time (sec)
(b) DC/DC converter outputs
0 0.2 0.4 0.6 0.8 1160
170
180
190
v cm
Time (sec)
Inet
(c) Fuel cell system input
0 0.2 0.4 0.6 0.8 11.7
1.8
1.9
2
2.1
λ O2
0 0.2 0.4 0.6 0.8 1190
200
210
220
230
I st
Time (sec)
(d) Fuel cell system outputs
Figure 5.11: Simulation results of the linear fuel cell power system model - centralized control

5.2 Coordination of the DC/DC converter with the fuel cell 63
0 0.2 0.4 0.6 0.8 1−0.4
−0.2
0
0.2
0.4
0.6
0.8
1
1.2
Time (sec)
Est
imat
or e
rror
(%
)
x1x2x3x4x5x6
Figure 5.12: Observer state error
measured. The observer state equations are
˙x = Ax + Buu + Bww + L(y − y)
y = Cyx + Dyuu (5.19)
Based on the Linear Quadratic Gaussian method, the optimal gain L is
L = SCTy W−1
y (5.20)
where S is the solution to dual of the ARE
SAT + AS + Vx + SCTy W−1
y CyS = 0. (5.21)
The positive definite matrices, Vx and Wy, represent the intensities of process and measurement
noises, respectively. The weight matrices chosen are
Vx = diag[
1 1 1 1 1 1]
+ αBuBTu
Wy = 1 × 10⁻³diag[
1 1 1 1 1 1]
. (5.22)
The Vx is in the form used in the feedback loop recovery procedure [14]. Using this procedure,
the full state feedback loop gain properties can be recovered by increasing the value of α. The value
of α chosen in this design is 1× 10⁻¹. Figure 5.12 shows the response of observer error based on the
measurements in linear simulation. The initial errors of all states are set at 1% of deviation from
nominal points.
The nonlinear simulation of the system with output observer feedback is shown in Figure 5.13.
A step change in resistance input is applied intending to increase the output power from 40 kW to
47.5 kW. The bus voltage recovery and λO2
excursion of the output-based CEN matches with the

64 DC/DC converters for fuel cell system
2.8 3 3.2 3.4 3.6 3.8 41.6
1.7
1.8
1.9
2
2.1
2.2
λ O2
Time (sec)
(a) Oxygen excess ratio
2.8 3 3.2 3.4 3.6 3.8 4360
370
380
390
400
410
420
v out (
V)
Time (sec)
CENDEC 2
(b) Output voltage
Figure 5.13: Simulation results of the nonlinear fuel cell system model - observer based control
performance achieved with DEC2, with minor improvement in λO2
excursion. The oxygen excess
ratio shows less deviation with CEN, but the penalty comes with the bigger output voltage drop.
Based on the nonlinear simulations and baring in mind that there will be a small mismatch
between the model used to design the centralized controller and the plant, we conclude the following.
The coordination between the air supply compressor and the DC/DC converter controllers cannot
outperform a well tuned decentralized controller, especially, when the tuning of the DC/DC converter
controller is based on the understanding the FC stack system limitations. This understanding can
be established by the methodology of Chapter 3, applied to a FC model of Chapter 2.
The optimal control tuning based on the quadratic cost function in (5.16) manages the oxygen
excess ratio from the communication and coordination in the system. However, the consequence
of the increase in the bus voltage drop in Figure 5.11 raises questions associated with the power
quality. The performance of the controller needs be evaluated with the load profiles for the specific
applications, and the vehicle propulsion loads will be applied to compare the performance of the
decentralized and multivariable controllers in Chapter 6.

Chapter 6
Control of FC hybrid electric
vehicle
This chapter presents details of the electric configuration and control in the fuel cell hybrid system,
performing system analysis with transient response characteristics. First, the control methodology
for FC air supply and DC/DC converter in Chapter 5 is extended to the FC hybrid vehicle con-
figuration in Figure 1.2(a). Hybridization in FC system with added battery offers more degrees of
freedom on the system performances, which depends on the controller architecture and strategy. As
a result, it is expected that battery added to support the voltage bus will relieve the major conflict
between regulating λO2
and vbus shown in Chapter 5. On the other case, added battery will affect
the performance of the fuel cell along with the bidirectional DC/DC converter in the configuration
of Figure 1.2(b). In both cases, control of the (unidirectional or bidirectional) DC/DC converter
manages the power split between the FC and the battery in hybrid configurations.
In this chapter, the FC hybrid models comprising of the fuel cell, the DC/DC converter and
the battery are developed. Complete forward-facing, causal models for a fuel cell hybrid vehicle are
designed for component evaluation and detailed control simulation. The performance is evaluated
for each component and system in dynamic simulation of the forward-facing model. Interactions
among the driver command, vehicle dynamics, traction motor load, DC/DC converters, battery and
fuel cells are highlighted. The baseline performance with decentralized controller is established and
multivariable control design also is applied and compared as is in Chapter 5, assessing the effects of
control calibrations.
Specifically, the air-supply sub-system and its dynamic control is implemented and evaluated
during simulation analysis. The model captures the dynamic effect of the air supply compressor,
which results in major power losses in a direct hydrogen fuel cell system. The different control
strategy and tuning for the DC/DC converter is considered to achieve the power split and fuel cell
protection. To focus on the modeling and control of FC hybrid power system, a battery model,
which can capture the dynamic behavior between voltage-current relations, is used.
65

66 Control of FC hybrid electric vehicle
Vehicle
Dynamics
MCU/
Motor
DC/DC
Converter
Fuel Cell
System
Battery
Driver
Command
-
Control
Signals
-PI
Driving Cycle
︷ ︸︸ ︷
dvcm
Ibt
vbus
Tmvst ωm
speed
Iload
Idc
Inet
Σ
Σ
Figure 6.1: FC HEV powertrain causality flowchart (a)
In this work, regenerative braking is not included to concentrate on the interaction between the
FC, battery and the load. The model for regenerative braking can be added to charge the battery
by the current from the motor after isolating the fuel cell. The electric architectures considered in
this work is also applicable to auxiliary power unit (APU), which usually has no energy recovery
devices, by replacing the vehicle propulsion load with other electric loads. Cold start and shut-down
are not considered in this work.
6.1 Fuel cell hybrid vehicle models
The fuel cell hybrid vehicle models in this chapter include not only the forward-facing vehicle and
traction motor model but also complete causal models for the fuel cell system in Chapter 2 and 3,
the DC/DC converter in Chapter 5 and the battery.
Figure 6.1 depicts the causal flow chart of a fuel cell hybrid vehicle model in the electric archi-
tecture of Figure 1.2(a). The fuel cell system model in this work captures dynamic performance
in power including effects of parasitic losses. As can be seen in the block diagram of the fuel cell
system, the disturbance input to the fuel cell system is the net current Inet and the performance
output is the stack voltage vst. The model also predicts oxygen starvation from the dynamics of its
air supply system. In the causality flowchart, the fuel cell system model includes air supply system
with flow and electric coupling from the input command of air compressor motor, which is developed
in Chapter 2 and 3. The compressor command input vcm is controlled to prevent oxygen starvation
during the vehicle operation.
The DC/DC converter maintains the bus voltage that supplies power to the inverter/motor and
auxiliaries, and the battery matches additional power for the load or captures the remaining power
from the fuel cell. The dynamic model of DC/DC converter developed in Section 5.1.1 is applied, so
that the DC/DC converter connects the fuel cell system with the battery and the vehicle propulsion
load with the duty cycle input d. The disturbance inputs of the DC/DC converter model are the

6.1 Fuel cell hybrid vehicle models 67
Vehicle
Dynamics
MCU/
Motor
Bidirect.
DC/DC
Converter
Driver
Command
-
Control
Signal
-PI
Driving Cycle
Fuel Cell
System
Battery
Control
Signal
d
vcm
Ibt
vbus
Tm
vst
vbt ωm
speed
Iload
Idc
Inet
Σ
Σ
Figure 6.2: FC HEV powertrain causality flowchart (b)
fuel cell stack voltage vst and the DC/DC output load current Idc. The outputs of the DC/DC
converter model are the fuel cell net current Inet and the bus voltage vbus. The load current to the
DC/DC converter, Idc is defined from the traction load current Iload and the battery current Ibt, or
Idc = Iload − Ibat. Thus the traction power is drawn from the fuel cell and the battery. Here the
battery is modeled with the voltage input vbus and the current output Ibt.
Figure 6.2 depicts another causal flowchart of the fuel cell hybrid vehicle model in the electric
architecture Figure 1.2(b). In this case, the DC bus line is directly linked with fuel cells, leading to
varying bus voltage [32]. This configuration is realized in hardware with the bidirectional DC/DC
converter located between the battery and the load. Although the flow chart looks similar to the
one in Figure 6.1, the major difference is that the positions of fuel cell system and battery, which
are switched with each other. The inputs and outputs of the FC and battery are also switched, such
that now input of the fuel cell system is the stack voltage vst instead of Inet. The control of the
bidirectional DC/DC converter manages battery current Ibt, and thus the voltage of the fuel cell
stack is controlled. In the two causal flowcharts, the motor, motor control unit (MCU) and vehicle
parts are commonly used.
6.1.1 Motor, motor control unit and vehicle model
In an FC electric hybrid drive train, the driver control command directly manipulates the torque/power
of the traction motor. In actual vehicle, the driver command is interpreted as a variable fre-
quency/amplitute command through the DC/AC inverter and AC machine. In this work, inverter,
motor and control unit are modeled as a DC motor with the driver torque demand, the speed of the
motor ωm and the DC-bus voltage vbus as inputs and the load current Iload as output. The values
of the traction motor parameters are shown in Table 6.1.
The motor torque Tm generated following the driver command forms the traction force of the

68 Control of FC hybrid electric vehicle
Table 6.1: Traction motor parametersVariable Value
Traction motor constant 0.15 V/(rad/sec)Traction motor constant 0.15 N-m/A
Resistance 0.002 Ω
Table 6.2: Baseline vehicle characteristicsVariable Value
Total vehicle mass 1591 kgAerodynamic drag coefficient 0.312
Frontal area 2.06 m2
Rolling resistance coefficient 0.02Radius of wheel 0.3 mAccessory load 500 W
vehicle. The vehicle speed is the output of first order vehicle dynamics associated with its mass
and other parameters through the traction force. In driving cycle simulation, the driver command
is the output from a proportional-integral (PI) controller that is designed to track the speed of a
given cycle. For this study, the fuel cell hybrid vehicle characteristics are assumed to be based on a
compact sedan. The values of the parameters for the vehicle model are shown in Table 6.2.
6.1.2 Battery model
The battery current is determined by an internal resistance model
vbt = vo − RintIbt. (6.1)
The battery open circuit voltage vo and the internal resistance Rint are static functions of the battery
state of charge (SOC) as shown in Figure 6.3 (a) and temperature T . The internal resistance of the
battery also changes with sign of the current, or charging/discharging as shown in Figure 6.3 (b).
Assuming the battery is placed in parallel with the DC/DC converter, as shown in Figure 6.1,
the terminal voltage of each battery module is determined by the DC/DC converter (vbt = vbus/31)
and the battery current is then
Ibt =vo(SOC, T ) − vbt
Rint(SOC, sign(Ibt), T ). (6.2)
Table 6.3: Battery parametersVariable ValueCapacity 18 Ah
Charging efficiency 0.9Maximum allowable voltage 16.5 VMinimum allowable voltage 9.5 V

6.2 Control of FC hybrid power - part (a) 69
0 0.2 0.4 0.6 0.8 1
12
12.5
13
State of charge
Bat
tery
ope
n ci
rcui
t vol
tage
vo (
V)
(a) Battery open circuit voltage vo
0 0.2 0.4 0.6 0.8 10
0.05
0.1
0.15
0.2
0.25
State of charge
Inte
rnal
Res
ista
nce
Rin
t (Ω
)
dischargecharge
(b) Internal resistance Rint
vbt−- k
6Σ
+- 1
Rint
/vo 6
-−
kbt
s
Ibt -SOC
(c) Block diagram
Figure 6.3: Battery model
Here we assume that the battery temperature is maintained constant with an external cooling
circuit. The battery parameters are based on the Lead-Acid type battery in ADVISOR model [35]
and summarized in Table 6.2.
The SOC is calculated from the battery current and the capacity of the battery (1/kbt)
dSOC
dt=
kbtIbt Ibt ≥ 0
−ηbtkbtIbt Ibt < 0(6.3)
where ηbt is the battery charging efficiency. Figure 6.3 (c) shows the block diagram of the battery
model and the relationship between the battery parameters, Rint and vo, and the state of charge.
To ensure proper shut down and start-up power from the battery, the battery should remain half
charged. The SOC of each of the 31 battery modules is indeed maintained at 0.6 as shown later
by regulating the bus voltage at 400 V. Note that at SOC=0.6 a battery module has open circuit
voltage of 12.9 V (Figure 6.3 (a)), thus 31 modules at SOC=0.6 can be connected in parallel with
the 400 V bus.
6.2 Control of FC hybrid power - part (a)
We first consider decentralized control as in Chapter 5, combining the fuel cell with its compressor
and compressor controller and the DC/DC converter with its controller as another. Two different
control objectives, oxygen excess ratio regulation in the fuel cell and bus voltage (or battery SOC)
regulation in the DC/DC converter are pursued by two controllers.

70 Control of FC hybrid electric vehicle
The dynamic coupling between the voltages and currents among the fuel cell, battery and the
traction load is captured by a dynamic model of the DC/DC converter as shown in the electric
hybrid configuration of Figure 6.1. A DC/DC converter controller is then designed to boost and
regulate the voltage at the converter output. Good regulation of the voltage at the converter output
is typically achieved by large current drawn from the fuel cell and it is typically followed by small
currents drawn from the battery. The converter controller can be tuned to avoid causing abrupt
current draw from the fuel cell. In this work, various DC/DC converter controller gains result in
different levels of power split between the fuel cell and the battery. It is thus possible to assess the
effects of control calibrations on the power split, FC oxygen excess ratio, compressor behavior, and
vehicle efficiency.
In the last section, we introduce coordination between the DC/DC converter controller and the
FC controller, which follows the one in Chapter 5, into a combined system controller with optimal
gains that emulates an FC load-following power split scenario. The centralized control accounts for
the limitations in the fuel cell system and allows us to construct a controller for the smallest possible
power assist level without compromising the fuel cell operation. The results of fuel economy and
battery sizing with the dynamic model and control in this work provide insight on the necessary
hybridization of a fuel cell power system without employing cycle-dependent optimization.
6.2.1 Hybrid power management
The control objectives for fuel cell hybrid power train are as follows: (i) protect the fuel cell system
from abnormal load including transient (ii) maintain state of charge of the battery (iii) maintain the
DC-bus voltage vbus (iv) regulate the current (from both the fuel cell and battery) to the optimized
values if supervisory control demand exists. A control strategy for splitting power between the fuel
cell and the battery is implemented based on controlling the duty cycle of the DC/DC converter.
In our case, the fuel cell is augmented with the DC/DC boost converter, matching the voltage of
the DC-bus, vbus to the desired value vrefbus . By changing the duty cycle, the net current of the
fuel cell and the voltage of the battery which is equal to the bus voltage can be regulated, but not
independently from each other.
Dual loop control (voltage/current control) is applied for the DC/DC boost converter as shown
in Chapter 5 (see Figure 5.4). Both current of the fuel cell, Inet and voltage of the bus, vbus are
controlled by the feedback controller. Regulating vbus to a vrefbus is equivalent to regulating Ibt to zero
due to the integration achieved naturally through the battery state of charge (see Figure 6.3). The
regulation at zero battery current ensures that the battery serves as a power assist device without
an explicit supervisory controller.
If there is a pre-defined current command from the supervisory control or fuel cell system itself,
the current loop (inner loop), CI control can be used without the outer loop Cv. The demanded
current can be drawn from the fuel cell as fast as the control bandwidth of the inner loop allows.
The supervisory command may decide the fuel cell current for optimal efficiency in terms of energy
management or dynamic FC limitations such as oxygen starvation. Many FC manufacturers bundle

6.2 Control of FC hybrid power - part (a) 71
0 200 400 600 800 1000 12000
50
100
150
Spe
ed (
KP
H)
Time (second)
Figure 6.4: Vehicle speed on the FTP cycle
their FC with a fuel cell controller unit that broadcasts the maximum FC current that is safe to
draw from the FC. This signal can then be used with the inner loop controller CI , eliminating the
Cv controller. Nonlinear logic such as a slew rate limiter, saturation or filter can be added to shape
the current demanded from the fuel cell stack. However, current control can lead to conservative
operation of the fuel cell or excessive battery use. Due to the complexity and uncertainty in the
fuel cell system, control of battery current has lower priority most times. Thus it is necessary to
implement high fidelity logic that can handle the fuel cell and battery performance with extensive
optimization.
The outer loop through the selection of Cv gains mainly handles the bus voltage regulation if
there exists no supervisory control command. We define the DC/DC converter loop time constant
τdc as the time needed to regulate vbus within 63 % of vrefbus after a load disturbance Idc. This
time constant also defines how fast Inet is drawn from the FC and should be tuned to match the
dynamic performance of the fuel cell system. The Cv calibration allows us to modify the fuel cell
current request based on its impact on oxygen starvation or other dynamic limitations. The dual loop
controller in (5.4) shows that the dual loop can manage the fuel cell system and battery performance
in hybrid power and achieve different power split levels depending directly on the controller Cv gains
and the achieved closed loop time constant τdc.
6.2.2 Effects of control strategy on fuel efficiency and hybridization level
The simulation results from the causal model for the fuel cell hybrid powertrain show the impact of
different sub-system control designs on the hybrid design. Two different control calibration emulating
load-following and load-leveling scenarios were designed to demonstrate the characteristic of the fuel
cell operation. Both control strategies use decentralized control to show the effect of controller
design on the performance of oxygen supply and power split. Simulation comparison is performed
first using the FTP (Federal Test Procedure) driving cycle, which emulates an urban route as shown
in Figure 6.4. Battery and FC sizes are fixed in the simulation analysis to concentrate on the effect
of the control strategy (effect of Cv calibration).
Figure 6.5 shows the simulation results for a portion of the FTP driving cycle with two different
power control calibrations. First a controller calibration, that results in a load-leveling FC hybrid,

72 Control of FC hybrid electric vehicle
150 200 250 3000
20
40
Veh
icle
Pow
er (
kW)
150 200 250 3000
20
40
FC
Net
Pow
er (
kW)
load−followingload−leveling
150 200 250 300−20
0
20
Bat
tery
Pow
er (
kW)
Time (second)
Figure 6.5: Power split in the FTP driving cycle with respect to control calibration
is considered which uses limited FC power and relies on transient power from the battery. The
power split is achieved by the DC/DC converter control in (5.4) with low bandwidth (τdc=2 s) in
the voltage loop. The other strategy shown is a load-following FC, which uses the FC power to the
maximum whenever needed. The control calibration was performed by changing the bandwidth of
the DC/DC converter response, i.e., fast response of the DC/DC converter for load-following FC
operation (τdc=0.6 s).
During cycle simulation, the operating characteristics of the FC hybrid vehicle depend on the
control calibration. Although both the load-leveling and load-following FC hybrid show limited FC
net power below 36 kW, maximum power from the battery differs from 17 kW (load-leveling) to
7.5 kW (load-following). As can be seen in Figure 6.5, battery power is mostly used as transient
power assist in load-leveling FC hybrid.
The changes in control calibration have limited effect on the fuel cell in the case of FTP driving
cycle (mild power demand), leading to FC usage up to current density of 0.43–0.53 A/cm2 as can be
seen in Figure 6.6 (a) and (b). Even though load-following operation of FC shows higher power use in
FC (0.53 A/cm2), the histogram distribution (in the bar graph) shows similar overall characteristics.
In both cases, the FC operates in the region of system efficiency over 45 %.
Simulation comparison is also performed on a portion of the US06 driving cycle which represents
driving with hard-acceleration and high power demands as shown in Figure 6.7. Figure 6.8 shows
the simulation comparison with two different power control calibrations during the portion of the
US06 cycle. During aggressive demands in propulsion power, the operating characteristics of the
FC depend on the control strategy. The load-leveling FC hybrid shows limited FC power up to
40 kW and uses battery power up to 30 kW. The load-following FC tuning uses FC power to satisfy
approximately the maximum transient vehicle power demand of 50 kW.
In both cases, accurate air-supply and power-assist ensure regulation of oxygen supply in safe

6.2 Control of FC hybrid power - part (a) 73
0 0.2 0.4 0.6 0.8 1Current Density (A/cm 2)
0
0.2
0.4
0.6
0.8
1
Cel
l Vol
tage
(V)
0
0.2
0.4
0.6
0.8
Sys
tem
Effi
cien
cy
(a) Load-leveling FC
0 0.2 0.4 0.6 0.8 1Current Density (A/cm 2)
0
0.2
0.4
0.6
0.8
1
Cel
l Vol
tage
(V)
0
0.2
0.4
0.6
0.8
Sys
tem
Effi
cien
cy
(b) Load-following FC
Figure 6.6: System efficiency (-x-), FC response (· · ·) and distribution (bar) for the FTP cycle
0 50 100 150 200 250 300 3500
50
100
150
Spe
ed (
KP
H)
Time (second)
Figure 6.7: Vehicle speed on a portion of the US06 cycle

74 Control of FC hybrid electric vehicle
0 50 100 150 200 250 300 3500
20
40
60
Veh
icle
Pow
er (
kW)
0 50 100 150 200 250 300 3500
20
40
60
FC
Net
Pow
er (
kW)
load−followingload−leveling
0 50 100 150 200 250 300 350−15
0
15
30
Bat
tery
Pow
er (
kW)
Time (second)
Figure 6.8: Power split in a portion of US06 driving cycle with respect to control calibration
regimes as can be seen in Figure 6.9 (a) and Figure 6.10 (a). The oxygen excess ratio λO2
is well
regulated around the desired setpoint (λrefO2
= 2) without large excursion, which could cause oxygen
starvation. The regulation is achieved despite the large currents drawn from the fuel cell, 0.7 A/cm2
and 1 A/cm2 for the load-leveling and load-following calibrations as shown in Figure 6.9 (b) and
Figure 6.10 (b). As the power demand of the traction motor changes, deficit power from fuel cell is
naturally covered by the battery for a short while. Battery current is not used when power from the
fuel cell follows the motor load. The changes in SOC of the load-leveling system are larger than that
of load-following system, but battery usage for power-assist is minimal in both cases as intended.
It is observed that the hydrogen fuel economy is almost invariant to the control tuning, being
66–67 MPGE (miles per gallon equivalent to the energy stored in one gallon of gasoline) on the
FTP cycle and 44 MPGE on the US06 cycle as can be seen in Figure 6.11. As it is shown in
Figures 6.6, 6.9 (b) and 6.10 (b), aggressive fuel cell use, which might lower the fuel cell efficiency
during a load-following FC calibration, is only effective for a short period. Thus the hydrogen fuel
consumption shows no difference overall with respect to control calibrations. However, the results
in battery usage ∆SOC (0.51 % in load-following vs. up to 5 % in load-leveling for US06) and
maximum power (15 vs. 30 kW) suggest that it is feasible to accommodate a smaller size battery,
saving weight and volume in load-following FC. Thus, FC transient power response and not efficiency
is the key consideration in sizing the battery in a hybrid FC vehicle.
As can be seen in λO2
and the battery current profile in Figure 6.10, minimizing battery power
with load-following calibration is followed by larger deviation in oxygen excess ratio than that with
load-leveling calibration. High bandwidth in regulating vbus to vrefbus results in abrupt Inet variation
and thus drop in λO2 . It is more clear in Figure 6.12 that there is a tradeoff between the two
performance variables, namely, the battery SOC and oxygen excess ratio. The oxygen excess ratio
regulation degrades when the SOC variations are reduced. Therefore, decision in controller tuning

6.2 Control of FC hybrid power - part (a) 75
0 50 100 150 200 250 300 3500
100
200
300
Sta
ck C
urre
nt (
A)
0 50 100 150 200 250 300 3501
2
3
λ O2
0 50 100 150 200 250 300 350−40
0
40
80
Bat
tery
Cur
rent
(A
)
0 50 100 150 200 250 300 3500.55
0.6
0.65
SO
C
Time (second)
(a) FC current, oxygen excess ratio, battery current and SOC
0 0.2 0.4 0.6 0.8 1Current Density (A/cm 2)
0
0.2
0.4
0.6
0.8
1
Cel
l Vol
tage
(V)
0
0.2
0.4
0.6
0.8
Sys
tem
Effi
cien
cy
(b) System efficiency (-x-), FC response (· · ·) and distribution(bar)
Figure 6.9: Fuel cell and battery operating characteristics of hybrid vehicles for a portion of theUS06 cycle - load-leveling FC

76 Control of FC hybrid electric vehicle
0 50 100 150 200 250 300 3500
100
200
300
Sta
ck C
urre
nt (
A)
0 50 100 150 200 250 300 3501
2
3
λ O2
0 50 100 150 200 250 300 350−40
0
40
80
Bat
tery
Cur
rent
(A
)
0 50 100 150 200 250 300 3500.55
0.6
0.65
SO
C
Time (second)
(a) FC current, oxygen excess ratio, battery current and SOC
0 0.2 0.4 0.6 0.8 1Current Density (A/cm 2)
0
0.2
0.4
0.6
0.8
1
Cel
l Vol
tage
(V)
0
0.2
0.4
0.6
0.8
Sys
tem
Effi
cien
cy
(b) System efficiency (-x-), FC response (· · ·) and distribution(bar)
Figure 6.10: Fuel cell and battery operating characteristics of hybrid vehicles for a portion of theUS06 cycle - load-following FC

6.2 Control of FC hybrid power - part (a) 77
0.5 1 1.5 2 2.5 3 3.5 4 4.5 50
2
4
6
8
10
Time constant of the DC/DC converter τDC
(second)
∆ S
OC
(%
)
30
35
40
45
50
55
60
65
70
Fue
l Eco
nom
y (M
PG
E)
FTPUS06
Fuel Economy
∆ SOC
Figure 6.11: Battery usage and fuel economy with respect to controller calibration and the cycle
0 0.05 0.1 0.15 0.20
2
4
6
8
10
Maximum excursion from λO
2
ref
∆ S
OC
(%
)
FTPUS06
τdc
τdc
Figure 6.12: Battery usage and oxygen excess ratio with respect to controller calibration and thecycle

78 Control of FC hybrid electric vehicle
0 20 40 60 80 1000.5
1
1.5
2
2.5
3
3.5
4
Pre
ssur
e ra
tio
Mass flow rate (g/sec)
Compressor map
Figure 6.13: Compressor transient response(blue line) on static compressor map(x) with load-following FC power
and battery sizing should be done under the specification for maximum allowable oxygen excess
ratio deviation.
In the controller tuning, actuator limits should be also be taken into account. Specifically, in
a high-pressure FC system with an air supply compressor, the dynamic behavior of the compres-
sor imposes additional limitations through its surge and choke characteristics. Surge causes large
variations in flow and choke is an upper limit to the compressor air flow. In a fuel cell system
there is a potential for both compressor surge and choke during an abrupt decrease and increase,
respectively, in the applied compressor voltage command vcm. Figure 6.13 shows the compressor
transient response with load-following FC on a portion of the US06 cycle. As can be seen in the
Figure 6.13, the transient responses are mostly within the region of safe compressor operation, not
falling into the surge region (left solid line) or choke region (right solid line). A more sophisticated
control for surge prevention by manipulating current load can be found in [68].
Another significant compressor consideration arises from its parasitic loss and its effects on the
FC system efficiency at low loads. Lowering the minimum air flow rate in the compressor helps in
achieving high efficiency in low power ranges [59]. The minimum air flow rate in the compressor
can be as low as 5 g/s (the air flow at the maximum power is 95 g/s) with the controller described
in this work. Also note here that the fuel cell model in this work is not turned off anytime during
simulation because 500 W of accessary load is always applied independently of the vehicle speed. The
simulation result shows that the FC efficiency is always over 40 % mainly because of low minimum
air flow rate explained above (see all histograms of driving cycle simulations).
6.2.3 Centralized control
In fuel cell hybrid power systems, the performance variables, oxygen excess ratio and battery SOC,
are defined through the interaction between the fuel cell system and DC/DC converter. Controller

6.2 Control of FC hybrid power - part (a) 79
Fuel Cell
System
DC/DC &
Battery
Measurement
FC
Controller
DC/DC
Controller
State
Estimator
λO2
vcm
dΣ
Σ
Iload
Ibt
Ist
...
vst
Inet
Figure 6.14: Centralized control architecture in fuel cell hybrid power
bandwidth of the DC/DC converter mainly determines SOC by vbus regulation and λO2
through
controlling current from the FC, Inet. Another control design that takes into account directly the
tradeoff between small excursions in λO2
and SOC is called multivariable control and it results in a
centralized controller as shown in Figure 6.14.
We apply a model-based linear quadratic regulator approach for the whole FC-DC/DC-battery
hybrid system, which is similar to the approach in Chapter 5. This coordinated control preserves
the control authority on oxygen regulation and power distribution in the same way as decentralized
control, and in addition introduces interaction between the FC and the converter controllers. The
resulting optimal control produces additional command to d through the estimated deviation in λO2
.
Moreover, the vcm command is now shaped through its effects to current drawn from the battery
Ibt.
A linear model is reformulated for FC-battery hybrid system from the previous section. Again,
the operating point is set at λO2 = 2, and vbus = 400 V when fuel cell stack provides Pnet = 40 kW.
The linearized plant is denoted by
x = Ax + Buu + Bww
y = Cyx + Dyuu
z = Czx + Dzuu (6.4)
where the state x, input u, disturbance w, measurement y, and performance variable z, are
x =[
pO2 pN2 ωcp psm Inet vbus
]T
w = Iload
u =[
vcm d]T
y =[
W refcp − Wcp Im
bt
]T

80 Control of FC hybrid electric vehicle
z =[
λO2 Ibt
]T
(6.5)
To eliminate steady-state error, the integrators on the two measurements, W refcp −Wcp and Im
bat,
are added to the controller. The state equations of the integrators are
d
dt
[
q1
q2
]
=
[
W refcp − Wcp
Imbt
]
(6.6)
where W refcp from Equation (3.7). The LQR control law is determined to minimize the cost function,
which is similar to the one in Section 5.2.2.
Note here that the centralized controller penalizes deviations of the battery current Ibt instead of
vbus in order to minimize the use of the battery. As can be seen from the decentralized load-following
FC hybrid scheme (in Figure 6.10), reduced Ibt helps minimizing SOC indirectly. The information
that is required for the centralized controller is collected by the state estimator designed from the
various existing measurements, namely, the stack current Ist, the stack voltage vst and the supply
manifold pressure psm similar to the scheme in Chapter 5.
This communication and coordination help obtain accurate control in air delivery and improve
transient FC performance. Communication between the FC controller and DC/DC controller yield
optimized performance in coordinated control, resulting in reduced battery usage. Figure 6.15 shows
the simulation result of the centralized control for the portion of the US06 cycle. As can be seen in
the figure, the maximum current from the battery is limited to 30 A or 12 kW power, compared with
the 15 kW maximum power obtained from the load-following decentralized control in Figure 6.10.
The variation in SOC is 0.39 %, which is lower than the 0.51 % achieved through the load-following
decentralized control in Figure 6.11.
6.3 Control of FC hybrid power - part (b)
In previous section, it is shown that model-based control calibration in FC hybrid power system
determines the power split and the hybridization level. Given the analysis results, applying small-
sized battery or batteries, instead of 31 series of batteries, will reduce the vehicle volume and weight
since the changes in hybridization level has no effects on overall system efficiency. However, the
electric configuration used in previous section constrains us to use large-sized battery because a
large series of batteries needs to support high voltage DC bus.
The electric configuration in Figure 1.2(b) allows us to use separate voltages in the stack and
the battery, thus enables to accommodate smaller battery (see also Figure 6.2). Reducing weight of
the battery and power electronic devices will improve even better efficiency unless it compromises
on performance [58]. In this section, the performance analysis and evaluation is performed with
control design and battery sizing. To compare the performances directly with the previous results,
the vehicle mass is not changed even with small-sized battery.

6.3 Control of FC hybrid power - part (b) 81
0 50 100 150 200 250 300 3500
100
200
300
Sta
ck C
urre
nt (
A)
0 50 100 150 200 250 300 3501
2
3
λ O2
0 50 100 150 200 250 300 350−40
0
40
80
Bat
tery
Cur
rent
(A
)
0 50 100 150 200 250 300 3500.55
0.6
0.65
SO
C
Time (second)
Figure 6.15: Fuel cell and battery operating characteristics of hybrid vehicles for a portion of theUS06 cycle - centralized control
6.3.1 Hybrid power management
Here we apply decentralized control with the fuel cell control design in Chapter 3 and the bidirectional
DC/DC converter control in Chapter 5. As shown in the flowchart of Figure 6.2, the fuel cell model
uses the stack voltage as the input in this case. Although the stack voltage is the input of the fuel
cell system model instead of the fuel cell current, the air supply dynamics of the fuel cell system has
not changed as can be seen from the experimental results in Chapter 4. The same air supply control
in Equation (3.32) is applied with net load current and the compressor air flow rate measurements,
which is shown in Chapter 3.
The control design in the bidirectional DC/DC converter follows the same procedures as in
Section 6.2, except that the bidirectional DC/DC converter protect the FC from severe voltage
load variations, instead of the current load changes. The stack voltage load can vary following the
changes in traction load as shown in Figure 5.7, which could result in oxygen starvation. Therefore
the control objective of the bidirectional DC/DC converter in the electric configuration of Figure 6.2
is as follows: (i) protect the fuel cell system from large changes in (voltage) load (ii) protect the
battery from large current draw. These objective can be captured in a quadratic cost function
J =
∫∞
0
[
Ibt vst
]
Q
[
Ibt
vst
]
+ uT Ru + qT QIq dt. (6.7)
where the integrator q corresponds to the battery state of charge, dq/dt = Ibt, and the optimal state

82 Control of FC hybrid electric vehicle
feedback control is given in Section 5.1.4
d(s) = −KPIIbt(s) − KPvvst(s) −KII
sIbt(s). (6.8)
In the quadratic cost function both vst and Ibt are penalized. The weight on the stack voltage vst
penalizes the variation of the fuel cell load. An increase in the weight Q(2, 2) results in a controller
that allows less fuel cell load variations, which consequently causes higher battery currents in order
to follow the vehicle traction load. The weights on the battery current and the integrator affect
the regulation performance on battery current and state of charge. Increases on these weights will
results less battery assist in hybrid mode and might cause violation in maximum fuel cell current
limit or oxygen starvation.
6.3.2 Battery sizing
With the electric architecture of fuel cell hybrid with bidirectional DC/DC converter, the battery
size (or number of battery modules) can vary unlike the case in Section 6.2. Finding minimum
number of batteries will minimize the vehicle weight, and thus maximize the hydrogen fuel econ-
omy if the overall system efficiency is conserved. The optimal battery size in FC hybrid has been
determined using dynamic programming [64]. The dynamic programming technique can also define
the power split with constraints on fuel cells and battery performance. The optimization results is,
however, dependent to the specific cycle and the implementation on real-time, causal controller is
not straightforward.
Here we design a bidirectional DC/DC converter controller to split power between the FC and
battery first. Then the number of batteries that satisfies the FC and battery constraints is determined
with driving cycle simulation comparison. Since the nominal battery voltage is 24 V, the battery
pack is designed with series of two batteries and several parallel connections. Tradeoff between the
fuel cell and the battery performance is now realized as constraints in the current and voltage of both
the FC and battery. The control gain tuning of the bidirectional DC/DC converter is performed
in favor of the fuel cell performance on oxygen starvation and maximum current. To minimize the
size (or number) of the batteries, the fuel cell load needs be operated as the load-following hybrid.
After several simulation trial to find the same fuel cell dynamics with the load-following hybrid in
Section 6.2, the LQR weight matrix are chosen as Q = diag[
5 750]
, QI = 0.01 and R = 1×10⁶
for Equation (6.7). As can be seen in the weight matrix, the weights on Ibt and the integrator are
much smaller than the one used for vst. This combination of weights produces a controller that
protects the fuel cell from oxygen starvation at the cost of larger battery usages.
Simulation analysis is performed with different number of battery modules. Table 6.4 shows
the battery usage with different number of batteries in two driving cycles. The constraints on
battery voltage are shown in Table 6.3. The battery model used here is the same with the one in
Section 6.1.2. For the US06 driving cycle, the battery voltage exceed the maximum allowable in
the case with 8 batteries. Exceeding the maximum battery voltage will result in overcharging with

6.3 Control of FC hybrid power - part (b) 83
Table 6.4: Battery usage comparionMin. voltage Max. voltage
No. of batteries (≥ 9.5) (≤ 16.5)FTP US06 FTP US06
8 11.34 12.06 16.72 16.7210 11.61 12.21 16.11 16.0512 11.80 12.32 15.58 15.58
0 50 100 150 200 250 300 3500
20
40
60
Veh
icle
Pow
er (
kW)
0 50 100 150 200 250 300 3500
20
40
FC
Net
Pow
er (
kW)
0 50 100 150 200 250 300 350−10
0
10
Bat
tery
Pow
er (
kW)
Time (second)
Figure 6.16: Power split in a portion of US06 driving cycle
high current. When the number of batteries is 10, the changes in the battery voltage are within
the allowable range. As the number of batteries increases, the battery loads decrease with smaller
variation observed in the voltage. We choose 10 batteries for the following performance validation.
Simulation comparison is also performed to see the operating characteristics on the portion of
the US06 driving cycle as shown in Figure 6.7. Figure 6.16 shows the simulation result in power split
during the portion of the US06 cycle. As can be seen in the figure, fuel cell power almost follows
the vehicle traction load and the power-assist from the battery is minimal as intended. Battery
usage is actually smaller than the one observed at the load-following hybrid (9 kW versus 15 kW,
see Figure 6.8).
Figure 6.17 shows that the oxygen excess ratio λO2
is well regulated around the desired setpoint
(λrefO2
= 2) without large excursion, which could cause oxygen starvation. The λO2
regulation is
achieved despite the large stack voltage variations, which result in current densities up to 1 A/cm2
as shown in Figure 6.18. Overall operating characteristics of the fuel cell are similar as in the load-
following hybrid in Figure 6.10 or the centralized control in Figure 6.15. Since the number of batteries
is reduced to about one-third of the one with the load-following FC in Section 6.2, variations in the
battery SOC are larger than the ones observed in previous designs. Here the control strategy does
not regulate the battery SOC directly. However, the weights on Ibt and its integrator determines
the battery performance, and thus the SOC remains within safe ranges.

84 Control of FC hybrid electric vehicle
0 50 100 150 200 250 300 3500
100
200
300
Sta
ck C
urre
nt (
A)
0 50 100 150 200 250 300 3501
2
3
λ O2
0 50 100 150 200 250 300 350−400−200
0200400
Bat
tery
Cur
rent
(A
)
0 50 100 150 200 250 300 3500.55
0.6
0.65
SO
C
Time (second)
Figure 6.17: Fuel cell and battery operating characteristics of hybrid vehicles for a portion of US06cycle
0 0.2 0.4 0.6 0.8 1Current Density (A/cm 2)
0
0.2
0.4
0.6
0.8
1
Cel
l Vol
tage
(V)
0
0.2
0.4
0.6
0.8
Sys
tem
Effi
cien
cy
Figure 6.18: System efficiency (-x-), FC response (· · ·) and distribution(bar) for a portion of US06cycle

6.3 Control of FC hybrid power - part (b) 85
The hydrogen fuel economy on the FTP cycle is 65 MPGE and on the US06 cycle is 45 MPGE.
As expected, observed that the hydrogen fuel economy is same as the results in Section 6.2 because
the hybrid operation characteristic is similar to the load-following hybrid in Section 6.2. Note here
that the actual hydrogen fuel economy of the system with the smaller battery will be improved if
one considers the reduction in the vehicle weight due to the reduced battery and power electronics
weight.
In this chapter, we design decentralized and multivariable controllers regulating the bus voltage
and preventing fuel cell oxygen starvation using dynamic causal models for a direct-hydrogen fuel cell
and a DC/DC converter. Various controller gains are used to span the fuel cell operation from load-
following to load-leveling, and hence, determine the required fuel cell-battery sizing (hybridization
level) and the associated trends in the fuel economy. Two candidate electric architectures are
considered and the control strategies and tunings for these architectures are presented.
The proposed controllers directly manipulate actuator commands, such as the DC/DC converter
duty cycle, and achieve a desired power split. The controllers are demonstrated through simulation
of a compact sedan using a mild and an aggressive driving cycle. Our results provide insight on the
strategy and calibration of a fuel cell hybrid electric vehicle with no need for a supervisory controller
that typically depends on optimal power split during a specific driving cycle.


Chapter 7
Conclusions
Prompt response is essential in fuel cell power applications. Transient performance requirement is
sometimes more critical than efficiency, given the importance of accepting fast changing and unpre-
dictable electric loads. The fuel cell response is, however, limited by the complex dynamics associated
with mass and heat balances inside and outside the FC stack. To mitigate these limitations, a fuel cell
stack is typically combined with a battery through a DC/DC converter into a hybrid power system.
Hybridization may protect the fuel cell from harmful transitions that can cause oxygen starvation.
In addition, hybridization may lead to higher fuel cell efficiency, although the anticipated efficiency
improvements are not same as the ones observed in ICE hybrid systems. Hybridization, finally may
introduce unnecessary weight and complexity associated with the addition of batteries.
The dissertation addresses modeling, analysis and controller design of FC power combining a
fuel cell system, a DC/DC converter and a battery in various electric configurations. We design
controllers using linear quadratic optimization techniques and span the fuel cell operation from load-
following to load-leveling, and hence, determine the required fuel cell-battery sizing (hybridization
level) and the resulting trends in the system efficiency. The controller designed optimally manages
the air and the electron flow, balancing the slow power response of the fuel cell stack without
overestimating or underestimating its transient capabilities. Our optimal control scheme utilizes
minimal battery power, defining minimal hybridization needs in FC autonomous power systems.
The ultimate goal of this work is to contribute to the fuel cell technology in the areas of control
and coordination, specifically for hybrid power applications where many power sources are employed.
There is an intense interest right now about augmenting FCs in the power grid. Depending on the
connection (parallel, series, etc) the control methodology and the dynamic load capability change.
This work will also augment the recent research in power management of fuel cells for optimal fuel
economy in transportation applications. Given the emphasis on coordination issues and multidisci-
plinary aspects, this work will contribute to the core system technology used for design assessment of
the other future energy systems. Eventually our work on multivariable dynamic energy systems can
be augmented to address reliable distributed energy by defining requirements on the minimum com-
87

88 Conclusions
munication among the embedded controllers in distributed power sources and the need for energy
storage.
7.1 Air flow control in power-autonomous FCS
This dissertation fist focused on the question of the best transient performance (or limitations)
of the stand-alone fuel cell system as a power source before hybridization. To this end, a simple
but accurate, low-order FC system model is introduced to describe the necessary flow and electric
dynamics using a combination of physical principles and empirical relations. Model validation is
pursued through experiments on a 1.2 kW, 47 cell low pressure FC stack.
The coupling between the electric and flow paths in a compressor-driven fuel cell stack is clarified
for the first time. This coupling imposes control limitations with regard to NMP zeros in the
air flow control path affecting both performance and measurements. The control problem is then
formulated in the general control form, and the theory of fundamental limitations is used to clarify the
difficulties in avoiding oxygen starvation during load changes. Although the load changes are known
(measured) their effects cannot be completely attenuated because NMP zeros make the application of
cancellation controllers unfeasible. The design tradeoffs imposed by the Poisson integral associated
with the NMP zero are then summarized. Finally, a combined feedforward and feedback control is
designed to achieve adequate performance and illustrate the performance limitations in simulation.
7.2 Control design of FC hybrid power system
The second question addressed in this dissertation is the control calibration and associated efficiency
benefits of various hybrid fuel cell electric architectures. System integration and control issues are
also associated with various electric architectures with the fuel cell stack, DC/DC converter and
battery. To investigate the coupled dynamics associated with current and voltage in a fuel cell
power system, we include a DC/DC converter that transforms unregulated DC power from the FC
to regulated DC grid power. We have demonstrated performance tradeoff in achieving the stack and
grid objectives.
Despite many publications that debate on the size and efficiency of the DC/DC converter and
battery, dynamic performance and control design issues have not been addressed. In this work, we
show development of a low level controller that directly manipulates physical actuator inputs, and at
the same time, it offers calibration parameter for power optimization. Although these issues cannot
be all treated fully in a comprehensive way, our work is distinct in that we focus on the physical
connection and also control difficulties. We include the dynamic interaction of voltage, current, flow,
pressure arising from physical interconnection instead of managing power in higher level.
In this work we considered a compact sedan fuel cell electric hybrid with a compressor driven
75 kW proton exchange membrane fuel cell, a DC/DC converter and a battery, and assess the
effect of different control calibrations and strategies in the power split, the vehicle efficiency, the

7.3 Future Study 89
battery utilization and the FC oxygen starvation. A forward-facing (causal) model is used and the
assessment is performed for two different driving cycles with mild (FTP) and aggressive (US06)
accelerations.
The overall controller automates two processes. First, it adjusts the FC air flow through a
compressor motor command to minimize oxygen starvation periods. Second, it regulates the bus
voltage or the battery current through the duty cycle of the DC/DC converter. The FC compressor
controller is novel because its calibration balances the benefits from the instantaneous flow increase
and its drawbacks from the increase in the FC load (parasitic losses). Once the FC controller is tuned,
a DC/DC converter controller is designed to transform the unregulated FC voltage to regulated bus
voltage.
Different gains in the converter controller achieve different transient responses in the bus voltage
regulation. Fast voltage regulation corresponds to a load-following FC calibration with high FC
utilization and low battery utilization (50 kW in FC power versus 15 kW in battery power for
the aggressive cycle). Slow voltage regulation results in a load-leveling FC calibration that does
not exhibit any significant benefits when compared to the load-following calibration. The control
calibration has minimal effect on fuel economy primarily because typical driving cycles can be
accomplished by a well controlled FC with efficiencies up to 45 %. A smaller battery size (10 versus
31 packs) can reduce the vehicle weight and volume without adversely affecting the FC performance
(efficiency, oxygen excess ratio) or requiring operation close to the compressor surge and choke limits.
The control design in this work deals with actual current and voltage instead of power unlike
many other papers, respecting their causal relationship. Also the designed control system does not
require inner loop controllers that realize the power split command from a supervisory controller
since the designed controllers manipulate directly physical actuators setting in the FC stack system
and the DC/DC converter. Therefore applying and re-tuning our control methodology to various
hardware configurations can be done directly without cycle dependent optimization.
Although the analysis of FC hybrid power system is based on vehicle propulsion application, any
PEM FC hybrid system, such as auxiliary power unit or distributed power source, will benefit from
the control design and analysis we performed in this thesis.
7.3 Future Study
Fuel cell vehicle: The transient performances and control limitations in PEM FC system depend on
the air supply system as we have shown in this study. The air supply system also has an important
role in the overall system efficiency of the PEM fuel cell stack. The operating pressure is one of
the major factors in integrating the air supply system, including a compressor or blower, manifold,
channel and orifice design. Since vehicle propulsion applications impose strict requirements on the
size and weight, optimizing the overall FC system efficiency is highly dependent on both the air
supply system design and its control. The combined control and optimization will be the next step
in designing an air supply system for fuel cell vehicle.

90 Conclusions
In a fuel cell electric hybrid vehicle, the regenerative braking helps capture and reuse the energy
and also may result in fuel economy improvement. In this study, regenerative braking was not con-
sidered to generalize the problem for the FC hybrid power system for not only vehicular application
but also portable and stationary power. The FC hybrid power train model with regenerative braking
will show detailed results, including the effect of the regenerative braking over the fuel economy.
System coordination and communication: In an electric architecture of the fuel cell hybrid power
system, the communication issues arise with system coordination. The communication in centralized
control in this study may have advantages over the non-causal communication with such as power-
request and power-available signals. The power-request signal, which is mainly an interpretation of
driver power demand, and the power-available signal, which includes expected air supply into the
stack based on the request, are both predictive information that can differ from the real system. Thus
these signals may lead to inaccurate or conservative operation in fuel cell power. The communication
and coordination presented in this work have the capability of monitoring the state of the system
and manipulate physical actuators in real time.
The drawback of the coordinated, centralized control is the increase of computation for measure-
ment and state estimation. Although the centralized control achieves similar performance as the
results of to decentralized control, additional communication in centralized control will eventually
help improving the system robustness in the area of such as monitoring and fault detection. Thus
the centralized control in FC hybrid coordination needs to be extended to the communication study,
which defines minimal communication among the hybrid power components.

List of Symbols
R Universal gas constant 8.3145 J/(mol·K)
A Active area cm2
AT Opening area of the nozzle
C Capacitance, Controller F
CD Discharge coefficient of the nozzle
Cp Specific heat capacity of the air 1004 J/(mol·K)
d Duty cycle
F Faraday number 96,485
G Transfer function, Conductance 0
I Current A
i Current density A/cm2
J Inertia, Cost function kg·m2
k Flow constant, Motor constant kg/(s·Pa), V/(rad/sec), N-m/A
L Inductance, Observer gain H
M Molar mass kg/mol
m Mass, Multiplicity
n Number of cells
p Pressure Pa
R Resistance Ω
SOC State of charge
T Temperature, Torque K, N·m
u Control input
V Volume m3
v Voltage V
91

92 List of Symbols
W Mass flow rate
w Humidity ratio, Disturbance input
x Mass fraction, State
y Molar ratio, Measurement output
z Performance variable
Greek letters
η Efficiency
γ Ratio of the specific heat capacities of the air 1.4
λm Membrane water activity
λO2
Oxygen excess ratio
ω Rotational speed rad/sec
φ Relative humidity
τ Time constant
Subscripts
act Activation loss
an Anode
atm Atmospheric
bt Battery
ca Cathode
cm Compressor motor
conc Concentration loss
cp Compressor
D Derivative
dc DC/DC converter
fc Fuel cell
filter Filter
H2 Hydrogen
in Input
load Load
LQR Linear quadratic regulator
m Motor
max Maximum

List of Symbols 93
n Nominal
N2 Nitrogen
O2 Oxygen
ohm Ohmic loss
out Output
rct Reacted
sat Saturation
sm Supply manifold
st Stack
u Control input
v Vapor
w Disturbance input
y Measurement output
z Performance variable
Superscripts
fb Feedforward
ff Feedback
m Measurement
ref Reference


Bibliography
[1] J. C. Amphlett, R. M. Baumert, R. F. Mann, B. A. Peppley, P. R. Roberge, and A. Rodrigues,“Parametric modelling of the performance of a 5-kW proton-exchange membrane fuel cell stack,”Journal of Power Sources, vol. 49, pp. 349–356, 1994.
[2] J. C. Amphlett, E. H. de Oliviera, R. F. Mann, P. R. Roberge, A. Rodrigues, and J. P. Salvador,“Dynamic interaction of a proton exchange membrane fuel cell and a lead-acid battery,” Journal
of Power Sources, vol. 65, pp. 173–178, 1997.
[3] J. C. Amphlett, R. F. Mann, B. A. Peppley, P. R. Roberge, and A. Rodrigues, “A model pre-dicting transient responses of proton exchange membrane fuel cells,” Journal of Power Sources,vol. 61, pp. 183–188, 1996.
[4] M. Badami and C. Caldera, “Dynamic model of a load-following fuel cell vehicle: impact of theair system,” SAE paper 2002-01-0100, 2002.
[5] F. Barbir, “System design for stationary power generation,” in Fuel Cell Technology and Appli-
cation, ser. Handbook of Fuel Cells - Fundamantals, Technology and Applications, W. Vielsthch,H. A. Gasteiger, and A. Lamm, Eds. John Wiley and Sons, 2003, vol. 4.
[6] J. Benziger, E. Chia, E. Karnas, J. Moxley, C. Teuscher, and I. G. Kevrekidis, “The stirred tankreactor polymer electrolyte membrane fuel cell,” AIChE Journal, vol. 50, no. 8, pp. 1889–2000,Aug. 2004.
[7] G. Boehm, D. P. Wilkinson, S. Knights, R. Schamm, and N. J. Fletcher, “Method and appratusfor operating a fuel cell,” U.S. Patent 6 461 751, Oct. 8, 2002.
[8] D. D. Boettner, G. Paganelli, Y. G. Guezennec, G. Rizzoni, and M. J. Moran, “Proton exchangemembrane fuel cell system model for automotive vehicle simulation and control,” ASME Journal
of Energy Resources Technology, vol. 124, pp. 20–27, 2002.
[9] S. Caux, J. Lachaize, M. Fadel, P. Shott, and L. Nicod, “Modelling and control of a fuel cellsystem and storage elements in transport applications,” Journal of Process Control, vol. 15, pp.481–491, 2005.
[10] W. Choi, J. W. Howze, and R. Enjeti, “Development of an equivalent circuit model of a fuelcell to evaluate the effects of inverter ripple current,” Journal of Power Sources, In press.
[11] J. M. Cunningham, M. A. Hoffman, and D. J. Friedman, “A comparison of high-pressure andlow-pressure operation of PEM fuel cell systems,” SAE paper 2001-01-0538, 2001.
[12] J. M. Cunningham, M. A. Hoffman, R. M. Moore, and D. J. Friedman, “Requirements for aflexible and realistic air supply model for incorporation into a fuel cell vehicle (FCV) systemsimulation,” SAE paper 1999-01-2912, 1999.
95

96 Bibliography
[13] J. M. Cunningham, R. Moore, S. Ramaswamy, and K. Hauer, “A comparison of energy use fora direct-hydrogen hybrid versus a direct-hydrogen load-following fuel cell vehicle,” SAE paper2003-01-0416, 2003.
[14] J. C. Doyle and G. Stein, “Robustness with observers,” IEEE Transactions on Automatic
Control, vol. 24, no. 4, pp. 607–611, Aug. 1999.
[15] R. W. Erickson and D. Maksimovic, Fundamentals of Power Electronics, 2nd ed. Norwell,MA: Kluwer Academic Publishers, 2001.
[16] G. Escobar, R. Ortega, H. Sira-Ramırez, J.-P. Vilain, and I. Zein, “An experimental comparisonof several nonlinear controllers for power converters,” IEEE Control Systems Magazine, vol. 19,no. 1, pp. 66–82, 1999.
[17] Z. Filipi, L. Louca, A. G. Stefanopoulou, J. T. Pukrushpan, B. Kittirungsi, and H. Peng, “Fuelcell APU for silent watch and mild electrification of a medium tactical truck,” SAE paper2004-01-1477, 2004.
[18] G. R. Flohr, “Performance considerations of a bi-directional DC/DC converter for fuel cellpowered vehicles,” SAE paper 2002-01-1902, 2002.
[19] J. S. Freudenberg, C. V. Hollot, R. H. Middleton, and V. Toochinda, “Fundamental designlimitations of the general control configuration,” IEEE Transactions on Automatic Control,vol. 48, no. 8, pp. 1355–1370, Aug. 2003.
[20] J. S. Freudenberg and D. P. Looze, “Right half plane poles and zeros and design tradeoffs infeedback systems,” IEEE Transactions on Automatic Control, vol. 30, no. 6, pp. 555–565, June1985.
[21] D. J. Friedman, “Maximizing direct-hydrogen PEM fuel cell vehicle efficiency - is hybridizationnecessary?” SAE paper 1999-01-0530, 1999.
[22] M. H. Fronk, D. J. Wetter, D. A. Masten, and A. Bosco, “PEM fuel cell system solutions fortransportation,” SAE paper 2000-01-0373, 2000.
[23] S. Gelfi, A. G. Stefanopoulou, J. T. Pukrushpan, and H. Peng, “Dynamics of low-pressureand high-pressure fuel cell air supply systems,” in Proceedings of the 2003 American Control
Conference, vol. 3, Denver, CO, June 2003, pp. 2049–2054.
[24] General Motors Corporation. (2003) GM - GMability Advanced Technology: HydroGen3 takesa big step toward the production line. [Online]. Available: http://www.gm.com/company/gmability/adv tech/600 tt/650 future/hydrogen3 050103.html
[25] C. Gezgin, B. S. Heck, and R. M. Bass, “Control structure optimization of a boost converter: AnLQR approach,” in Proceedings of the IEEE Power Electronics Specialists Conference, vol. 2,St. Louis, MO, June 1997, pp. 901–907.
[26] G. C. Goodwin, M. E. Salgado, and J. I. Yuz, “Performance limitations for linear feedbacksystems in the presence of plant uncertainty,” IEEE Transactions on Automatic Control, vol. 48,no. 8, pp. 1312–1319, Aug. 2003.
[27] D. Grupp, M. Forrest, P. Mader, C. J. Brodrick, M. Miller, and H. Dwyer, “Development of aretrofit fuel cell auxiliary power unit for truck idle reduction,” SAE paper 2004-01-2629, 2004.
[28] W. B. Gu, C. Y. Wang, and B. Y. Liaw, “Numerical modeling of coupled electrochemical andtransport precesses in lead-acid batteries,” Journal of The Electrochemical Society, vol. 144,no. 6, pp. 2053–2061, 1997.

Bibliography 97
[29] Y. Guezennec, T.-Y. Choi, G. Paganelli, and G. Rizzoni, “Supervisory control of fuel cell vehiclesand its link to overall system efficiency and low-level control requirements,” in Proceedings of
the 2003 American Control Conference, vol. 3, Denver, CO, June 2003, pp. 2055–2061.
[30] L. Guzzella and A. Sciarretta, Vehicle Propulsion Systems: Introduction to Modeling and Op-
timization. Berlin: Springer-Verlag, 2005.
[31] J. B. Heywood, Internal Combustion Engine Fundamentals. New York: McGraw-Hill, 1988.
[32] T. H. Hunt and R. Spiteri, “Method and system for controlling power distribution in a hybridfuel cell vehicle,” U.S. Patent 6 792 341, Sept. 14, 2004.
[33] T. Ishikawa, S. Hamaguchi, T. Shimizu, T. Yano, S. Sasaki, K. Kato, M. Ando, and H. Yoshida,“Development of next generation fuel-cell hybrid system - consideration of high voltage system,”SAE paper 2004-01-1304, 2004.
[34] Z. Jiang, L. Gao, and R. A. Dougal, “Flexible multiobjective control of power converter in activehybrid fuel cell/battery power sources,” IEEE Transactions on Power Electronics, vol. 20, no. 1,pp. 244–253, 2005.
[35] V. H. Johnson, “Battery performance models in ADVISOR,” Journal of Power Sources, vol.110, pp. 321–329, 2002.
[36] P. B. Jones, J. B. Lakeman, G. O. Mepsted, and J. M. Moore, “A hybrid power source forpulsed power applications,” Journal of Power Sources, vol. 80, no. 1-2, pp. 242–247, 1999.
[37] J.-H. Jung, Y.-K. Lee, J.-H. Joo, and H.-G. Kim, “Power control strategy for fuel cell hybirdelectric vehicles,” SAE paper 2003-01-1136, 2003.
[38] A. Y. Karnik and J. Sun, “Modeling and control of an ejector based anode recirculation sys-tem for fuel cells,” in Proceedings of the 3rd International Conference on Fuel Cell Science,
Engineering, and Technology, Ypsilanti, MI, May 2005.
[39] M. Kim, H. Peng, C.-C. Lin, E. Stamos, and D. Tran, “Testing, modeling, and control of a fuelcell hybrid vehicle,” in Proceedings of 2005 American Control Conference, Portland, OR, June2005, pp. 3859–3864.
[40] S. D. Knights, K. M. Colbow, J. St-Pierre, and D. P. Wilkinson, “Aging mechanisms andlifetime of PEFC and DMFC,” Journal of Power Sources, vol. 127, pp. 127–134, 2004.
[41] P. T. Krein, Elements of Power Electronics. New York and Oxford: Oxford University Press,1998.
[42] J. Larminie and A. Dicks, Fuel Cell Systems Explained, 2nd ed. Chichester and Hoboken, NJ:John Wiley & Sons, 2003.
[43] C.-C. Lin, H. Peng, M. Kim, and J. W. Grizzle, “Integrated dynamic simulation model withsupervisory control strategy for a PEM fuel cell hybrid vehicle,” in Proceedings of the ASME
Dynamic Systems and Control Division, vol. 73, Anaheim, CA, Nov. 2004, pp. 275–286.
[44] C. Liu, T. Nergaard, L. Leslie, J. Ferrell, X. Huang, T. Shearer, J. Reichl, J. Lai, and J. Bates,“Power balance control and voltage conditioning for fuel cell converter with multiple sources,”in Proceedings of the IEEE Power Electronics Specialists Conference, June 2002, pp. 2001–2006.
[45] T. Markel, K. Wipke, and D. Nelson, “Vehicle system impacts of fuel cell system power responsecapability,” SAE paper 2002-01-1959, 2002.

98 Bibliography
[46] R. D. Merritt and J. D. Blair, “Constant voltage fuel cell with improved reactant supply andcontrol system,” U.S. Patent 5 366 821, Nov. 22, 1994.
[47] R. H. Middleton, “Trade-offs in linear control system design,” Automatica, vol. 27, no. 2, pp.281–292, Mar. 1991.
[48] Y. Motozono, M. Yamashita, M. Yamaoka, K. Nagamiya, and I. Maeda, “Fuel cell controlapparatus,” U.S. Patent 6 638 652, Oct. 28, 2003.
[49] W. E. Mufford and D. G. Strasky, “Power control system for a fuel cell powered vehicle,” U.S.Patent 5 991 670, Nov. 23, 1999.
[50] A. Ohkawa, “Electric power control system for a fuel cell vehicle employing electric douple-layercapacitor,” SAE paper 2004-01-1006, 2004.
[51] B. K. Powell and T. E. Pilluti, “A range extender hybrid electric vehicle dynamic model,” inProceedings of the 33rd IEEE Conference on Decision and Control, vol. 3, Buena Vista, FL,Dec. 1994, pp. 2736–2741.
[52] J. T. Pukrushpan, H. Peng, and A. G. Stefanopoulou, “Control-oriented modeling and analysisfor automotive fuel cell systems,” ASME Journal of Dynamic Systems, Measurement, and
Control, vol. 126, no. 1, pp. 14–25, 2004.
[53] J. T. Pukrushpan, A. G. Stefanopoulou, and H. Peng, “Control of fuel cell breathing,” IEEE
Control Systems Magazine, vol. 24, no. 2, pp. 30–46, Apr. 2004.
[54] ——, Control of Fuel Cell Power Systems: Principles, Modeling, Anylysis and Feedback Design,ser. Advances in Industrial Control. London: Springer-Verlag Telos, 2004.
[55] J. T. Pukrushpan, A. G. Stefanopoulou, S. Varigonda, L. M. Pedersen, S. Ghosh, and H. Peng,“Control of natural gas catalytic partial oxidation for hydrogen generation in fuel cell appli-cations,” IEEE Transactions on Control Systems Technology, vol. 13, no. 1, pp. 3–14, Jan.2005.
[56] L. Qui and E. J. Davidson, “Performance limitations of non-minimum phase systems in theservomechanism problem,” Automatica, vol. 29, no. 2, pp. 337–349, Mar. 1993.
[57] K. Rajashekara, “Propulsion system strategies for fuel cell vehicles,” SAE paper 2000-01-0369,2000.
[58] S. Ramaswamy, R. Moore, J. M. Cunningham, and K.-H. Hauer, “A comparison of energyuse for a indirect-hydrocarbon hybrid versus an indirect-hydrocarbon load-following fuel cellvehicle,” SAE paper 2004-01-1476, 2004.
[59] P. Rodatz, G. Paganelli, A. Sciarretta, and L. Guzzella, “Optimal power management of anexperimental fuel cell/supercapacitor-powered hybrid vehicle,” Control Engineering Practice,vol. 13, no. 1, pp. 41–53, Jan. 2005.
[60] P. Rodatz, G. Paganelli, and L. Guzzella, “Optimizing air supply control of a PEM fuel cellsystem,” in Proceedings of the 2003 American Control Conference, vol. 3, Denver, CO, June2003, pp. 2043–2048.
[61] J. St-Pierre, D. P. Wilkinson, S. Knights, and M. Bos, “Relationships between water man-agement, contamination and lifetime degradation in PEFC,” Journal of New materials for
Electrochemical Systems, vol. 3, pp. 99–106, 2000.
[62] K. Stanton and J.-S. Lai, “A thermally dependent fuel cell model for power electronics design,”in Proceedings of the IEEE Power Electronics Specialists Conference, June 2005, pp. 1647–1651.

Bibliography 99
[63] J. Sun and I. Kolmanovsky, “Load governor for fuel cell oxygen starvation protection: A robustnonlinear reference governor approach,” in Proceedings of the 2004 American Control Confer-
ence, vol. 1, Boston, MA, June 2004, pp. 828–833.
[64] O. Sundstrom and A. G. Stefanopoulou, “Optimal power split in fuel cell hybrid electric ve-hicle with different battery sizes, drive cycles, and objectives,” in IEEE Proceedings of 2006
International Conference on Control Applications, To be appeal.
[65] A. D. Swingler and W. G. Dunford, “Development of a bi-directional DC/DC convreter forinverter/charger applications with consideration paid to large signal operation and quasi-lineardigital control,” in Proceedings of the IEEE Power Electronics Specialists Conference, vol. 2,June 2002, pp. 961–966.
[66] S. Um, C.-Y. Wang, and K. S. Chen, “Computational fluid dynamics modeling of proton ex-change membrane fuel cells,” Journal of The Electrochemical Society, vol. 147, no. 12, pp.4485–4493, 2000.
[67] U.S. Department of Energy, Office of Fossil Energy, and National Energy Technology Labora-tory, Fuel Cell Handbook, 7th ed. Morgantown, WV: EG&G Technical Services, Inc., 2004.
[68] A. Vahidi, I. Kolmanovsky, and A. G. Stefanopoulou, “Constraint management in fuel cells:A fast reference governor approach,” in Proceedings of 2005 American Control Conference,Portland, OR, June 2005, pp. 3865–3870.
[69] A. Vahidi, A. G. Stefanopoulou, and H. Peng, “Model predictive control for starvation preven-tion in a hybrid fuel cell system,” in Proceedings of 2004 American Control Conference, Boston,MA, June 2004, pp. 834–839.
[70] Y. Wang and C.-Y. Wang, “Transient analysis of polymer electrolyte fuel cells,” Electrochimica
Acta, vol. 50, no. 6, pp. 1307–1315, 2005.
[71] W.-C. Yang, B. Bates, N. Fletcher, and R. Pow, “Control challenges and methodologies in fuelcell vehicle development,” SAE paper 98C054, 1998.
[72] W. H. Zhu, R. U. Payne, D. R. Cahela, and B. J. Tatarchuk, “Uniformity analysis at MEA andstack levels for a Nexa PEM fuel cell system,” Journal of Power Sources, vol. 128, no. 2, pp.231–238, Apr. 2004.