modeling affection mechanisms using deep and self ... · modeling affection mechanisms using deep...
TRANSCRIPT

Modeling Affection Mechanisms using
Deep and Self-Organizing Neural
Networks
Dissertation
zur Erlangung des Doktorgradesan der Fakultat fur Mathematik, Informatik und Naturwissenschaften
Fachbereich Informatikder Universitat Hamburg
eingereicht beim Fach-Promotionsausschuss Informatik vonPablo Vinicius Alves de Barros
Hamburg, August 2016

Day of oral defense:Wednesday, 28th September, 2016
The following evaluators recommend the admission of the dissertation:
Prof. Dr. Emilia BarakovaDept. of Industrial DesignTechnische Universiteit Eindhoven, Neetherlands
Prof. Dr. Frank Steinicke (chair)Dept. of Computer ScienceUniversitat Hamburg, Germany
Prof. Dr. Stefan Wermter (advisor)Dept. of Computer ScienceUniversitat Hamburg, Germany
II

c©2016 by Pablo Vinicius Alves de BarrosAll the illustrations, except where explicitly stated, are work by Pablo Vini-cius Alves de Barros and are licensed under the Creative Commons Attribution-ShareAlike 4.0 International (CC BY-SA 4.0).To view a copy of this license, visit https://creativecommons.org/licenses/by-sa/4.0/
III


Aos meus pais...... pois se cheguei tao longe foi por terme apoiado sobre ombros de gigantes.
V

Abstract
Emotions are related to many different parts of our lives: from the perception of theenvironment around us to different learning processes and natural communication.They have an important role when we talk to someone, when we learn how tospeak, when we meet a person for the first time, or to create memories abouta certain experience in our childhood. Because of this crucial role in a human’slife, studies on emotions date from the first centuries of written history and untiltoday it is a very popular research field involving a lot of different disciplines: fromneuroscience and psychology to artificial intelligence and robotics.
The research field of affective computing introduces the use of different emo-tional concepts on computational systems. Imagine a robot which can recognizespontaneous expressions and learn with it how to behave in a certain situation,or yet it uses emotional information to learn how to perceive the world aroundit. This is among the hardest challenges in affective computing: how to integrateemotion concepts in artificial systems to improve the way they perform a task,like communication or learning. One of the most important aspects of affectivecomputing is how to make computational systems recognize and learn emotionconcepts from different experiences, for example in human communication. Al-though several types of research were done in this area in the past two decades,we are still far away from having a system which can perceive, recognize and learnemotion concepts in a satisfactory way.
This thesis addresses the use of three models for emotion perception, recogni-tion, and learning. The models proposed here use different computational conceptsto solve each of these problems and implement solutions which proved to enhancethe performance and generalization when recognizing emotion expressions. Weevaluate our models using different databases with multimodal and spontaneousemotional information and proceed with a detailed analysis of each model. Wealso developed a novel database for emotion behavior analysis, the KT EmotionInteraction Corpus, which contains interactions from different human-human andhuman-robot scenarios.
The first of our models, named Cross-channel Convolution Neural Network(CCCNN), uses deep neural networks to learn how to represent and recognizespontaneous and multimodal audio-visual expressions. We implement modalityspecific channels to introduce particular feature representation and use shuntinginhibitory neurons to generate robust expression representations. We present theCross-channel architecture for high-level multimodal integration which makes themodel not only an expert on single-modality data, but also on multimodal infor-mation. We evaluate our model using different corpora, for each modality andin complex multimodal scenarios. During our experiments, we also show thatour model can deal with spontaneous expressions and performs better than state-of-the-art approaches in the same tasks. We also introduce the use of differentmechanisms to visualize the learned knowledge of the network, showing how theuse of the shunting inhibitory fields, modality-specific channels, and cross-channelintegrations affect expression representations.
VI

Abstract
Our second model uses self-organizing layers in conjunction of our CCCNN in away to learn different emotion concepts in an unsupervised manner. This improvesthe recognition and generalization capabilities of the model and introduces theability to learn new expressions. In this model, we extend our CCCNN with thecapability to create neural clusters which identify similar emotion concepts andshow how these concepts relate to categorical and dimensional views on emotions.Also, we show how our model learns new emotion clusters and how it can be usedfor describing emotional behaviors in different scenarios.
Finally, our third model introduces concepts from emotional attention andmemory as modulators for the learning and representation models presented be-fore. Such modulators improve the capability of the model to recognize expressions,introduce visual selective attention for detecting emotion expressions in a largevisual field, and make use of different memory mechanisms to adapt the model’sknowledge at various situations. We also propose a unified Emotional Deep NeuralCircuitry which integrates selective attention, emotion representation and recog-nition, learning of emotion concepts and storage of different affective memories.This system works on an online unsupervised learning manner, adapting its inter-nal representation to different human-human and human-robot scenarios.
The models proposed and discussed in this thesis contribute to the field of affec-tive computing by introducing a unified solution for selective attention, emotionrecognition, and learning. These models are competitive in each of these tasks,and also provide an overview of learning mechanism which adapts its knowledgeaccording to a given situation. We also develop a novel interaction dataset with dif-ferent spontaneous human-human and human-robot interactions and use it in theevaluation of our models. This thesis introduces and discusses novel mechanismswhich inspire different research on affective computing and provide an adaptivesolution for various emotion tasks in a way that was not done before, and thusserves as the basis for upcoming research.
VII

Abstract
Zusammenfassung
Emotionen begegnen uns in vielerlei Lebensbereichen: von der Wahrnehmung un-serer Umwelt bis hin zu verschiedenen Lernprozessen und naturlichsprachlicherKommunikation. Sie spielen eine bedeutende Rolle, wenn wir eine Konversationfuhren, wenn wir das Sprechen lernen, wenn wir das erste Mal einer Person begeg-nen oder wenn wir uns an ein Ereignis aus unserer Kindheit erinnern. Vorhandenehistorische Studien sind schriftliche Zeugen der bedeutenden Rolle die Emotionenim Leben der Menschen spielen, und bis zum heutigen Tag sind sie ein anerkanntes,interdisziplinares Forschungsgebiet, welches die Gebiete der Neurowissenschaften,Psychologie, Kunstlichen Intelligenz und Robotik vereint. Die Forschung innerhalbdes sogenannten “Affective Computing” beschaftigt sich mit der Verwendung emo-tionaler Konzepte in computergestutzten Systemen. So kann zum Beispiel ein Ro-boter spontane emotionale Ausdrucksweisen erkennen und darauf basierend lernen,wie er sich in einer bestimmten Situation verhalten kann, oder die emotionale In-formation nutzen, um etwas uber die umgebende Welt zu erfahren. Die großte Her-ausforderung in “Affective Computing” ist, emotionale Konzepte so in kunstlicheSysteme zu integrieren, dass diese in der Losung von Aufgaben unterstutzt wer-den, z.B. in der Kommunikation und dem Lernen. Einer der wichtigsten Aspekte indiesem Zusammenhang ist, computergestutzte Systeme auf Grundlage verschiede-ner Erfahrungen, z.B. in der zwischenmenschlichen Kommunikation, zu befahigenjene emotionalen Konzepte zu erkennen und zu lernen. Obwohl diesbezuglich be-reits viel Forschungsarbeit in den letzten zwei Jahrzehnten geleistet wurde, sindwir noch immer weit davon entfernt ein hinreichend zufriedenstellendes System zuhaben, welches emotionale Konzepte wahrnehmen, erkennen und lernen kann.
Die vorliegende Dissertation beschreibt drei Modelle, die die beschriebenen Pro-blematiken der Emotionswahrnehmung, der Emotionserkennung und des Lernensaddressieren. Die vorgeschlagenen Modelle implementieren verschiedene Berech-nungsverfahren, welche in geeigneter Weise die Probleme losen und zeigen, wiesich die Performanz und Generalisierungsfahigkeit zur Erkennung emotionaler Aus-drucke damit erhohen lasst. Zur Evaluation unserer Modelle verwenden wir diverseDatenbanken, welche multimodale und spontane emotionale Informationen bein-halten, und geben außerdem eine detaillierte Analyse unsere Modelle. Wir ent-wickelen außerdem eine neue Datenbank zur Analyse emotionalen Verhaltens, den“KT Emotion Interaction Corpus”, der unterschiedliche Interaktionsszenarien zwi-schen Menschen und zwischen Mensch und Roboter enthalt.
Unser erstes Modell, welches wir “Cross-channel Convolution Neural Network”(CCCNN) nennen, verwendet neuronale Netze mit einer underschiedliche verschie-dener Anzahl an versteckten Schichten, die lernen, wie spontane und multimodale,audio-visuelle Außerungen reprasentiert und erkannt werden. Dazu wurden mo-dalitatsspezifische Kanale zur Bestimmung spezieller Merkmalsreprasentationenimplementiert, sowie inhibitorische Neuronen zur Generierung robuster Reprasen-tationen der emotionalen Ausdrucksweisen verwendet. Wir stellen unsere “CrossChannel” Architektur zur multimodalen Integration vor und evaluier unser Modellanhand verschieden er Datensatze, die sowohl einzeln Modalitaten beinhalten wie
VIII

Abstract
auch komplexere, multimodale Szenarien. Unsere Experimente zeigen, dass unserModell spontane Ausdrucksweisen bewaltigen kann und außerdem eine ingesamtbessere Performanz erzielt als bisherige Ansatze zur gleichen Aufgabe. Wir fuhrenaußerdem eine Visualisierung trainierter Netze ein um aufzuzeigen, wie sich dieVerwendung von inhibitorischen Feldern und modalitatsspezifischen Kanalen unddie Integration aus den “cross channels” auf das Wissen im Netz bezuglich derAusdrucksreprasentationen auswirkt.
Das zweite hier vorgestellte Modell verwendet das Konzept selbstorganisieren-der Karten in Verbindung mit dem eingefuhrten CCCNN, sodass mehrere emo-tionale Konzepte unuberwacht, d.h. ohne a priori Wissen, gelernt werden konnen.Dies verbessert die Erkennung und Generalisationsfahigkeit des Modells und bie-tet die Moglichkeit auch neue Ausdrucksformen zu erlernen. In der Konsequenzwird das CCCNN um die Fahigkeit erweitert, neuronale Cluster zu generieren,die ahnliche emotionale Konzepte identifizierbar machen und aufzeigen, wie sichdiese Konzepte zur kategorischen und dimensionalen Perspektive auf Emotionenverhalten. Wir zeigen zusatzlich, wie unser Modell neue Gruppen emotionaler Aus-drucksweisen lernt und wie sie benutzt werden konnen, um emotionales Verhaltenin verschiedenen Situationen beschreiben zu konnen. Zum Schluß fuhren wir eindrittes Modell ein, das die Konzepte von Aufmerksamkeit und Gedachntisleistungzur Modulierung des Lernens und der Reprasentation aufgreift. Diese Modulatorenverbessern die Fahigkeit des Modells zur Emotionserkennung, behandeln visuelleselektive Aufmerksamkeit zur Bewegungsdetektion in einem großen rezeptiven Feldund verwenden verschiedene Arten von Gedachtnis um die Adaptivitat des Modellsan neue Situationen zu gewahrleisten. Wir schlagen ein vereinheitliches “EmotionalDeep Neural Circuitry” Modell vor, welches selektive Aufmerksamkeit, Emotions-reprasentation und Emotionserkennung, das Lernen von emotionalen Konzeptenund das Speichern verschiedener affektiver Erinnerungen integriert. Dieses Sys-tem arbeitet im sogenannten online-Modus und unuberwacht, welches ermoglichtdass interne Reprasentationen auf Grundlage einer Reihe von Mensch-zu-Menschoder Mensch-zu-Roboter Interaktionen adaptiert werden. Die in dieser Disserta-tion vorgeschlagenen und beschriebenen Modelle steuern einen wichtigen Beitragim Bereich des “Affective Computing” bei, in dem erstmals Erkenntnisse aus derForschung der selektiven Aufmerksamkeit mit den Aufgaben der Emotionserken-nung und des Lernens von Emotionen vereinheitlicht werden. Die Modelle sindjeweils performant zur gegebenen Aufgabe und bieten einen uberblick Uber Lern-mechanismen die das Wissen adaptiv zur Situation nutzen. Wir haben außerdemeine neue Datenbank entwickelt die spontane Mensch-zu-Mensch und Mensch-zu-Roboter Interaktionen enthalt und unsere Modelle anhand derer evaluiert.
Die vorliegende Dissertation stellt neuartige Mechanismen vor und diskutiertdiejenigen, welche im Bereich des “Affective Computing” zu inspierenden For-schungsfragestellungen fuhren konnten.Die Arbeit bietet adaptive Losungen fr diediversen Aufgaben der Emotionserkennung, dabei kann diese Dissertation durchden dargestellten, neuartigen Ansatz als Basis fur weiterfuhrende Forschung die-nen.
IX

Abstract
X

Contents
1 Introduction 1
1.1 Motivation . . . . . . . . . . . . . . . . . . . . . . . . . . . . . . . . 11.2 Objectives . . . . . . . . . . . . . . . . . . . . . . . . . . . . . . . . 31.3 Research Methodology . . . . . . . . . . . . . . . . . . . . . . . . . 41.4 Contribution of the Work . . . . . . . . . . . . . . . . . . . . . . . 51.5 Structure of the Thesis . . . . . . . . . . . . . . . . . . . . . . . . . 6
2 Emotion Perception 7
2.1 Emotion Representation . . . . . . . . . . . . . . . . . . . . . . . . 72.1.1 Categorical Models . . . . . . . . . . . . . . . . . . . . . . . 82.1.2 Dimensional Models . . . . . . . . . . . . . . . . . . . . . . 112.1.3 Cognitive Emotions . . . . . . . . . . . . . . . . . . . . . . . 13
2.2 Emotional Experience Perception . . . . . . . . . . . . . . . . . . . 152.2.1 Visual Pathway . . . . . . . . . . . . . . . . . . . . . . . . . 162.2.2 Auditory Pathway . . . . . . . . . . . . . . . . . . . . . . . 202.2.3 Multimodal Integration . . . . . . . . . . . . . . . . . . . . . 22
2.3 Summary on Emotion Perception . . . . . . . . . . . . . . . . . . . 23
3 Towards Emotional Behavior and Affective Computing 25
3.1 Emotional Attention . . . . . . . . . . . . . . . . . . . . . . . . . . 253.2 Emotion and Memory . . . . . . . . . . . . . . . . . . . . . . . . . 283.3 Early and Late Emotion Recognition . . . . . . . . . . . . . . . . . 293.4 Emotional Behavior . . . . . . . . . . . . . . . . . . . . . . . . . . . 31
3.4.1 Expressing Emotions . . . . . . . . . . . . . . . . . . . . . . 313.4.2 Developmental Learning of Emotions . . . . . . . . . . . . . 32
3.5 Affective Computing . . . . . . . . . . . . . . . . . . . . . . . . . . 343.5.1 Emotional Descriptors . . . . . . . . . . . . . . . . . . . . . 353.5.2 Emotion Recognition and Learning . . . . . . . . . . . . . . 38
3.6 Summary on Emotion Learning and Affective Computing . . . . . . 40
4 Neural Network Concepts and Corpora Used in this Thesis 43
4.1 Artificial Neural Networks . . . . . . . . . . . . . . . . . . . . . . . 434.2 Supervised Learning with Backpropagation . . . . . . . . . . . . . . 45
4.2.1 L1 and L2 Regularization . . . . . . . . . . . . . . . . . . . 464.2.2 Momentum Term . . . . . . . . . . . . . . . . . . . . . . . . 47
XI

Contents
4.2.3 Dropout . . . . . . . . . . . . . . . . . . . . . . . . . . . . . 484.3 Unsupervised Learning with Hebbian Learning . . . . . . . . . . . . 494.4 Convolutional Neural Network . . . . . . . . . . . . . . . . . . . . . 50
4.4.1 Cubic Receptive Fields . . . . . . . . . . . . . . . . . . . . . 514.4.2 Shunting Inhibition . . . . . . . . . . . . . . . . . . . . . . . 524.4.3 Inner Representation Visualization in CNNs . . . . . . . . . 53
4.5 Self-Organizing Maps . . . . . . . . . . . . . . . . . . . . . . . . . . 554.5.1 Growing When Required Networks . . . . . . . . . . . . . . 56
4.6 Corpora . . . . . . . . . . . . . . . . . . . . . . . . . . . . . . . . . 584.6.1 Emotion Expression Corpora . . . . . . . . . . . . . . . . . . 594.6.2 Emotional Attention Corpus . . . . . . . . . . . . . . . . . . 61
4.7 KT Emotional Interaction Corpus . . . . . . . . . . . . . . . . . . . 614.7.1 Recording Setup . . . . . . . . . . . . . . . . . . . . . . . . 624.7.2 Data Collection . . . . . . . . . . . . . . . . . . . . . . . . . 624.7.3 Data Annotation . . . . . . . . . . . . . . . . . . . . . . . . 674.7.4 Recorded Data . . . . . . . . . . . . . . . . . . . . . . . . . 694.7.5 Data Analysis . . . . . . . . . . . . . . . . . . . . . . . . . . 71
4.8 Summary . . . . . . . . . . . . . . . . . . . . . . . . . . . . . . . . 75
5 Emotion Perception with a Cross-channel Convolution Neural
Network 77
5.1 Introduction . . . . . . . . . . . . . . . . . . . . . . . . . . . . . . . 775.2 Cross-channel Convolution Neural Network . . . . . . . . . . . . . . 78
5.2.1 Visual Representation . . . . . . . . . . . . . . . . . . . . . 785.2.2 Auditory Representation . . . . . . . . . . . . . . . . . . . . 815.2.3 Crossmodal Representation . . . . . . . . . . . . . . . . . . 83
5.3 Methodology . . . . . . . . . . . . . . . . . . . . . . . . . . . . . . 845.3.1 Experiment 1: Parameter Evaluation . . . . . . . . . . . . . 845.3.2 Experiment 2: Aspects of the Architecture . . . . . . . . . . 855.3.3 Experiment 3: Emotion Expression Recognition . . . . . . . 86
5.4 Results . . . . . . . . . . . . . . . . . . . . . . . . . . . . . . . . . . 875.4.1 Experiment 1: Parameter Evaluation . . . . . . . . . . . . . 875.4.2 Experiment 2: Aspects of the Architecture . . . . . . . . . . 895.4.3 Experiment 3: Emotion Expression Recognition . . . . . . . 91
5.5 Discussion . . . . . . . . . . . . . . . . . . . . . . . . . . . . . . . . 995.5.1 Inhibitory Fields and Cross Channels . . . . . . . . . . . . . 995.5.2 Expression Representation . . . . . . . . . . . . . . . . . . . 100
5.6 Summary . . . . . . . . . . . . . . . . . . . . . . . . . . . . . . . . 102
6 Learning Emotional Concepts with Self-Organizing Networks 103
6.1 Introduction . . . . . . . . . . . . . . . . . . . . . . . . . . . . . . . 1036.2 Emotion Expression Learning . . . . . . . . . . . . . . . . . . . . . 104
6.2.1 Perception Representation . . . . . . . . . . . . . . . . . . . 1046.2.2 Expression Categorization . . . . . . . . . . . . . . . . . . . 107
6.3 Methodology . . . . . . . . . . . . . . . . . . . . . . . . . . . . . . 108
XII

Contents
6.3.1 Experiment 1: Emotion Categorization . . . . . . . . . . . . 108
6.3.2 Experiment 2: Learning New Expressions . . . . . . . . . . . 109
6.3.3 Experiment 3: Individual Behavior . . . . . . . . . . . . . . 109
6.4 Results . . . . . . . . . . . . . . . . . . . . . . . . . . . . . . . . . . 109
6.4.1 Experiment 1: Emotion Categorization . . . . . . . . . . . . 109
6.4.2 Experiment 2: Learning New Expressions . . . . . . . . . . . 109
6.4.3 Experiment 3: Individual Behavior . . . . . . . . . . . . . . 111
6.5 Discussion . . . . . . . . . . . . . . . . . . . . . . . . . . . . . . . . 113
6.5.1 The Prototype Expressions . . . . . . . . . . . . . . . . . . . 113
6.5.2 Emotional Concept Representation . . . . . . . . . . . . . . 114
6.6 Summary . . . . . . . . . . . . . . . . . . . . . . . . . . . . . . . . 114
7 Integration of Emotional Attention and Memory 117
7.1 Introduction . . . . . . . . . . . . . . . . . . . . . . . . . . . . . . . 117
7.2 Emotional Attention . . . . . . . . . . . . . . . . . . . . . . . . . . 118
7.2.1 Attentional Salience Learning Strategy . . . . . . . . . . . . 118
7.2.2 Attention Model . . . . . . . . . . . . . . . . . . . . . . . . 119
7.2.3 Multicue Attention Stimuli . . . . . . . . . . . . . . . . . . . 121
7.2.4 Attention Modulation . . . . . . . . . . . . . . . . . . . . . 121
7.3 Affective Memory . . . . . . . . . . . . . . . . . . . . . . . . . . . . 123
7.3.1 Growing Neural Memory . . . . . . . . . . . . . . . . . . . . 124
7.3.2 Memory Modulation . . . . . . . . . . . . . . . . . . . . . . 126
7.3.3 Emotional Deep Neural Circuitry . . . . . . . . . . . . . . . 128
7.4 Methodology . . . . . . . . . . . . . . . . . . . . . . . . . . . . . . 130
7.4.1 Experiment 1: Emotional Attention . . . . . . . . . . . . . . 130
7.4.2 Experiment 2: Affective Memory . . . . . . . . . . . . . . . 131
7.5 Results . . . . . . . . . . . . . . . . . . . . . . . . . . . . . . . . . . 132
7.5.1 Experiment 1: Emotional Attention . . . . . . . . . . . . . . 132
7.5.2 Experiment 2: Affective Memory . . . . . . . . . . . . . . . 133
7.6 Discussion . . . . . . . . . . . . . . . . . . . . . . . . . . . . . . . . 136
7.6.1 Emotional Attention Mechanisms . . . . . . . . . . . . . . . 136
7.6.2 Memory Modulation . . . . . . . . . . . . . . . . . . . . . . 137
7.7 Summary . . . . . . . . . . . . . . . . . . . . . . . . . . . . . . . . 140
8 Discussions and Conclusions 143
8.1 Emotion Representation . . . . . . . . . . . . . . . . . . . . . . . . 143
8.2 Emotional Concept Learning . . . . . . . . . . . . . . . . . . . . . . 145
8.3 Attention and Memory Modulation Integration . . . . . . . . . . . . 146
8.4 Limitations and Future Work . . . . . . . . . . . . . . . . . . . . . 148
8.5 Conclusions . . . . . . . . . . . . . . . . . . . . . . . . . . . . . . . 148
A KT Emotional Interaction Corpus 149
B Publications Originating from this Thesis 154
XIII

Contents
C Acknowledgements 157
Bibliography 158
XIV

List of Figures
2.1 Six universal emotions. . . . . . . . . . . . . . . . . . . . . . . . . . 92.2 Wheel of Emotions. . . . . . . . . . . . . . . . . . . . . . . . . . . . 102.3 Dimensional representation of the core affect. . . . . . . . . . . . . 122.4 Illustration of emotional appraisal theories. . . . . . . . . . . . . . . 162.5 Illustration of the visual cortex. . . . . . . . . . . . . . . . . . . . . 172.6 Illustration of the ventral and dorsal streams. . . . . . . . . . . . . 192.7 Illustration of the auditory cortex. . . . . . . . . . . . . . . . . . . . 212.8 Illustration of the Superior Temporal Sulcus (STS). . . . . . . . . . 22
3.1 Illustration of the role of the superior colliculus (SC) on emotionalattention perception. . . . . . . . . . . . . . . . . . . . . . . . . . . 27
3.2 Illustration of the emotional memory connections. . . . . . . . . . . 293.3 Illustration of the brain emotional circuitry discussed in this thesis. 313.4 Illustration of some Action Units in the Facial Action Coding System. 33
4.1 Illustration of the perceptron. . . . . . . . . . . . . . . . . . . . . . 444.2 Illustration of the Multilayer Perceptron (MLP). . . . . . . . . . . . 444.3 Illustration of the dropout algorithm. . . . . . . . . . . . . . . . . . 484.4 Illustration of the convolution process. . . . . . . . . . . . . . . . . 514.5 Illustration of the pooling process. . . . . . . . . . . . . . . . . . . . 514.6 Illustration of the cubic convolution process. . . . . . . . . . . . . . 524.7 Illustration of the shunting inhibitory neuron in complex cells. . . 534.8 Illustration of the internal visualization in a CNN. . . . . . . . . . . 554.9 Illustration of a Self-Organizing Map (SOM). . . . . . . . . . . . . . 574.10 Illustration of a Growing When Required Network (GWR). . . . . . 594.11 Illustration of images in the FABO corpus. . . . . . . . . . . . . . . 604.12 Illustration of images in the SAVEE corpus. . . . . . . . . . . . . . 604.13 Illustration of images in the EmotiW corpus. . . . . . . . . . . . . . 614.14 Illustration of images in the emotional attention corpus. . . . . . . . 624.15 Picture of the half-circle environment. . . . . . . . . . . . . . . . . . 634.16 Picture of one recording example. . . . . . . . . . . . . . . . . . . . 634.17 Picture of the instruction step. . . . . . . . . . . . . . . . . . . . . . 644.18 Picture of the topic assignment. . . . . . . . . . . . . . . . . . . . . 664.19 Picture of the iCub robot. . . . . . . . . . . . . . . . . . . . . . . . 664.20 Picture of the HRI scenario. . . . . . . . . . . . . . . . . . . . . . . 67
XV

List of Figures
4.21 Picture of the labeling collection framework. . . . . . . . . . . . . . 684.22 Demographic data summary for the HHI scenario. . . . . . . . . . . 704.23 Demographic data summary for the HRI scenario. . . . . . . . . . . 714.24 Analysis of the general data. . . . . . . . . . . . . . . . . . . . . . . 724.25 Analysis of the topic data. . . . . . . . . . . . . . . . . . . . . . . . 734.26 Analysis of the subject data. . . . . . . . . . . . . . . . . . . . . . . 74
5.1 Example of input for the CCCNN’s visual stream. . . . . . . . . . . 805.2 Illustration of the visual stream of our CCCNN. . . . . . . . . . . . 815.3 Illustration of the auditory stream of our CCCNN. . . . . . . . . . 825.4 Illustration of our CCCNN. . . . . . . . . . . . . . . . . . . . . . . 835.5 Individual analysis for the parameter exploration. . . . . . . . . . . 885.6 Combination analysis for the parameter exploration. . . . . . . . . . 905.7 Visualization of different inhibitory neurons. . . . . . . . . . . . . . 995.8 Visualization of Cross-channel neurons. . . . . . . . . . . . . . . . . 1005.9 Visualization of Face channel neurons. . . . . . . . . . . . . . . . . 1015.10 Visualization of the facial representation of different images. . . . . 102
6.1 Crossmodal architecture used as input for the SOM. . . . . . . . . . 1046.2 Illustration of the U-Matrix of a SOM with 40 neurons. . . . . . . . 1056.3 Illustration of activation maps for different emotion expressions. . . 1066.4 Illustration of the K-means algorithm applied to the SOM illustrated
in Figure 6.2. . . . . . . . . . . . . . . . . . . . . . . . . . . . . . . 1086.5 Illustration of the K-means algorithm applied to the SOM trained
with the EmotiW multimodal representation. . . . . . . . . . . . . . 1106.6 Illustration of activations plotted on top of a clustered SOM. . . . . 1116.7 Illustration of a trained SOM with different expressions. . . . . . . . 1126.8 Visualizations of Trained networks with expressions of each subject
of the SAVEE corpus. . . . . . . . . . . . . . . . . . . . . . . . . . 1136.9 Visualization of the neural emotional representation for two subjects
of the SAVEE corpus. . . . . . . . . . . . . . . . . . . . . . . . . . 114
7.1 Illustration of the output teaching signal of our emotional attentionmodel. . . . . . . . . . . . . . . . . . . . . . . . . . . . . . . . . . . 120
7.2 Our emotional attention model. . . . . . . . . . . . . . . . . . . . . 1207.3 Visualization of different neurons in our emotional attention model. 1227.4 Our emotional attention model modulating our emotion perception
model. . . . . . . . . . . . . . . . . . . . . . . . . . . . . . . . . . . 1237.5 Illustration of our general Perception GWR. . . . . . . . . . . . . . 1257.6 Illustration of our Affective Memory GWR. . . . . . . . . . . . . . . 1267.7 Illustration of our Emotional (deep) Neural Circuitry. . . . . . . . . 1287.8 Illustration of the output of our emotional attention model for one
expressive emotion. . . . . . . . . . . . . . . . . . . . . . . . . . . . 1377.9 Illustration of the output of our emotional attention model for one
expressive emotion and one neutral emotion. . . . . . . . . . . . . . 138
XVI

List of Figures
7.10 Illustration of the output of our emotional attention model for twoexpressive emotions. . . . . . . . . . . . . . . . . . . . . . . . . . . 138
7.11 Illustration of the effects of memory modulation on HHI scenario. . 1397.12 Illustration of the effects of memory modulation on HRI scenario. . 140
A.1 Analysis on the HHI data per topic. . . . . . . . . . . . . . . . . . . 150A.2 Analysis on the HRI data per topic. . . . . . . . . . . . . . . . . . . 151A.3 Analysis on the HHI data per topic - 1. . . . . . . . . . . . . . . . . 152A.4 Analysis on the HHI data per topic - 2. . . . . . . . . . . . . . . . . 152A.5 Analysis on the HRI data per topic - 1. . . . . . . . . . . . . . . . . 153A.6 Analysis on the HRI data per topic - 2. . . . . . . . . . . . . . . . . 153
XVII

List of Figures
XVIII

List of Tables
4.1 Number and duration of videos for each scenario experiment. . . . . 70
4.2 Intraclass coefficient per topic in the HHI scenario. . . . . . . . . . 74
4.3 Intraclass coefficient per topic in the HRI scenario. . . . . . . . . . 74
5.1 Parameter Set of the CCCNN. . . . . . . . . . . . . . . . . . . . . . 85
5.2 Accuracy of each of the parameters set of the CCNN. . . . . . . . . 88
5.3 Accuracy of the CCCNN trained with different movement lengths. . 90
5.4 Accuracy of the CCCNN trained with different inhibitory neurons. . 91
5.5 Accuracy of the CCCNN trained with the FABO corpus. . . . . . . 92
5.6 Comparison with state-of-the-art approaches with the FABO corpus. 92
5.7 Accuracy of the CCCNN trained with the GTZAN corpus. . . . . . 93
5.8 Accuracy of the CCCNN trained with the SAVEE auditory corpus. 93
5.9 Accuracy of the CCCNN trained with the EmotiW auditory corpus. 93
5.10 Comparison with state-of-the-art approaches with the GTZAN corpus. 94
5.11 Comparison with state-of-the-art approaches with the SAVEE au-ditory corpus. . . . . . . . . . . . . . . . . . . . . . . . . . . . . . . 95
5.12 Comparison with state-of-the-art approaches with the EmotiW au-ditory corpus. . . . . . . . . . . . . . . . . . . . . . . . . . . . . . . 95
5.13 Accuracy of the CCCNN trained with the SAVEE multimodal corpus. 96
5.14 Comparison with state-of-the-art approaches with the SAVEE mul-timodal corpus. . . . . . . . . . . . . . . . . . . . . . . . . . . . . . 97
5.15 Accuracy of the CCCNN trained with the EmotiW multimodal corpus. 98
5.16 Comparison with state-of-the-art approaches with the EmotiW mul-timodal corpus. . . . . . . . . . . . . . . . . . . . . . . . . . . . . . 98
6.1 Accuracy for the CCCNN and SOM trained with the EmotiW corpus.110
6.2 Accuracy for the CCCNN and SOM trained with different subjectsof the SAVEE corpus. . . . . . . . . . . . . . . . . . . . . . . . . . 112
7.1 Accuracy of our emotional attention model trained with the emo-tional attention corpora. . . . . . . . . . . . . . . . . . . . . . . . . 132
7.2 Accuracy of our emotional attention model trained with the WTMEmotion Interaction corpus. . . . . . . . . . . . . . . . . . . . . . . 133
7.3 Accuracy for the CCCNN with attention modulation trained withthe FABO corpus. . . . . . . . . . . . . . . . . . . . . . . . . . . . . 134
XIX

List of Tables
7.4 Accuracy for the CCCNN with attention modulation trained withthe KT Emotion Interaction Corpus. . . . . . . . . . . . . . . . . . 134
7.5 Intraclass coefficient of our model per topic on the HHI scenario. . . 1357.6 Intraclass coefficient per topic in the HRI scenario. . . . . . . . . . 1357.7 Intraclass coefficient of our model per subject on the HHI scenario. 1357.8 Intraclass coefficient of our model per subject on the HRI scenario. 136
XX

Chapter 1
Introduction
The most necessary skills of human-human communication are the capabilityto perceive, understand and respond to social interactions, usually determinedthrough affective expressions [96]. Therefore, the application of emotion expres-sion recognition in robots can change our interaction with them [246]. A robotcapable of understanding emotion expressions can increase its own capability ofsolving problems by using these expressions as part of its decision-making process,in a similar way as humans do [10]. A robot that develops this judgmental capa-bility based on human interaction observation can realize complex tasks, enhanceits interaction skills and even create a certain discernment about the informationit is receiving.
Although much research was done in automatic emotion recognition and in-terpretation in the past decades, still some problems exist. Most of the works onemotion recognition are restricted to a limited set of expressions, do not take intoconsideration spontaneous reactions and cannot be easily adapted to other usersor situations. Also, most of the research stops at the perception of expressions, butmuch more is necessary to have a deep understanding and application of emotionsin HRI.
1.1 Motivation
How to give a robot the capability of recognizing spontaneous expressions in inter-actions with a human? There is no consensus in the literature to define emotionalexpressions [36]. However, Ekman et al. [84] developed a study that shows thatemotion expressions are universally understood, independent of gender, age andcultural background. They established the six universal emotions: “Disgust”,“Fear”, “Happiness”, “Surprise”, “Sadness” and “Anger”. Although they showthat these emotions are commonly inferred from expressions by most people, theconcept of spontaneous expressions increases the complexity of the expression rep-resentation. Humans usually express themselves differently, sometimes even com-bining one or more characteristics of the so-called universal emotions. Further-more, several researchers built their own categories of complex emotional states,
1
Chapter 1. Introduction
with concepts such as confusion, surprise, and concentration [3].To define spontaneous emotions, the observation of several multimodal charac-
teristics, and among them, facial expressions, movement and auditory signals, hasbeen shown to be necessary [170]. It was shown that face expression alone maycontain misleading information, especially when applied to interaction and socialscenarios. The observation of different modalities, such as body posture, motion,and speech intonation, improved the determination of the emotional state of thesubjects.
Another problem of most HRI research is that it is restricted to a certainset of emotional concepts, such as the six universal emotions. Humans have thecapability to learn emotion expressions and adapt their internal representation toa newly perceived emotion. This is explained by Hamlin [120] as a developmentallearning process. Her work shows that human babies perceive interactions intotwo very clear directions: positive and negative. When the baby is growing, thisperception is shaped based on the observation of human interaction. Eventually,concepts such as the six universal emotions are formed.
The developmental aspect of the emotion perception is also the focus of differentworks [125, 188, 242], and the correlation of perceiving visual and auditory emotionexpressions and developing them through childhood is evident [115]. It was shownthat these modalities complement each other and are one of the foundations ofrecognizing and understanding unknown emotional expressions.
Besides emotion perception and learning, attention and memory mechanismsshowed to be important for processing emotional information. There is a strongselective attention mechanism which focuses on emotional events [295, 97], whichproduces an attention modulation that improves spatial perception [229, 233]. Af-fective memory is also an important part of perception, recognition and learningprocess [250, 46], and is shown to modulate how these processes work. Such sys-tems are part of a larger emotional circuitry, which affects most of the cognitiveprocesses in the human brain.
The emotional learning mechanisms presented in this thesis are related to thesethree systems: perception, attention, and memory. Although very well studied,such systems are very complex and affect and are affected by many other mecha-nisms in the human brain. This is a multi-interdisciplinary study field involvingphilosophy, psychology, neuroscience and recently, computer science. Studies ondecision making [63], emotion estimation [260], wisdom evaluation [137] and arti-ficial intuition [7] have been made, and still present many open topics.
In computer science, several models for expression recognition [45], emotionrepresentation [284], affective states estimation [41], mood determination[66], andempathy measurement [198] were proposed. Most of these works are complemen-tary but do not integrate the developmental aspect of emotion learning, both inrelation to multimodal expressions and emotional concepts, with mechanisms suchas emotional memory and attention.
To have a complete artificial affective system we need to achieve three goals:recognize multimodal emotion expressions, represent these expressions into emo-tional concepts, which can be learned without constraints, and integrate memory
2

1.2. Objectives
and attention mechanisms as modulators for the learning framework. Each ofthese problems is difficult enough alone, and thus the solutions presented so farwere very domain-dependent or not suitable for integration in a complete scenariodue to computational limitations, such as sensors, algorithms, and robust repre-sentation.
1.2 Objectives
This thesis proposes an artificial affective system based on the developmental learn-ing aspects of human emotion perception. Such a system uses different neuralarchitectures to represent different behaviors of emotional learning, and it is builtin three steps: perception, learning, and modulation.
The first step is to create, with a deep neural network, a perception model fordifferent modalities that preserves the information of each individual modality, butalso models the correlations within them. Such model should be robust enough todeal with spontaneous expressions, and adaptive enough to be able to recognizeexpressions from different users.
The second step builds a self-organizing network for developmental emotionalperception and gives the system the capability to adapt its own perception mech-anisms to different persons and expressions. Such a model uses the unsupervisedlearning characteristics to learn different emotional concepts based on the previousmodel’s multimodal representations.
The last step builds an attention system and different emotional memory mech-anisms to modulate what the network learned. Such mechanisms are implementedas growing neural networks and deep localization models and contribute to mak-ing the learning mechanism more adaptable to different subjects, situations, andenvironments.
This thesis aims to address the following research questions:
• Can a deep neural network represent multimodal spontaneous human expres-sions?
• How to learn different emotional concepts from multimodal spontaneous ex-pression representations?
• How to adapt attention and memory mechanisms as modulators for emotionperception and learning?
In contrast to existing research, the models described in this thesis aim todemonstrate how different neural computational techniques can be implementedand trained in a similar way as the human developmental process to identify andlearn emotional concepts.
The proposed models implement neural-inspired methods and are integratedinto a complex emotional neural circuitry. A series of experiments, motivated bydifferent neural-cognitive and psychological studies, are performed and analyzed.
3

Chapter 1. Introduction
These experiments range from learning how to classify spontaneous expressions toevaluating the emotional framework in different interaction scenarios.
1.3 Research Methodology
The work presented in this thesis is neurally inspired but only from a functionalpoint of view. No attempts are made to produce a detailed biological model.
The first step of our model deals directly with data representation. The mostsuccessful way to represent data is the one done by the human brain [2]. Thehuman brain recognizes emotional expressions from visual and auditory stimuli,correlating information from different areas. The brain also correlates past expe-riences, movements and face expressions with perceived sounds and voices. It iscapable of integrating this multimodal information and generates a unique rep-resentation of the visual and auditory stimuli. The simulation of this process incomputer systems can be achieved by neural models, particularly ones which areable to create a hierarchy of feature representations such as Convolutional NeuralNetworks (CNNs) [179].
The second step implements a self-organizing layer on top of the learned featuresin order to establish separation boundaries to the perceived expressions. Our self-organizing layer gives the model the capability to learn new expressions by creatingdifferent emotional clusters. This approach allows us to validate how representativethe learned features are and gives us a powerful tool to understand how differentemotions are categorized.
The third step implements two different modulation mechanisms: First an at-tention model is implemented with a deep neural network to improve the expres-sion representation. This model uses shared representation to modulate what wasperceived in the perception model. The second mechanism implements growingself-organizing networks to represent different memory modulations, which affecthow the model learn different emotional concepts.
The focus of this research is to use the proposed model in the evaluation ofdifferent communication scenarios, with and without the presence of robots. Eachof the presented steps contains its own roles and constraints, where the first one isused to identify the perceived expression, the second to model to learn emotionalconcepts and the third to modulate the learning.
To help in the evaluation of the proposed models we make use of a set of corporapresented and used in the literature. However, these corpora do not incorporateinteractions between humans and robots, therefore we created a new interactioncorpus. This corpus implements human-human and human-robot interactions andwe present several different analyses on different aspects of the corpus.
We also use different visualization techniques to demonstrate that our modelhas a hierarchical emotion expression representation, where regions of neurons rep-resent specific characteristics of each modality. Also, we visually demonstrate thatin the self-organizing layers, each neuron codes for different emotional concepts,and how each region represents different ideas, such as perceived emotions, inner
4

1.4. Contribution of the Work
emotional representation, and affective states.
1.4 Contribution of the Work
The neural networks implemented in this thesis use concepts such as supervisedand unsupervised learning for emotion expression representations and emotionalconcepts, respectively. Our models implement deep neural networks for perceptionand localization and growing neural models for memory mechanisms. Such com-bination of models, architectures and concepts contribute to artificial intelligenceand machine learning as a whole, while the application of such model in learningemotional concepts introduces novelty in fields as Human-Robot Interaction (HRI)and affective computation.
Besides the proposed model, deeper analysis, statistical measures and neuralvisualization introduce different novelties in the understanding of different neuralnetworks. The design, recording, and processing of a novel emotional behavioranalysis corpus also contribute to the field of automatic emotion recognition andintroduces the use of such scenarios in an HRI environment. The main contribu-tions of this work can be listed as follows:
• A new deep neural model based on Convolution Neural Networks for learningmultimodal emotion expressions is proposed. This algorithm applies shuntinginhibitory neurons in order to learn specific visual representations and theconcept of cross-learning to generate robust filters for different emotionalmodalities. It is explained how the model creates a hierarchical emotionrepresentation and how this contributes to the final expression representation.
• A self-organizing-based model is proposed to create emotional concepts basedon perceived emotion expressions. It is demonstrated how this model rep-resents different emotions in a non-categorical view and how these repre-sentations enhance emotion recognition tasks. This model is also used forbehavioral analysis based on perceived expressions and it has the capabilityto identify how different expressions are represented and what these repre-sentations mean in a behavioral context.
• An emotional attention mechanism is proposed as a deep Convolution NeuralNetwork. Such networks are commonly used for classification tasks, however,we adapt it for localization, and specify our architecture for emotional at-tention. Such a model is integrated into our first model as a modulator andimproves the recognition and localization of different expressions. Also as amodulator, we implement attention mechanisms with growing self-organizingnetworks and introduce the use of such memories to improve emotional con-cepts learning.
• A novel emotional expression analysis corpus is designed and recorded. Thecorpus implements different scenarios for Human-Human- and Human-Robot-Interaction, and we perform several analyses and statistics on the data. The
5
Chapter 1. Introduction
corpus was designed to be used for different emotion-related tasks involvingHuman-Human and Human-Robot interactions.
1.5 Structure of the Thesis
This thesis is structured into 8 chapters. The initial chapters place this thesiswithin the field of emotion recognition in humans and in Human-Robot Interactionscenarios. They provide an overview of the broad fields touched on by this thesis.
The current chapter, Chapter 1, introduces the motivation of this work andprovides the scope and objectives of the mentioned experiments.
Chapter 2 presents the conceptual and neural-biological foundations of emo-tion perception and recognition in humans. These include basic mechanisms forperception in different modalities and emotional concepts representation. Chapter3 extends the discussion and describes complementary emotional concepts, suchas attention and memory, and shows the psychological concepts behind emotionallearning. At the end of chapter 3, the application of some of the presented concepts,and the state of the art of artificial intelligence-based models are provided.
Chapter 4 introduces the neural network concepts necessary for the under-standing of the proposed models and the corpora used for the experiments. Thenovel corpus is presented and the details of its design, recording and analysis arepresented. In Chapter 5, the emotion perception model based on deep neuralnetworks is introduced and evaluated in different scenarios. A discussion of theresults and the model itself are presented. In Chapter 6, the self-organizing archi-tecture for learning emotional concepts is presented. The idea of how the modelunderstands different expressions is introduced in the discussions of this chapter.Chapter 7 introduces the emotional attention and different memory mechanisms,which modulate the learning of the model.
A general discussion is provided in Chapter 8 resuming not only the outcomesof the individual chapters, but also the contribution of this thesis in the field ofcognitive robots.
6

Chapter 2
Emotion Perception
Emotions are part of human life and have received attention since the first philoso-phers started to study the human behavior. In one of the earlier references onemotions, Plato [239] defined that the human soul consists of three basic energies:reason, emotion, and appetite, where reason should rule and control the emotionsif a person wants to have a balanced life. In his allegory, a chariot, represent-ing the journey of the soul, is driven by reason and pulled by two winged horses:a white one, representing positive passions (or emotions) and a black one rep-resenting negative ones. Similarly, philosophers like Aristotle [166], Spinoza andHumes [217], and Descartes [102] created theories about emotions. Through thecenturies, emotions were discussed and explained as feelings [145], intentions [168],morality modulators [59] and cognitive mechanisms [59]. However, it was not untilthe 20th century that the study of emotions, both as a biological and psycholog-ical mechanism, became very prominent and several important types of researchwere made which changed how we understand the role of emotions in human life[255, 280, 221, 219, 48].
In this chapter, the concepts of emotional representation and perception willbe discussed. Firstly, several philosophical concepts of emotions and how to rep-resent them will be exhibited. Then, the basic principles behind unimodal andmultimodal emotion perception in humans will be discussed in the light of neuralaspects.
2.1 Emotion Representation
There is no consensus in the literature to define emotions. According to Dixon etal. [71], the term emotion replaced the idea represented by the word passion aroundthe 16th century. Depending on different researchers emotions can be defined asintense feelings directed at someone or something [140], the state of the mind ofa person [95] or even as responses to internal and external events which have aparticular significance for the organism, as described by Fox et al.[98].
In their work, Fox et al. differentiate emotions into three constructs:
• Feelings are a subjective representation of emotions which are experienced
7
Chapter 2. Emotion Perception
by one individual and are short-longing and intense.
• Moods are affective states, which last longer than feelings, but are lessintense.
• Affect is a term which relates feelings and moods to persons, objects, eventsor memory in general.
These constructs relate to the perception mechanisms only, and how to cat-egorize different concepts of emotions. The feelings concept is usually the onewhich receives the most attention, as the other two are closely related to it. Therepresentation of these feelings is another big problem, as there is no consensuson how to group or identify different feelings. One of the first ones to deal withthat in a scientific manner was Descartes [102], who stated that feelings can bedescribed as the combination of a few basic emotional concepts, such as irritationor excitement.
Contemporary psychologists base their work on the concept which here we nameCategorical Models and was described by Descartes. Others describe every feel-ing as irreducibly specific components divided into finite dimensions, as intensity,pleasure, self-directness among others, which we name here Dimensional Models.Yet other models were evaluated as for example the ones based on the evolutionarypsychology which relates emotions to the fulfillment of basic needs, such as mat-ing, affiliation, defense and avoidance of predators [223, 54]. In this section, wewill discuss two of these views: the categorical models and the dimensional ones,which are the two most common in several approaches and present valid theorieson emotion perception and learning, which are the basis of this thesis.
2.1.1 Categorical Models
In the past fifty years, many researchers tried to identify and categorize emotions.One of the most important works in this area was done by Ekman and Friesen[81]. They identified certain emotions which appeared to be universally recognized,independent of cultural or geographical background, which they called universalemotions. Only the face expression was used to create these emotional concepts,however, they evaluated their research with persons belonging to different cultures,including subjects which have no access to any kind of media, giving their evidencea strong claim. They found six universal emotions: “anger”, “disgust”, “fear”,“happiness”, “sadness” and “surprise”, as illustrated in Figure 2.1.
The concept of universal emotions from Ekman and Friesen successfully iden-tified some cross-cultural characteristics on emotion perception, but still someemotional concepts are too complex to be understood easily. Based on their work,Robert Plutchik [240] developed the Wheel of Emotions. He suggested eight pri-mary emotions aligned in two axes: a positive and a negative one. Differently fromEkman and Friesen, he states that the emotions are not only the feeling but themood and affect as well. This way, he defines his eight basic emotions as “joy“,“trust”, “fear”, “surprise”, “sadness”, “anticipation”, “anger”, and “disgust”. In
8

2.1. Emotion Representation
Figure 2.1: Six universal emotions described by Ekman and Friesen [81]. Accordingto their research, these emotions could be perceived and understood independentlyof the person’s cultural background. Based on Ekman and Friesen [81].
his Wheel of Emotions, “joy” is opposite to “sadness”, “fear” to “anger”, “antici-pation” to “surprise” and “disgust” to “trust”. Figure 2.2 illustrates the Wheel ofEmotions.
Ekman and Friesen’s model identifies what we perceive from what anotherperson is feeling according to one’s individual perception. Plutchik’s model goesfurther and identifies an emotional concept, which could be specified or generalizeddepending on different contextual situations. As an example, in his model “happy”could be a state of “joy” or “happiness”. In his work, he describes emotions asan evolving mechanism, which does not only adapt but evolve based on one’sown perception, life experience, and even environment. The Emotion Wheel hasimportant characteristics, which describe the emotional aspect of human behavior:
• Basic emotions. Similarly to Ekman and Friesen’s model, the Plutchikmodel uses the concept of basic emotions. These concepts are the ones whichhave the most probability to be identified or felt by any person, independentof their cultural background.
• Combinations. The combination of the basic emotions generate all otheremotions, which is a concept defended by Descartes. In this case, “love”could be expressed as a combination of “trust” and “joy”.
• Idealized states. The basic emotions are idealized states, which means thatit is not possible that they exist by themselves. Only through the observationof several different pieces of evidence (perception mechanisms, context, otheremotions) it is possible to describe them.
9

Chapter 2. Emotion Perception
Figure 2.2: Wheel of Emotions proposed by Plutchik [240]. In this model, thereare eight basic emotions which are aligned with a positive-negative axis creatingopposite relations such as “joy” and “sadness”, “fear” and “anger”, “anticipation”and “surprise”, and “disgust” and “trust”. Based on Plutchik [240]
• Opposites. The primary emotions have opposite axes, so “joy” and “sad-ness” are different instances of the same emotion.
• Similarity. All emotions have different degrees of similarity to one another,meaning that border concepts of “sadness” and “disgust” can be blended as“remorse”, for example.
• Intensity. Each basic emotion can vary in intensity, besides the positive andnegative axis. In the Emotion Wheel, the intensity increases as you movetowards the center. That means that “boredom” can be understood as a lessintense “disgust” and “loathing” as a very intense “disgust”.
The contribution of Ekman and Friesen’s model is enormous because they in-troduce the idea that every human can understand a set of emotions. The work ofPlutchik developed this concept and extended the way we can categorize very spe-cific emotions. With the Wheel of Emotions, it is possible to identify very abstractconcepts, like love or optimism, and very basic instincts like rage or terror. Othermodels were proposed, with several variants of these two models, but they tendto be more complex and more specific, pushing away from the idea of universaldescription from Ekman and Friesen.
10
2.1. Emotion Representation
These models are supported by researchers which state that the basic emotionsare not learned, but produced by dedicated circuits in the brain, although theyare the result of an evolutionary process [182]. That explains why persons witha different cultural background can identify the basic emotions and why they canlearn to identify or describe different emotions. Following this theory, the Wheel ofEmotions can be expanded infinitely, depending on the person’s own experience.
2.1.2 Dimensional Models
One of the problems of the categorical models is that different persons can identifyand relate emotions in different ways. Some of them can relate optimism withjoy and surprise or with joy and anticipation. Besides that, it is not possibleto measure how interconnected these emotions are, and the Wheel of Emotionswill change depending on the person who is describing them based on personalexperiences or even the current mental state of the person [144].
A different way to represent these emotions is to identify and give values tocomponents which the emotions are made of. One of the most influential works inthis area is the work of Russel et al. [261]. In their model, an emotional experienceis described by two dimensions: valence and arousal. Valence measures how posi-tive or negative that experience feels, and arousal how active the experience was.These two dimensions create a 2D coordinate system, which can describe feelings,moods and affect.
These two dimensions are the basis to identify the core affect [262]. The coreaffect is the main component of the conceptual act model of emotion, proposed byBarret [12]. This theory tries to solve what was called the emotion paradox: Howto measure, with consistent validity, how a person describes his or her emotionalexperiences? In her experiment, several persons tried to describe an emotionalexperience using categorical models. No consistency was found, and in addition tothis, the same person described the same experience differently in different timeperiods.
The conceptual act model of emotion claims that the perception of emotionalexperiences is not discrete. An opposite effect happens when describing colors.The physical colors are continuous, but when a person describes a color as blue,he or she is using his or her knowledge of colors to give the perceived wavelength.What differs is that independent of other factors, the same wavelength will alwaysbe perceived as blue by the person. With emotions, this perception is different.In her experiments, Barret found out that a person will change the category of anemotional experience (from excitement to fear when seeing a snake, for example)depending on her mood and affect. That means that instead of having dedicatedcircuits in the brain for the basic emotions, the brain identifies some aspects ofwhat is being perceived and how (the most important of them is the core affect)and based on that approximates to the person’s own experience.
Based on the conceptual act model of emotions, if we can identify the coreaffect properly, we can identify an emotion. Using the two dimensions describedby Russel, the core affect could be measured easily. Figure 1 illustrates the arousal
11

Chapter 2. Emotion Perception
Figure 2.3: Dimensional representation of the core affect into two dimensions:Arousal and Valence. The core affect is the main component when identifying anemotional event. By determining the core affect precisely, it is possible to generateemotions based on the person’s own emotional knowledge. Based on Barret et al.[13]
and valence coordinate system representing the core affect.
Using the idea of describing the core effect, two different persons can describe anemotional experience the same way, but give different names to it. As an example,if a person sees someone crying, what could identify this emotional experience asa very negative valence (crying) and with very positive arousal (high intensity),but identify it as a sad emotion. Another person would identify the valence andarousal the same way, but interpret it as a surprised emotion.
Several other researchers introduced different dimensional models, includingdimensions such as self-directness and power were developed. However, most ofthem introduce an extra complexity in the development and description. Also,most of these models do not show any relation with neural-biological finds [258]and the arousal/valence model still showed to be the most reliable one, with strongneural-biological evidence.
12

2.1. Emotion Representation
2.1.3 Cognitive Emotions
The relation between cognition and emotion is still not clear. Historically, theywere treated separately, but in the past two decades this area received a lot ofattention and many researchers describe different integrative models.
Cognition can be understood as the mental action or process of acquiring knowl-edge and understanding through experience and the senses [292]. It comprisesprocesses like memory, attention, language, problem-solving, planning, judgmentand reasoning. Many of these processes are thought to involve sophisticated func-tions and mechanisms which are still not fully understood, including emotionalprocesses.
Most of the cognitive processes happen in the cortical regions of the brain, con-nected directly to a higher evolutionary state, and some of them are found mainlyin primates [103]. On the other hand, some researchers believe that many emo-tional processes are related directly to subcortical regions, such as the amygdala,the hypothalamus and the ventral striatum, which are often considered primitivein an evolutionary point of view [103], and are present in other mammals, for exam-ple. These regions are described as being responsible for some emotional processessuch as the ones driven by rewards and punishment [253], the basic, or primary,emotions [80, 240] and unconscious body reactions [58]. For example, a dog couldbe conditioned to react to an action based on an emotional punishment (fear, forexample), but will still have the white of the eyes very prominent.
Although some emotional processes are subcortical, the cognitive processes likeperception, attention, learning, and memory have been connected with emotionalcharacteristics [181, 228, 180]. Current thinking emphasizes the interdependenceof emotional and cognitive processes, and the view of the cortical-cognitive andsubcortical-emotional area is now viewed as largely simplified especially when thebrain is looked at in detail.
Based on the interdependence view between emotion and cognition, the idea ofcognitive appraisal has been developed in the past decades. This theory explainswhy persons react differently to the same things. The works of Magna Arnold[6] and Richard Lazarus [178] model the idea that the first step of an emotion isan appraisal of the situation, that means that the person’s environment, currentmental state, and memory will determine how he or she will describe the emotionalexperience.
Lazarus explains the appraisal theory using a structural model. In this model,emotions involve a relational, a motivational and a cognitive aspect [177]. Therelational aspect describes the relation between the person and the environment,mostly using memory modulated by current perception. The motivational aspectdeals with the person’s goal, and how important the emotional experience is forthe person to achieve the goal. The cognitive aspect evaluates how importantthe emotional experience is for the person’s life, and how the person behavedin a similar experience in the past. This way, the same emotional event can beexperienced differently if the person is in a good mood, or has good memoriesrelated to the situation, for example.
13

Chapter 2. Emotion Perception
Lazarus’ structural model is also divided into two categories: the primary ap-praisal and the secondary appraisal. The primary appraisal is where the personevaluates the motivational relevance and the motivational congruence. The mo-tivational relevance indicates how relevant this situation is to the person’s ownneeds, and the motivational congruence evaluates if the situation is consistentwith the person’s goals. The secondary appraisal evaluates the person’s resourcesand options for coping with the situation. It involves the determination of whoshould be held accountable for the experience, the person itself, another person orentity or a group of persons, and this is determined by blame or credit values. Theperson also determines the coping potential and separates it in problem-focused oremotion-focused. Problem-focused coping refers to the person’s ability to changethe situation to be congruent to the person’s goal, while emotional-coping refersto the ability of the person to deal with the situation if it cannot be changed tobe congruent to the person’s goal.
The structural model received some critics, especially for failing to capturethe dynamic nature of emotions. To deal with that, the model was transformedinto a cyclic model: after the secondary appraisal, a reappraisal mechanism wasincluded in the attempt to capture long-term emotional responses [281]. Still, themodel fails to capture the rapid or automatic emotional responses [205]. To solvethat, several models based on dynamic emotional updates were proposed, the mostprominent among them was the multi-level sequential process model of Scherer etal. [270].
The multi-level sequential process model describes an emotional experience inthree processing levels: innate, learned and deliberate. They describe a strictlyordered step-by-step progression, in which these processes are carried out:
• Cognitive Appraisal evaluates events and objects, giving the personal ex-perience an individual value.
• Bodily Symptoms define the physiological component of emotion experi-ence, comprising neural and bio-chemical mechanisms.
• Action Tendencies describe the motivational component, giving a contextof direction and motor responses.
• Expressions exhibit the internal intentions of an individual, using facialexpressions, vocalization and body movements.
• Feelings describe how the subject experiences the emotional state once ithas occurred, related to emotional memory.
There are various evaluation checks throughout the processes, but four of themhave an important role: a relevance check, to define novelty and relevance of theexperience; implication check, measure the cause, urgency and how it affects thegoal; coping check, which determines how to deal with the situation and finally thecheck for normative significance, which evaluates how the experience is compatiblewith the person’s standards, including moral and survival ones.
14

2.2. Emotional Experience Perception
To illustrate the difference between these two models, imagine the following sit-uation: a student is giving a speech for the first time in his life, while he is talkinghe looks at the audience and sees someone laughing. Dealing with this situationwith the structural model from Lazarus [177] the following would happen: First,the primary appraisal mechanisms identify the motivational relevance and congru-ence of the situation. The student identifies that someone in the audience does notlike him and this will affect his speech. The secondary appraisal mechanisms thenderive that the student is not good enough (he is to blame for the situation), andas coping mechanism his mouth gets dry. In the reappraisal cycle, this situationwill be always related to discomfort and failure.
In the multi-level sequential process model from Scherer et al. [270], first thesituation will pass through a cognitive appraisal check, and a sequence of processesare carried out. In the cognitive appraisal check, it is perceived that the situationis new (relevance check), someone laughs (implication check), that the studenthimself is not good enough (coping check) and it is the first time that this situationhappens (normative check). The cognitive appraisal will drive the other processesstarting with the innate bodily symptom, basically, the perception that someoneis laughing and the attention focus on that person. The learned process of actiontendency will indicate that the student will look at the person who is laughing.Then, the expression process will be triggered, and it will make the student’smouth dry. Finally, this experience will be connected with a bad memory or evena trauma.
Figure 2.4 illustrates both the structural model and multi-level sequential pro-cess model. It is possible to see that the structural model derives informationearly on, and thus does not have the capability to adapt to changes happening inthe process, while the multi-level sequential process model can adapt to differentthings happening. For example, if someone else is laughing in the same situation,the bodily symptoms process will depict that as well, and the whole process getsupdated.
2.2 Emotional Experience Perception
Emotional experiences are perceived through visual, auditory and physiologicalsensory processes, however, mechanisms such as memory modulate what was per-ceived [72]. This idea was different for many years when research believed thatperception and emotions were separate study domains. Only recently relevant stud-ies were made in this area, and nowadays the consent is that emotions modulateperception, and perception influences directly the emotional experience [8, 304].
The human perception system integrates diverse senses and different brain ar-eas. Cortical regions usually deal from low to high-level information, integrationand also memory. Sub-cortical regions, such as the amygdala, have an importantrole on localization and unseen emotion determination, meaning experiences whichare perceived but not yet processed by cognitive regions, like extreme fear or anger.All these processes start with sensory perception, for example when a person sees
15

Chapter 2. Emotion Perception
Figure 2.4: Illustration of how the two different emotional appraisal theories, struc-tural [177] and multi-level sequential process model[270], deal with the same sce-nario: a student is giving a speech for the first time and someone in the audienceis laughing.
and listens to someone crying, the whole emotional experience system starts withsensory processing.
Emotions are perceived with many human senses, but two of them are pre-dominant: visual and auditory systems. Many types of research show that withthese two systems humans can perceive [275] and experience [305] many emotionalsituations. This section exhibits how humans perceive emotions through the vi-sual and auditory cortex, and how they are integrated into different cortical andsub-cortical brain regions.
2.2.1 Visual Pathway
The visual processing system in the brain is part of the central nervous systemand processes information coming from the eyes. The whole visual system is verycomplex and not fully understood, but it involves all processing from the captureof the light by the eyes to the response of motor behavior and memory association.The visual information is usually processed through the visual cortex, which is thelargest area in the human brain. The visual cortex is located in the rear part ofthe brain, above the cerebellum and both hemispheres of the brain contain a visualcortex. However, the left hemisphere is responsible for processing the right visualfield and the right hemisphere the left visual field.
The visual cortex processes sensory information in a hierarchical way, and dif-ferent regions have neurons reacting to different visual concepts. The informationfirst flows through the primary cortex, composed of the V1 region and go into the
16

2.2. Emotional Experience Perception
Figure 2.5: Illustration of the location of the visual cortex in the human brainin the rear part of the cerebrum, above the cerebellum. It is possible to see theregions from V1 to V5. Modified from [53] based on [109].
deeper V2, V2, V4 and V5 regions. The neurons in the primary cortex usuallyrespond to different line segments and orientations, while neurons in V4, for ex-ample, react to complete objects or movement. This hierarchical processing allowsthe information to be shared through all these areas, and each of them reacts andprocesses different levels of abstraction. Figure 2.5 illustrates the visual cortexregions. All these regions are driven by feedforward connections, however, theyare modulated by feedback and lateral interactions.
The primary cortex, or V1 area, is the most studied area in the brain. It isalso the simplest and probably the earliest area of the visual cortex to develop,and it is highly specialized for processing of static objects and simple patternrecognition [185]. The neurons in V1 tend to have a strong response to a smallset of stimuli, which happens because the V1 area has the smallest receptive fieldsize in the visual cortex. Meaning that the neurons in the V1 area tend to react tosmall changes in orientation, spatial frequencies and colors [11]. The informationencoded by the V1 neurons are basically edge detectors, representing the localcontrast between different small structures and colors on the visual field. Thisregion has straight-forward connections with the other regions, providing this fastand simple processing to deeper and more complex structures [4, 278]. Recentresearch [11] shows that feedback connections change also the properties of the V1neurons over time. At first, the neurons in this region detect the small structuresand information, but after this information is processed, feedback connections tothe V1 neurons make them sensitive to the more global organization of the scene,such as macro disturbances and movements.
17

Chapter 2. Emotion Perception
The V2 region is the second major area in the visual cortex and it receivesstrong feedforward connections from the V1 neurons. The neurons in V2 encodeorientation, spatial frequency, and color, as the V1 area, but they have a largerreceptive field. That means that the neurons in V2 identify small objects andcomplex patterns in multiple orientations and in different regions in the visualfield [103]. These neurons are strongly modulated by orientation and binoculardisparity and thus can identify background and foreground information [245]. Alsothe neurons in this region code a small attentional modulation, identifying macrofocus regions, such as a person’s shape.
The neurons in the V3 region are generally associated with the processingof global motion [27]. They receive feedforward connections from the V2 andV1 areas and are known to cover the complete visual field [200]. Usually, theyencode coherent motion of large patterns, showing an understanding of what themovement means. They are mostly associated with the perception of gestures andbody movements [254].
The area known as V4 receives strong feedforward connections from V2 andweak connections from V1. These neurons usually encode space relations betweendifferent objects, orientation, and color. Different from V2, the neurons in V4 en-code mostly patterns with small complexity, like general shapes (circles, squares).Some research [109, 252] states that V4 is responsible for dealing with color pro-cessing, especially spatial contrast defined by different colored objects, for example,background-foreground identification based on different colors. Also, the neuronsin V4 are strongly modulated by attention mechanisms [212], which have a stronginfluence on the firing behavior of the neurons. This behavior illustrates howsubcortical mechanisms influence the visual processing.
The V5 area is also known as the middle temporal region (MT) and plays amajor role in the perception of motion, integration of local motion in the globalview and connections with the motor area, mostly for eyes movement. The V5neurons receive connections from the V1, V2, and V3 neurons, and although thestrongest connections are coming from V1 neurons [24], studies show that visualinformation reaches the V5 area even before it reaches V1 neurons [75]. Theneurons in this region encode speed and direction of movements in the wholevisual field, integrating local movements into the whole scene.
Therefore, we can see that the visual cortex regions process different visualinformation: some of them relate to spatial relation between objects and someto movement. Based on that, Milner and Goodale [111] propose the two-streamshypothesis. This hypothesis states that the visual systems process information intwo brain pathways: the ventral and the dorsal stream. They exhibit anatomical,neurophysiological and behavioral evidence that the ventral stream participates inthe visual cognition process, determining information about what the person isvisualizing. The dorsal stream, on the other hand, is involved in the recognitionand processing of where the object is, related to space. The dorsal stream processesthe spatial information of what the person is visualizing, for example, the distanceof the object to the person. Regions V3 and V5 are directly associated with thedorsal stream, while regions V2 and V4 are placed in the ventral stream. The
18

2.2. Emotional Experience Perception
Figure 2.6: Illustration of the ventral and dorsal streams together with the visualcortex. Modified from [53] based on [109].
V1 neurons are usually connected to all of the other regions and serve as a firstprocessing step for most of the visual cortex processing. Figure 2.6 illustrates theventral and dorsal streams.
The ventral stream is directly associated with object and form recognition.Some research names it the “what” stream. The neurons in this region increasetheir receptive fields size in the deeper regions, which increases the complexity ofobjects recognized in the visual field. Attention and memory have a large influenceon the processing of the ventral stream, giving this region a strong role in thejudgmental significance of the visual field. It was shown, for example, that thedamages in the ventral stream cause the inability of a person to recognize facialexpressions and identifying emotional experiences [110].
The neurons in the dorsal stream region are connected directly to the V1 neu-rons and are known to be involved in the guidance of action and recognition ofwhere some objects are in space. This explains the “where stream” name whichis often given to the dorsal stream. The neurons in the ventral stream are di-rectly connected with the motor system and have interconnections with the ventralstream. The neurons in this region encode two distinctive things: a detailed spa-tial map of the visual field and the detecting of movements. They are responsiblefor the perception of body movements and gestures, identifying speed, orientation,and direction of these movements. Damages in the dorsal region can lead to aninability to perceive motion and description of complex scenes, focusing only onsingle objects.
Both ventral and dorsal streams contribute to the perception of emotionalexperiences. Focusing on the identification of emotion expressions, the processing
19

Chapter 2. Emotion Perception
of facial movements and body postures gives us the capability to perceive whatothers are expressing. The visual cortex is a very complex region and yet not fullyunderstood, but what we know so far about it enables us to understand better howvisual emotion expressions are perceived.
2.2.2 Auditory Pathway
The auditory cortex is responsible for the processing and understanding of audi-tory stimuli and it is located in both brain hemispheres, roughly at the upper sideof the temporal lobe. This region receives and sends information from the ears viasubcortical auditory systems, and it is connected with other parts of the cerebralcortex. The auditory cortex is separated into the primary cortex and secondaryprojection areas which are responsible for auditory pre-processing. The main pro-cessing and stronger connections with other cerebral areas are in the primary cortex[237].
The neurons in the primary cortex are organized according to the frequencyof sounds they process, with neurons that react to low frequencies in one extremeof the cortex and neurons which react to high frequencies in the other. Thereare many auditory areas which can be distinguished anatomically, like the visualcortex, and they process the audio in a similar hierarchical way [18], where ear-lier regions process only some frequencies and deeper regions process a completefrequency map.
The auditory cortex represents the higher abstraction processing in the au-ditory system. It has a very important role in understanding language, dealingwith auditory conflict and semantic processing, and despite the recent interest inunderstanding it, we still do not know much about it [67].
The auditory cortex is also encapsulated in the ventral and dorsal stream hy-pothesis [226]. Studies focused on language show evidence that auditory inter-pretation from phonemes to syntax understanding also occurs in the ventral anddorsal stream [248]. Figure 2.7 illustrates the auditory cortex in the human brain.
While in the visual system, the ventral stream is responsible mostly for theunderstanding of complex patterns and its relation to attention and memory, inthe auditory system the ventral stream neurons process auditory information andrelate it to semantics. First, the signals proceeding from the ears are transformedinto information through the subcortical auditory pathway. Then, this informa-tion is processed in phonemes and later on recognized as words. This informationthen enters the ventral stream and the individual words are related with languageconcepts, and later on into large semantical ideas, such as phrases and scene de-scription. Several mechanisms are involved in this process, including memory,attention, and even the visual cortex.
The dorsal stream has a very different role in the auditory pathway. Hickockand Poeppel [130] propose that the dorsal stream is directly related to articulatorymotor representations. They claim that learning to speak and understand languageis directly related to motor behavior, especially mouth movements. The auditoryinformation enters the dorsal stream earlier than the ventral stream. Here, the
20

2.2. Emotional Experience Perception
Figure 2.7: Illustration of the auditory cortex location in the brain. Modified from[53] based on [109].
information is not yet processed semantically but represented as phonetic acous-tics. The first step of the dorsal stream is the sensorimotor interface for phoneticreproduction. That means that the information is paired with the ability of theperson to reproduce that sound. Then, it is related to the short-term memory ofthe articulatory mechanisms for phonological processes [132].
The ventral and dorsal streams are also interconnected for the auditory path-way. The integration of other mechanisms, such as memory, are important forthe learning and understanding of language [268]. The subcortical pathway has avery important role in the processing of auditory signals and especially attention,which modulates the cortical auditory pathway [202]. Although language is oneof the most studied fields in auditory pathway understanding, the cortical regionsare also related to interpretation and understanding of prosodic stimuli. Someonescreaming will be processed first in the subcortical area, but the auditory pathwaywill have an important judgmental role on the stimuli understanding [285].
Emotional experiences can be expressed in both language and prosodic audi-tory stimuli. Someone talking about his or her past can produce the same sadexperience as listening to someone crying. The two-streams theory helps us tounderstand how stimuli are processed, but still, many other complex structuresare involved. For both, vision and auditory systems, the concept of independentemotional processing is becoming less evident [244, 116], and the integration ofthese areas with other brain regions helps us to understand how difficult emotionprocessing really is.
21

Chapter 2. Emotion Perception
Figure 2.8: Illustration of the Superior Temporal Sulcus (STS) in the brain. Mod-ified from [53] based on [109].
2.2.3 Multimodal Integration
Emotional experiences are perceived by a large number of sensors and processingbrain regions. The visual and the auditory cortex are two of these regions, andthey process unimodal information in a complex hierarchical way, with forward andfeedback connections. These two regions also communicate between each other andare directly connected to other brain regions, such as the superior temporal sulcus(STS). The neurons in the STS encode several different information and includemultisensory processing [276]. Figure 2.8 illustrates the STS in the brain.
The STS is directly related to social perception [19] and so it integrates severalsensory information, including signals coming from the auditory and visual cortices.The neurons in the STS react strongly for semantic understanding [289], selectiveattention [39], emotional experience determination [114] and language recognitionand learning [133]. All these tasks are highly correlated with very complex visualand auditory stimuli.
The STS is the responsible for the interpretation of the vocal input coming fromthe auditory cortex [132]. The neurons in the STS react to phones that composewords[289] and show very weak activation when environment sounds are present.The strong connections between the auditory cortex and the STS are mostly feed-forward, but feedback connections are also found and modulate the perception ofcertain phones when certain words are recognized [133]. This behavior indicatesthat the STS is part of the modulation of the perception of words in a dialogue,taking into consideration what was spoken before. That helps in the prediction ofcertain words which usually come after the other, helping in a dialogue.
In a particular manner, the neurons in the STS react to semantic informa-
22

2.3. Summary on Emotion Perception
tion when images are present [126]. The interpretation of these images, and theconstruction from singular objects to high cognitive concepts - such as semanticparsing - have been shown to influence strongly in the STS neuron’s firing behav-ior [19]. The integration of visual and auditory information for scene parsing andsocial understanding, including language and emotion experience determination,happens at the highest level in the STS and is sent as feedback to many otherbrain regions.
The STS has a strong connection to what was described with face neurons[127], which are brain neurons that react strongly when faces are present in thevisual field. Neurons in the STS respond strongly when the face is moving in thevisual field [30], but not when an object is moving. That indicates that after facesand objects are recognized and their movements described in the visual cortex,the STS integrates this information and modulates the attention into the mostsemantically important concept. This effect implicates a very strong role of theSTS in two distinct concepts: semantical integration [265] of the two visual cortexstreams and a modulator in the attention mechanisms [216].
Experimental results [39] show that the STS has an important role in jointattention mechanism. When a group of persons is looking at the same place, theSTS is responsible for processing, identify and also drive the attention of the eyesto this place. This is a very complex task and involves the sensory perception,attention modulation, short- and long-term memory and motor integration. Thisis a very important aspect of understanding other person’s emotions, as the socialbehavior of emotional experiences is a very complex task. Also, the joint attentionmechanism modulates the person’s own emotional perception, which is reflected inthe way that the visual and auditory cortices process emotional stimuli.
2.3 Summary on Emotion Perception
Different research has been done in emotion understanding in the past centuries,and yet there is no consensus on how to define emotions. Mainly because emotionsare part of many different research fields, as seen in this chapter. This chapter dis-cussed different ways to model emotions: from categorical concepts to dimensionalabstract spaces and cognitive processes. It is important to note that among thevarious views presented above, there is not a right or wrong emotion representa-tion concept, and all of them are important to understanding different aspects ofemotions and how they affect human lives. The research described in this thesisbenefits from these different representations and use distinct properties of each ofthese representations to perceive, model and learn emotional concepts in differenttasks.
Besides emotion representation, this chapter discussed emotion perception inthe human brain. Understanding how the visual and auditory systems in thebrain process emotional information help us to abstract some characteristics andmechanisms which served as inspiration for our models.
23

Chapter 2. Emotion Perception
24

Chapter 3
Towards Emotional Behavior and
Affective Computing
Recent studies show that the multisensory nature of emotional experiences is pro-cessed in several different brain regions [38]. Besides perception, which is alreadya very hard and complex task, mechanisms like attention, short- and long-termmemory, motor representation, and even the most primitive reaction systems areinvolved in understanding emotional experiences [73].
Traditionally, the understanding of emotional experiences has been studiedonly with one modality [31, 106], but recent works study the effect of cross-modalemotional stimuli [208, 92] in emotion recognition. It was shown that cross-modalinterpretation occurs in different brain levels with different mechanisms but alsothat the presence of cross-modal stimuli created different behavioral responses inthe brain [61]. Studies show that this cross-modal modulation occurs even if thepersons are asked to base their analysis only on one of the modalities in a scenariowhere different modalities are present [92].
The integration of these mechanisms with the perception systems creates a com-plex information and processing network which is not fully understood. This re-search helps to understand how humans perceive and understand the world aroundthem, but also how we can solve complex problems such as emotional interpreta-tion. This chapter exhibits insights on concepts such as attention and memory,and introduces a summary of the brain’s emotional circuitry. Also, it shows anoverview of the aspects of emotions which are studied by psychologists and howthey help us, in addition to philosophers and neuroscientists, to understand therole of emotions in our lives. Finally, different computational models for emo-tion perception, learning and integration are discussed, introducing the emotionalconcepts from the perspective of artificial systems.
3.1 Emotional Attention
Attention is one of the most important mechanisms in the brain. It allows humansto process relevant areas of the whole stimuli perception field while suppressing
25

Chapter 3. Towards Emotional Behavior and Affective Computing
irrelevant ones, and many neural regions have been identified to be involved inspatial attention during perception [74].
Spatial attention allows us to use what is described as selective attention: touse processed stimuli to modulate the perceptive field. One of the most importantcases of selective attention is emotional attention, where the affective componentsof the stimuli affect the perceptive field [52].
Studies with visual emotional perception show that affective estimation has adirect influence on attention. It was also shown that neural processes responsiblefor determining interest regions receive strong feedback connections from emotionperception regions, such as the STS and the visual cortex [293].
Many behavioral studies show that people pay more attention to emotionalrather than neutral stimuli and that this behavior is often reflexive and involuntary[78, 294, 300]. Richard et al. [249] show that there is a difference in the timeperception of emotional and non-emotional stimuli even when emotions are notpart of the task, such as in the Stroop Task. This study shows us the importanceof emotional attention in the perception processes in the brain, modulating severalspatial attention tasks.
The attention modulation is the focus of different studies [229, 233], which showthat low contrast stimuli improved if emotional cues are present, suggesting thatemotional-driven mechanisms improve the spatial attention. Additional studies[295, 97] propose that in the case of limited attentional resources, emotional-relatedinformation is prioritized over information without any emotion connection.
One of the most important attention-related regions in the brain is the supe-rior colliculus (SC). This region is a subcortical structure, mostly responsible forintegrating low-level audiovisual stimuli and motor responses [288]. The SC playsa crucial role in general attention, and it is an important part of the attentionalemotional processing [169].
Another brain region which is directly related to emotion processing is theamygdala. The amygdala is responsible for being involved in low-level decision-making (mostly involuntary), memory and emotional reactions. Research showthat the amygdala has a very important role in creating an associative memoryfor emotional events [214], and it is also associated with reflectional processing asfear conditioning [22] and rage [42].
The amygdala and the SC are said to be part of the emotional attention pro-cessing mechanism [175]. The two-pathway hypothesis [183] suggests the role ofthese two structures in the processing of emotional events. This theory states thatthere is a partial parallel processing of the stimuli and a feedback connection be-tween the subcortical structures - the amygdala and the SC - and the early stagesof the cortical ones.
In the subcortical regions, the stimuli are first processed by the SC, which in-tegrates the audiovisual information and has a strong response to simple emotionexpressions, such as face expressions or body posture. Studies show that whenpresented with face expressions, neurons in the SC react to the ones which are ex-pressing an emotion [213], demonstrating an unseen emotional filter effect. Lateron, this stimulus is processed in the amygdala, which associates the filtered stim-
26

3.1. Emotional Attention
Figure 3.1: Illustration of the role of the superior colliculus (SC), amygdala (hereseen through the cortical surface, although they are subcortical structures) andcortical regions in the two-pathway [183] and two-stage [32] hypothesis for emo-tional attention perception, respectively in the first and second row. It is possibleto see the main difference of these theories, which is when the feedback betweencortical and subcortical structures happens. For the two-pathway theory, the feed-back happens after the primary processing of the superior colliculus (SC) and theamygdala. The two-stage theory, on the other hand, states that the feedbackhappens during the process. Modified from [53] and based on [293].
uli coming from the SC with emotional memories, and sends this information tocortical regions as a feedback connection. In this theory, the cortical regions sendin-between feedback projections to the SC, which acts as cortical modulators.
Alternatively, the two-stage hypothesis [32] states that there is a feedback com-munication between high-level cortical regions and the subcortical structures afterthe processing of emotional attention. This theory suggests that there is a fast fullstimuli processing, without feedback, from both subcortical and cortical structures,and after that, the feedback connections act as modulators for both regions.
Both theories state that feedback connections are important for processing ofemotional attention and that emotional attention has a strong role in perceptionmodulation. The main difference between them is how this processing occurs:while the two-stage hypothesis states that there are only feedback connections atthe end of the subcortical processing, the two-pathway hypothesis claims that this
27

Chapter 3. Towards Emotional Behavior and Affective Computing
connection occurs in the middle of the process. Figure 3.1 illustrates both theoriesand show how the feedback process happens. In both cases, it is important tonote the role of the SC and amygdala as a crucial modulation for the cortical areasshowing how complex and important the attention modulation is.
3.2 Emotion and Memory
Memory is processed in the brain in four stages [76]: encoding, consolidation, stor-age and retrieval. The encoding stage is the perceptual processing of the instan-taneous or short-time stimuli. The consolidation is the stage where the memoryis retained in the brain [28] and happens in two steps: the synaptic consolidation,which is associated with short-term memory [172], and the system consolidation,associated with long-term memory and learning [282]. Storage is a passive stage,where the memory is stored in the brain as short-term or long-term memory. Thelast stage involves the recollection of these memories, usually for modulation ofperception or learning.
In the early stages of evolution, emotional concepts related to survival instincts,like fear or feeling safe, followed several different experiences. These experienceswere directly attached to these emotional concepts, and over time an emotionalassociation was created with this memory [269]. Through evolution, this processof learning became genetically embedded in most animals, which has been referredto as instinctive behavior [142].
During the life of a human, many events are perceived and to each of theseevents, an affective concept is associated, and usually represented as an emotionaldimensional concept [262], composed of arousal and valence. Studies show thatusually the arousal dimension is related to memory association [37], but the va-lence dimension affects how an event will be remembered [174, 218]. That meansthat usually a person will remember exciting events, but how this event will beremembered depends on the valence giving to this event. This is directly relatedto goal achievements, a high arousal and high valence event [153], and traumas, ahigh arousal, and low valence event [47].
Emotional aspects are known to be part of the processing of three of the fourmemory stages: encoding, consolidation, and retrieval [250, 46]. During the encod-ing stage, emotions are known to modulate the perception itself and it was shownthat emotional events, ones with high arousal, receives a stronger attention thannon-emotional ones, with low arousal [233]. Also, it was shown that events with ahigh emotional arousal are more likely to be processed when attention is limited[153]. An example of this behavior is a modulation in the magnitude of the visualfield when an object attached with an emotional relevance is present in the scene,meaning that if a person fears spiders, he or she will spot a spider faster than otherobjects.
The consolidation stage is modulated by the emotional aspects captured in theencoding stage, but also by the arousal and valence of the memory itself [174].During consolidation, the emotion arousal appears to increase the likelihood of
28

3.3. Early and Late Emotion Recognition
Figure 3.2: Illustration of the forward and feedback modulation connections in thefour stages of the emotional memory scheme [76]. The red arrows represent themodulation, while the black arrows the forward connections.
the event being retained in long-term memory, explaining behavioral effects likepunishment and reward learning [93]. Studies [47] show that the event with higharousal will receive more focus than peripheral information. That is why a personusually can remember the content of a very difficult test, but not what he or shewas wearing that day.
In the last two stages, storage and recollection, the modulation comes fromtwo different paths: from the perceived event, which triggered the recollection,and from the memory itself [153]. For each event stored in memory, an emotionalconcept is associated. There is a consensus in the field [26, 189] that the moodof the person, meaning the evaluation of the current emotional state the personis in, affects the recollection of an event in the memory. Watkins et al. [299]show that a person in a depressive, low valence mood tends to remember negativeevents. This effect was named as mood congruence. Other studies [187] show thatthe emotional concept associated with a specific perceived event changes dependingon the person’s mood, usually reflecting the mood itself. That means that a personwith a depressive mood will associate more low valence labels with the perceivedevent, while a happy person will tend to look for the high valence elements. Figure3.2 illustrates the forward and feedback modulation connections in the emotionalmemory scheme.
3.3 Early and Late Emotion Recognition
Besides describing the perceived emotional stimuli, the cortical regions of the brainplay a strong role in processing and recognizing what was perceived. This recog-nition happens in different regions and associates the perceived stimuli, emotionalattention, and interpretation of the semantic concept behind the stimuli [92]. Onthe other hand, the subcortical regions, like the superior colliculus and the amyg-dala, have a strong role in reflexive movements and association with primitiveemotional behavior as self-preservation [213].
29

Chapter 3. Towards Emotional Behavior and Affective Computing
The ventral and dorsal streams communicate with each other through severallevels of feedforward and feedback connections, as in the emotional attention mech-anisms, but also process the stimuli in distinct ways, such as the perception andreflexive reactions of fear [73]. When a human perceives fear and to be in a threatsituation, the heart-beat accelerates, pumping more blood to the brain, the face be-comes paler, retracting the blood from the surface of the skin among other effects.This mechanism is still not fully understood, but it is part of a more primitiveemotional experience perception: the involuntary reflexive processing [22].
Among other structures, the amygdala is one of the most important involuntaryreflexive structures in the brain [42]. The neurons in the amygdala are connectedwith the primary sensors of stimuli perception, like the V1 region in the visualcortex, and the motor system. Studies [42] show that the amygdala is respon-sible for, among other things, fear to condition, connecting experiences such asa scary encounter with a monster with a scream. Other studies [227] show thatthe amygdala is also involved in the positive reward mechanisms, like connectingfood with a positive reward (satiating the hungry). Yet, other studies relate theamygdala with memory association in the most primitive way: traumas, phobias,and emotional conditioning events, like remembering a good friend when lookingat a flower.
The amygdala is also associated with memory modulation [22]. Long-termmemory is formed over time, probably for a lifelong time. That means that manyexperiences happen until this memory is formed. Recent studies [232] show thatthe amygdala acts as an emotional modulator in the formation of these memories.The emotional arousal following the perceived event influences the impact of theevent in the memory consolidation, and the amygdala is directly associated withthis process.
In the cortical regions, emotions are recognized as a complex event which in-volves low- and high-level stimuli processing and memory modulation. Areas asthe visual and auditory cortices and the STS process what the person is perceiv-ing, in this case, auditory and visual information, integrate this with other senses,as temperature, smell and self-movement. This whole process is modulated bymemory and by the subcortical structures.
Although very complex, emotional concepts are present in several brain re-gions. The emotional modulations happen from perception to memory storageand affect the daily life of every human being. The recognition of an emotion isdirectly associated with a perceived event, and humans are expert in labeling emo-tional concepts to different objects, scenes and time where the event happened.The full integration of all these mechanisms is still not fully understood, howeverunderstanding the functioning of these structures would give us a very importantoverview on how to recognize emotions in different perceived events and memories,and also how to make decisions, do actions and determine the person’s own mood.A simplified version of the brain emotional circuitry discussed in this chapter isillustrated in Figure 3.3.
30

3.4. Emotional Behavior
Figure 3.3: Illustration of a simplified version of the brain emotional circuitrydiscussed in this chapter. The red lines represent the modulation, while the blacklines the forward connections.
3.4 Emotional Behavior
The cycle of perceiving an event, understanding it and associating it with differentmemory levels and actions is a basic mechanism and happens from birth onwards.For the whole neural system involved in perceiving, understanding and using emo-tions, several researchers show different psychological and behavioral aspects ofemotions.
Emotions are sometimes referred to as the window to the soul [303]. In thelast 100 years, the study of several psychological aspects of emotions gave us veryimportant and different insights on how we use emotional concepts in our life. Thecognitive appraisal theory tries to correlate the neural aspects of emotion percep-tion and understanding and some psychological findings. However, many questionsare not addressed by this theory, such as the emotion expression mechanisms andlearning behaviors. This section discusses these two concepts.
3.4.1 Expressing Emotions
One of the most important ways to convey emotions is through emotion expres-sions. Humans and animals are known to show physical changes which reflect thecurrent mood. These expressions usually involve the whole body and differentmodalities, such as speech, face expressions, and body movement. We usually canrelate these expressions with an emotional concept, using the before-mentionedmechanisms: perception, representation, recognition, and memory.
Different persons will express differently, depending on several factors: thegender, the cultural background, the current mood, the context situation and so
31

Chapter 3. Towards Emotional Behavior and Affective Computing
on. However, humans are able to, in most cases, identify these expressions and theemotional concept behind them. In a study about expressions itself [82] it is shownthat when a single emotion expression occurs, it lasts between 300 millisecondsand 2 seconds. These expressions usually carry a broader meaning, such as thesix universal expressions, and are usually synchronized within different modalities.That means that an angry person would scream at the same time as his or herhands are moving frenetically in the air; and the moment the face changes, themovements also tend to adapt to it. This introduces a concept of co-occurrence ofdifferent modalities which are naturally synchronized.
Ekman and Friesen [85] introduced a way to describe face expressions in a de-terministic way. The Facial Action Coding System (FACS) is a taxonomic systemto describe human facial movements. The FACS defines Action Units (AU), whichare contractions or relaxations of one or more muscles, and the combination of AUscan represent a facial expression. In the latest version of FACS, a total of 98 AUsis present. This system was used by psychologists and animators in the past threedecades and is still a standard method of analyzing facial expressions. Figure 3.4illustrates an example of different FACS codings for eyebrow movements.
Although humans convey their mood, most of the time, with clear expressions,a deeper analysis shows that there is more to see than the obvious. The concept ofmicro expressions started to be analyzed in the beginning of the behavioral studies[60], and today is one of the most important factors when trying to determine whichemotions a person is conveying. Micro expressions are involuntary movements ofthe body, face, or change on the voice tone that do not reflect the macro expressionand convey important detailing information about the person’s mood or intention.
Ekman [83] demonstrates that facial micro-expressions last from 40 to 300 mil-liseconds, and are composed of an involuntary pattern of the face, sometimes notrelated to the expressions being performed. He also shows that micro expressionsare too brief to convey an emotion, but usually are signs of concealed emotions,giving the expression a different meaning. For example, facial micro-expressionsare usually the way to distinguish when someone is angry while using a happysarcastic expression. In this case, the addition of facial micro-expressions as anobservable modality can enhance the capability of the model to distinguish spon-taneous expressions, but the observation of the facial micro-expression alone doesnot carry any meaning.
The interpretation of expressions and micro expressions is an important toolfor human communication and social life. The understanding of such expressionshas also a strong role in the learning mechanisms, and in the contextual interpre-tation of the environment, helping also in decision-making and character buildingmechanisms.
3.4.2 Developmental Learning of Emotions
There are two perspectives when talking about innate perception: the traditionalone says that emotional perception and morality are learned from scratch, whileothers believe that some of these aspects are built-in, meaning that human babies
32

3.4. Emotional Behavior
Figure 3.4: Example of seven different Action Units (AU), presented in the FacialAction Coding System (FACS), for eyebrow: inner brow raised (AU1), outer browraised (AU2), brow lowered (AU4), upper lid raised (Au5), cheek raised (AU6),and lid tightened (AU7). Adapted from [16].
have already some innate judgmental capability.
In the past century, psychologists performed several experiments trying to provethat emotional perception is learned during childhood [161, 234]. They state thatbabies are born completely amoral, processing no or very basic moral informationabout what happens around them, and then during childhood and several devel-opmental processes develop a mature perspective. This also explains that personsgrowing in different cultural regions have different moral standards.
The traditional perspective claims that our moral perspective is always updat-ing, even through adulthood, and that it would be possible to train a person tofollow a certain behavior, as long as the training starts in early ages. The conceptof moral behavior, in this case, is directly associated with emotional perceptionand memory association [79]. An action could be considered good or bad, and thusshape the perception of a certain experience, for example hunting an animal. Somepeople will perceive the scary face of the animal and understand the whole hunt-ing experience as a cruelty, while others will understand it as a sport event. Allthe experiences we have are associated with one or more emotional labels, whichaccording to the researchers in the traditional perspective, shape our morality.
On the other hand, other researchers [119, 122] address a different question:all the aspects of the morality are learned and shaped during childhood? In theexperiments performed by the traditional stream researchers this question wasneglected, and they only evaluated the whole idea of innate perception or notinnate perception.
Recent research [148, 211] shows that the understanding of certain conceptualdomains emerges even with the absence of certain experiences. For example, aperson does not necessarily have to be helped or harmed in a particular situationto understand when another person is being helped or harmed. This moral corewould remain intact during the person’s life.
The concept of innate moral goodness is growing among those who believehumans have some innate characteristics for emotional perception [207]. Sagi andHoffman [263] show that from birth, newborns show very rudimentary emotionalreactions to other’s suffering. Hamlin [121] discusses how babies, when growing up,adapt these reactions towards different social behaviors like comforting someone in
33

Chapter 3. Towards Emotional Behavior and Affective Computing
distress [77], helping others to achieve goals [298] and sharing their own resources[107].
Based on these concepts, Hamlin [121] proposes an experiment with toddlers.A scenario with two entities, a box, and a ball is presented to the toddler. In thisscenario, two actions happen: in the first one, the ball helps the box to climb a hill.In the other, the ball prevents the box to climb the hill. The toddler is then askedto choose between one of the entities, and most of the toddlers create an empathytowards the helper. This experiment shows that the toddlers could identify goodand bad actions, based on a simple task. This research showed that the toddlercould give a valence (between positive and negative) to the experience.
Other research [143, 266] confirms also that humans have an innate capability toevaluate an event with a valence domain. That means that humans are born withan innate emotional identification, which can be expanded throughout childhood.This is the basis for developmental research [144, 273] on emotion acquisition,and paired with the cognitive appraisal theory creates a robust framework forunderstanding the learning of processing new emotions.
Based on the theory that emotion perception is innate, several researchers[125, 188] state a developmental aspect of learning emotional concepts. They statethat as babies we shape our emotional perception first based on two valences:positive and negative. As we grow up, the experiences are perceived in morecomplex ways, with the inclusion of different arousal states.
Grossman [115] shows the correlation of perceiving visual and auditory emo-tion expressions and developing them through childhood. They show that thesemodalities complement each other and are one of the foundations of recognizingand understanding unknown emotional expressions. Also, there is evidence [23]that this mechanism could be one of the most important in the development ofintuition, and thus play a very important role in decision-making [63].
3.5 Affective Computing
In the past decades, many researchers approached the issue of automatic emotionrecognition. With the progress in Human-Machine Interaction research, in partic-ular, Human-Robot Interaction (HRI), the necessity of having a natural way ofcommunication emerged.
In the nineties, the term affective computing was developed [235]. As a defini-tion, affective computing is the area which develops computational systems thatcan recognize, interpret, process and simulate emotion and affective states. Itis an interdisciplinary topic, and involves psychologists, computer, and cognitivescientists.
Early works on affective computing focused on trying to create universal de-scriptors for emotion perception, mainly on visual [62, 192] and auditory streams[90, 230]. However, given the complexity of human emotional behavior, many ofthese solutions were very domain-specific or neglected important aspects such asmultimodal perception or emotional learning.
34

3.5. Affective Computing
Recent researchers approach the topic from neuroscience by inspiring their mod-els on how the human brain processes and interprets emotions [45, 251, 196], andfrom the recent findings of psychology, especially on the emotional learning andbehavior. These models can deal with complex tasks, such as recognition of emo-tions in the wild, but also the use of emotional concepts to improve communicationand learning in artificial systems.
In the next sections, the most relevant of these approaches, models and systemsare presented and discussed.
3.5.1 Emotional Descriptors
Early works on automatic emotion recognition systems proposed the use of descrip-tors [62, 90, 230] to model the expression, and mostly stochastic [241] or rule-basedclassifiers [192] to label it. The contributions of these works are on representingemotion expressions, and most of them were based on Ekman’s assumption ofuniversal emotions.
Most of the early works dealt with two separately streams: face expressionsand speech. These works applied different feature descriptors in a way to describean expression. Most of these feature descriptors were based on general imagedescriptors, when applied to face expressions, or general sound descriptors, whenapplied to speech. A review of the field from Chellappa et al. [44] exhibits a broadrange of different methods used to recognize faces and shows that most works werestill at an early stage and not close to being used in real-world scenarios.
In early research, some common methods for face expression recognition involvethe use of motion descriptors [152, 89] and template matching [20]. All these workswere computationally expensive, not able to deal with real-time processing, andhad problems with generalization. For example, if the pictures were captured underdifferent lighting condition or from different persons, these models did not showgood performance.
Some of the works for face expression, however, were inspired by the psycho-logical studies of Ekman and Friesen and the FACS system was used as inspirationfor many computational models [90, 191, 51]. These models use mostly template-matching approaches to identify the Action Units (AUs) in a person’s face and usesimple rule-based classifiers [51] or even simple neural networks [257] to identifythe expressions.
The works using the FACS models solved a big problem in the field: they couldrecognize expressions with a fair degree of generalization based on the evidenceof Ekman’s research. However, these models faced a new problem: they hadto identify and describe, perfectly, the AUs, otherwise the classification would notwork due to the fact that similar AUs are involved in completely different emotions[191].
Several approaches proposed better ways to map the AUs, including the tempo-ral analysis of the face movement [224], geometric deformation analysis [167], andprofile contour analysis [225]. These methods are strongly dependent on the AUsto describe expressions and were able to identify dynamic and static ones. Cowie
35

Chapter 3. Towards Emotional Behavior and Affective Computing
et al. [57] exhibit different solutions for identifying and describing the AUs, anddiscuss how effective they are for generalizing the expression for different persons.
The use of explicit descriptors, mostly related to FACS, introduced an increaseof studies for automatic emotion recognition systems. However, the FACS model,and models based on common explicit descriptors show a big problem: it is difficultto represent spontaneous expressions with them [86, 307]. The purpose of FACSis to describe muscle movements and classify them into emotional concepts. How-ever, emotion expressions are spontaneous, and different persons will express thesame emotional concept in different ways. The works based on FACS and explicitdescriptors cannot deal with this nature, and are mostly used for basic emotionrecognition, such as the six universal emotions [290].
In the past decade, the introduction of Convolutional Neural Networks (CNNs),among other deep learning models, provided an important evolution on imagerecognition tasks. Such models use the concept of implicit feature descriptors toclassify complex images. Instead of using a set of pre-defined descriptors, CNNslearn a particular descriptor which will perform best on the classification taskwhich it was applied. This was shown to be efficient in several different imagerecognition tasks [171, 151, 146].
Given the success of CNNs in several different tasks, it was largely appliedfor emotion recognition tasks [94, 209, 149], showing an improvement on general-ization. Different architectures were applied for different tasks. Fasel et al. [94]propose an architecture which is head-pose invariant. Their model evaluates aCNN trained with different expressions presented with different head-poses andthis model was able to generalize the learned features for different subjects.
In the approach of Matsugu et al. [209], they use a rule-based mechanismin between the convolution layers to improve the generalization of the detectedfeatures. This rule-based mechanism identifies if the learned features are relatedto different face structures, such as eyes or mouth, and use this information to applya selective mask in the filters. This is used to create a face detection mechanism,firstly, and then to identify face expressions. They show that their system increasesthe recognition of the six basic emotions when compared to common FACS-basedsystems.
Karou et al. [149] use a combination of general and specific convolution chan-nels to recognize emotions in videos. Their architecture has different training steps,first based on general image descriptors, and later on specific emotion expressions.They use a video aggregation scheme to recognize emotions in a sequence, whereN-frames are aggregated in one representation by summing the frames’ own rep-resentations. They show that their network could be used in real-life emotionrecognition tasks by using their model to recognize emotions in movies and seriesclips.
The use of CNNs to describe facial emotions showed also a big improvementfor spontaneous expressions recognition [302, 186, 283]. Although using CNNs,these works rely on heavily pre-processed data [302], complex tree and rule-baseddescriptors identification [186] or even in different explicit feature descriptors usedto complete the final facial representation [283].
36

3.5. Affective Computing
Although the use of CNNs to learn face expressions presented a better per-formance when compared to FACS-based systems, recent studies show a certaincorrelation on what the network learns and the AUs of the FACS, as presentedby Khorrami et al. [154]. In their work, they discuss that the learned featuresof a CNN trained with facial expressions approximate some AUs, showing thatthe network actually learns how to detect AUs without any pre-defined rule. Thisshows that the FACS system could be limiting the recognition of spontaneous ex-pressions, however, describing expressions with muscular movements show to be arobust facial expression descriptor.
Similarly as facial expressions, the development of auditory emotional descrip-tors evolved in the past decades from explicit descriptors [64] to implicit ones[1]. The FACS system does not have any auditory emotional description, whichled to a wide range of different descriptors and acoustic models used in emotionrecognition.
Most of the works on speech emotion recognition are based on popular auditorydescriptors, which were mostly developed to describe the human voice. Early worksused a combination of simple acoustic descriptors [230], such as vocal energy, pitch,speech rate, among others to identify mostly the six universal emotions. Thesemodels rely heavily on a very clean input data, mostly an expression of a word ora short sentence.
Different kinds of descriptors were developed and applied to speech recognition.The most successful were the ones based on the Mel Frequency Cepstral Coefficients(MFCC), which proved to be suitable for speech representation [264]. MFCCs aredescribed as the coefficients derived from the cepstral representation of an audiosequence, which converts the power spectrum of an audio clip into the Mel-scalefrequency. The Mel scale was shown to be closer to human auditory system’sresponse than the linear frequency.
Each auditory feature descriptor carries its own information, changing the na-ture of the audio representation. For the same clip of sounds, very distinct infor-mation can be extracted for different tasks. Thus, Madsen et al. [203] use a setof three different descriptors, namely chroma features, loudness, and MFCC, torepresent distinct auditory information. They also obtain different temporal/non-temporal representations for each descriptor, using sliding windows for discreterepresentations or Hidden Markov Models for temporal dependencies. A total of83 feature representations is obtained. After the feature extraction, they use a hi-erarchical non-parametric Bayesian model with a Gaussian process to classify thefeatures. They show that their approach has a certain degree of generalization, butthe exhaustive search for tuning each parameter of the model for multiple featurerepresentations and feature combinations is not a viable option.
Similar to the work of [203], several approaches [251, 147, 195] use an extensivefeature representation strategy to represent the audio input: they extract severalfeatures, creating an over-sized representation to be classified. The strength ofthis strategy relies on redundancy. The problem is that usually, it is not clear howwell each of these descriptors actually represents the data, which can lead to notcapturing the essential aspects of the audio information, and decreasing the gener-
37
Chapter 3. Towards Emotional Behavior and Affective Computing
alization capability [134]. The use of over-sized auditory feature representations isthe focus of heavy critics [307, 87] because of the incapability of these descriptorsto describe the nuances of emotion expressions in speech.
In a similar way as facial expressions, implicit descriptors methods, mostlyCNNs, were used recently to describe emotions in human speech [138, 204]. Thesesystems use a series of pre-processing techniques to remove mostly the noise of theaudio signal, and let the CNN learn how to represent the data and classify it inemotion concepts [264]. In this strategy, the CNN is able to learn how to representthe auditory information in the most efficient way for the task. Initial research wasdone for music [190], and speech recognition [272] and was shown to be successful inavoiding overfitting. The problem with this approach is that it needs an extensiveamount of data to learn high-level audio representations, especially when appliedto natural sounds, which can include speech, music, ambient sounds and soundeffects [65].
Although there are models to describe systematically the emotional componentsin speech [56], there is no consensus on how to identify affective components in ahuman voice, and thus the evolution of emotional auditory descriptors is limitedand much more work is necessary.
Many other models which are not based on face expressions or speech wereproposed. The use of several physiological signals, coming from muscle movements,skin temperature, and electrocardiograms were investigated [236, 156, 155] anddelivered good performance, however, used uncomfortable and specific sensors toobtain the signals, not suitable for be used in real-world scenarios. Mechanismssuch as bracelets or localized electrodes were used.
In a similar approach, the use of Electroencephalogram (EEG) signals was usedas emotion descriptors [25, 194, 197]. Using non-invasive EEG mechanisms, thebrain behavior was captured when different emotion experiences were presented toa human. The initial results showed poor accuracy and generalization but openone new approach on emotion descriptors.
Another way to describe emotions is using body movement and posture. Thereare studies which show the relation between different body postures and movementswith emotional concepts [55], and even with micro-expressions [83]. Most of thecomputational models in this area use the body shape [43] or common movementdescriptors [40] to represent the expression and showed good accuracy and a certainlevel of generalization. However, the best performance used different sensors suchas depth cameras or gloves to capture the movements [158].
3.5.2 Emotion Recognition and Learning
Once the emotion expression is described, another problem arises: how to clas-sify them into emotional concepts. Many approaches deal with this problem byapplying general classification techniques such as ruled-based systems and treestructures [192], stochastic methods [241] or neural-based models [43].
Rule-based systems, as decision trees [184], were applied in many automaticemotion recognition systems. Many of them use strong descriptors, such as the
38

3.5. Affective Computing
FACS [192], and use if-then rules to identify emotion expressions. Such systemspresent a simple and efficient scheme to identify pre-defined expressions. Mostof these works are used to recognize the six universal emotions and usually doesnot show good generalization due to the fact that the emotional concepts mustbe very clearly separable and identifiable. Applications of such systems in speechemotion recognition delivered good performance when used in very restricted wordscenarios [301], however, achieved poor performance when used in more complexor natural cases, such as real-world interaction [68].
The models based on stochastic approaches usually deal with sequence prob-lems. Among these models, the ones based on Hidden Markov Models (HMM)became very popular in the last decades. Such models use different descriptorsto represent the expression and use them to feed one [193] or several HMMs [50].Each HMM introduces a sequence dependency processing, creating a Markovianchain that will represent the changes in the expression and use it to classify themas an emotional concept. Such models are very popular for speech emotion recog-nition, due to the good performance delivered in speech recognition tasks [173].The biggest problem with these models is that they are limited to the amount ofinformation they can learn, and they do not generalize well if new information ispresent. Also tend to be computationally expensive, especially for larger datasets.
Another popular method for emotion recognition are neural networks. Since thefirst approach in this field, neural networks have been used to recognize emotionalconcepts [159, 257]. These models are inspired by the human neural behavior,and were approached from very theoretical [105] to practical approaches [272].Neural networks were used as single-instance classifiers [141] to sequence processingand prediction, using recurrent neural networks [271]. These models tend to bemore complex to design and understand, and thus limit the implementation anddevelopment of applications. Usually, a large amount of data is necessary to trainneural networks, and generalization can be a problem for some architectures.
With the advance of deep learning networks, most of the recent work involvesthe use of neural architectures. The ones with the best performance and general-ization apply different classifiers to different descriptors [193, 45, 147], and there isno consensus on a universal emotion recognition system. Most of these systems areapplied to one-modality only and present a good performance for specific tasks.By using one modality, either vision or audition in most of the cases, these sys-tems create a domain-specific constraint and sometimes are not enough to identifyspontaneously and/or natural expressions [274].
Multimodal emotion recognition has been shown to improve emotion recog-nition in humans [35], but also in automatic recognition systems [118]. Usually,such systems use several descriptors to represent one expression and then one orseveral classifiers to recognize it [45]. Gunes et al. [118] evaluate the efficiency offace expression, body motion and a fused representation for an automatic emotionrecognition system. They realize two experiments, each one extracting specificfeatures from face and body motion from the same corpus and compare the recog-nition accuracy. For face expressions, they track the face and extract a series offeatures based on face landmarks. For body motion, they track the position of the
39

Chapter 3. Towards Emotional Behavior and Affective Computing
shoulders, arms and head of the subject and extract 3522 feature vectors, usingdozens of different specific feature extraction techniques. These feature vectors areclassified using general classification techniques, such as Support Vector Machinesand Random Forests. At the end, they fuse all feature vectors extracted from bothexperiments and classify them. The results obtained when fusing face and motionfeatures were better than when these modalities were classified alone.
The same conclusion was achieved by Chen et al. [45]. They apply a series oftechniques to pre-process and extract specific features from face and body motion,similarly to Gunes et al. Differences are that they use fewer features in the finalrepresentation and the time variance representation is different in both approaches.Gunes et al. use a frame-based-classification, where each frame is classified indi-vidually and a stream of frames is later on scored to identify which emotionalstate is present. Chen et al. analyze two temporal representations: one based ona bag-of-words model and another based on a temporal normalization based onlinear interpolation of the frames. Both approaches use the same solution basedon manual feature fusion, which does not take into consideration the inner corre-lation between face expression and body motion, but fused both modalities usinga methodological scheme.
The observation of different modalities, such as body posture, motion, andspeech intonation, improved the determination of the emotional state of differ-ent subjects, increasing the generalization of the models. This was demonstratedin the computational system of Castellano et al. [43], where they process facialexpression, body posture, and speech, extracting a series of features from eachmodality and combining them into one feature vector. Although they show thatwhen different modalities are processed together they lead to a better recognitionaccuracy, the extraction of each modality individually does not model the correla-tion between them, which could be found when processing the modalities togetheras one stream.
The same principle was also found for visual-only modalities [118, 45], andaudio-only modalities [251, 147, 195]. However, all these works deal with a set ofrestricted expression categorizations which means that if a new emotion expressionis presented to these systems, they must be re-trained and a new evaluation andvalidation of the whole system need to be done.
3.6 Summary on Emotion Learning and Affec-
tive Computing
Many types of research were done on understanding how emotions affect humanson many different levels. From neural modulation in perception and learning sys-tems to behavioral aspects of emotional concepts and affective computing, themost important notions and methods were discussed in this chapter. In each ofthese areas, different researchers discussed, proposed and described many differentmechanisms, models, and theories, and yet we are far from a unified model of emo-
40

3.6. Summary on Emotion Learning and Affective Computing
tions. This can be explained by the wide range of systems and mechanisms wereemotions have an important role, and thus indicates how important is to continueunderstanding and to research in the field.
This chapter also presented an overview of several approaches and models fordifferent emotional tasks in affective computing. Although these models offer so-lutions for various tasks, none of them led to an integrative solution for emotionrecognition, processing, and learning, which is the primary focus of this thesis.Inspiring some solutions present in our models in the neural-psychological mech-anisms presented in this chapter allows us to address important aspects of ourresearch questions, and contribute to the field of affective computing.
41

Chapter 3. Towards Emotional Behavior and Affective Computing
42

Chapter 4
Neural Network Concepts and
Corpora Used in this Thesis
This chapter discusses the most important neural network concepts and techniquesused for the development of the models proposed in this thesis. The techniquesare exhibited in their original models and any necessary modification is indicatedin each of the model’s own chapters.
To evaluate the proposed models a number of different corpora are necessaryand hey are described in section 4.6. During the execution of this work, a newcorpus was recorded and all details involving the design, collection and analysis ofthe recorded data is presented in section 4.7.
4.1 Artificial Neural Networks
Artificial Neural Networks (ANNs) are computational models which are inspiredby the behavior of the neurons. The first of these models was the perceptron [256],which simulates a single neuron and it is the elemental computing unit of an ANN.The perceptron consists of a weight vector (w), representing synaptic connections,that is multiplied by the input signal (x) and a bias unit (b), which usually hasa value of −1. The values resulting from this operation are then summed. In thelast step, these summed values are fed as input to an activation function(y), alsoknown as a transfer function, which will produce the output signal (o). Figure 4.1illustrates the structure of a perceptron unit.
Stacking several perceptron units together in one layer and connecting thesestacks sequentially, without connections between the neurons in the same layer,produces what is known as a multilayer perceptron (MLP) neural network. TheMLPs are the main component of most of the neural networks applications, andwere applied to several different tasks in the past 60 years. Figure 4.2 illustratesthe high-level common architecture of an MLP. Each neuron in an MLP is usuallyfully connected with all the neurons in the next layer, with its own set of weights.The first layer of an MLP is usually the input signal and the last layer is calledoutput layer. The layers between the input and output layers are called hidden
43

Chapter 4. Neural Network Concepts and Corpora Used in this Thesis
Figure 4.1: Perceptron illustration, representing the input signal (x), the weights(w), the activation function (y) and the output signal (o).
Figure 4.2: Multilayer perceptron illustration. Each layer contains several percep-tron units, which are then connected to units in the subsequent layer.
layers, because its representation is not known and not important for the networkdesigner.
The knowledge of ANNs is stored directly in its weights. Their weights rep-resent the transformation of certain patterns in the input signal into a processedrepresentation, which can be related to another concept, as for example in a clas-sification task. This means that ANNs can be trained to create a separation spacebetween the input signal and the desired output concept. Depending on the waythe network is designed, it can be tuned to create different representations fordifferent parts of the input stimuli, or integrate several different stimuli into onesingle representation.
The idea of using several ANNs to solve a complex task is somehow an abstractmethod inspired by how information is processed in brain circuits. Because of that,the ANNs have similar properties to the brain’s neural circuits, such as being ableto have parallel processing, adaptation over time, be robust against noise, andmost importantly, being capable of generalizations.
44

4.2. Supervised Learning with Backpropagation
An ANN can be trained to adapt its weights to a task. The parameters suchas the weights, the number of layers, the number of units, the activation functionamong others can be chosen or updated by certain rules in order to obtain anexpected result. The automatic update of these parameters, mostly the connectionweights, give the network the power to learn and thus adapt to the problem it wasapplied to.
There are many learning strategies that can be used to adapt, or train, theweights of an ANN. These strategies can be separated into two categories: super-vised and unsupervised methods [199]. A supervised strategy uses the concept of ateacher, which will guide the ANN during the training. This teacher will indicateto the ANN how the task has to be done by updating the weights based on theerror between the current network output and the desired output. In this strategy,the teacher knows what the outputs are which the network should learn.
On the other hand, the unsupervised strategy has no teacher. This strategy re-lies on an underlying probabilistic distribution of the data to update the weights.The unsupervised strategies are used mostly to create an ANN capable of de-scribing the data, reduce the dimensionality and complexity of the problem or toincrease generalization.
4.2 Supervised Learning with Backpropagation
Backpropagation [259] is one of the most used supervised learning strategies fortraining multilayer perceptron networks. It became so popular because of twocharacteristics: the simplicity of the concept and the efficiency in the tasks it wasused for so far.
The main idea of backpropagation is to minimize the error E between thenetwork output and the desired output, also known as target or teaching signal,t. The algorithm updates the weights of the neuron connections, and thereby triesto minimize E. The most common way to calculate the error E is through thesum-of-squares error function. Each output unit (k) error is summed into one valueusing the following rule:
E =1
2
n∑
k=1
(tk − yk)2 (4.1)
where the factor 1/2 is used to simplify the computation and has no major effecton learning [199]. After calculating the error, each unit has its weights updatedusing the following rule:
wt+1 = wt − η∂E
∂wt
(4.2)
where wt+1 is the updated connection or weight, wt is the current value of theweight, and η is the learning rate, a parameter which modulates learning speed.∂E∂w
represents the change of the error with respect to the weight wt.
45

Chapter 4. Neural Network Concepts and Corpora Used in this Thesis
The error is then backpropagated through the entire network, and the layersare updated in relation to the connections in the previous layer. As an exampleof this operation, imagine a network with the same structure as the one in Figure4.2: one input layer, one hidden layer and one output layer. The activation of eachoutput unit (Y 3
k ) can be calculated as:
Y 3k = f
(
∑
j
wjkY2k
)
(4.3)
where Y 2k represents the activation of the k−th unit in the 3rd layer, wjk is the
connection weight between the k-th unit in the current layer and the j-th unit inthe previous layer. Because the error calculation shown in Equation 4.1 dependson the derivative of the error, the activation function f needs to be differentiable.
In the same way, we can calculate the activation for each unit in the hiddenlayer (Y 2
k ):
Y 2k = f
(
∑
j
wijxi
)
(4.4)
where wij represents the connection of each j-th unit in the hidden layer with thek-th unit in the input layer, and xi is the i-th input unit.
To proceed with the weight updated in the output layer, we have to calculate∂E∂wjk
. To do that, we derive the Equation 4.1 after we replace the network output
yk by Equation 4.3. Applying the chain rule we obtain:
∂E
∂wjk
=∂E
∂Y 3k
∂Y 3k
∂wjk
=(
tk − Y 3k
)
f′
(
∑
l
wlkY2l
)
Y 2j (4.5)
The same rule can be applied to calculate the derivative of the weights in thehidden layer, just replacing Y 2
j in Equation 4.5 by Equation 4.4.Theoretically, backpropagation could be used to update any network indepen-
dent of the number of layers, although a network with two hidden layers is enoughto approximate any function with arbitrary accuracy [199]. Important to notethat backpropagating the error rapidly becomes ineffective to update the weightsin deep multilayer perceptrons, especially in the layers closer to the inputs [179],which is referred as vanishing or exploding gradient problem. This happens be-cause the derivative of the cost function in the first layer is lower than in a deeperlayer, and the contribution of the error for each weight connection is reduced. Toimprove the capability of backpropagation to train arbitrary networks, some regu-larization techniques are used. In the next sections the L1 and L2 normalization,momentum and dropout techniques will be explained.
4.2.1 L1 and L2 Regularization
Regularizing the weights during network training helps to avoid problems suchas the exponential decrease or increase of the error gradient. Regularization also
46

4.2. Supervised Learning with Backpropagation
prevents that the weights memorize the input data, which is known as overfitting.An ANN should be able to process data which was never presented to it duringthe training, generalizing its knowledge to new information, so a network that justmemorizes the training data is not ideal.
The L1 and L2 regularization rules add terms to the weights updated in orderto avoid them to memorize the data. The difference between the L1 and L2 ishow these added terms are calculated. For L1, the sum of the weights is used tocalculate the regularization term. Adding the L1 regularization term to the weightupdated rule represented in Equation 4.2 can be expressed as:
wt+1 = wt − η∂E
∂wt
+ λi∑
k
‖wt‖ (4.6)
where λ represents a parameter which controls the relative importance of the reg-ularization term. The L2 regularization term can be defined as the sum of thesquare of the weights, and in a similar way as in Equation 4.6, it can be expressedas:
wt+1 = wt − η∂E
∂wt
+ λ
i∑
k
w2t (4.7)
4.2.2 Momentum Term
The backpropagation algorithm is used to train the network and minimize the error,trying to find the global minimum of the function. The global minimum is theoptimal value of the weights which will produce the minimal error, independent ofthe inputs. Finding the global minimum is difficult most of the time, and becauseof the nature of the backpropagation, the algorithm can be stopped by what isknown as local minimum. The local minimum is an intermediate solution, whichminimizes the error of the network but not optimally.
To avoid local minima is a very difficult task, and it can be achieved by usingdifferent regularization techniques, changing the network topology or preprocessingthe data, among other solutions. To help the network to avoid local minimum,several algorithms are proposed, including the momentum term. This algorithm isprobably the most used one to avoid local minima and produces good results formost of the applications.
The concept behind the momentum term is that, to avoid local minima, theupdate of the weights should be enhanced when the update is larger. This algo-rithm introduces an effect that increases the size of the weight change when thegradient keeps pointing the same direction, making the weight change faster whenthe network is following an optimization path. On the other hand, when the di-rection of the gradient keeps changing, the momentum term will smooth out thevariation. This property helps when the network finds several local minima, whichwill change the direction of the error. We can update Equation 4.2 to add themomentum term and express it as:
47

Chapter 4. Neural Network Concepts and Corpora Used in this Thesis
Figure 4.3: Illustration of the dropout algorithm applied to Figure 4.2 during onetraining cycle. It is possible to see that some of the neurons have dropped outduring the training, reducing the number of connections.
wt+1 = wt − η∂E
∂wt
+ µwt (4.8)
where µ represents the momentum term, which should be larger than 0 and smallerthan 1. The momentum term adds a fraction of the previous weight value to thecurrent update.
4.2.3 Dropout
Deep MLPs tend to overfit easily. Because of the many numbers of weights toupdate, the network usually ends up memorizing the data instead of generalizing.A way to prevent this is using the algorithm known as dropout [134]. The dropoutalgorithm tries to prevent the co-adaptation of the weights of the network to thetraining data by omitting some units in the hidden layers during training.
The algorithm follows the concept that whenever a training sample is presentedto the network, each hidden unit has a chance of been turned off. That means thatall the connections to this unit and departing from this unit are also turned offalong with it. This behavior is temporary, and it is only valid for one trainingcycle. That is achieved by using a probability of dropping out for a unit, which isusually around 50% [134]. Figure 4.3 illustrates the architecture depicted in Figure4.2 when dropout is used during one training cycle. Note that for each trainingcycle, a different set of neurons can be dropped out, meaning that for each trainingcycle a different sub-set of neurons is trained.
Dropout could be compared to training a lot of different neural networks withinthe same training cycle. The difference is that, training and testing many differentnetworks would be very expensive, and they would be completely independentof each other. What dropout does is that a new subset of the neural network istrained during every training cycle, however, the units in this subset can be presentin another subset.
48

4.3. Unsupervised Learning with Hebbian Learning
The resulting effect of dropout is that the training time of the network willincrease, but also improve the generalization. By training the hidden units withdifferent input units, the algorithm is making that specific unit robust to differentinput data entirely. The dropout gives each hidden unit a robustness againstincomplete or useless information, and also avoids that the unit memorizes theinput data.
Computationally speaking, dropout can be seen as a mask applied to the net-work topology. Giving the activation function described in Equation 4.4, dropoutcould be expressed as:
Y 2k = d ∗ f
(
∑
j
wijxi
)
(4.9)
where d is a binary mask filled with zeros and ones which are randomly distributedin a way that summed they reach the dropout probability factor. The mask d isused only when training the network, and for every training cycle the values ofd are recalculated. When using the network for classification tasks, the mean ofthe network topology is used. The mean is calculated over all the hidden units,however, it has to compensate for the fact that during testing roughly twice asmany hidden units is used because of the dropout probability factor of 50%. Inthis case, the weights are then divided by 2.
4.3 Unsupervised Learning with Hebbian Learn-
ing
The concept of unsupervised learning differs most from supervised learning in oneproperty: the absence of a teacher. In the supervised learning techniques, it is nec-essary to update the network related to an error which is calculated by comparingthe network output with the desired output. On the other hand, unsupervisedapproaches use the data’s own distribution to update the network. In other words,the network learns how to update itself based on the data it is receiving.
One of the most popular and efficient unsupervised approaches is HebbianLearning [129]. Hebbian learning is a simple, but powerful mechanism to encodethe input stimulus in a way that resembles memory formation and associativelearning in the brain.
The idea behind the Hebbian learning is that neurons which encode similarinformation will fire at the same time. That means that the update of the weightsof each neuron is proportional to the difference between the input stimuli and theneuron information. This can be expressed with the following rule:
wt =
{
Wt−1 + εYtYr , ifas > a,
Wt−1 otherwise,
}
(4.10)
where wt is the weight update, ε is the learning rate Yt is the activation of the
49

Chapter 4. Neural Network Concepts and Corpora Used in this Thesis
current unit, and Yr the activation of a similar unit, and a the mean activation ofthe current layer.
4.4 Convolutional Neural Network
A Convolutional Neural Network (CNN) is composed of several layers of convo-lution and pooling operations stacked together. These two operations simulatethe responses of simple and complex cell layers discovered in visual cortex areaV1 by Huben and Wiesel [139]. In a CNN, the abstraction of the simple cells isrepresented by the use of convolution operations, which use local filters to computehigh-level features from the input stimuli. The pooling operation creates a higherlevel of abstraction of the complex cells and increases the spatial invariance of thestimuli by pooling simple cell units of the same receptive field in previous layers.
Every layer of a CNN applies different filters, which increases the capabilityof the simple cells to extract features. Each filter is trained to extract a differentrepresentation of the same receptive field, which generates different outputs, alsoknown as feature maps, for each layer. The complex cells pool units of receptivefields in each feature map. These feature maps are passed to another layer of thenetwork, and because of the complex cells’ pooling mechanism, each layer appliesa filter in a receptive field which contains the representation of a larger regionof the initial stimuli. This means that the first layer will output feature mapswhich contain representations of one region of the initial stimuli, and deeper layerswill represent larger regions. At the end, the output feature map will contain therepresentation of all stimuli.
Each set of filters in the simple cell layers acts in a receptive field in the inputstimuli. The activation of each unit ux,y
n,c at (x,y) position of the nth feature mapin the cth layer is given by
ux,yn,c = max (bnc + S, 0) , (4.11)
where max(·, 0) represents the rectified linear function, which was shown to bemore suitable than non-linear functions for training deep neural architectures, asdiscussed by [108]. bnc is the bias for the nth feature map of the cth layer and Sis defined as
S =M∑
m=1
H∑
h=1
W∑
w=1
whw(c−1)mu
(x+h)(y+w)(c−1)m , (4.12)
where m indexes over the set of filters M in the current layer, c, which is connectedto the input stimuli on the previous layer (c-1). The weight of the connectionbetween the unit ux,y
n,c and the receptive field with height H and width W of theprevious layer c− 1 is whw
(c−1)m. Figure 4.4 illustrates this operation.A complex cell is connected to a receptive field in the previous simple cell, re-
ducing the dimension of the feature maps. Each complex cell outputs the maximumactivation of the receptive field u(x, y) and is defined as:
50

4.4. Convolutional Neural Network
Figure 4.4: Illustration of the convolution process. Each neuron u is connected toa receptive field in the input stimuli by a set of weights w, which represents thefilters, and is affected by a bias b, which is the same for all the filters in the samelayer. Each filter produces a feature map, composed of several neurons which arethen passed to the next layer.
aj = maxn×n (un,c(x, y)) , (4.13)
where vn,c is the output of the simple cell. In this function, a simple cell computesthe maximum activation of the receptive field (x, y). The maximum operationdown-samples the feature map, maintaining the simple cell structure. Figure 4.5illustrates this operation.
Figure 4.5: Illustration of the pooling process. Each unit of the complex cell isconnected to a receptive field of the feature map, and applies a maximum operation,resulting in one activation per receptive field.
4.4.1 Cubic Receptive Fields
In a CNN, each filter is applied to a single instance of the stimuli and extractsfeatures of a certain region. This works well for an individual stimulus, but doesnot work when a certain sequence dependency is necessary, as in the cases ofgestures, speech or even emotion expressions. In this case, if the filter extracts the
51

Chapter 4. Neural Network Concepts and Corpora Used in this Thesis
same features in each snapshot of the sequence, it will not take into considerationthat a hand is moving towards one direction, or that a smile is being displayed.
To introduce sequence dependency cubic receptive fields are used [146]. In acubic receptive field, the value of each unit(x,y,z) at the nth filter map in the cthlayer is defined as:
ux,y,zn,c = max(bnc + S3, 0) (4.14)
where max(·, 0) represents the rectified linear function, bcn is the bias for the nthfilter map of the cth layer, and S3 is defined as
S3 =∑
m
H∑
h=1
W∑
w=1
R∑
r=1
whwr(c−1)mu
(x+h)(y+w)(z+r)(m−1) , (4.15)
where m indexes over the set of feature maps in the (c-1) layer connected to thecurrent layer c. The weight of the connection between the unit (h,w,r) and areceptive field connected to the previous layer (c − 1) and the filter map m iswhwr
(c−1)m. H and W are the height and width of the receptive field and z indexeseach stimulus; R is the number of stimuli stacked together representing the newdimension of the receptive field.
Figure 4.6: Illustration of the cubic convolution process. Different from the com-mon convolution, each neuron u is connected to a receptive field in all of the stimuliat the same time. This way, each neuron has R filters represented by the weightsw, where R is the number of input stimuli.
4.4.2 Shunting Inhibition
To learn general features, several layers of simple and complex cells are necessary.Which leads to a large number of parameters to be trained. This, put togetherwith the usual necessity of a large amount of data, which is one of the requirementsfor the filters to learn general representations, is a big problem shared among deepneural architectures. To reduce the necessity of a deeper network, we introduce
52

4.4. Convolutional Neural Network
the use of shunting inhibitory fields [99], which improves the efficiency of the filtersin learning complex patterns.
Shunting inhibitory neurons are neural-physiological plausible mechanisms thatare present in several visual and cognitive functions [113]. When applied to com-plex cells, shunting neurons can result in filters which are more robust to geometricdistortions, meaning that the filters learn more high-level features. Each shunt-ing neuron Sxy
nc at the position (x,y) of the nth receptive field in the cth layer isactivated as:
Sxync =
uxync
anc + Ixync(4.16)
where uxync is the activation of the common unit in the same position and Ixync is
the activation of the inhibitory neuron. The weights of each inhibitory neuron aretrained with backpropagation. A passive decay term, anc, is a defined parameterand it is the same for the whole shunting inhibitory field. Figure 4.7 illustratesshunting neurons applied to a complex cell layer.
Figure 4.7: Illustration of the shunting inhibitory neuron in complex cells. Eachneuron u has an inhibitory neuron, I, attached to it. Each inhibitory neuron hasits own set of weights, that connect the inhibitory neuron to the common neuron,and a passive decay a, which is the same for all the neurons in a layer.
The concept behind the shunting neurons is that they will specify the filtersof a layer. This creates a problem when applied to filters which extract low-levelfeatures, such as edges and contours. When applied to such filters, the shuntingneurons specify these filters causing a loss on the generalization aspects of the low-level features. However, when applied to deeper layers, the shunting neurons canenhance the capability of the filters to extract strong high-level representations,which could only be achieved by the use of a deeper network.
4.4.3 Inner Representation Visualization in CNNs
CNNs were successfully used in several domains. However, most of the work withCNNs does not explain why the model is so successful. As CNNs are neuralnetworks that learn a representation of the input data, the knowledge about what
53

Chapter 4. Neural Network Concepts and Corpora Used in this Thesis
the network learns can help us to understand why these models perform so wellin different tasks. The usual method to evaluate the learned representations ofneural networks is the observation of the weights matrices, which is not suited forCNNs. Each filter in the convolution layers learns to detect certain patterns inthe regions of the input stimuli, and because of the pooling operations, the deeperlayers learn patterns which represent a far larger region of the input. That meansthat the observation of the filters does not give us a reliable way to evaluate theknowledge of the network.
Zeiler and Fergus [306] proposed the deconvolutional process, which helps tovisualize the knowledge of a CNN. In their method, they backpropagate the acti-vation of each neuron to an input, which helps to visualize which part of the inputthe neurons of the network are activated for. This way, we can determine regionsof neurons that activated for similar patterns, for example, neurons that activatefor the mouth and others for the eyes.
In the deconvolution process, to visualize the activation of a neuron a in layerl (al), an input is fed to the network and the signal is forwarded. Afterward,the activation of every neuron in layer l, except for a, is set to zero. After that,each convolution and pooling operation of each layer are reversed. The reverse ofthe convolution, named filtering, is done by flipping the filters horizontally andvertically. The filtering process can be defined as
Sf =M∑
m=1
H∑
h=1
W∑
w=1
wfhw(c−1)mu
(x+h)(y+w)(c−1)m , (4.17)
where wfhw(c−1)m represents the flipped filters.
The reverse of the pooling operation is known as unpooling. Zeiler and Fergus[306] show that it is necessary to consider the position of the maximum values inorder to improve the quality of the visualizations, so these values are stored duringthe forward-pass. During the unspooling, the values which are not the maximumare set to zero.
Backpropagating the activation of a neuron will cause the reconstruction of theinput in a way that only the region which activates this neuron is visualized. OurCNNs use rectified linear units, which means that the neurons which are activatedoutput positive values, and zero represents no activation. That means that in ourreconstructed inputs, bright pixels indicate the importance of that specific regionfor the activation of the neuron.
In a CNN, each filter tends to learn similar patterns, which indicates thatthose neurons in the same filter will be activated to resembling patterns. Also,each neuron can be activated for very specific patterns, which are not high-levelenough for subjective analysis. To improve the quality of our analysis, we applythe concept of creating visualizations for all neurons in one filter, by averaging theactivation of each neuron in that filter. That allows us to cluster the knowledge ofthe network in filters, meaning that we can identify if the network has specializedfilters and not specialized neurons. Also, visualizing filters on all layers help us tounderstand how the network builds the representation and helps us to demonstrate
54

4.5. Self-Organizing Maps
Figure 4.8: For an input image containing a face, it is possible to see the applicationof different filters. The filters themselves do not contain any information, but byvisualizing the activation of the neurons it is possible to identify patterns like eyesand mouth, in the first layer, and a full face representation in the second layer.
the hierarchical capabilities of CNNs.To demonstrate the advantages of the visualizations, Figure 4.8 illustrates ex-
amples of filters, single neurons and mean of filter visualizations. It is possible tosee that the filters themselves do not contain any indication about what stimulistructure the neurons activated for. The neuron activation gives us a rough indi-cation of which regions of the image the neuron activated for, but still the conceptis too abstract, especially in the first layers. The visualization by mean of neuronsin a filter allows us to cluster the representation of similar neurons, and with that,we can see regions of interest. It is possible to see that each layer of the networkbuilds a different representation, starting with very simple edges and contours,going to mouth and eyes and finally a full face representation.
The visualizations are a very powerful tool that helps us to have an importantinsight about the knowledge learned by the network. With them, we can validatethe parameters of our model, understand what the model learns and illustrate theadvantages of using concepts such as the inhibitory fields and the cross-channels.We also use the visualizations to illustrate which are the most important features,from the network’s perspective, for emotion expression, and how they are combinedin different modalities.
4.5 Self-Organizing Maps
Self-Organizing Maps (SOMs) [163] are artificial neural networks which use un-supervised learning techniques to represent the input data in a low-dimensionalspace. The SOM is usually represented as a grid of neurons which are fully con-nected with the input data, and through a competitive mechanism, encode thestimuli. The concept behind the SOM is that each neuron encodes a differentinput representation, and neighbor neurons have a similar encoding. Thus, it ispossible to represent the high-dimensional input stimuli using the 2D projection
55

Chapter 4. Neural Network Concepts and Corpora Used in this Thesis
of the SOM’s topology.The training of the neurons in the SOM rely heavily on the Hebbian learning
structure, where neurons which are neighbors fire together and thus should beupdated toward the same goal. The neurons in the SOM are fully connected withthe input data, so each neuron will be updated to resemble one or a set of inputstimuli which are closely related.
The SOM uses a competitive learning mechanism based on the Euclidean Dis-tance. After a random initialization of the neurons, one sample is presented to thenetwork. The distance between the input sample and the neurons is calculated,and the unit which has the smaller distance is selected. This unit is commonlyknown as the best matching unit (BMU). During the update cycle, only the weightsof the BMU and the neurons neighboring this unit are adjusted using the inputstimuli as the goal. The update rule for the neuron in the SOM can be expressedas:
wt = wt−1 + θ(b, n)α(x− wt), (4.18)
where wt is the updated weight of the current unit, wt−1 is the current weight,θ(b, n) is the neighboring function between the current unit, n and the BMU b, αis the learning coefficient, a parameter which decreases during training, and x isthe input. This function calculates the distance between the current unit and theBMU, and can be implemented in several different ways. The most common oneis to define the function as 1 if the neuron is adjacent to the BMU and 0 if not.
During training, it is possible to see an emerging effect: some neurons will beupdated to reflect the distribution of the input data. This effect forms a cluster,where certain regions in the SOM can be associated with certain concepts in theinput data distribution. For example, if the SOM is being used to classify humanfaces, it is possible to cluster male and female faces in different places of thegrid. Figure 4.9 illustrates a SOM connected to the input layer, the BMU and theclustering effect which is represented by different colors in the SOM structure.
4.5.1 Growing When Required Networks
The Growing When Required (GWR) [206] networks are an extension of SOMswhich does not have the concept of a 2D grid in the neuron’s distribution. Ina SOM the neurons are constructed in a way that they are disposed of in a 2Dstructure, where each neuron has a known number of neighbors. The number ofneurons and their disposition in the grid is one of the decisions that should bemade before starting to build the SOM. That gives the model the capability toreduce the dimensionality of the input data but restricts the network with respectto the amount of information it can learn.
The GWR was proposed to solve the fixed topology problem in the SOM. Inthis model, neurons are added only when necessary, and without any pre-definedtopology. This allows this model to have a growing mechanism, increasing and de-creasing the number of neurons, and their positions, when necessary. This makes
56

4.5. Self-Organizing Maps
Figure 4.9: Illustration of a SOM. The input is fully connected with all the SOMunits, and the best matching unit (BMU) is calculated. The different colors inthe grid indicate neurons which encode similar information, introducing the ideaof different clusters in the SOM.
the model able to represent data with an arbitrary number of samples and intro-duces the capability of dealing with novelty detection.
The neurons in the GWR have, besides the weight vector which connects theneuron to the input, the concept of edges. The edges connect the neurons, givingthem the concept of neighbors. This allows the model to grow to match thetopological distribution of the data, in contrary to the SOM which transforms thedata topology into a 2D topology.
Differently from a SOM, the GWR starts only with two neurons, which arecreated based on two random samples in the input data. Then, as more data ispresented to the network, the algorithm decides based on some constraints and theactivation behavior of each neuron when and where to add a new neuron. Thatmeans that the network can create different clusters of neurons, which representssimilar concepts, in different spatial regions. Imagine if you have a network trainedwith data representing two colors, blue and red, and suddenly a new color, green, ispresented. The network will decide to create a new region of neurons to representthe new color. Theoretically, there is no limit to adding new neurons, meaning thatthe network can learn an arbitrary number of new concepts. The edges maintainthe concept of similarity between the nodes, therefore clusters can have connectionsthrough edges, exhibiting that these clusters have certain properties in common.
To train this network, the main concept of the SOM training is kept: to finda BMU among the neurons in the model. The difference is that after finding theBMU, the activation of the BMU and its neighbors is calculated. In the GWRthe activation can be represented as a function applied to the distance betweenthe neurons and the input. Based on this distance, the network can identify if aninput is too far from the knowledge stored in the neurons of the network, if thatis the case, a new node is added and an edge between the closer node and the new
57

Chapter 4. Neural Network Concepts and Corpora Used in this Thesis
node is created.
Each of the nodes in the GWR is also equipped with a function to identify howoften it has fired, meaning how often the distance between the neuron and theinput was larger than a certain threshold. This mechanism modulates the creationof new nodes by creating a priority in updating neurons which have not been firedin a long time instead of creating new neurons. That gives the network a forgettingmechanism. This mechanism allows the network to forget useless information, thatmeans forget representations which are not important to represent the data.
Together with that, each edge has an associated age that will be used to removeold connections. That means that if a new cluster is created during training, andsuddenly is not related to the main neurons anymore, it should be deleted. In theend of each training iteration, the nodes without connections are removed. Thatmakes the model robust against outliers.
The behavior of the GWR when iterating over a training set shows the emer-gence of concepts. In the first epochs the network will have an exponential grow inthe number of neurons, but after achieving a topology that models the data, it willmostly converge. This behavior will change when a new set of training samplesis presented to the network. If that new set does not match with some particularregion of the network, the model will adapt around the new data distribution,forgetting and removing old neurons when necessary, and creating new ones. Thatgives the model a similar behavior found in the formation and storage of memoryin the brain.
Figure 4.10 illustrates a GWR in two different steps of training. In the left side,Figure 4.10a, it shows the GWR in the second training cycle. In this example,each dot represents a neuron, and the color of the neuron represents an emotionalconcept. The image on the right, Figure 4.10b shows the model after 100 trainingcycles are completed. It is possible to see that the network created a non-uniformtopology to represent the data. Also, it is possible to see that neurons with similarconcepts stay together, creating the idea of clusters. Also, it is possible to identifythat some emotional concepts, mostly the black ones, are merged with the others.The black concepts represent the neutral emotions, which are related to all othersin this example.
4.6 Corpora
Different corpora were used to evaluate the models proposed in this thesis as eachmodel has its own properties and necessities. All the corpora used are relatedto emotion expressions, however, differ on the data nature. While the bi-modalFAce and BOdy benchmark database (FABO) has visual expressions, the SurreyAudio-Visual Expressed Emotion (SAVEE) corpus has multimodal audio-visualexpressions. To evaluate the models using complex and real-world data, theEmotion-Recognition-In-The-Wild-Challenge dataset is used. This dataset con-tains excerpts from different movies, and its known to be one of the most challeng-ing corpora available.
58

4.6. Corpora
Figure 4.10: The neurons of a GWR during the training on emotional data, showedin the 2 first training cycles (a) and in the 100 first ones(b). Each color representsa different emotional concept associated with that neuron.
To evaluate the attention models proposed in this thesis, we introduce a newemotional attention corpus, based on the FABO dataset. This corpus containsdata used for emotional attention tasks, which are not present in the previouslymentioned datasets.
Most of the corpora used in training and evaluating affective computing modelsare related to single emotion expressions, and none contains data of Human-Robot-Interaction (HRI). To evaluate the capability of the models proposed in this thesisto cope with HRI scenarios a novel dataset, named KT Emotional InteractionCorpus, with emotional behavior observations was designed and recorded. Thiscorpus was designed to be challenging in different tasks: spontaneous emotionexpressions recognition, emotional attention identification, and emotional behavioranalysis.
The following sections detail the FABO and SAVEE corpus, the emotionalattention corpus and also the new KT Emotional Interaction Corpus.
4.6.1 Emotion Expression Corpora
The Bi-modal face and body benchmark database
For our experiments we use four corpora. The first one is the bi-modal FAce andBOdy benchmark database (FABO), introduced by Gunes and Piccardi [117]. Thiscorpus is composed of recordings of the upper torso of different subjects performingspontaneous emotion expressions. This corpus contains a total of 11 expressionsperformed by 23 subjects of different nationalities. Each expression is performedin a spontaneous way, where no indication was given of how the subject must per-
59

Chapter 4. Neural Network Concepts and Corpora Used in this Thesis
Figure 4.11: Examples of images with an angry expression in the FABO corpus.
Figure 4.12: Faces with an angry expression in the SAVEE corpus.
form the expression. A total of 281 videos were recorded, each one having 2 to 4of the following expressions: “Anger”, “Anxiety”, “Boredom”, “Disgust”, “Fear”,“Happiness”, “Surprise”, “Puzzlement”, “Sadness” and “Uncertainty”. Each ex-pression starts with a neutral phase, and continues until the apex phase, where theexpression is at its peak. We use the neutral phase for each expression to create a12th “Neutral” class in our experiments. Figure 4.11 illustrates images present ina sequence of an angry expression in the FABO corpus.
Surrey Audio-Visual Expressed Emotion
The second corpus is the Surrey Audio-Visual Expressed Emotion (SAVEE) Database,created by Haq and Jackson [123]. This corpus contains speech recordings from fourmale native English speakers. Each speaker reads sentences which are clusteredinto seven different classes: “Anger”, “Disgust”, “Fear”, “Happiness”, “Neutral”,“Sadness” and “Surprise”. These classes represent the six universal emotions withthe addition of the “Neutral” class Each speaker recorded 135 utterances, with 30representing “Neutral” expressions and 15 for each of the other emotions. All thetexts are extracted from the TIMIT dataset and are phonetically balanced. Eachrecording contains the audio and face of the participant, with facial markers. Themarkers are present to be used for systems that need them, and unfortunatelybelong to the image. Figure 4.12 illustrates faces of a subject while performing anangry expression in the SAVEE corpus.
Emotion-Recognition-In-the-Wild-Challenge Dataset
The third corpus is the database for the Emotion-Recognition-In-the-Wild-Challenge(EmotiW) [69]. This corpus contains video clips extracted from different movies
60

4.7. KT Emotional Interaction Corpus
Figure 4.13: Example of an angry sequence in the EmotiW corpus.
and organized into seven classes: “Anger”, “Disgust, “Fear”, “Happiness”, “Neu-tral”, “Sadness” and “Surprise”. A total of 1000 videos with different lengths isavailable, separated into training and validation sets. The test set is available, butwithout any label, and includes 700 extra videos. Therefore, we only evaluate ourmodel on the validation set. This challenge is recognized as one of the most diffi-cult tasks for emotion recognition because the movie scenes contain very clutteredenvironments, occluded faces, speech, music, sound effects, more than one speakerand even animals. Figure 4.13 illustrates some frames of an angry expression inthe EmotiW corpus.
4.6.2 Emotional Attention Corpus
To evaluate our model with spontaneous expressions in emotional attention tasks,we adapted a dataset based on the bi-modal FAce and BOdy benchmark database(FABO) corpus introduced by [117]. To build our dataset, we extracted the faceexpression and body movement of the FABO corpus and located it in a randomposition in a meeting scene background. The expressions always had the samesize, while the positions in the meeting scene were selected using a randomizationalgorithm. We created a dataset with 1200 expressions composed of different se-quences from the FABO corpus using the happy and neutral expressions only. Thatmeans that the same expression could be selected more than once, but displayedat a different position in our meeting scene. We created three different categoriesof sequences: one with only the background, without any expressions, one witha single expression (either neutral or happy), and one with both a neutral and ahappy expression. A total of 400 sequences for each category were created. Figure4.14 illustrates one frame of a sequence of each category.
4.7 KT Emotional Interaction Corpus
The corpora presented previously were focused mostly on human interpretationof emotional concepts. To evaluate our model properly, we created a new corpusbased on human-human and human-robot interaction.
The data recording happened in two different scenarios. The first one recordedhuman-human interactions, and the second one human-robot interactions. Weannotate the data using dimensional and categorical representations, similar to
61

Chapter 4. Neural Network Concepts and Corpora Used in this Thesis
Figure 4.14: Examples of images with no expressions, one expression (happy) andtwo expressions (happy and neutral), used to train and evaluate our model.
other datasets in the field such as the IEMOCAP [34]. Our corpus differs fromthe other datasets in the area by introducing a scenario in which the interactionbetween humans and robots can be evaluated and compared with human-humaninteraction.
In both scenarios, two subjects conducted a fictitious dialogue based on a cer-tain topic. The subjects were seated at a table across from each other. Images fromthe subjects faces and torsos, and audio were recorded. In one of the scenarios,both subjects are humans, however, in the second scenario, one of the subjects isreplaced by a robot. The whole process of conceptual design, recording procedure,pos-processing and annotation are presented in the next sections.
4.7.1 Recording Setup
To collect the data we used the Robot Interaction Laboratory of the KnowledgeTechnology Group at University of Hamburg [17]. The subjects were placed insidethe half-circle environment. A white canvas covers the whole environment, whichmeans that the participants are separated from the instructors. This way, we assurethat the instructors will not bias the recordings, and we let the participants havethe dialogue as natural as possible. Figure 4.15 shows the half-circle environment.
Two Logitech HD Pro C920 cameras were placed in a position that it capturedthe torso of a person seated on the chairs. Each camera recorded a video at aresolution of 1024x768 and a framerate of 30FPS. Each participant had a Blue-tooth Sennheiser EZX 80 microphone attached on their shirt, allowing to recordan individual audio channel for each participant. Figure 4.16 exhibits an exampleof the recordings, showing one subject with the microphone attached to his shirt.
4.7.2 Data Collection
Both our scenarios, the human-human and human-robot, had the same basic setup:two subjects are seated across each other on a table and they talk about a topic.Before the experiment started, we explained to both subjects that they wouldbe part of an improvised dialogue, and they would be given a topic to discuss.We did not let the subjects know that our goal was to analyze their emotional
62

4.7. KT Emotional Interaction Corpus
Figure 4.15: Picture of the half-circle environment used for the data recording.
Figure 4.16: Picture of one example of the recordings, showing one subject andthe microphone position.
reaction. The data collection happened in into two steps: the instruction step andthe recording step.
Instruction
In the instruction step a consent form was given to each subject, which can be foundin Appendix A. In the consent form the subject had information about which kindof data would be collected, audio and visual data and that the data would not becorrelated to his personal identification. The subject was also asked to identify if
63

Chapter 4. Neural Network Concepts and Corpora Used in this Thesis
Figure 4.17: Picture of the instruction step of the data collection, where the sub-jects were informed about the scenarios and the consent form was presented andsigned.
the collected data could be used in future experiments, and if it could be publishedor not. Figure 4.17 shows a picture of the instruction step, where the instructorgives the consent form and directions about the scenario to two participants.
During this step, we collected also some demographic information about eachsubject. Each subject was asked to range their age into a group age between 0-12 years, 13-18 years, 19-49 years and 50+ years, to state his or her gender, themother tongue and the city/country of birth. This information helps us to createa distinction between the data, and if to identify gender, age or place of birthinfluence in the interactions.
All the instruction, recordings, and data labeling happened in English, althoughpersons from different countries participated in all these steps.
Recording
In both scenarios, the Human-Human Interaction (HHI) and the Human-RobotInteraction (HRI), two subjects interacted with each other, however, in the HHIscenario both are humans and in the HRI one human is replaced by a robot.We invited different students from the informatics campus of the University ofHamburg, using an open call distributed via email to different student lists.
64

4.7. KT Emotional Interaction Corpus
For both scenarios, we created two roles: an active and a passive subject. Beforeinitiating each dialogue session, we gave to the active subject a topic, and he or sheshould introduce it during the dialogue. The passive subject was not aware of thetopic of the dialogue, and both subjects should improvise. The subjects were freeto perform the dialogue as they wanted, with the only restriction of not standingup nor changing places. The following topics were available:
• Lottery: Tell the other person he or she won the lottery.
• Food: Introduce to the other person a very disgusting food.
• School: Tell the other person that his/her school records are gone.
• Pet: Tell the other person that his/her pet died.
• Family: Tell the other person that a family member of him/her is in thehospital.
These topics were selected in a way to provoke interactions related to at leastone of the universal expressions each: “Happiness”, “Disgust”,“Anger”, “Fear”,and “Sadness”. To none of the subjects any information was given about thenature of the analyses, to not bias their expressions.
In the HHI scenario, both participants were humans. One of them was chosento be the first active subject, and the topic was presented only to him. Thetopics were printed on a paper and shown to the active person, in a way thatall the active persons received the same instruction. Figure 4.18 shows the topicassignment moment for an active participant.
After each dialogue session, the role of the active subject was given to thepreviously passive subject and a new topic was assigned. For each pair of partici-pants, a total of five dialogue sessions was recorded, one for each topic, and eachone lasting between 30 seconds and 2 minutes. Although the topics were chosento provoke different expressions, it was the case that in some dialogues none of thepreviously mentioned emotional concepts were expressed.
The HRI scenario followed the same pattern that the HHI scenario had but re-placed the active subject with a humanoid iCub robot [210] head. In this scenario,the robot was always the active subject. As in the previous scenario, the passivesubject was not informed of the theme of the dialogue and had to improvise adiscussion.
The iCub head has three degrees of freedom for head movement and 21 differenteyebrows and mouth positions, for face expressions. Figure 4.19 illustrates the iCubrobot used in our experiments. We captured the pictures from the iCub perspectiveplacing a camera just in front of it. The iCub has a built-in camera, however, theresolution and frame rate are very low and incompatible with the ones necessaryfor our scenario.
The robot was remote controlled, which means that movements, face expres-sions and what the robot spoke were typed by an instructor. The participants
65

Chapter 4. Neural Network Concepts and Corpora Used in this Thesis
Figure 4.18: Picture of the topic assignment. One of the participants is chosen asthe active subject, and one of the five topics is given to him/her.
Figure 4.19: Picture of the iCub robot used in our experiments.
were not informed about that, and the instructor controlled the robot from an-other room. This way, only the robot and the participant were in the room duringthe recordings. Each dialogue session did not take more than 4 minutes, takinglonger than those in the first scenario, mostly due to the delay in the robot’sresponse. Figure 4.20 illustrates the HRI scenario.
66

4.7. KT Emotional Interaction Corpus
Figure 4.20: Picture of the HRI scenario. A person is seated in front of the iCubrobot, which is the active subject.
4.7.3 Data Annotation
To give the corpus a human ground truth analysis, we needed to label each inter-action in a way that we can compare them to our computational models. To dothat, we selected a dimensional [261] and a categorical [81] approach to describeeach interaction. Instead of using emotional concepts, such as happiness or sad-ness, a dimensional model allows us to describe the interaction itself. This allowsus to identify interactions which were similar but presented in different emotionalsituations, such as smiling and moving the arms at the same time.
Using a dimensional model, allows us to better deal with spontaneous expres-sions which were present in our recorded data. The dimensional model also allowsus to identify the core affect [262] of the interaction which makes it possible to cre-ate a consistent and valid measure of an interaction [12], reducing the contextualbias of the analyzer, such as current mood, environment or cultural differences.
We choose the dimensional model proposed by Russel et al. [262], and updatedby Rubin et al. [258] with the addition of dominance, besides the usual arousal andvalence. Dominance gives the intensity attribution to the expression itself, differ-ently from arousal which gives us the intensity of the person’s behavior. Accordingto Rubin et al., arousal evaluates how the person behaved, and dominance relatesto the strength of the expression, not the person. By labeling each interactionusing these three dimensions (arousal, valence, and dominance), we can identifymore fine-tuned information about the expressions.
Besides the three dimensions, we decided to include a categorical value foreach interaction. We use the six universal emotions to identify the expression, andalthough this information can be very difficult to identify in our spontaneous in-teractions, it was helpful to situate the annotator into an emotional concept. Also,
67

Chapter 4. Neural Network Concepts and Corpora Used in this Thesis
Figure 4.21: Picture of the labeling collection framework.
by collecting a categorical concept, we can use it to identify different emotionalcategories within our three-dimensional attributes.
Data Annotation Framework
To avoid biased labels, we use anonymous annotators. For that, we developed anonline framework, which allows annotators to watch the interactions and give thelabels. We let our annotation framework online, and distributed the access link tostudent and professionals in the informatics campus of the University of Hamburg.When the annotators access the framework, a first page is shown with instructionsabout the task. Then, after agreeing with the instructions, the annotator is sent tothe labeling page. This pages shows a video and asks the annotator to evaluate theinteraction using an interactive slider to range each attribute between two extremeconcepts. For valence, the limits were negative and positive, arousal had limitsranging from calm to excited, and dominance from weak to strong. At the end, anemotional concept was asked. Figure 4.21 illustrates the labeling session.
As each interaction was based on a whole dialogue session, it could happen thatseveral different expressions were present. To make possible that each annotator
68

4.7. KT Emotional Interaction Corpus
watched and evaluated different expressions, we split each dialogue session intovideos with 10s. This generated a problem: parts of the video which were tempo-rally close to each other could have very different labels. We solved that by usingmany annotators to evaluate the same video parts, creating an averaged measurefor each attribute.
To make the transitions between different video parts better, we introduce theuse of a Gaussian distribution to represent each video label. Each attribute wasevaluated in a range of two concepts, where 0 represents the minimal extreme and100 the maximum. For example, on this scale, 0 represents the most negative va-lence and 100 the most positive. We then proceed to create a Gaussian distributionwith the chosen value as mean and the standard deviation of all the annotationsfor that particular video clip as distribution spread.
The use of Gaussian distributions as labels allow us to create a robust labelfor the videos, removing outliers. As all the video clips could have very differentannotators, the idea of using a distribution gives us a better view on the expressionon each clip, instead of analyzing each annotation individually. Also, by using adistribution, we can smooth the transitions of each video clip better, and representthe real expression transitions with more naturality.
4.7.4 Recorded Data
The data recording happened in two different days: one for the HHI scenario andother for the HRI scenario. For each scenario, we recorded the image and audio,in a video format, for each of the subjects.
The HHI scenario had a total of 7 sessions, with 14 different subjects, twoparticipating in each session. Each session had 6 dialogues, one per topic andan extra one where the two subjects introduced each other, using a fake name.Each subject only participated in one session, meaning that no subject repeatedthe experiment. A total of 84 videos were recorded, one for each subject in eachdialogue, with a sum of 1h05min of recordings. Each video had a different length,with the longer one having 2 minutes and 8 seconds and the shorter one with 30seconds.
The HRI scenario had one session more than the HHI, totaling 9 sessions,and each had one different subject. In the HRI scenario, each session had 5 di-alogues, one per topic, without the introduction dialogue. A total of 45 videoswere recorded, summing 2h05min of videos. As happened with the HHI, eachvideo has a different length and the longer one had 3min40s and the shorter onewith 1min30s. It is possible to see already, that the interactions with the robotproduced longer dialogues than the only-human ones. That was expected, givingthat the robot has a longer reaction time than humans. Table 4.1 summarize thenumber and duration of the videos in each scenario.
69

Chapter 4. Neural Network Concepts and Corpora Used in this Thesis
Table 4.1: Number and duration of videos for each scenario experiment.
Scenario Videos Subjects Total Duration
HHI 84 14 1h05min
HRI 45 9 2h05min
Figure 4.22: Demographic data summary for the HHI scenario, showing the totalof subjects and the associated percentage for gender, mother tongue and birthcountry distributions.
Demographic data
The demographic data shows us how the subjects are clustered with respect totheir gender, mother tongue and country of birth. All of our subjects were in theage group of 19-49, so we did not have any variation. However, for the other threecharacteristics we obtained different measures.
For the HHI scenario, most of the subjects, 64 %, were male and only 36%female. The subjects were from three different countries, and had five differentmother languages. The majority of the subjects came from Germany (72%), butparticipants from Russia, India and Egypt were also present. Similarly, most of theparticipants had German as a mother tongue (also 72 %). Figure 4.22 illustratesa summary of the demographic data for the HHI scenario. This shows that ourdataset has persons with different cultural background, and with different mothertongue. As all the experiments were performed in English, this information couldhelp us to identify different behaviors which could be related to the subjects owncultural background.
Differently from the HHI, most of the participants of the HRI scenario werefemale (67%). Again, most of the participants came from Germany and had Ger-man as mother tongue (78% each characteristic), however, different countries werepresent as well, with Malaysian and Chinese as a mother tongue. Figure 4.23illustrates a summary of the demographic data for the HRI scenario.
70

4.7. KT Emotional Interaction Corpus
Figure 4.23: Demographic data summary for the HRI scenario, showing the totalof subjects and the associated percentage for gender, mother tongue and birthcountry distributions.
4.7.5 Data Analysis
The annotation framework was made available for two weeks. A total of 39 an-notators contributed. Each annotator labeled an average of 3 whole clips, andwe obtained a total of total of 2365 annotations over all the 10s video clips. Theannotations show us some interesting aspects of the dataset, and we clustered theanalysis into three categories: general, per topic and per subject. The generalanalysis shows us how the data is distributed across the dataset and which infor-mation we can have about recordings as a whole. The analysis per topic shows ushow each topic was perceived by each subject pair, giving us indications about howthe subjects behaved on the different topics. Finally, the per subject analysis givesus individual information on how a certain subject performed during the wholedialogue sessions, showing how different subjects react to same scenarios.
We also cluster our analysis into the two scenarios, to gives us the possibilityof understanding how the subjects performed when interacting with a human orwith a robot. With these analyses, we intend to quantify the difference betweenhuman-human- and human-robot-interaction.
Analyzing the general distributions for the whole corpus gave us a perspectiveof what was expressed and an indication of what expressions are present in theinteractions. Also, comparing the HHI and HRI scenarios, gave us a general indi-cation on how people behaved. Figure 4.24 shows the histogram for the valence,arousal, dominance and the emotional labels for all the annotations in both sce-narios. It is possible to see that the annotations for all of these dimensions arenormally distributed, showing a strong indication that most of the interactionswere not so close to the extremes. The exception is the lower extreme, which al-ways showed a larger amount of data. That means that many of the interactionswere evaluated as negative (valence), calm (arousal) and weak (dominance). Theemotional concepts indicate a similar effect, where the neural expressions weremostly present, followed by angry expressions, which can explain the number ofnegative valences.
71

Chapter 4. Neural Network Concepts and Corpora Used in this Thesis
Figure 4.24: These plots show the histogram of the annotations for all the dataset.For the emotional concepts histogram, the x axis represents the following emotions:0 - Anger, 1 -Disgust, 2 - Fear, 3 - Happiness, 4 - Neutral, 5 - Sadness and 6 -Surprise.
It is also possible to see that for both scenarios the distribution of the labels havesome important differences: the valence of the HRI scenario is more distributedto the right when compared to the one in the HHI scenario, indicating that thesubjects tend to be more positive with the robot than with a human. The arousalalso shows that in the robot scenario the subjects tend to be less calm, the samefor the dominance. It is also possible to see that there were more “Happiness”annotations and less “Sadness” ones in the HRI scenario than in the HHI scenario.
Dominance and arousal have a similar behavior in the histogram. To show howthey are correlated we calculated the Pearson correlation coefficient [176], whichmeasures the linear relationship between two series. It takes a value between -1and 1, where -1 indicates an inverse correlation, 1 a direct correlation and 0 nocorrelation. The coefficient for dominance and arousal for the HHI scenario is0.7, and 0.72 for the HRI scenario showing that for both scenarios there is a highdirect correlation. These values are similar to other datasets [34] and indicate thatarousal and dominance are influenced by each other.
The analysis per topic gives shows how the chosen topics produced differentinteractions. Figure 4.25 illustrates two topics from both scenarios: lottery andfood. It is possible to see how the annotations differ for each topic, showing thatin the lottery videos a lot of high valences is presented, while in the food videosthe data presented mostly high arousal. The dominance is rather small when thearousal is also small for both videos. Comparing the difference between the HHIand HRI scenarios, it is possible to see that the HRI scenario presented morenegative valence than the HHI scenario.
It is possible to see also how some emotional concepts are present in eachscenario. While in the food scenario, many “Disgust” annotations are present, in
72

4.7. KT Emotional Interaction Corpus
Figure 4.25: This plot shows the spread of the annotations for the dataset separatedper topic. The x axis represents valence, and the y axis represents arousal. Thedot size represents dominance, where a small dot is a weak dominance and a largedot a strong dominance.
the food scenario the interactions are labeled mostly as “Happiness” or “Surprise”.It is also possible to see that for the HRI scenario, some persons behaved with“Angry” in the lottery topic and that most of the “Surprise” annotations in thefood scenario have higher arousal in the HRI scenario than in the HHI one.
To provide the analysis with an inter-rater reliability measure, we calculatedthe interclass correlation coefficient [160] for each topic. This coefficient gives avalue between 0 and 1, where 1 indicates that the correlation is excellent, meaningthat most of the annotators agree, and 0 means poor agreement. This measure iscommonly used for other emotion assessment scenarios [33, 21, 29] and presentsan unbiased measure of agreement. Table 4.2 exhibits the coefficients per topicfor the HHI scenario. It is possible to see that the lottery scenario produced abetter agreement in most cases, and the food scenario the worst one. Also, thedominance variable was the one with the lowest agreement coefficients, while theemotional concepts had the highest.
Differently from the HHI scenario, the interclass coefficient for the HHI scenarioshows a higher agreement of the annotators. Although dominance still shows alower agreement rate, valence and arousal present a higher one.
73

Chapter 4. Neural Network Concepts and Corpora Used in this Thesis
Table 4.2: Interclass correlation coefficient per topic in the HHI scenario.
Characteristic Lottery Food School Family Pet
Valence 0.7 0.5 0.3 0.6 0.4
Arousal 0.5 0.6 0.6 0.5 0.4
Dominance 0.4 0.5 0.4 0.5 0.4
Emotion Concept 0.7 0.6 0.5 0.6 0.5
Table 4.3: Interclass correlation coefficient per topic in the HRI scenario.
Characteristic Lottery Food School Family Pet
Valence 0.7 0.6 0.4 0.5 0.6
Arousal 0.6 0.6 0.6 0.4 0.5
Dominance 0.5 0.5 0.5 0.4 0.5
Emotion Concept 0.6 0.7 0.5 0.5 0.5
Figure 4.26: These plots show two examples of the spread of the annotations forthe dataset separated per subjects. The x axis represents valence, and the y axisrepresents arousal. The dot size represents dominance, where a small dot is a weakdominance and a large dot a strong dominance.
Analyzing the subjects, it is possible to see how they behave during the wholerecording session. Figure 4.26 exhibits the behavior of two subjects per scenario.In the image it is possible to see that one subject from the HHI scenario presentedmostly high arousal expressions, and highly more dominant ones. Also, the expres-sions were mostly with a negative valence, although annotated as neutral. Thissubject did not express any fear nor surprise expression during the five topics.
Subject 6 1 from the HRI scenario showed mostly positive expressions, with ahigh incidence of surprise and fear expressions. However, the dominance of this
74

4.8. Summary
subject was very weak mostly, although the arousal was more excited than calm.That probably means that this subject was nervous while talking to the robot, butcould not present strong or intense expressions during most of the interaction.
The collected dataset contains a large amount of information, and many moreinteresting statistics could be provided. However, the ones that are necessary forthe development and evaluation of the models presented in this thesis are the onesdiscussed in this section.
4.8 Summary
This chapter presented important concepts used by the models of this thesis anddetailed the datasets used for the evaluation of such models. The neural networkconcepts described here are the basis to understand the proposed techniques andsolutions, although what was discussed was only the fundamental concepts. De-tailed views on network behavior, extensions, and possible limitations are discussedin the next chapters, which present our models.
The corpora used for our evaluations have different properties, which werenecessary to evaluate the behavior of our model in different tasks: multimodaland spontaneous expression representation and recognition, and emotional con-cept learning. Although many corpora are available, none of them had an impor-tant characteristic: continuous scenarios representing different human-human andhuman-robot interactions. To address this problem, we proposed a new corpus.The acquisition, recording, labeling and analysis of this novel corpus was presentedin this chapter and serves as the basis for comparison of our integrative emotional,behavioral analysis model, presented in Chapter 7.
75

Chapter 4. Neural Network Concepts and Corpora Used in this Thesis
76

Chapter 5
Emotion Perception with a
Cross-channel Convolution Neural
Network
5.1 Introduction
The first problem this thesis deals with is the multimodal emotion expressionrepresentation. As seen in Chapter 3, emotion expressions are very complex to berepresented by computational models, in particular multimodal expressions. Wepropose here the use of a visual-cortex-inspired deep learning model to learn howto represent multimodal expressions.
Our model deals with multimodal stimuli, and takes into consideration visual,primary face expressions and body movements, and auditory information. It isimplemented as a Cross-channel Convolutional Neural Network (CCCNN) and itextracts hierarchical features from the two modalities. The complex representa-tion varies depending on the presented stimuli, and each hierarchical layer of thenetwork learns a different level of abstraction. This means that the deeper layerswill have a full representation of the input, while the first layers will have a localrepresentation of some regions or parts of the input stimuli.
To be able to deal with sequences, cubic receptive fields are implemented [146]expanding the capability of the model into modeling dependencies between sequen-tial information. Also, the use of shunting inhibitory fields [99], allows us to ensurea strong feature representation.
The proposed model is able to learn simple and complex features and to modelthe dependencies of these features in a sequence. Using a multichannel implemen-tation, it is possible to learn different features of each stimulus. We use the conceptof cross-channel learning to deal with differences within the modalities. This allowsus to have regions of the network specified to learn features from face expressionsand body movements, for example, but the final representation integrates bothspecific features.
To evaluate our model, we use different corpora of emotional expressions with
77

Chapter 5. Emotion Perception with a Cross-channel Convolution Neural Network
different modalities. We also introduce a study on the model’s behavior, and avisualization analysis on the learned representation. Finally, we discuss the modelbehavior and architecture and its capability to learn multimodal spontaneous ex-pressions.
5.2 Cross-channel Convolution Neural Network
To be able to deal with multimodal data, our network uses the concept of the Cross-channel Convolutional Neural Network (CCCNN). In the CCCNN architecture,several channels, each one composed of an independent sequence of convolutionand pooling layers, are fully connected at the end to a Cross-channel layer, andtrained as one single architecture. Our architecture is composed of two mainstreams: a visual and an auditory stream.
Our Cross-channel is inspired by the V4 area of the brain’s visual pathway[91]. In this area, the representations obtained by the ventral and dorsal areas areintegrated. In our case, we implement a Cross-channel layer which is composed of alayer of simple and complex cells. This layer receives the high-level representationof two different channels as input and integrates them.
Our model applies topological convolution, and because of this the size of thereceptive field has an important impact on the learning process. The receptivefields in our Cross-channel should be large enough to be able to capture the wholeconcept of the stimulus, and not only part of it. With a small receptive field, ourcross learning will not be able to capture the high-level features.
We apply our Cross-channel learning in two streams. Goodale and Milner[112] describe how the visual cortex is categorized into two streams, and howthese streams are integrated into the V4 area. In their model, the ventral anddorsal streams extract different kinds of information from the input and are usedas input to the V4 area. Hickok [131] describes a similar process occurring inthe auditory pathway, where different kinds of information are processed by theventral and dorsal stream, and integrated into the V4 area. Although we are notmodeling the same pathways and information exactly as the ones present in thebrain, the architecture of our model was developed in a way that resembles thebrain’s organizational structure. Also, we specify our model to deal with emotionexpressions, and not general visual and auditory recognition.
5.2.1 Visual Representation
Inspired by the primate visual cortex model [91], the proposed model visual streamhas two channels. The first channel is responsible for learning and extracting in-formation about facial expressions, which comprises contour, shape and texture ofa face, and mimics the encoding of information in the ventral area of the primatevisual cortex. The second channel codes information about the orientation, direc-tion and speed of changes within the torso of a person in a sequence of images,similar to the information coded by the dorsal area.
78

5.2. Cross-channel Convolution Neural Network
Although facial expressions are an important part of emotion expression de-termination, there is evidence that shows that in some cases facial expressionsand body posture and movements are contradictory and carry a different meaning.This phenomenon was first observed by Darwin [60] and is referred to as microexpressions. Although micro expressions occur with other modalities as well, theface is the one in which this behavior is easily perceptible [243].
Ekman [83] demonstrates that facial micro expressions last from 40 to 300milliseconds, and are composed of an involuntary pattern of the face, sometimesnot directly related to the expression the person intended to perform. He also showsthat micro expressions are too brief to convey an emotion, but usually are signsof concealed behaviors, giving the expression a different meaning. For example,facial micro expressions are usually the way to determine weather someone is angrywhile using a happy sarcastic expression. In this case, the addition of facial microexpressions as an observable modality can enhance the capability of the modelto distinguish spontaneous expressions, but the observation of the facial microexpression alone does not carry any meaning [231].
Our architecture is tuned to deal with facial expressions and micro expressions.Our architecture is fed with frames comprising 1s, and our Face channel receivesa smaller sequence representing 300 milliseconds. These intervals were found byexperimenting with using different sequence lengths as input to the network, andthe chosen values are congruent with evidence from [83]. That means that ournetwork is able to recognize common face expressions, but also takes into consid-eration micro expressions.
To feed our visual stream, we must first find the faces on the images. To do so,we use the Viola-Jones face detection algorithm [291], which uses an Adaboost-based detection. Wang [297] discusses the Viola-Jones algorithm, and shows thatit is robust and effective when applied to general face detection datasets. In ourexperiments, the Viola-Jones algorithm showed to be reliable in controlled envi-ronments. After finding the face, we create a bounding box to describe the torsomovement. We extract face and torso from a sequence of frames corresponding to1 second and use them as input to the network.
To define the input of the Movement channel, we use a motion representation.Feeding this stream with this representation, and not the whole image, allows usto specialize the channel into learning motion descriptors. This way, we can trainthe network with a smaller amount of data, and use a shallow network to obtainhigh-level descriptors.
To obtain the motion representation, an additional layer is used for pre-processingthe input of the Movement channel. This layer receives 10 gray scale frames andcreates a representation based on the difference between each pair of frames. Thisapproach was used in previous works to learn gestures, and showed to be success-ful by [14]. The layer computes an absolute difference and sums up the resultingframe to a stack of frames. This operation generates one image representing themotion of the sequence, defined here as M :
79

Chapter 5. Emotion Perception with a Cross-channel Convolution Neural Network
Figure 5.1: Example of input for the visual stream. We feed the network with 1s ofexpressions, which are processed into 3 movement frames and 9 facial expressions.
M =N∑
i=1
|(Fi−1 − Fi)| (i/t), (5.1)
where N is the number of frames, Fi represents the current frame and (i/t)represents the weighted shadow. The weighted shadow is used to create differentgray scale shadows in the final representation according to the time that each frameis presented. This means that every frame of the image will have a different graytone in the final image. The weight t starts as 0 in the first frame and is increasedover time, so each frame has a different weight. The absolute difference of eachpair of frames removes non-changing parts of the image, being able to extract thebackground or any other detail in the image that is not important to the motionrepresentation. By summing up all the absolute differences of each pair of imagesit is possible to create a shape representation of the motion and with the helpof the weighted shadows, the information of when each single posture happened.Figure 5.1 displays a common input of our visual stream, containing examples ofthe Face and Movement channels.
The Face channel is composed of two convolution and pooling layers. The firstconvolution layer implements 5 filters with cubic receptive fields, each one witha dimension of 5x5x3. The second layer implements 5 filter maps, also with adimension of 5x5, and a shunting inhibitory field. Both layers implement max-pooling operators with a receptive field of 2x2. In our experiments, we use a rateof 30 frames per second, which means that the 300 milliseconds are represented by9 frames. Each frame is resized to 50x50 pixels.
The Movement channel implements three convolution and pooling layers. Thefirst convolution layer implements 5 filters with cubic receptive fields, each onewith a dimension of 5x5x3. The second and third channels implement 5 filters,each one with a dimension of 5x5 and all channels implement max-pooling witha receptive field of 2x2. We feed this channel with 1s of expressions, meaningthat we feed the network with 30 frames. We compute the motion representationfor every 10 frames, meaning that we feed the Movement channel with 3 motionrepresentations. All the images are resized to 128x96 pixels.
80

5.2. Cross-channel Convolution Neural Network
Figure 5.2: The Visual stream of our network is composed of two channels: theFace and the Movement channels. The Face channel implements two layers, eachone with convolution and pooling, and applies inhibitory fields in the second layer,while the Movement channel implements three layers, with pooling and convolu-tion. Both channels implement cubic receptive fields in the first layer. The finaloutput of each channel is fed to a Cross-channel which implements convolutionand pooling and produces a final visual representation.
We apply a Cross-channel to the visual stream. This Cross-channel receivesas input the Face and Movement channels, and it is composed of one convolutionchannel with 10 filters, each one with a dimension of 3x3, and one max-poolingwith a receptive field of 2x2. We have to ensure that the input of the Cross-channel has the same dimension, to do so we resize the output representation ofthe Movement channel to 9x9, the same as the Face channel. Figure 5.2 illustratesthe visual stream of the network.
5.2.2 Auditory Representation
The dorsal and ventral streams of the brain process different auditory information[131]. While the ventral stream deals with speech information, the dorsal onemaps auditory sensory representation. In earlier stages of the dorsal stream, theauditory information is decomposed into a series of representations, which arenot connected to phonetic representations. We use this concept to separate theperception of auditory information in our network into two channels. One dealsmostly with speech signals, and the other with general sounds, including music.
Evidence in the work of [264] shows that the use of Mel-Cepstral Coefficients(MFCC) is suited for speech representation, but does not provide much informationwhen describing music. MFCCs are described as the coefficients derived from thecepstral representation of an audio sequence, which converts the power spectrumof an audio clip into the Mel-scale frequency. The Mel scale showed to be closerto human auditory system’s response than the linear frequency [238].
When trying to describe general music information, spectral representations,such as power spectrograms, showed good results [104]. Power spectrograms arecalculated in smaller sequences of audio clips, by applying a discrete Fourier trans-form in each clip. This operation describes the distribution of frequency compo-
81

Chapter 5. Emotion Perception with a Cross-channel Convolution Neural Network
Figure 5.3: The Auditory stream of our network implements two channels: theMusic channel and the Speech channel, which implements filters with one dimen-sion. We feed the network with 1s audio clips, and calculate a power spectrogramas input for the Music channel and MFCCs as input for the Speech channel. Theoutput of both channels is used as input for the auditory Cross-channel.
nents on each clip.
To use the auditory representation in CNNs, the MFCCs and power spectro-grams are represented as images. But there is a fundamental difference whendealing with these representations. Usually, the input of CNNs is processed by afilter matrix which is applied in both, height and width axis. The filter is trainedto capture local information of the region where it is applied. When this conceptis applied to an auditory representation, to learn from a 2D region can generatea problem. In auditory input, each axis represents different kinds of information,where usually the X axis represents time and the Y axis the spectral representa-tion. For the power spectrogram representations, the use of 2D filters showed tobe ideal, because each filter captures the spectral representation in a certain regionof the audio clip [128].
On the MFFCs representation, the use of 2D filters does not work. To Extractthe MFCCs, a cosine transformation is applied and this projects each value of the Yaxis into the Mel frequency space, which may not preserve locality. Because of thetopological nature of 2D filters, the network will try to learn patterns in adjacentregions, which are not represented adjacently in the Mel frequency domain. Abdel-Hamid et al. [1] propose the use of 1D filters to solve this problem. The convolutionprocess is the same, but the network applies 1D filters on each value of the Y axis ofthe image. This means that the filters will learn how to correlate the representationper axis and not within neighbors. Pooling is also applied in one dimension, alwayskeeping the same topological structure.
We build our auditory stream based on the speech and music representation.We use two channels, which are connected to a Cross-channel. We use audio clipswith 1s as input, and each clip is re-sampled to 16000 Hz. We compute the powerspectrum and the MFCC of the audio clip and feed them to the two channels.The power spectrogram is the input of the Music channel, and it is computed overa window of 25ms with a slide of 10ms. The frequency resolution is 2048. Thisgenerates a spectrogram with 1024 bins, each one with 136 descriptors. We resize
82

5.2. Cross-channel Convolution Neural Network
Figure 5.4: Final crossmodal architecture, which extracts features from the visualand the auditory input and classifies them in emotion expressions. We connect theoutputs of each stream to a fully connected hidden layer and then to a softmaxlayer, which will give us a classification probability.
the spectrogram by a factor of 8, resulting in an input size of 128x7. The MFCCis used as input for the Speech channel, and it is calculated over the same windowand slide as the power spectrogram. We change the frequency resolution to 1024,which generated a representation with 35 bins each one with 26 descriptors.
The Music channel is composed of two layers, the first one with 10 filters, andeach one with a dimension of 5x5. The second layer has 20 filters, with a dimensionof 3x3. Both layers implement pooling, with a receptive field of 2x2. The Speechchannel is composed of three layers, each one with one-dimensional filters. Thefirst has 5 filters, with a dimension of 1x3, the second one has 10 filters with adimension of 1x3 and the third one 20 filters with a dimension of 1x2. All threelayers apply pooling with a receptive field of 1x2.
The Cross-channel applied to our Auditory stream has one layer, with 30 filters,each one with a dimension of 2x2, without the application of pooling. To be able touse the Cross-channel, both channels must output data with the same dimensionsand our results showed that resizing the Music channel output produced betterperformance. This can be explained by the fact that the Speech channel dependsstrongly on the non-locality of the features. Figure 5.3 illustrates our Auditorystream.
5.2.3 Crossmodal Representation
We integrate both streams into one Multichannel Convolutional Neural Networkarchitecture. We connect each Cross-channel with a fully connected hidden layer,with 500 units, which is then connected to a softmax layer. This way, each modal-ity, visual and auditory, has its own high abstraction level representation preserved.Figure 5.4 illustrates our final architecture.
It is possible to train the filters of a CNN using either a supervised [136] oran unsupervised approach [247]. Although the unsupervised approach does notdepend on strongly labeled data, evidence [150, 296], showed that the use of su-
83
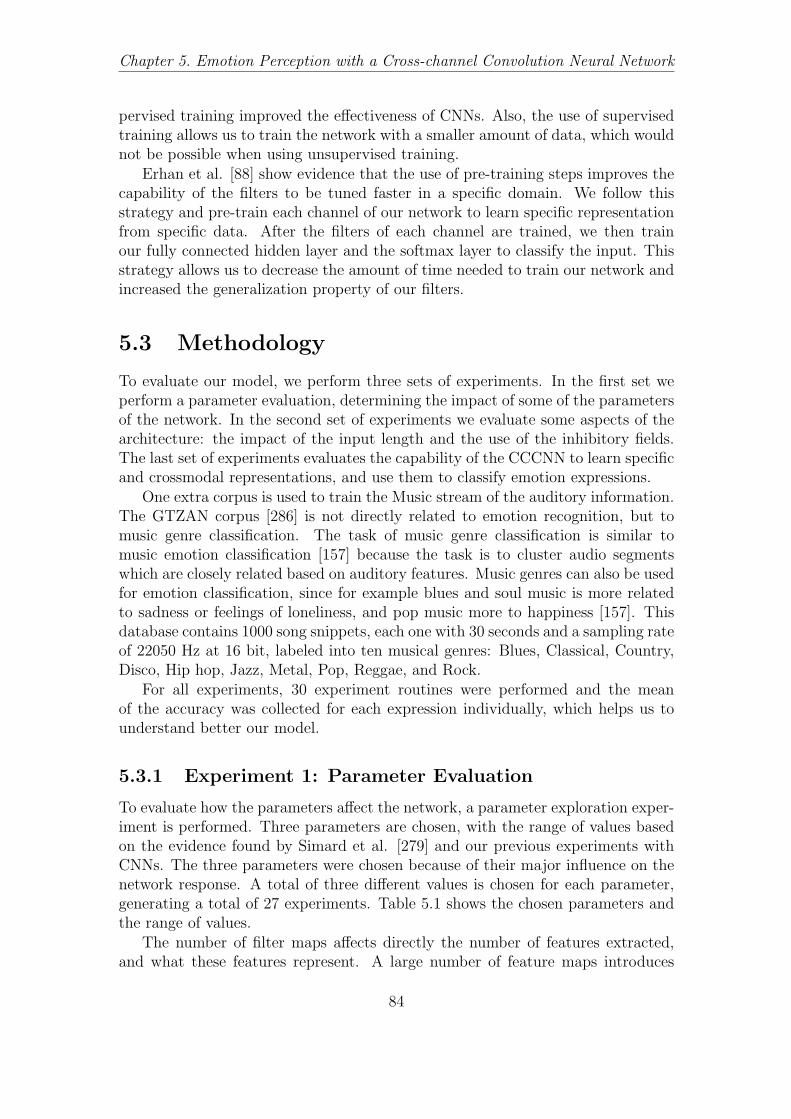
Chapter 5. Emotion Perception with a Cross-channel Convolution Neural Network
pervised training improved the effectiveness of CNNs. Also, the use of supervisedtraining allows us to train the network with a smaller amount of data, which wouldnot be possible when using unsupervised training.
Erhan et al. [88] show evidence that the use of pre-training steps improves thecapability of the filters to be tuned faster in a specific domain. We follow thisstrategy and pre-train each channel of our network to learn specific representationfrom specific data. After the filters of each channel are trained, we then trainour fully connected hidden layer and the softmax layer to classify the input. Thisstrategy allows us to decrease the amount of time needed to train our network andincreased the generalization property of our filters.
5.3 Methodology
To evaluate our model, we perform three sets of experiments. In the first set weperform a parameter evaluation, determining the impact of some of the parametersof the network. In the second set of experiments we evaluate some aspects of thearchitecture: the impact of the input length and the use of the inhibitory fields.The last set of experiments evaluates the capability of the CCCNN to learn specificand crossmodal representations, and use them to classify emotion expressions.
One extra corpus is used to train the Music stream of the auditory information.The GTZAN corpus [286] is not directly related to emotion recognition, but tomusic genre classification. The task of music genre classification is similar tomusic emotion classification [157] because the task is to cluster audio segmentswhich are closely related based on auditory features. Music genres can also be usedfor emotion classification, since for example blues and soul music is more relatedto sadness or feelings of loneliness, and pop music more to happiness [157]. Thisdatabase contains 1000 song snippets, each one with 30 seconds and a sampling rateof 22050 Hz at 16 bit, labeled into ten musical genres: Blues, Classical, Country,Disco, Hip hop, Jazz, Metal, Pop, Reggae, and Rock.
For all experiments, 30 experiment routines were performed and the meanof the accuracy was collected for each expression individually, which helps us tounderstand better our model.
5.3.1 Experiment 1: Parameter Evaluation
To evaluate how the parameters affect the network, a parameter exploration exper-iment is performed. Three parameters are chosen, with the range of values basedon the evidence found by Simard et al. [279] and our previous experiments withCNNs. The three parameters were chosen because of their major influence on thenetwork response. A total of three different values is chosen for each parameter,generating a total of 27 experiments. Table 5.1 shows the chosen parameters andthe range of values.
The number of filter maps affects directly the number of features extracted,and what these features represent. A large number of feature maps introduces
84

5.3. Methodology
Table 5.1: Parameter sets evaluated for each experiment. The combination of allvalues for all parameters was evaluated and discussed.
Parameter Values
Filter maps layer 1 and 2 10 and 20 20 and 40 30 and 60
Receptive field size layer 1 3x3x2 11x11x2 21x21x2
Receptive field size layer 2 3x3 7x7 11x11
redundancy, and a small number is not enough to extract a proper description ofthe emotion sequence. The minimum and maximum values of 10 and 30 filter mapswere chosen based on preliminary experiments, where these values represented thelimits where the network showed a big variation for the accuracy. The numberof filter maps on the second layer [279], is selected as twice the number of filtermaps on the first layer. This selection leads to more specialized features on thesecond layer to expand the representations on the first layer, which are mostly edge-like detectors. The size of the receptive fields determines which pixel structuresare important for the model. On the first layer, the receptive fields are connecteddirectly to the image, and they will enhance structures present in the original data.If the receptive fields are too small, they will not be able to enhance importantpixel structures, and will generate redundancy for the next layers. If they are toolarge, they will consume more pixel structures than necessary, and they will notbe able to determine or to react to these structures, aggregating more than onestructure into one filter map. This can generate very specific filter maps for thedata while training the network, which leads to an overfitting of the model. Forour experiments, we chose a range between the smaller and maximum receptivefield sizes which were able to extract meaningful information from our input.
5.3.2 Experiment 2: Aspects of the Architecture
An expression occurs between 300 milliseconds and 2 seconds [83]. To evaluatean optimal approximation of sequence length, we evaluated our Face channel withfour different input lengths: 40ms, 300ms, 600ms and 1s. For this experiment weuse the FABO corpus, explained in details in Chapter 4, Section 4.6, and as thesequences in this corpus were recorded with a frame rate of 30 frames per second,that means that we evaluate the use of 1, 9, 18 and 36 frames as input. We alsoevaluated the input length for the Movement channel. First, we evaluate the useof 2 frames to compose a movement representation, then 5 frames, 10 frames andlastly 15 frames. This leads to feeding the network with 15, 6, 3 and 2 movementimages respectively.
We then evaluate the use of the inhibitory fields on the visual stream, byapplying it in different layers. We show how the inhibitory fields affect each rep-resentation of each layer and why we only use them on our Face channel.
For the auditory representation, we follow indications in the work of [1] for
85

Chapter 5. Emotion Perception with a Cross-channel Convolution Neural Network
the Speech channel and [104] for the Music channel. Separating the same 1s ofrepresentation and using the window and earlier slide values indicated in this workproduced the best results, so we kept them. Also, the use of inhibitory fields on theauditory channel did not produce any improvement on the results, causing exactlythe opposite: an overfitting of the filters made the network lose completely thefocus during training.
5.3.3 Experiment 3: Emotion Expression Recognition
Visual Emotion Expressions
Using the FABO corpus we evaluate the visual stream of the network. In this set ofexperiment, we evaluate the use of the Face and Movement channels individuallyand then both of them at the same time.
With this experiment we show in detail the impact that each modality has indifferent expressions. As the FABO corpus deals with secondary expressions, it ispossible to see how our visual representation behaves for very different expressions,such as happiness and sadness, or very similar ones, as boredom and puzzlement.
Auditory Emotion Expressions
We use the SAVEE, GTZAN and EmotiW corpora, all detailed in Chapter 4,Section 4.6, to evaluate the auditory stream of the network. For all datasets weextracted 1s of each audio input to train our networks. To recognize each audioclip, we used a sliding window approach of 1 second as input to the network. So,if the original audio input has 30 seconds, we split the audio into 30 parts of 1second and use them as input to the network. With 30 results, we identified themost frequently occurring ones, leading to a final classification result for the 30seconds audio input.
We performed experiments using the two channels individually and the Cross-channel on the three datasets. This allows us to explain the behavior of the modelwhen un-suitable information is used as input for each task. We also performeda Pre-training strategy, where the Music-specific architecture was trained exclu-sively with the GTZAN set, the Speech-specific architecture with the SAVEE setand the Cross-channel architecture uses the pre-trained features of both previousarchitectures and trains its own Cross-channel with the EmotiW corpus. Thisway we ensure that the Cross-channel architecture uses the specific representationlearned through the specific architectures to construct a higher abstraction levelof auditory features. The mean and standard deviation of the accuracy over 30training runs are calculated for all the experiments.
Multimodal Emotion Experiments
The EmotiW corpus contains the most complex emotion expressions in our exper-iments. The video clips contain different subjects (sometimes at the same time),
86

5.4. Results
music, speech, different lighting conditions in the same scene and various facepositions. This makes the emotion classification in this dataset very difficult.
We evaluate the use of our channels trained with this dataset; first each chan-nel individually and then the integration of visual only streams and auditory onlystreams. Finally, we evaluate the audio-visual representation. Each of these ex-periments is performed with two different training strategies: one with and onewithout the pre-training of the filters. We use the FABO corpus to pre-train thefilters of the visual stream and the SAVEE and GTZAN corpus to pre-train theauditory stream.
All results are compared and we show for the six basic emotions [81], plus aneutral category, how each of the modalities behaves and the advantage of usingthe pre-training strategy.
As the SAVEE corpus also has visual information, with the recording of thefaces of the subjects, we also evaluate only the Face channel and the crossmodalrepresentation obtained with the use of the auditory channels and the Face channel.
5.4 Results
5.4.1 Experiment 1: Parameter Evaluation
After performing the parameter exploration experiments, the average of the accu-racy was computed. Table 5.2 shows the results for all the parameter combinations.For the first set of experiments, we locked the number of filter maps to 10. Thebest result was achieved with a configuration of a receptive field size of 3x3 pixelsin the first and second layer, with an accuracy of 91.3%, while the worst resultfound, with a configuration of kernel size in the first layer of 11x11 pixels and inthe second layer of 21x21 pixels, was 87.89%. We found a trend: when the size ofthe receptive fields was increased, in both layers, the network produced the poorerresults.
When locking the number of filter maps on the first layer at 20, the resultsobtained showed a similar trend: increasing the size of the receptive fields of thefilter maps for the first and second layer decreases the accuracy. For this set ofexperiments, the best result was also with the smaller receptive field size, in bothlayers, achieving 91.25% of accuracy. The worst result can be observed when usingthe maximum value of the receptive field size. This configuration achieved anaccuracy of 87.3%.
The trend can also be found when the number of filter maps on the first layerwas locked at 30. The best result was also with the smaller receptive field sizeswith an accuracy of 91.18%. The worst accuracy was 88.9%, when using the largestkernel size for both layers.
Evaluating the parameters, it is possible to find some trends in the network be-havior. Figure 5.5 shows a box plot with the individual analysis of the parameters.The plot shows the variance of the accuracy of each parameter. The plot depictsthat using a smaller receptive field in both layers the accuracy improves. Looking
87
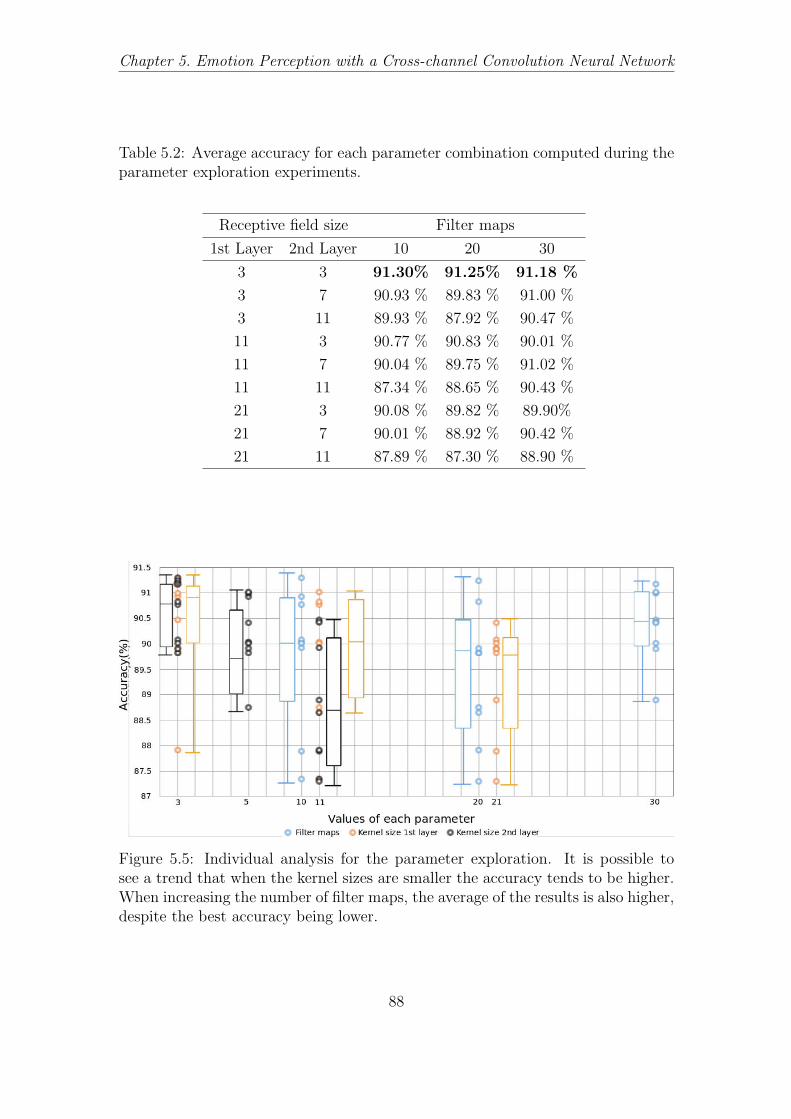
Chapter 5. Emotion Perception with a Cross-channel Convolution Neural Network
Table 5.2: Average accuracy for each parameter combination computed during theparameter exploration experiments.
Receptive field size Filter maps
1st Layer 2nd Layer 10 20 30
3 3 91.30% 91.25% 91.18 %
3 7 90.93 % 89.83 % 91.00 %
3 11 89.93 % 87.92 % 90.47 %
11 3 90.77 % 90.83 % 90.01 %
11 7 90.04 % 89.75 % 91.02 %
11 11 87.34 % 88.65 % 90.43 %
21 3 90.08 % 89.82 % 89.90%
21 7 90.01 % 88.92 % 90.42 %
21 11 87.89 % 87.30 % 88.90 %
Figure 5.5: Individual analysis for the parameter exploration. It is possible tosee a trend that when the kernel sizes are smaller the accuracy tends to be higher.When increasing the number of filter maps, the average of the results is also higher,despite the best accuracy being lower.
88

5.4. Results
at the plot, it is possible to see a clear trend in the spread of the results. Whenusing smaller receptive fields, the network produces results with a better accuracymedian and smaller variance. Also, increasing the number of filter maps decreasesthe accuracy variance between the experiments. This shows that when we increasethe number of filter maps, the results of our network tend to be more stable. Usinga smaller receptive field allows the network to learn those general structures whichoccur more often in the images. Passing these general features through our layersgenerate higher level features in deeper layers. But, as our network is not verydeep, we need to increase the number of filter maps in order to expand the varietyof features extracted in the same layer.
When evaluating the combinations of parameters, it is possible to visualizehow the number of filter maps influences the results. Figure 5.6 illustrates theplot with the combination of the parameters. It is possible to see that when weincreased the size of filter maps, the variance in the accuracies values is small.Also, it is possible to see that increasing the number of filter maps in the secondlayer produces a lower accuracy. However, when using 30 filter maps and usinga receptive field of 7x7 in the second layer, the network produces better results.This occurs because extending the number of filter maps will result in the networkgenerating different feature representations at the same level and thus it generatesredundant features which allow a better generalization. It is important to note thatwith too many redundant filters, the network loses the capability of generalizingand ends up overfitting.
5.4.2 Experiment 2: Aspects of the Architecture
The results obtained when training the Face channel with different sequence lengthsshowed us that the use of 9 frames produced the best results, as shown in Table5.3. As the FABO corpus was recorded with 30 frames per second, the use of 9frames means that the sequence has an approximate length of 300 milliseconds. Asequence with this length is congruent with the description of facial expressions andmicro expressions, meaning that our model performed best when both expressionscould be perceived. The use of longer expressions, with 1s, produced the weakestresults.
The Movement channel receives a sequence of motion representations of 1s ofthe expression as input. This means that each representation of this sequence iscomposed of several frames. The results, exhibited in Table 5.3, show that theuse of 3 movement representations gave the best performance, meaning that eachmovement representation is composed of 10 frames. This means that each motionrepresentation captures 300ms. Our results showed that using a minimum numberof frames to capture the movement, 2 frames per motion representation and 15frames as the channel’s input, produced the worst result.
In the following experiments, we evaluate the use of inhibitory neurons in ourvisual channels. We evaluate the use of the inhibitory fields on each of the lay-ers, and in combination with all layers of each channel and Table 5.4 shows theresults. The application of the inhibitory fields to the Movement channel did not
89

Chapter 5. Emotion Perception with a Cross-channel Convolution Neural Network
Figure 5.6: Combination analysis for the parameter exploration. When smallerreceptive fields are used, the accuracy is higher. Also, when comparing the samesize of receptive fields, but increasing the number of filter maps, it is possible tosee that the average of the accuracy increases, although the best result was foundwith the smaller number of filter maps.
Table 5.3: Average accuracy, in percentage, for different lengths of the input se-quence, in frames, for the Face channel, and in movement representations, for theMovement channel trained with the FABO corpus.
Face Channel
Sequence Length 1 9 18 36
Accuracy(%) 64.8 80.6 73.6 49.4
Movement Channel
Motion Representations 15 6 3 2
Accuracy(%) 48.3 67.9 74.8 66.2
produce better results, which is due to the fact that the movement representationis already a specified stimulus, and the filters alone were capable of coping withthe complexity of the representation. The inhibitory fields produced better resultswhen applied to the last layer of the Face channel, which confirms that the strongextra-specification on the last layer is beneficial for face expression recognition.
90

5.4. Results
Table 5.4: Average accuracy, in percentage, for the use of inhibitory neurons indifferent layers of the Face and Movement channels trained with the FABO corpus.
Face Channel
Layers None L1 L2 All
Accuracy(%) 80.6 59.9 87.3 64.4
Movement Channel
Layers None L1 L2 L3 All
Accuracy(%) 74.8 41.3 47.8 48.8 45.8
5.4.3 Experiment 3: Emotion Expression Recognition
Visual Emotion Expressions
The combined results of the FABO experiments are presented in Table 5.5 andwe can see that the overall mean accuracy of the integrated representation is thehighest. Also, it is possible to see how some expressions behave with differentmodalities. For example, “Anxiety” and “Puzzlement” expressions had a per-formance similar to the Face and Movement channels individually, but increasedwhen the integrated representation was used. Also, there was a great increase inthe performance for “Disgust” and “Negative Surprise” expressions, showing thatfor these expressions the integrated representation provided more information thaneach modality individually.
Comparing our model to state-of-the-art approaches using the FABO corpusshows that our network performed similar, and in the Face representation better.Table 5.6 shows this comparison. The works of Chen et al. [45] and Gunes andPiccardi [118] extract several landmark features from the face, and diverse move-ment descriptors for the body movement. They create a huge feature descriptor foreach modality, and use techniques as SVM and Random Forest, respectively, forclassification. It is possible to see that the fusion of both modalities improved theirresults, but the performance is still lower than ours. In previous work, we used aMultichannel Convolution Neural Networks (MCCNN) [15], to extract facial andmovement features. That network produces a joint representation, but our cur-rent CCCNN improved this representation through the use of separated channelsper modality and the application of inhibitory fields. One can see a substantialimprovement on the movement representation, mostly because we use a differentmovement representation in the CCCNN.
Auditory Emotion Expressions
Our Music-specific channel obtained the best accuracy, with a total value of 96.4%.The second best result appeared when using the pre-trained filters on the Cross-
91

Chapter 5. Emotion Perception with a Cross-channel Convolution Neural Network
Table 5.5: Accuracy, in percentage, for the visual stream channels trained with theFABO corpus. The results are for the Face channel (F), Movement channel (M)and the integrated Face and Movement channel, representing the visual stream(V).
Class F M V
Anger 74.5 66.3 95.9
Anxiety 78.6 80.5 91.2
Uncertainty 82.3 75.8 86.4
Boredom 93.4 76.3 92.3
Disgust 78.3 65.9 93.2
Fear 96.3 80.0 94.7
Happiness 93.7 60.3 98.8
Negative Surprise 67.2 32.4 99.6
Positive Surprise 85.7 65.7 89.6
Puzzlement 85.4 84.8 88.7
Sadness 89.6 80.1 99.8
Mean 87.3 74.8 93.65
Table 5.6: Comparison of the accuracies, in percentage, of our model with state-of-the-art approaches reported with the FABO corpus for representations of theface, the movement, and both integrated.
Approach Face Movement Both
MCCNN 72.7 57.8 91.3
Chen et al. [45] 66.5 66.7 75.0
Gunes and Piccardi [118] 32.49 76.0 82.5
CCCNN 87.3 74.8 93.65
channel architecture, with a total value of 90.5%, which still almost 6% less thanusing only the Music-specific architecture. Using the Speech-specific architecture,the accuracy was the lowest, reaching the minimum score of 62.5% when applyingthe pre-training strategy. Table 5.7 exhibits all the experimental results on theGTZAN dataset.
On the SAVEE dataset, the Speech-specific channel was the one which obtainedthe best mean accuracy (92.0%). It was followed closely by the pre-trained versionof the Cross-channel architecture, with 87.3%. The trained version of the Cross-channel obtained a total of 82.9%. Here the Music-specific architecture obtainedthe worst results, with a minimum of 63.1% on the trained version. The pre-trained
92

5.4. Results
Table 5.7: Average accuracy and standard deviation for all the experiments usingthe GTZAN dataset.
Experiment Accuracy (STD)
Trained Pre-Trained
Music-Specific 96.4% (+/- 3.4) -
Speech-Specific 68.7% (+/- 3.2) 62.5%(+/- 1.6)
Cross-channel 83.9% (+/- 2.3) 90.5%(+/- 2.2)
Table 5.8: Average accuracy and standard deviation for all the experiments usingthe SAVEE dataset.
Experiment Accuracy (STD)
Trained Pre-Trained
Music-Specific 63.1% (+/- 2.7) 64.5% (+/- 2.3)
Speech-Specific 92.0% (+/- 3.9) -
Cross-channel 82.9% (+/- 2.0) 87.3%(+/- 1.8)
Table 5.9: Average accuracy and standard deviation for all the experiments usingthe EmotiW dataset.
Experiment Accuracy (STD)
Trained Pre-Trained
Music-Specific 22.1% (+/- 1.4) 23.1% (+/- 2.2)
Speech-Specific 21.7% (+/- 2.3) 21.0%(+/- 1.2)
Cross-channel 22.4% (+/- 1.1) 30.0%(+/- 3.3)
version obtained slightly better results, reaching 64.5%. Table 5.8 shows all theexperimental results on the SAVEE dataset.
For the EmotiW dataset the pre-trained version of the Cross-channel archi-tecture gave the highest mean accuracy of 30.0%. All the other combinations,including the trained version of the Cross-channel, achieved accuracies around20%. See table 5.9 for the results of our experiments with the EmotiW dataset.
The results achieved by our architectures are not far away from the state-of-the-art results in the literature. For the GTZAN dataset, our specific architectureperforms close to the system proposed by Sarkar et al [267]. Their approachuses empiric mode decomposition to compute pitch-based features from the audioinput. They classify their features using a multilayer perceptron. Following thesame evaluation protocol we used, they could reach a total of 97.70% of accuracy,
93

Chapter 5. Emotion Perception with a Cross-channel Convolution Neural Network
Table 5.10: Performance of state-of-the-art approaches on the GTZAN dataset.All experiments use 10-fold cross validation and calculate the mean accuracy. Theresults obtained by Sgtia et al. [277] were using a different data split, using 50%of the data for training, 25% for validation and 25% for testing.
Methodology Accuracy(%)
Arabi et al. [5] 90.79
Panagakis et al.[222] 93.70
Sgtia et al.[277]* 83.0
Huang et al. [138] 97.20
Sarkar et al.[267] 97.70
Music-specific 96.40
Cross-Channel 90.50
slightly more than our 96.4% with the Music-specific architecture.
Our Cross-channel architecture, when using the pre-training strategy, obtaineda lower accuracy, but still competitive when compared to other results using differ-ent approaches. Table 5.10 exhibits the results obtained on the GTZAN dataset.All the proposed techniques use a combination of several features, and a genericclassifier such as SVM or MLP. However, using such a large number of audio fea-tures, their approaches are not suitable for generalization, a property that ourMusic-specific architecture has. The approach of Sgtia et al. [277] is similar toours. They evaluate the application of techniques such as dropout and HessianFree training, but do not report the performance of the network neither for learn-ing different features nor for generalization aspects.
For the SAVEE dataset, our approach is competitive. This dataset containsonly speech signals, which are very different from the music signals. That ex-plains the different accuracies obtained by the Music-specific architecture and theSpeech-specific architecture. Once more the pre-trained Cross-channel architec-ture showed its generalization capabilities and was able to achieve a result whichwas comparable to the Music-specific architecture, having less than 3% of accuracydifference. When compared to state-of-the-art approaches, our Music-specific ar-chitecture obtained a result comparable with the work of Muthusamy et al. [215].They use a particle swarm optimization technique to enhance the feature selectionover a total of five different features, with many dimensions. They use an extremelearning machine technique to recognize the selected features. Their work showedan interesting degree of generalization, but still a huge effort is necessary, with thetraining step consuming enormous amounts of time and computational resources.The authors of the SAVEE dataset also did a study to examine the human per-formance for the same task. Using the same protocol, a 4-fold cross validation,they evaluated the performance of 10 subjects on the recognition of emotions onthe audio data. The results showed that most approaches exceeded human per-
94

5.4. Results
Table 5.11: Performance of state-of-the-art approaches on the SAVEE dataset.All the experiments use 4-fold cross validation and we have calculated the meanaccuracy.
Methodology Accuracy(%)
Banda et al. [9] 79.0
Fulmare et al.[101] 74.39
Haq et al.[124] 63.0
Muthusamy et al. [215] 94.01
Speech-specific 92.0
Cross-Channel 87.3
Human Performance [123] 66.5
Table 5.12: Performance of state-of-the-art approaches on the EmotiW dataset.All the results are the mean accuracy on the validation split of the dataset.
Methodology Accuracy(%)
Liu et al. [196] 30.73
Kahou et al.[149] 29.3
Baseline results[70] 26.10
Cross-Channel 30.0
formance on this dataset. Table 5.11 exhibits the state-of-art results and humanperformance on the SAVEE dataset.
The EmotiW dataset proved to be a very difficult challenge. On this dataset,our specific models did not work so well, but as Table 5.12 shows this is also amuch harder task. Due to the huge variability of the data, neither of them wasable to learn strong and meaningful features by itself. When the Cross-channelarchitecture was used with the pre-training strategy, the network was able to learnto correlate the features of each channel, and use them to overcome the complexityof the dataset. Our Cross-channel architecture results are competitive with thestate-of-the-art approaches, and performed better than the baseline values for thecompetition. The work of Liu et al. [196] and Kahou et al. [149] extract morethan 100 auditory features each, and use classifiers such as SVM or multi-layerperceptrons to categorize them. Our Cross-channel architecture results showedthat we can actually obtain similar generalization capability using a simple anddirect pre-training strategy without the necessity of relying on several differentfeature representations. Table 5.12 exhibits the results on the EmotiW dataset.
95

Chapter 5. Emotion Perception with a Cross-channel Convolution Neural Network
Table 5.13: Average accuracy, in percentage, for the auditory and visual streamchannels trained with the SAVEE corpus. The results are for the Face channel(F), Speech channel (S), Speech and pre-trained Music channel, representing theauditory stream (A) and the integrated audio-visual streams, with the Face, Speechand Music channels (AV).
Class F S A AV
Anger 95.4 95.0 92.6 100
Disgust 95.6 100 88.0 100
Fear 89.7 88.0 85.5 100
Happiness 100 81.1 86.1 95.0
Neutral 100 100 91.3 100
Sadness 90.0 93.5 87.4 96.5
Surprise 86.7 86.5 80.5 96.7
Mean 93.9 92.0 87.3 98.3
Multimodal Emotion Expressions
The results of the SAVEE experiments are exhibited in Table 5.13. It is possibleto see that the auditory information yielded the lowest accuracy, and among themthe pre-trained representation was the one with the lowest general accuracy. Thishappens because the data in the SAVEE corpus does not contain music, onlyspeech, which reflects directly on the performance achieved by the network. Still,it is possible to see that the auditory channel composed of the Speech and Musicdoes not decrease substantially the performance of the network, and makes it morerobust to deal with speech and music data.
We also see that the face representation obtained a similar performance to theauditory one, but when combined, the performance tends to increase. This isdue to the fact that when both, face and auditory information, are present, thenetwork can distinguish better between the expressions. This is demonstrated bythe performance of the expressions “Anger”, “Sadness” and “Surprise”, which havea similar performance in individual channels and a higher one in the integratedrepresentation.
Our approach proved to be competitive when evaluated on the SAVEE corpus.When compared to state-of-the-art approaches, our representations showed a resultcomparable to the work of Banda et al. [9]. They use a decision-based fusionframework to infer emotion from audio-visual inputs. They process each modalitydifferently, using linear binary patterns to represent the facial expressions and aseries of audio features to represent speech. After that, a pairwise SVM strategy isused to train the representations. Our network has a similar performance for facerepresentation, but a higher accuracy for audio. We improved 10% the accuracymore than the speech representation. For the multimodal integration, our network
96

5.4. Results
Table 5.14: Performance of state-of-the-art approaches on the SAVEE dataset.
Methodology Face Audio Both
[9] 95.0 79.0 98.0
[124] 95.4 56.3 97.5
CCCNN 93.9 92.0 98.31
Human Performance 88.0 66.5 91.8
has been shown to be competitive, and performed similarly, but with a much lesscostly feature representation process. The authors of the SAVEE dataset, [124],also did a study to examine the human performance for the same task. Usingthe same protocol, a 4-fold cross validation, they evaluated the performance of 10subjects on the recognition of emotions on the audio and video data. The resultsindicate that most approaches exceeded human performance on this dataset. Table5.14 exhibits state-of-art results and human performance on the SAVEE dataset.
The EmotiW corpus proved to be a very difficult challenge. Table 5.15 illus-trates all results on the corpus. It is possible to see that the visual representations,represented by the columns F, M and V, reached better results than the auditoryrepresentation, presented in columns S, Mu and A.
The visual representations indicate a very interesting distribution of accuracies.It is possible to see that when the expressions were represented by the movement,Column M, “Happy” and “Sad” expressions were recognized better on our modelthan the others, showing that for these expressions the movements were more re-liable than the face expression itself. When integrated, the visual representationimproved the performance of most expressions, in particular surprised, “Anger”and “Happy” expressions, which indicates that these expressions are better recog-nized when movement and facial expressions are taken into consideration.
The auditory representation indicates that most of the expressions are notwell recognized only with auditory information, exceptions are angry and happyemotions. This can be related to the nature of the dataset, because usually inmovies happy and angry are expressed with similar song tracks or intonations.The integrated representation for the auditory stream performed better than theindividual ones in all the expressions.
Finally, the multimodal representation was the one with the best performance.We see an improvement in classification of “Sad” and “Anger” expressions, butalso in fear and surprised ones. This is due to the fact that the combinationof different sound tracks, facial expressions and movement for these expressionsrepresents them better than a single modality. In general, it is possible to see thatsurprised, disgusted and sad expressions were the ones with the lowest performancein all modalities.
Table 5.16 shows the results on the EmotiW dataset. On this dataset, theperformance of our model dropped, but as Table 5.16 shows this is also a much
97

Chapter 5. Emotion Perception with a Cross-channel Convolution Neural Network
Table 5.15: Average accuracy, in percentage, for the auditory and visual streamchannels trained with the validation set of the EmotiW corpus. The results arefor the Face channel (F), Movement channel (M), Face and Movement channeltogether, representing the visual stream (V), Speech channel (S), Music channel(Mu), Speech and Music channel together, representing the auditory stream (A)and visual-auditory integration (AV).
Class F M V S Mu A AV
Anger 70.2 50.8 77.8 56.4 50.7 70.1 80.3
Disgust 18.2 9.4 18.7 12.4 2.6 15.2 23.4
Fear 21.4 16.8 20.2 7.8 6.5 7.2 30.8
Happiness 67.2 75.6 77.8 59.1 65.4 72.0 81.2
Neutral 67.2 57.7 70.9 10.8 15.6 25.4 68.7
Sadness 22.4 21.2 23.2 8.3 9.8 16.2 24.5
Surprise 5.4 10.0 12.1 0.0 2.1 4.1 14.0
Mean 38.8 34.5 42.9 22.1 21.8 30.0 46.1
Table 5.16: Performance of state-of-the-art approaches on the EmotiW dataset.All the results calculate the mean accuracy on the validation split of the dataset.
Methodology Video Audio Both
[196] 45.28 30.73 48.53
[149] 38.1 29.3 41.1
[70] 33.15 26.10 28.19
CCCNN 42.9 30.0 46.1
harder task. Due to the variability of the data, neither of the modalities providesan overall high accuracy. Our model results are competitive with the state-of-the-art approaches, and performed better than the baseline values of the competition.The works of Liu et al. [196] and Kahou et al. [149] extracts more than 100auditory features each, and use several CNNs to extract facial features. A vectorcomposed of the output of the CNN are used by several classifiers such as SVMand multi-layer perceptron to categorize the input into emotions. The results ofour models showed that we can actually obtain similar generalization capabilityusing a simple and direct pre-training strategy without the necessity of relying onseveral different feature representations.
98

5.5. Discussion
Figure 5.7: Implementing inhibitory fields in different layers of the network pro-duces different features. Each visualization corresponds to one filter on a de-termined layer. It is possible to see how the inhibitory fields affect the featureextraction capabilities of each layer.
5.5 Discussion
In this section we discuss two concepts of our network. First we analyze theCCCNN architecture, and how the introduction of inhibitory fields and the Cross-channel contribute to the representation. Then we discuss how the model repre-sents multimodal stimuli, how the expression is decomposed inside the model andwhat each layer represents.
5.5.1 Inhibitory Fields and Cross Channels
The application of the inhibitory fields has been shown to increase the performanceof the network only when they were implemented in the last layer of the facechannel. That was caused by the over specialization of that the inhibitory fieldsproduced in the layer’s filters, which turned to be beneficial for the model. Whenthe inhibitory fields were applied to the first layer, the filters learned more complexpatterns, which did not help in the feature generalization. That phenomenon iseasily visible when we visualize the features that the network learned using thedeconvolution process illustrated in Image 5.7, which shows the visualizations ofthe internal knowledge of one filter in different layers of the network.
When no inhibitory filter was implemented, the first layer the network learnedsome edge detectors, which could filter mostly the background and hair of theperson. In the second layer, the network constructed a higher level of abstraction,mostly the shape of the face, and some regions such as eyes, mouth and nose areroughly highlighted. When we implement the inhibitory fields in the first layer only,we find that the more information is filtered. The filters detected more specificregions, filtering much more information which is relevant to represent the facialexpression. This causes a problem in the second layer, which then tries to learnvery specific concepts, and constructed a very limited representation. When theinhibitory fields are applied in the last layer, we found a very clear distinction in
99

Chapter 5. Emotion Perception with a Cross-channel Convolution Neural Network
Figure 5.8: Applying the Cross-channel on the individual representations bringsresults on different features. Note that the face representation after the applicationof the Cross-channel changed to include the hands movement.
the representation. The shape of the face is very clear, but regions as eyes, nose andmouth are better represented than when no inhibitory fields are applied. Finally,when we applied the inhibitory fields in both layers, the final representation doesnot contain any reliable information with some very rough representation of theeyes and nose.
The cross channels also have an impact on the quality of the extracted filters.Our Cross-channels integrates two channels into one representation, which wasshown to be more efficient and robust, but also reduced the dimensionality ofthe data. The application of the Cross-channels created a new representation ofthe input stimuli, which is different from the individual representation. Figure5.8 illustrates the visualizations of the last layer of the individual channels andthe Cross-channel. We can see that the Cross-channel features are different fromthe individual representation, and they changed to capture an important feature:the hands over the face. Furthermore, we see that the facial features changeddrastically to incorporate the movement of the hands, which is now also highlightedin the movement channel.
5.5.2 Expression Representation
The application of the visualizations also helps us understand how the networkrepresents an expression. It is possible to see how the expressions are decomposedinside the network, and have an insight on the role of each layer of the network tobuild the expression representation. By visualizing the same region of neurons forseveral images, it is possible to identify for which regions those neurons activatemost strongly. This way, we can analyze which parts of the input stimuli activateeach filter of the network. Figure 5.9 illustrates this concept, where it is possibleto see what each filter codes for in each layer. To generate these visualizations, wecreated an average per filter in the Face channel for all the images in the FABOcorpus.
The filters learn to represent different things, which are complementary for theemotion expression. In the first layer, mostly background and hair information isfiltered. Filter 5 highlights the region of the mouth out of the image, while filter 2keeps the eye information.
The most interesting representations occur in the second layer, where filters
100

5.5. Discussion
Figure 5.9: Mean visualization from all images in the FABO corpus per filter inall the layers of the Face channel. It is possible to specialized filters, which helpsus to understand how the expression representation is created.
1 and 2 represent mostly the face shape and positions of eyes, nose and mouth.Filters 3 and 4 represent the eyes, nose and mouth shapes, where filter 3 activatesmostly for the cheeks and closed mouths and filter 4 for open mouths. Differentfrom the others, filter 5 specialized on eyebrows mainly.
The filters in our network show that our network actually builds the face ex-pressions based on the changes of some particular regions, which is consistent withthe Facial Action Coding System (FACS) [86]. The FACS is a coding scheme torepresent facial expressions based on movement of facial muscles. The movementsin FACS are mostly related to eyes, mouth, eyebrows and cheek regions, whichare very similar to the regions detected by our network, showing that the fea-tures which emerge in the filters are actually related to human facial expressionperception.
Our network filters react to very specific patterns in the input images, whichare related to human facial expressions. We can see how these patterns are strongwhen we send to the network images which resemble human expressions, this isillustrated in Figure 5.10. The network highlighted regions which were closelyrelated to human features. In the image with the dog, the position of the eyesand mouth were detected, and in the Don Quixote painting, the shape of the facewas highlighted. In all images, it is possible to see that the filters of the networkhighlighted regions of interest that have a similar contrast as some facial features,as face, eyes and mouth shapes. On the other hand, the network is strongly domainrestricted. It will always try to find human facial features in the images, even whenthey are not present. This can cause problems, especially in the EmotiW corpus,illustrated in the last column of Figure 5.10.
101

Chapter 5. Emotion Perception with a Cross-channel Convolution Neural Network
Figure 5.10: Visualization of the facial representation for different images. We seethat the network tries to find human facial features, such as mouths, eyes and faceshapes in the images.
5.6 Summary
In this chapter, we proposed a novel architecture for multimodal emotion expres-sion representation. Our model introduces Cross-channel Convolution Neural Net-works (CCCNN) to learn specific features of audio-visual stimuli. The networkimplements several channels, and each one learns different emotional features fromeach modality and applies a cross-convolution learning scheme to integrate audi-tory and visual representations of emotion expressions.
The network architecture is inspired by the ventral and dorsal stream modelsof the visual and auditory systems in the brain. Also, it implements shuntinginhibitory neurons to specialize the deeper layers of the network, avoiding thenecessity of a very deep neural network. Such mechanisms showed to help us torepresent spontaneous and multimodal expressions from different subjects.
We also introduce visualization tools which allow us to understand and identifythe knowledge of the network. By using the deconvolution process to visualize theinternal representation of the CCCNN filters we showed how our model learnsdifferent expressions in a hierarchical manner.
To evaluate our model, we use three different corpora: the Bi-modal face andbody benchmark database (FABO) with visual expressions, the Surrey Audio-Visual Expressed Emotion (SAVEE) Database with audio-visual expressions andthe corpus for the Emotion-Recognition-In-the-Wild-Challenge (EmotiW), whichcontains audio-visual clips extracted from different movies. Each corpus containsdifferent expression information, and we use them to fine tune the training toevaluate each modality. Our network showed to be competitive, and in the case ofthe FABO corpus better when compared to state-of-the-art approaches.
102

Chapter 6
Learning Emotional Concepts
with Self-Organizing Networks
6.1 Introduction
To classify emotion expressions is a difficult task: First the observation of variousdifferent modalities is necessary. Second, the concept of emotion itself is not pre-cise, and the idea of classifying what another person is expressing based on verystrict concepts, makes the analysis of such models difficult.
Dealing with such set of restricted emotions is a serious constraint to HRIsystems. Humans have the capability to learn emotion expressions and adapttheir internal representation to a newly perceived emotion. This is explained byHamlin [120] as a developmental learning process. Her work shows that humanbabies perceive interactions into two very clear directions: positive and negative.When the baby is growing, this perception is shaped based on the observation ofhuman interaction. Eventually, concepts such as the five universal emotions areformed. After observing individual actions toward others, humans can learn howto categorize complex emotions and also concepts such as trust and empathy. Thesame process was also described by Harter et al. [125], Lewis et al. [188] and Ponset al. [242].
In the previous chapter we introduced the CCCNN for multimodal emotionexpression representation, and in this chapter we extend the model by adapting itto learn different representations and cluster them into emotional concepts. Basedon the findings of Hamlin et al. [120], and her emotional learning theory, weintroduce the use of the CCCNN as innate perception mechanism, and make useof self-organizing layers to learn new emotional concepts. The model is evaluatedin the recognition and learning of new expressions and we proceed with an analysisof the model while it learns multimodal expressions, and study the developmentof emotional learning from different subjects.
103
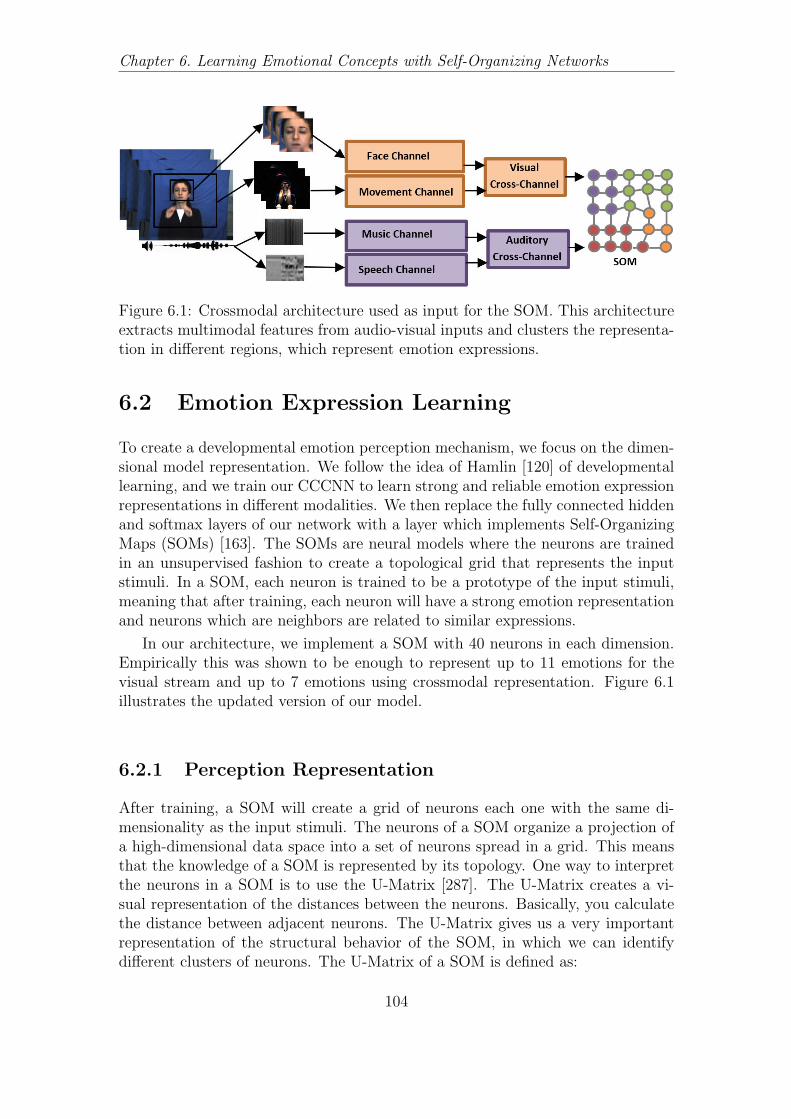
Chapter 6. Learning Emotional Concepts with Self-Organizing Networks
Figure 6.1: Crossmodal architecture used as input for the SOM. This architectureextracts multimodal features from audio-visual inputs and clusters the representa-tion in different regions, which represent emotion expressions.
6.2 Emotion Expression Learning
To create a developmental emotion perception mechanism, we focus on the dimen-sional model representation. We follow the idea of Hamlin [120] of developmentallearning, and we train our CCCNN to learn strong and reliable emotion expressionrepresentations in different modalities. We then replace the fully connected hiddenand softmax layers of our network with a layer which implements Self-OrganizingMaps (SOMs) [163]. The SOMs are neural models where the neurons are trainedin an unsupervised fashion to create a topological grid that represents the inputstimuli. In a SOM, each neuron is trained to be a prototype of the input stimuli,meaning that after training, each neuron will have a strong emotion representationand neurons which are neighbors are related to similar expressions.
In our architecture, we implement a SOM with 40 neurons in each dimension.Empirically this was shown to be enough to represent up to 11 emotions for thevisual stream and up to 7 emotions using crossmodal representation. Figure 6.1illustrates the updated version of our model.
6.2.1 Perception Representation
After training, a SOM will create a grid of neurons each one with the same di-mensionality as the input stimuli. The neurons of a SOM organize a projection ofa high-dimensional data space into a set of neurons spread in a grid. This meansthat the knowledge of a SOM is represented by its topology. One way to interpretthe neurons in a SOM is to use the U-Matrix [287]. The U-Matrix creates a vi-sual representation of the distances between the neurons. Basically, you calculatethe distance between adjacent neurons. The U-Matrix gives us a very importantrepresentation of the structural behavior of the SOM, in which we can identifydifferent clusters of neurons. The U-Matrix of a SOM is defined as:
104

6.2. Emotion Expression Learning
Figure 6.2: U-Matrix of a SOM with 40 neurons in each dimension and trained withhappy, sad and neutral expressions. It is possible to see the neurons, representedby dots, in different regions, which represent the distances among the neurons.
U −Matrix =∑
Mm=1
k∑
i=1
d(w − wm), (6.1)
where M indexes the neighbor neurons, and w is the set of weights of each neuron.The distance calculation is given by d(x, y), and is usually the Euclidean distance.
After training, our SOM has neurons which represent emotion expressions,and we can visualize them by calculating the U-Matrix. Our SOM is trainedcompletely in an unsupervised fashion, which means that we do not identify theexpressions we are showing to the network with any class and the U-Matrix showsthe distribution of the neurons, or emotion expressions, over a grid. We use thisgrid to identify regions of neurons that have a similar representation, and findcertain patterns of the neuron distribution. Figure 6.2 illustrates an example ofa U-Matrix calculated of a SOM with 40 neurons in each dimension and trainedwith three different expressions: happy, sad and neutral. It is possible to see theneurons, marked as the dots, and different regions based on the distances betweenthe neurons.
In a SOM we can calculate the distance of a certain input for all the neurons,and the neuron which has the smallest distance is selected as the best matchingunit, which represents the neuron that mostly resembles the presented input. How-ever, instead of using only one neuron to represent an expression, we can use thedistances of each neuron to the input to create an activation map, showing whichneurons of the SOM are more related to the input. This way, we can, for example,
105

Chapter 6. Learning Emotional Concepts with Self-Organizing Networks
Figure 6.3: Examples of activation maps when three different expressions for eachclass are presented. It is possible to see that each class has an activation patterndifferent from the other classes.
identify which regions of the SOM activate mostly when happy or sad expressionsare presented.
The neurons which are strongly related to a presented input, will activate most:for instance, a certain neuron that activates for a happy expression will have a loweractivation when a sad expression is presented. This way, by visualizing severalactivation maps, we can have an emotion representation which is very close to adimensional perception, but learned in an unsupervised way. Figure 6.3 illustratesdifferent activation maps. It is possible to see that the activation pattern changeswhen different happy, angry or neutral expressions are presented to the network.
The visualization of the knowledge learned by the SOM is not easy, similar tothe human perception of emotions. Emotion expressions are learned by humans ina continuous process of perceiving new expressions and adapting them to previousknowledge [120]. This process happens through childhood by assimilating similaremotions with known concepts, such as happiness, pain or depressive states. Thismeans that each person has their own emotion perception mechanism, based ondifferent features and different perceived emotions. We simulate this process byusing a very strong feature representation, learned by the CCNN, and updatingour SOM with perceived expressions. In this case, our SOM represents a uniqueperception representation, which could be related to a person’s own perception.
This mechanism helps us to interpret emotion expressions in general. By cre-ating the person’s specific activation maps, we can identify how this person’s ex-pression behavior differs. Also, we can create specific SOM’s for specific person’s,or for a specific group of persons. This way we can create very personal represen-tations of expressions, which are suited for different subjects and can be updateddifferently. This allows the model to have an individual knowledge about how aparticular person expresses its own emotions. This way, a person that expresses
106

6.2. Emotion Expression Learning
themselves in a more shy way will have a different neuron structure than one whichis more excited, and both can be represented by different SOMs.
6.2.2 Expression Categorization
With the use of the U-Matrix and the activation maps, we can identify patterns inthe SOM structure. We can assimilate concepts to similar patterns, finding whichregions of the network fire most for known expressions. This means that we canidentify network regions which fire for happy or sad expressions.
Using the same principle, we can create a categorical view of the network’srepresentation. This helps us to use our model in emotion recognition tasks. Theadvantage of using our model is that we can create different categorical modelswithout re-training the network. If we want to analyze simple separations aspositive and negative emotions, we can easily identify which regions of the networkfire for these categories. If we want to increase the number of categories, we justhave to increase the number of clusters. So, instead of finding regions that fireonly for negative or positive, we can find regions that fire for happy, sad, surprisedand disgusted.
To find these clusters, we use the U-Matrix to create a topological representa-tion of the neurons and the K-means algorithm [201] to cluster them. The K-meansalgorithm partitions a set of observations into N clusters, based on the distanceof individual observations to each other. The goal of K-means is to minimize thewithin-cluster sum of squares, which is be defined as
K = argmink∑
i=1
||(c− µi)|| , (6.2)
where K indicates a cluster, c is one observation and µ is the mean of each obser-vation.
The limitation of our model is directly related to the SOM architecture limita-tion: we have to define the number of neurons before training them, which restrictsthe number of expressions that can be categorized. However, with an optimal num-ber of neurons, we can create different categories of expressions without re-trainingthe network.
Using the expression categorization, we can use our network to recognize differ-ent emotion categories. If, at first, we want to recognize only positive and negativeemotions, we just have to define two clusters. Then, if we need to identify betweena happy and an excited expression, we can apply the K-means algorithm only tothe region of the network which has a bigger probability to activate for these con-cepts. In the same way, if we want to identify different kinds of happy expressions,we can create clusters only for this specific region. Figure 6.4 illustrates the appli-cation of K-means to the network illustrated in Figure 6.2. In this example, thenetwork is clustered for three classes: happy, sad and neutral.
107

Chapter 6. Learning Emotional Concepts with Self-Organizing Networks
Figure 6.4: K-means algorithm applied to the SOM illustrated in Figure 6.2. Wecluster the neurons into three expressions: happy, sad and neutral. We use theK-means clusters to classify expressions.
6.3 Methodology
To evaluate our expression learning architecture, we use the trained filters of theCCCNN to extract high-level expression representations and trained a series ofSOMs with them. We perform three sets of experiments: the first one to evaluatethe capability of the model to classify expressions and the second to evaluate thecapability to learn new expressions. In the last set of experiments, we evaluate theuse of the model in creating behavior analysis for independent subjects.
For all experiments, 30 experiment routines were performed and the meanof the accuracy was collected for each expression individually, which helps us tounderstand our model better.
6.3.1 Experiment 1: Emotion Categorization
After training the CCCNN with the multimodal expressions of the EmotiW corpus,we train a SOM and use it in a classification task using K-means to cluster theneurons in a number of specified classes. We compare the use of the SOM with theCCCNN performance for classifying crossmodal data. These experiments show usthe capability of the SOM to generalize expressions.
108

6.4. Results
6.3.2 Experiment 2: Learning New Expressions
In this set of experiments, we measure the capability of the SOM to learn newexpressions. For this purpose, we train a SOM with a limited set of expressions,composed by only sad and happy expressions. Then, we systematically present newexpressions to the SOM, such as angry, disgusted and surprised ones, and we alsocalculate the mean of the activation maps for each expression. This way we showthe capability of the SOM to learn different expressions. For these experimentswe use the FABO corpus, because it contains a controllable environment, which isnot present in the EmotiW dataset.
6.3.3 Experiment 3: Individual Behavior
In the last round of experiments, we use of the SOM for analyzing the behavior ofexpressions. We perform experiments with the SAVEE corpus only, which containsdata from four different subjects. We train one SOM for each subject and comparethe differences of the expressions based on the clusters of each SOM.
6.4 Results
6.4.1 Experiment 1: Emotion Categorization
For these experiments, we trained our SOM with the emotion representation ob-tained by the CCCNN in of the previous chapter. We then cluster the neuronsof the SOM in 7 regions with K-means algorithm, so each region represents oneclass of the EmotiW corpus. Figure 6.5 illustrates the clustered regions from 0to 6, respectively: anger, disgust, fear, happiness, neutral, sadness and surprise.It is possible to see that the neutral expressions, represented by class number 5,have almost all the others expressions as their neighbor. Also, angry expressions,class number 1, are between happy, class number 4, and sad expressions, classnumber 6. And finally, it is possible to see that fear expressions, class number 3,are closely related to surprise expressions, class number 7. In this case, some ofthe fear expressions are between happy and surprise.
Using the clusters, we calculated the accuracy of the SOM in the validation setof the EmotiW corpus. Table 6.1 shows the results. It is possible to see that withthe SOM clustering, such expressions as disgust and sadness show an increase ofalmost 7% in performance. As we see in the cluster, sad and disgusted expressionsare neighboring regions, and the application of the SOM created a better separationborder, which would explain the performance increase. In general we have animprovement of more than 3% in the accuracy when using the SOM.
6.4.2 Experiment 2: Learning New Expressions
In our next experiment, we trained the SOM with happy and sad expressions fromthe FABO corpus. We then proceed by feeding angry, disgusted and surprised
109

Chapter 6. Learning Emotional Concepts with Self-Organizing Networks
Figure 6.5: K-means algorithm applied to the SOM trained with the EmotiWmultimodal representation. Six emotions were clustered: surprise, sadness, angry,happiness, fear, neutral and disgust.
Table 6.1: Mean accuracy, in percentage, for the multimodal representation in thevalidation set of the EmotiW corpus. The results are for the CCCNN and theSOM.
Class CCCNN SOM
Anger 80.3 85.3
Disgust 23.4 30.3
Fear 30.8 32.1
Happiness 81.2 82.3
Neutral 68.7 67.3
Sadness 24.5 31.7
Surprise 14.0 17.6
Mean 46.1 49.5
110

6.4. Results
Figure 6.6: Activations plotted on top of a clustered SOM. The SOM was trainedwith sad and angry expressions and each activation shows the mean activationmap when feeding the network with angry, disgusted and surprised expressions.
expressions to the network, and generate the mean of the activation maps foreach set of expressions. Figure 6.6 illustrates the activations for each new set ofexpressions plotted on top of the clustered SOM. In this experiment, the networknever saw angry, disgusted or surprised expressions and we can see how the neuronsactivate when these expressions are presented.
Angry expressions activated a mixed region of neurons, between the sad andhappy regions. Two neurons had a higher activation, in both regions. This iscongruent with the regions found when analyzing the EmotiW SOM, where angryexpressions were represented between happy and sad. Expressions of “Disgust”were mostly activated by neurons on the sad region, which is also congruent withthe cluster of the EmotiW SOM. And finally, the “Surprise” expressions weremostly activated in the “Happiness” regions, with some activation in the angryregion.
We then proceeded to re-train the network on the new expression. We used thenetwork trained with sad and happy expressions, and created four new networks,three of them trained with the addition of one new expression, and the fourth onewith all five expressions. Figure 6.7 illustrates the clusters of each network. Wecan see that the disposition of the new clusters is similar to the activation mapsof the network trained with only two expressions. That demonstrates how eachemotion expression can be related to others, and our network is able to use thisrelation to learning new expressions.
6.4.3 Experiment 3: Individual Behavior
In the final set of experiments with the SOM, we train one SOM with expressions,represented by the Face and Speech channels, from each one of the four subjectsfrom the SAVEE corpus, which are identified as DC, JE, JK and KL. We trainedeach SOM using a 4-fold cross validation strategy, only with the data of eachindividual subject. We then calculated the accuracy for each subject, which isshown in Table 6.2.
We separated the regions of each SOM into seven classes, and produced cluster
111

Chapter 6. Learning Emotional Concepts with Self-Organizing Networks
Figure 6.7: We train a network with two kinds of expressions: happy and sad.Systematically add one different expression and re-train the network. At the end,we train a network with the five expressions together.
Table 6.2: Mean accuracy, in percentage, for the auditory and visual stream chan-nels trained with a SOM on the SAVEE corpus. The results are presented for thefour different subjects: DC, JE, JK and KL.
Class DC JE JK KL
Anger 100.0 94.3 100.0 92.0
Disgust 100.0 100.0 100.0 90.9
Fear 100.0 100.0 96.7 100.
Happiness 99.4 99.1 100. 97.7
Neutral 98.3 100.0 100.0 96.7
Sadness 96.7 97.8 100.0 97.8
Surprise 100.0 100.0 97.9 98.2
Mean 99.1 98.7 99.2 98.3
images for each subject, which are illustrated in Figure 6.8. Analyzing each clus-ter, we can see that the same expressions have different regions for each subject.Analyzing these images, it is possible to obtain some information about how eachsubject expresses itself. For each subject, the same number of samples is recordedfor each emotion category, so there is no bias to one expression in each subject.
Except for the network of subject JE, all others clustered expressions of “Sur-prise” in a neighboring region with “Happiness” expressions. On the other hand,all of them clustered “Surprise” in a neighbor region to “Angry” and “Fear” ex-pressions. That indicates that JE “Surprise” expressions are less happy than theothers. Also, the “Disgust” expression is different for each subject. Although allof them have “Disgust” expressions as a neighbor of “Sad” expressions, the otherneighboring expressions are different. It is possible to see that for DC, disgustedexpressions are closely related to “Angry”, for JE with “Fear”, JK with “Happy”and KL with “Surprise” expressions. Looking for the region that each expressiontakes part in, it is possible to see that JK’s network clustered “Happy” expressions
112

6.5. Discussion
Figure 6.8: Trained networks with expressions of each subject of the SAVEE cor-pus: DC, JE, JK and KL. It is possible to visualize how different each subjectexpresses emotions by analyzing the network clusters.
with a larger region when compared to the other subjects, which could be an indi-cation that JK expresses happiness different than the others. The same happenswith JK’s “Disgust” expression. On the other hand, his “Neutral” expressions havea smaller region than the others, indicating that most of his neutral expressionsare very similar to one another.
6.5 Discussion
Some regions of the CCCNN code for specific features, such as face shape, eyes,mouth among others. But, once these features are related to an emotion expression,it is the role of the model, in this case of the fully connected hidden and thesoftmax layers to classify these features into emotions. These layers have someinformation about emotion expression, but they do not store any information aboutthe expressions itself, only about the separation space. Replacing these neurons bya SOM gives the model a powerful tool to represent emotion expressions. Besidescreating a more flexible separation region, the SOM allows the model itself to storeinformation about the expressions.
6.5.1 The Prototype Expressions
Each neuron in the SOM represents a prototype of an expression, which is tunedto be similar to the data used to train the model. This means that each neuronalone codes for an expression, and neighbor neurons code similar expressions. Inthis way, we can simulate the spatial separation that the hidden and the softmaxlayers produce by clustering the neurons in different regions, giving the SOM thecapability of classifying expressions. This means that a real expression has to berepresented by one prototype expression in order to be classified. This showed howto improve the performance of classification tasks.
The prototype expressions also help our model to code the concept of theexpression itself. While the filters on the CCCNN code for specific features from
113
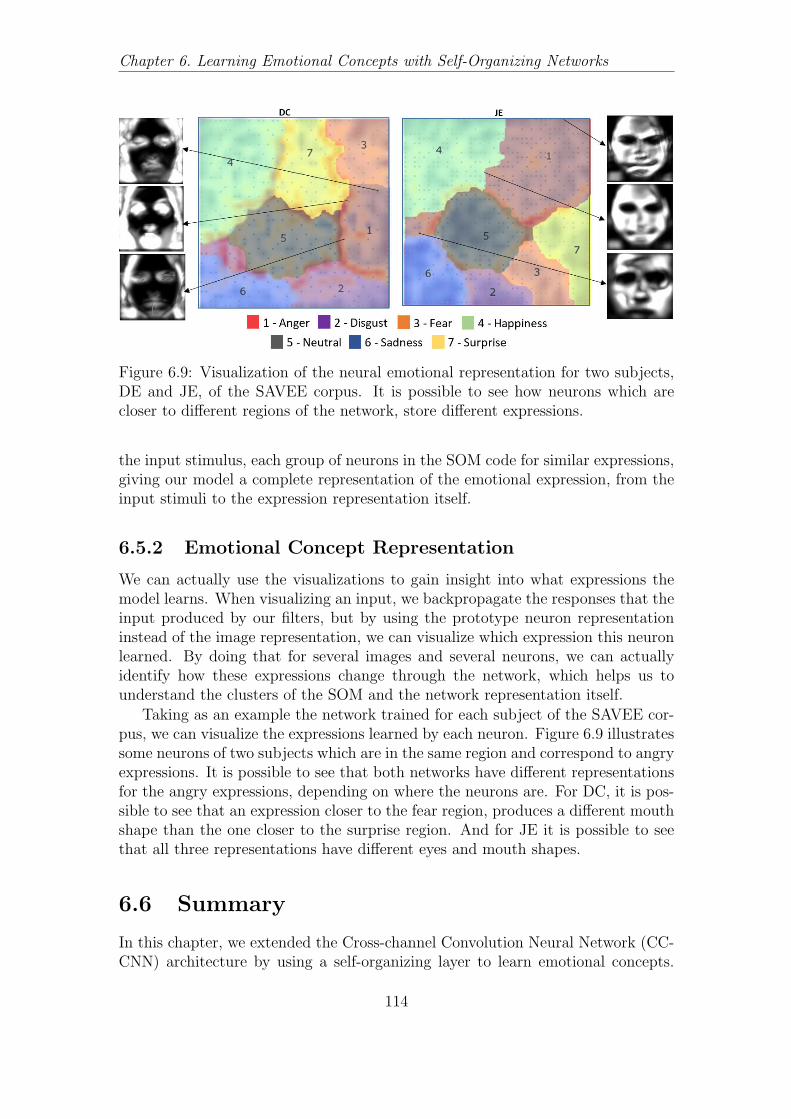
Chapter 6. Learning Emotional Concepts with Self-Organizing Networks
Figure 6.9: Visualization of the neural emotional representation for two subjects,DE and JE, of the SAVEE corpus. It is possible to see how neurons which arecloser to different regions of the network, store different expressions.
the input stimulus, each group of neurons in the SOM code for similar expressions,giving our model a complete representation of the emotional expression, from theinput stimuli to the expression representation itself.
6.5.2 Emotional Concept Representation
We can actually use the visualizations to gain insight into what expressions themodel learns. When visualizing an input, we backpropagate the responses that theinput produced by our filters, but by using the prototype neuron representationinstead of the image representation, we can visualize which expression this neuronlearned. By doing that for several images and several neurons, we can actuallyidentify how these expressions change through the network, which helps us tounderstand the clusters of the SOM and the network representation itself.
Taking as an example the network trained for each subject of the SAVEE cor-pus, we can visualize the expressions learned by each neuron. Figure 6.9 illustratessome neurons of two subjects which are in the same region and correspond to angryexpressions. It is possible to see that both networks have different representationsfor the angry expressions, depending on where the neurons are. For DC, it is pos-sible to see that an expression closer to the fear region, produces a different mouthshape than the one closer to the surprise region. And for JE it is possible to seethat all three representations have different eyes and mouth shapes.
6.6 Summary
In this chapter, we extended the Cross-channel Convolution Neural Network (CC-CNN) architecture by using a self-organizing layer to learn emotional concepts.
114

6.6. Summary
This structure gave the network the ability to cluster different expressions intosimilar concepts, in an unsupervised manner. This allows the model to learn howto identify different expressions into emotional clusters, introducing the capabilityto learn new expressions.
Using visualization techniques, we also showed how the model learned differentclusters. It was possible to see the representation that each neuron learned, in theform of prototype expressions, and how they differ from each other, showing thatin our model similar expressions are represented by neighboring neurons.
Our self-organizing layer presents two key features: First, it can learn new emo-tional concepts using expression cluster. These characteristics allows the model toadapt its knowledge to different domains and subjects, being able to generalize therepresentation, or specialize it, if necessary. Second, the model uses the prototypeexpressions to abstract emotional concepts, creating a robust emotional represen-tation. In our experiments, we showed that this new emotional representationimproved the recognition of spontaneous expressions.
We evaluated our new model in different tasks: cluster emotions, learn newemotions and behavioral analysis. The model was able to cluster different spon-taneous expressions in similar regions and expand its learned representation withnew emotional concepts. Used for behavioral analysis, the model was able to de-fine patterns on how different subjects expressed themselves, and by visualizingthe network topology, it was possible to represent these differences visually.
115

Chapter 6. Learning Emotional Concepts with Self-Organizing Networks
116

Chapter 7
Integration of Emotional
Attention and Memory
7.1 Introduction
This chapter presents our integrated model for emotional attention and mem-ory modulation, which contributes to our model in recognition and representationtasks. The models presented in Chapter 5 and Chapter 7 are able, respectively, tolearn how to represent spontaneous expressions and to create emotional clusterswhich indicate affective concepts. However, the application of such models in real-world scenarios implies serious restrictions. First, attention is a very importantpart of emotional perception, and almost none of the proposed models implementany attention mechanism. Second, as explained in chapters 3 and 2, the under-standing of emotional concepts are modulated by several memory mechanisms.By implementing memory modulators to our models, we intend to make it robustto emotion concepts determination, individual subjects behavioral learning andachieve a more detailed environment perception.
Cross-modal emotional learning happens in different brain regions [208, 92],and we aim to the develop our model as inspired by neural architectures. First, weintroduce a visual emotional attention model, which is inspired by the two-stagehypothesis of emotional attention [32], which states that attention modulationhappens in parallel processing between the amygdala complex and the visual cor-tex, but after a fast-forward only processing has happened. Second, we propose amemory model based on growing neural networks, which is applied to the learningof emotional concepts. Lastly, we integrate our model in an emotional learningarchitecture, which takes into consideration attention and memory modulationand apply it to different human-human and human-robot interaction tasks. Weevaluate our model based on three characteristics: emotion expression learning,emotional attention, and individual affective maps estimation.
117

Chapter 7. Integration of Emotional Attention and Memory
7.2 Emotional Attention
The first step towards an emotional attention mechanism is to introduce a selectiveattention system. Although many computational models of attention were intro-duced in the past decades [100], none of them take into consideration emotionalmodulation. That means, that none of these models implement any emotional as-pect of the region of interest perception, which is an important mechanism foundin humans for improving spatial attention [229, 233] and emotion recognition [288].We introduce, here, an attention model which is closely related to emotional per-ception.
Our model combines the idea of hierarchical learning and selective emotionalattention using convolutional neural networks (CNN). Our approach differs fromtraditional CNN-based approaches in two factors: first, the input stimuli are com-posed of the whole scene, which may or may not contain people expressing emo-tions. Second, the network is trained to a) localize spatially where the emotionexpression is in the visual field and b) identify if the detected emotion expressionis interesting enough to attract the attention of the model.
We use our model to detect emotional events conveyed by face expressionsand bodily movements. In this scenario, each convolutional unit learns how toprocess facial and movement features from the entire image. We differ from simpleclassification tasks by not tuning the convolutional units to describe forms, butrather to identify where an expression is located in the image. Therefore, weimplement a hierarchical localization representation where each layer deals with asub-region of the image. The first layers will learn how to detect Regions of Interest(ROI) which will then be fine-tuned in the deeper layers. Because the pooling unitsincrease the spatial invariance, we only apply them to our last layers, which meansthat our first layers are only composed of convolutional units stacked together.In this section 7.2, we describe our model, starting with common CNNs and ouremotional attention model. To train our network as a localization model, we use adifferent learning strategy based on probability density functions, which will alsobe explained in this section.
Being a CNN-based model, our architecture learns implicit feature extractorsand by investigating the learned representations, we identified regions of the net-work which coded for different visual modalities. While specific filters detected thefacial expression, others focused on the body movement. That approximates ourmodel from the first visual cortex areas, and we use this knowledge to integrateour attention model with our CCCNN architecture.
7.2.1 Attentional Salience Learning Strategy
To achieve the localization processing, we build our CNN architecture in a par-ticular way: we only apply pooling operations in the last layers. Pooling usuallyintroduces space invariance, which is in contrast with our concept of identifying aregion of interest. Therefore, pooling is only applied in the last convolutional twolayers, i.e. after we have identified a possible interest region by filtering information
118

7.2. Emotional Attention
with the convolutional units.We observed that the use of the shunting neurons in the last layers of our
network caused an interesting effect in the learned filters. As we feed the networkwith a full image and expect it to output a location, we are training the filters todetect unlabeled emotion expressions. Since the first two layers have no pooling,the filters are applied to the whole image to specify where possible expressionsare occurring. By applying the shunting neurons on this layer, we increase thespecification of the layer and assure that it can learn, indirectly, how to distinguishbetween different expressions.
CNNs are usually trained using strongly labeled classes, which provides aninterpretation of the features learned by the filters. However, this also implicitlyguides the learning process to shape the learned filters to detect features whichare specific for a classification task. As an example, the concept of training thenetwork to detect categorical expressions such as anger, happiness, and sadness,will enforce the filters to detect features which are important for such classes,ignoring possible other categorical emotions. The biggest problem, when usingsuch models for localization, is that a CNN will reduce the input dimension andin the process introduces robustness against spatial translation. In a localizationtask, the spatial translation should be maintained, as we want to find where in theimage a certain structure is located. To adapt the CNN to a localization task, wetrain our network to create salience regions on the input stimuli. This way, we donot have specific classes, such as the ones mentioned above. The model is trainedusing a probability distribution (instead of a class attribution) that indicates thelocation of interest.
Our model has two output layers, each one responsible for describing positionsof the 2D visual field. One of the output layers gives the positions on the X axis andthe other on the Y axis, which means that each output layer has different dimen-sions. Furthermore, using a probability distribution allows our model to convergefaster since the concept of having a precise position would be hard to learn. Theshape of the distribution changes, e.g. depending on how close the expression isbeing performed with respect to the camera. Using a probability distribution asoutput also allows us to identify other interesting regions in the images, allowingdifferent expressions to be localized at the same time. Figure 2 illustrates an inputsample to the network and the corresponding output distribution probabilities.
7.2.2 Attention Model
The model uses as input a sequence of 10 images, each one with a size of 400x300pixels. That means that with a frame rate of 30 frames per second, our modellocalizes expressions at approximately 300ms, which is the interval of a durationof a common expression, between 200ms and 1s [83]. Our model is illustrated inFigure 7.2.
Our model implements 4 convolution layers, the first three with 4 filters anddimensions of 9x9 in the first layer and 5x5 in the second and third. A fourthconvolution layer with 8 filters and a dimension of 3x3 is preceded and followed
119
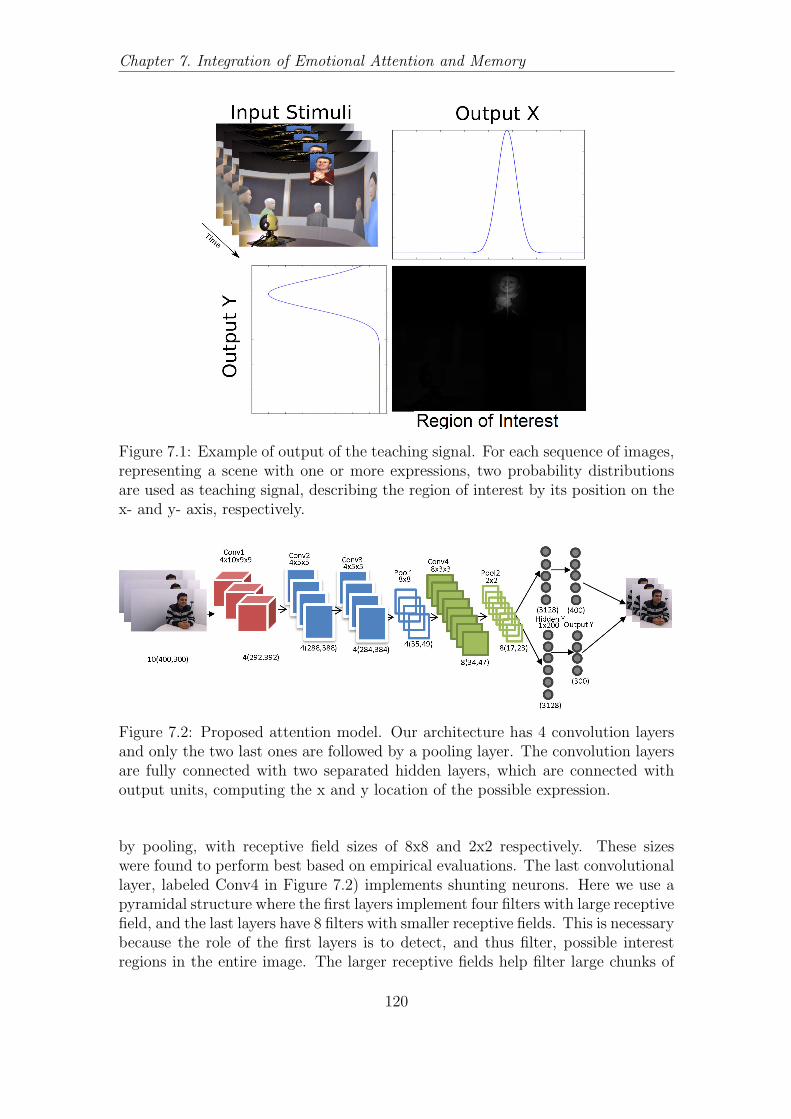
Chapter 7. Integration of Emotional Attention and Memory
Figure 7.1: Example of output of the teaching signal. For each sequence of images,representing a scene with one or more expressions, two probability distributionsare used as teaching signal, describing the region of interest by its position on thex- and y- axis, respectively.
Figure 7.2: Proposed attention model. Our architecture has 4 convolution layersand only the two last ones are followed by a pooling layer. The convolution layersare fully connected with two separated hidden layers, which are connected withoutput units, computing the x and y location of the possible expression.
by pooling, with receptive field sizes of 8x8 and 2x2 respectively. These sizeswere found to perform best based on empirical evaluations. The last convolutionallayer, labeled Conv4 in Figure 7.2) implements shunting neurons. Here we use apyramidal structure where the first layers implement four filters with large receptivefield, and the last layers have 8 filters with smaller receptive fields. This is necessarybecause the role of the first layers is to detect, and thus filter, possible interestregions in the entire image. The larger receptive fields help filter large chunks of
120

7.2. Emotional Attention
the image where noise is easily filtered. The last layer applies a smaller filter, whichlooks for very specific information, such as facial expressions and body movements.
The convolution layers are connected to two separated fully connected hiddenlayers, which are then connected to two softmax output layers. We also normalizethe teaching signal with a softmax function before using it for the network training.By separating the hidden layer, we assure that the same representation will beused for both outputs, but with independent connections. On the other hand,the network is trained with an error calculated from both hidden layers, meaningthat each output influences the training of the convolution layers. Each hiddenlayer has 200 neurons and the output layers have 300 and 400 output units, onefor each row and column of pixels, respectively, in the image input. The modelapplies L2 norm and dropout as regularization methods using momentum duringthe training with an adaptive learning rate. The input images are pre-processedwith ZCA-whitening [49] before used as input to the network, which increases thecontrast of the images and improved the final localization task.
7.2.3 Multicue Attention Stimuli
Our model is trained with a full image, without the necessity of any kind of seg-mentation. This means that the whole scene, including the facial expression andbody movement, are processed by the convolutional filters. After analyzing thefilters learned by the network, we could indicate how the network trained specificfilters for specific visual stimuli: a set of filters were reacting to facial expressionsand another set to body movements.
By visualizing the last layer of the network, using the deconvolution process,we are able to illustrate what the network has learned. Figure 7.3 illustrates thevisualization of different filters of the pre-last layer of the network where one inputstimulus was presented. It is possible to see that the network has learned how todetect different modalities. Filters 1, 2 and 3 learned how to filter features of theface, such as the eyes, mouth and face shape.
Filters 5 to 8, on the other hand, learned how to code movement. Furthermore,we can see that the network highlighted the hands, elbows, and hand movementsin the representation, while other shapes were ignored. Another aspect of CNNscould be observed here: filters 5 to 8 detected partially the same movement shape,but with different activations, represented by the gray tone in the image. CNNs areknown to use redundant filters in their classification process, and the movementswere depicted by more filters than face expressions, mainly because the movementacross the frames is the most salient feature. Filter 4, which did not pick anymeaningful information, did not contribute to the localization of this expression.
7.2.4 Attention Modulation
The two-stage hypothesis of emotional attention [32] states that attention stimuliare first processed as a fast-forward signal by the amygdala complex, and then usedas feedback for the visual cortex. This theory state that there are many feedback
121

Chapter 7. Integration of Emotional Attention and Memory
Figure 7.3: Examples of what each filter in the last layer of the network reacts towhen presenting the stimuli shown on the left. It is possible to see that filters 1to 3 focus on face features, filter 4 did not pick any meaningful information fromthis expression, and filters 5 to 8 focus on movement. In this figure, Filters 1 to 4are inverted for better visualization.
connections between the visual cortex and the amygdala, however, to simplify ourattention mechanism, we will use only one-side modulation: from the attentionmodel to our perception model.
Based on this theory, our attention modulation starts as a fast-forward pro-cessing from the attention model, and then use the found region as input for theperception model. Finally, we use the use of specific features in the attentionmodel as a modulator for the perception model. An image is fed to our attentionCNN, and an interest region is obtained. However as shown in the previous sec-tion, our attention model has specific features which detect face expressions andbody movements. To integrate both models, we create a connection between thesefilters and the second convolutional layer of the CCCNN. That means that ourattention model feeds specific facial and movement features to the second layer ofthe CCNN. The second layer was chosen because, in the face channel, it alreadyextracts features which are similar to the ones coming from the attention model,very related to final facial features. The movement channel still needs one moreconvolution layer to learn specific movement features. Figure 7.4 illustrates ourfinal attention modulation model.
We choose the face-related features and add them to the input of the second
122

7.3. Affective Memory
Figure 7.4: Our attention modulation model, which uses the specific featureslearned from the attention architecture as inputs for the specific channels of deeperlayers of the CCCNN. In this picture the red dotted line represents the specificfacial feature maps and the black dotted line the movement feature maps.
convolution layer of the face channel. This creates an extra set of inputs, whichare correlated and processed by the convolution layer. By adding a new set offeatures to the input of the convolution layer, we are actually biasing the repre-sentation towards what was depicted on the attention model. The same occurs tothe movement channel, and we connect only the movement related feature maps.
The new attention modulation model should be trained in parallel, with oneteaching signal for each set of convolution filters. The final teaching signal is com-posed of the location of the face, to update the weights of the attention-relatedconvolutions, and an emotion concept, to update the weights of the representation-related convolutions. Note that while training the CCCNN layers, we also updatethe specific facial and movement filters of the attention model on the fourth con-volution layer. This is done as a way to integrate our representation, and assurethat the attention modulation actually has a meaning on the learning from bothmodels. We can also see this as a feedback connection, which ensures that themodels can learn with each other.
7.3 Affective Memory
In a neural network, the idea of memory is usually related to the weights, andthe knowledge attached to them [220]. With this concept in mind, the use of self-organizing architectures introduce a different type of memory to neural networks:instead of carrying representation about how to separate the input data, the neu-
123

Chapter 7. Integration of Emotional Attention and Memory
rons in such models carry a knowledge about the data itself. In a self-organizingmodel, each neuron can be seen as a memory unit, which is trained to resemblethe input data [165].
A common use of self-organizing neural networks is in associative memory tasks[162, 164]. In such tasks, the neurons in a self-organizing model will learn how tomemorize the association between two concepts. We use a similar concept inthe self-organizing layer of our CCCNN to associate auditory and visual modali-ties, and then generate a memory of what the network learned, grouping similarlylearned concepts together. However, such model has a restrictive problem: thenumber of neurons affects directly what the network can learn. Also, restrictingthe topology of the neurons in a grid can create relations which are not present inthe input data, in a way that neighboring regions may not be as closely related asthe proximity indicates [135].
Emotion concepts are known to be very related to memory modulation, andthus have a strong participation on how memory is created, stored and processed.In this section, we introduce the use of growing self-organizing networks to simulatedifferent memory stages, but also to learn and forget emotion concepts. To giveour model the capability to use such concepts to improve the learning strategy, weintroduce the use of a modulation system, which affects how the memory modelstores and forget. Finally, we introduce the use of such a system in an emotionalneural circuitry which encodes different stages of emotion perception and learning.
7.3.1 Growing Neural Memory
To address the problems one faces when using a Self-Organizing Map (SOM) wepropose the update of our memory system by using a Growing-When-RequiredNeural Network (GWR) [206] to learn emotion concepts. Such networks havethe ability to grow, by adding more neurons, in any direction. This means thatthe network is not restricted to a number of neurons, either by any topologicalstructure. The GWR grows to adapt to the input data, meaning that the expressiondistribution which is shown to the network is actually better fitted, which producesa better-learned representation than in SOM.
The GWR gives our model three important new characteristics: it removes thelimitation on the number and topological structure of the neurons, increases thecapability of novelty detection, adapting to new expressions the moment they arepresented to the network, and lastly, but most important, has the capability tolearn and forget concepts. That means that we can use our GWR to learn how toassociate different expression modalities, identify and learn never seen expressionsand cluster them into new emotional concepts, and forget concepts which are notimportant anymore.
We first use a GWR model to learn general multimodal emotion expressions.This model represents the general knowledge of our perception architecture andis able to identify several different types of expression. We train this PerceptionGWR with different expressions coming from all our corpora, in a way that itproduces the most general representation as possible. Figure 7.5 illustrates our
124

7.3. Affective Memory
Figure 7.5: We proceed to train a Perception GWR, which will maintain our entirerepresentation of multimodal emotion expression perception. The figure illustratesthe general network trained with emotion expressions from all our corpora, in thefirst training cycle on the left, and after 100 ones on the right.
general network in the first interaction, on the left, and in the last interaction, onthe right. It is possible to see that the network created clusters by itself, as we donot enforce any topological structure.
Training the GWR with different expressions gives us a very powerful associa-tive tool which will adapt to the expressions which are presented to it. By adaptingthe learning and forgetting factors of the GWR we can determine how long thenetwork will keep the learned information, simulating different stages of the hu-man memory process. For example, training a GWR to forget quickly will makeit associate and learn local expressions, in a similar way that the encoding stageworks. By decreasing the forgetting factor of the network, it is possible to make itlearn more expressions, meaning that it can adapt its own neurons topology to aset of expressions that was presented in a mid- to long-time span.
Figure 7.6 illustrates a GWR architecture used to represent an Affective Mem-ory for a video sequence. We first proceed to use the Perception GWR to detectwhich expressions were been performed, and we feed this information to our Affec-tive Memory GWR. In the beginning, represented by the topology on the left, itis possible to see that the network memorized mostly neutral concepts. However,at the end, different concepts were memorized. By changing the forgetting factorof this network, we can let it learn the expressions on the whole video, or just inone part of it.
Using the GWR we can create several kinds of emotional memory of what wasperceived. By having other GWRs, with different learning and forgetting factors,we can simulate several types of emotional memory: short- and long-term memory,but also personal affective memory, related to a scene, person or object, and even
125

Chapter 7. Integration of Emotional Attention and Memory
Figure 7.6: Using the expressions depicted on the Perception GWR, we proceed totrain an Affective Memory GWR for a video. The network on the left illustratesthe Affective Memory on the start of the video (02 seconds) and on the right at theend of the video (06 seconds). The colored dots in the Perception GWR indicatewhich neurons were activated when the expression is presented and the emotionconcept associated with them. The colored neurons on the Affective Memoryindicate which emotion concepts these neurons code.
mood. By feeding each of this memories with the Perception GWR, we can createan end-to-end memory model, which will learn and adapt itself based on what wasperceived. The Perception GWR can learn new expressions if presented, and eachof the specific memories will adapt to it in an unsupervised fashion.
7.3.2 Memory Modulation
Many researchers describe the mood as a representation of the internal correlationof different emotional processes [240], like hunger or fear, others as a complexbehavior which is modulated by perception, attention, and memory [12]. We canalso identify the mood in as part of the definition of the core affect [262] in cognitiveemotions, as discussed in Chapter 2. In this sense, the mood would not affect howyou perceive something, but also how you interpret the perceived expression, andhow you store that as an emotional memory. In other words, the mood could bedescribed as a medium-term memory modulator which affects and is affected bydifferent sensory and behavioral mechanisms [218].
With the addition of such a modulator, humans have a sharper perception levelin natural communication. Depending on a person’s mood, he or she can showinterest in different aspects of the communication, and identifying other people’smood can make you adapt the dialogue or interaction to avoid certain topics. Moodalso reflects the way we perceive things, there is a consensus in the field that the
126

7.3. Affective Memory
valence of our mood directly affects how we perceive certain expressions [26, 189].This makes us more empathic towards each other, as we can adapt our perceptionto our general mood.
Creating a robot that integrates such modulator into its perception would makesuch an autonomous system capable of understanding and interpreting certain ex-pressions better. A common problem is that automatic systems do not adapt theirown representation of what was perceived, and this decreases the natural percep-tion of the dialogue with humans, as was seen in our Human-Robot-Interactionscenario of the WTM Emotional Interaction Corpus.
We introduce, here, the use of a memory modulator, based on what was per-ceived to improve our models’ adaptability. This modulator is implemented asa GWR network which is updated based on what the robot sees at the moment(short-term memory), and on a current mood (medium-term memory). The firstupdates on the current mood are basically copies from what the robot sees. How-ever, after a certain amount of memory stored, the robot applies a modulationbased on the mood’s valence.
The modulation is applied as a function and calculates the amount of expres-sions necessary to update the memory. First, we have to identify the robots mood,based on the mean of the valences of all the neurons in its Mood Memory. Then,we calculate the modulator factor M :
M =
vp > 0.5, e+ e.(
1e−vm
)
vp = 0.5, e
vp < 0.5, e− e.(
1e−vm
)
(7.1)
where vp is the valence of the perceived expression, e is a constant indicating themodulator strength, and vm is the mean valence of the memory. The modulatorfactor indicates the strength of the relation between the perceived expression andthe Mood Memory. It will increase if the valences of the perceived expressions andmemory are similar, and decrease if not.
We then proceed to update the memory using the perceived expression. To dothat, we createM copies of the perceived expression and update the Mood memorywith it. The forgetting factor of the Mood Memory is set to a mid-range term,meaning that as many expressions of the same type are presented, much strongerthey will be remembered if an expression which is not strongly presented duringthe update, meaning a weak memory relation, it will generate fewer neurons andconnections, and will be forgotten quickly.
The way the memory modulator is built increases the connection with ex-pressions with the same valence but allows the memory to be updated with theopposite valence. That is an important mechanism because it allows the memoryto change from a positive to a negative valence, completely based on the perceivedexpressions.
Applying the modulator factor to other memories could also create differentmodulations. For example, introducing the robot to a person which it associates
127

Chapter 7. Integration of Emotional Attention and Memory
Figure 7.7: The Emotion Deep Neural Circuitry which integrates our attention,perception and memory models. The red dotted arrows indicate where modulationand feedback connection happens: mostly between attention and perception, andwithin memory mechanisms.
a strong positive valence memory with, could affect the Mood Memory of therobot. In the same way, if the robot has a very negative valence Mood Memory, itcould affect perceive differently when a person communicates with it using negativeexpressions.
7.3.3 Emotional Deep Neural Circuitry
To integrate our the proposed systems and methods we propose an emotional deepneural circuitry, as illustrated in Figure 7.7. The model integrates our CCCNNwith attention modulation, the perception GWR, and different memory mecha-nisms. With this model, it is possible to identify emotion expressions in a scene,by visual attention means, represent the expression using multimodal information,visual and auditory representation, and cluster the expression into different emo-tional concepts. The memory mechanisms introduce the Mood Memory, AffectiveMemory, connected directly to the individual subject in the scene, and a WorkingMemory, which can store emotion concepts from different interactions.
For each subject, a new Affective Memory model is created and only updatedwhen that particular subject is present in a scene. This creates an individualmeasure for each subject, which gives us a tool to measure how that particularsubject expressed themselves to the robot in a certain time-span. This memorycan be a long- or mid-term memory, depending on the forgetting factor chosen forit. In this thesis, we adapted this memory to be updated during our experiments,in a way that it creates a measure within all the interactions. Such memory could
128

7.3. Affective Memory
be related to the concept of affection and empathy, as it will store how a particularsubject behaved while in an interaction with the robot.
Our Working Memory encodes the interaction of all subjects within which onecertain type of interaction is performed. This means that it can be used to identifythe robot’s perception for an entire afternoon of work, or in a particular dialoguetask. In the same way, could also be expanded to encode long-term memory,encoding expressions from a long time span, like days or weeks.
The Mood Memory is directly modulated by the Perception GWR and encodesthe robot’s own perception based on a certain range of past expressions. OurMood Memory acts as the main modulator for all the other memories but is alsomodulated by Affective Memory and Working Memory. That means that if therobot is in a negative mood and interacts with a person which it relates positiveexpressions to in the past, the chances of the robot to change its mood towards apositive one is higher.
Our Emotional Deep Neural Circuitry is trained in different steps. First, theCCCNN and attention model are trained with pertinent data, to give us a veryrobust expression representation and attention mechanism. Without this strongpre-training, our model becomes weakly reliable, as all its representations are basedon a robust expression representation. These two mechanisms are the ones whichdemand more time for training, as they implement deep neural networks and re-quire a large amount of data to learn meaningful representations.
Our Perception GWR is pre-trained with the same data used to train theCCCNN and attention model. This gives our model very robust initial emotionalconcepts, however, this model can be trained online at any time. That means thatour Perception GWR can learn new expressions and emotional concepts, whichwere not present during the CCCNN training. Lastly, our different memories aretrained in an online fashion, while performing the experiments. This way, eachof our memory mechanisms can learn different information from the interactions,and regulate each other using the memory modulators.
To estimate the valence, used for the memory modulators, we introduce theuse of a Multi-Layer Perceptron (MLP). We use the trained CCCNN filters torepresent different expressions and proceed to feed this general representation toan MLP with two hidden layers. The MLP outputs arousal and valence values.Similarly to the attention training strategy, we use a Gaussian distribution foreach output dimension as a teaching signal. This gives this MLP the capabilityto identify a distribution-based information about the arousal and valence of eachexpression. In a similar way, we use the MLP used during the CCCNN training toclassify categorical expressions into the six universal emotions concepts [81]. BothMLPs help us to identify what our network is depicting in a high-level abstraction,approximating a model of human knowledge via the internal representation of ournetworks.
129

Chapter 7. Integration of Emotional Attention and Memory
7.4 Methodology
To evaluate our model we proceed with three different set of experiments: oneto evaluate the emotion architecture and the use of attention modulation in ourCCCNN model. The second set of experiments evaluates the use of our Affectiveand Working memory to map emotion expression scenarios. Finally, our thirdexperiment evaluates the impact of the memory modulation on the perception ofdifferent emotion expression scenarios.
For all the models, the CCCNN architecture was pre-trained with a combinationof all the corpora presented in this thesis, on Chapter 4, in order to learn robustrepresentations for spontaneous expressions. We train our arousal and valenceMLP with the KT Emotion Interaction Corpus and our categorical emotion MLPwith data from all the other corpus presented in this thesis. This allows us tounderstand the knowledge of our model and to create a comparable and repeatableexperiment.
7.4.1 Experiment 1: Emotional Attention
To evaluate our emotional attention model and modulator we use two trainingstrategies: first, we evaluate the attention only model, and later we evaluate theeffect of the attention modulation in the expression recognition task.
To evaluate the emotional attention by itself, we train our model in an emotion-attention scenario. That means that if no emotion is present, the output of themodel should be no ROI at all, thus the probability distribution for the “no emo-tion” condition is always 0 for the whole output vector. If one expression is present,we want the model to trigger higher attention to displayed expressions, meaningthat happy expressions should have a higher probability distribution with respectto neutral ones. For this purpose, when a neutral expression was present, we pe-nalized the distribution by dividing the probabilities by 2. This still produced anattention factor to the neutral expression, but in a smaller intensity than the onepresent in the happy expression. Finally, when both expressions were present, theprobability distribution was split into 1/3 to the neutral expression and 2/3 to thehappy expression.
We perform our experiments on two different corpora: the Emotion Attentioncorpus and the WTM Emotional Interaction corpus. For both, we perform threedifferent experiments: one with only the facial expressions, one with only thebody motion and one with both. For the face expression experiments, we pre-processed the training data by using only the face of the expressions. For the bodymovement experiments, we remove the face of the expression and we maintainthe whole expression for the experiments with both stimuli. We performed eachexperiment 10 times with a random selection of 70% for each category data fortraining and 30% for testing.
For the WTM Emotional Interaction corpus, we assume three different ex-pressive states: no expression present, mainly no person in the scene, a neutralexpression or an expressive one. An expressive expression could be any expression
130
7.4. Methodology
which was not a neutral one.We used a top-20 accuracy rate measurement. This error rate describes whether
the top-20 activations in one feed-forward step match with the top-20 values of theteaching signal. We counted how many of the top-20 activations match and thenaveraged it. The value of 20 activations translates to 20 pixels of precision, whichwas the mean of the size of expression images. Finally, to help us understandhow the model learns to detect expressions, we applied a de-convolution process tovisualize the features of each expression and analyzed the output of the networkfor different inputs.
To evaluate the emotion-attention modulation impact, we perform a multi-modal expression recognition experiment on the FABO corpus and on the KTEmotional Interaction Corpus, both described in Chapter 4. To evaluate the ex-pression recognition, we follow the same protocol as presented in Chapter 5. Forthe FABO corpus, the expressions are recognized using the 11 emotional labels,while the WTM Emotional Interaction corpus is evaluated using the six universalexpressions. We selected only the video clips which had more than 2 annotatorsagreeing with the same expression. We perform each experiment 30 times, eachtime chose the dataset for training (70%)and testing (30%) and take the mean ofthe accuracy.
7.4.2 Experiment 2: Affective Memory
To evaluate our memory models we perform experiments using our EmotionalDeep Neural Circuitry without the use of memory modulation. This way, we canevaluate the use of the growing networks to code expressions with a direct relationto what was expressed. For this scenario we use the KT Emotion InteractionCorpus in two different tasks: evaluate the memory for individual subjects andfor individual topics. Each task is evaluated with data from both Human-HumanInteraction (HHI) and Human-Robot Interaction (HRI) scenarios.
The evaluation is done by presenting all the videos to the model, and lettingeach memory model learn without restriction. Each neuron on the memories willcode one expression representation, and we proceed to use our MLPs for creatinga valence/arousal and an emotion concept classification. At the end, we have oneAffective Memory for each subject, and one Working Memory for each topic.
We proceed to calculate the intraclass correlation coefficient between the neu-rons in each memory and the annotators opinion on each of the subjects and eachof the topics. We then calculate the mean of this correlation as a measure of howfar the network memory was from what the annotators perceived.
Integrating the memory modulation in our architecture leads to a different per-ception and memory encoding. To show how the modulation affects each memory,we proceed with two analysis experiments: the first one with only mood modula-tion and the second one with mood modulating the Affective Memory.
We perform both analyses using the same schema as in the previous experi-ment: for two subjects and three of the topics in both HHI and HRI scenarios, weproceed to evaluate how each subject performed for each of the topics. This way
131

Chapter 7. Integration of Emotional Attention and Memory
Table 7.1: Reported top-20 accuracy, in percentage, and standard deviation for dif-ferent modalities and numbers of expressions presented to the model when trainedwith the Emotional Attention corpus.
- Top-20 accuracy
No Expression 75.5% (3.2)
Face Body Movement Both
One Expression 87.7% (1.5) 85.0% (2.3) 93.4% (3.3)
Two Expressions 76.4% (2.7) 68.2% (1.4) 84.4% (3.4)
we can evaluate how the development of the dialogue session affected the robot’sperception.
7.5 Results
7.5.1 Experiment 1: Emotional Attention
Our results for the Emotional Attention corpus are shown in Table 7.1. It ispossible to see that when no expressions were present, the model top-20 error was75.5%. When no expression was present, the model should output a distributionfilled with 0s, showing that no expression was presented.
After evaluating the model with one expression, we can see how each modal-ity performs. If only the face was present, the top-20 accuracy was 87.7%. Inthis case, the presence of facial expression was effective in identifying a point ofinterest. In this scenario, the use of happy or neutral face expressions led to thestrong assumptions of interest regions by the network. When evaluating only bodymovement, it is possible to see that there was a slight drop in the top-20 accuracyrate, which became 85.0%. This was likely caused by the presence of the move-ments in the image, without identification or clarification of which movement wasperformed (either happy or neutral). Finally, we can see that the best results werereached by the combination of both cues, reaching a top-20 accuracy of 93.4% andshowing that the integration of facial expression and body movement was moreaccurate than processing the modalities alone.
Presenting two expressions of two persons being displayed at the same time tothe network caused a drop of attention precision while making clearer the relevanceof using both modalities. Using only facial expressions reached a top-20 accuracyof 76.4% while using only body movement had 68.2%. In this scenario, the identifi-cation of the type of expression became important. The distinction between happyand neutral expression represents a key point, and the facial expression becamemore dominant in this case. However, when presenting both modalities at thesame time, the model obtained 84.4% of top-20 accuracy. This shows that bothmodalities were better in distinguishing between happy and neutral expressions
132

7.5. Results
Table 7.2: Reported top-20 accuracy, in percentage, and standard deviation fordifferent modalities for the WTM Emotion Interaction corpus.
- Top-20 accuracy
No Expression 63.2% (1.2)
Face Body Movement Both
One Expression 96.2% (2.3) 91.0% (1.4) 98.45% (1.2)
with respect to using one modality alone.The results in the KT Emotional Interaction Corpus are showed in Table 7.2.
It is possible to see a similar behavior, where the combination of body movementand face obtained a better result, reaching 98.45%. An interesting aspect is thatthe “no expression” experiment achieved a low accuracy of 63.2%, mostly due tothe fact that this corpus has very little data with no expression being performed.
The second round of experiments deals with the use of the attention modula-tion for emotion recognition. Table 7.3 shows the results obtained while trainingthe attention modulation recognition model with the FABO corpus in comparisonof the common CCCNN architecture. It is possible to see that the mean generalrecognition rate increased from 93.65% to 95.13% through the use of the attentionmodulation. Although some of the expressions presented higher recognition, ex-pressions such as “Boredom”, “Fear” and “Happiness” presented slightly smalleraccuracy. A cause for that to happen is that these expressions probably presentedhand-over-face or very slight movements, which were depicted by the CCCNN butruled out by the attention mechanism.
Evaluating the CCCNN with and without the attention modulation producedthe results showed on Table 7.4. It is possible to see that the attention mechanismincreased the accuracy of expressions as “Fear”, “Happiness”, and “Sadness” morethan the others. Mostly this happens because this expression presents a highdegree of variety in the dataset, which is easily perceived by the attention model,and sent to the CCCNN as an important representation.
7.5.2 Experiment 2: Affective Memory
Training our Emotional (deep) Neural Circuitry without memory modulation gaveus a direct correlation between what was expressed and the stored memory. Thismeans that the memory learned how to create neurons that will code for thepresented emotional concepts. We fed all the videos of the HHI and HRI scenario tothe model and proceed to calculate the interclass correlation coefficient per subjectand per topic between the network representation and each of the annotator’slabels.
The interclass correlation coefficients per topic for the HHI scenario are pre-sented in Table 7.5. It is possible to see high correlations for both dimensions,valence, and arousal, for at least two scenarios: Lottery and Food. These two
133

Chapter 7. Integration of Emotional Attention and Memory
Table 7.3: Reported accuracy, in percentage, for the visual stream channels of theCCCNN trained with the FABO corpus with and without attention modulation.
Class Without Attention With Attention
Anger 95.9 95.7
Anxiety 91.2 95.4
Uncertainty 86.4 92.1
Boredom 92.3 90.3
Disgust 93.2 93.3
Fear 94.7 94.5
Happiness 98.8 98.0
Negative Surprise 99.6 99.7
Positive Surprise 89.6 94.8
Puzzlement 88.7 93.2
Sadness 99.8 99.5
Mean 93.65 95.13
Table 7.4: Reported accuracy, in percentage, for the visual stream channels ofthe CCCNN trained with the KT Emotion Interaction Corpus corpus with andwithout attention modulation.
Class Without Attention With Attention
Anger 85.4 89.7
Disgust 91.3 91.2
Fear 79.0 81.2
Happiness 92.3 94.5
Neutral 80.5 84.3
Surprise 86.7 87.9
Sadness 87.1 90.2
Mean 86.0 88.4
scenarios were the ones with a stronger correlation also within the annotators, andpossibly the ones where the expressions were most easily distinguishable for all thesubjects. The emotion concept correlation also shows a strong agreement value forthese two scenarios, while showing a slight disagreement on the School scenario.
The correlation coefficients for the HRI scenario are presented in Table 7.6. Itis possible to see that, similarly to the HHI scenario, the topics with the highestcorrelation were Lottery and Food, while the lowest ones were Pet and Family.Here the correlation values are slightly smaller than in the HHI scenario, indicating
134

7.5. Results
Table 7.5: Interclass correlation coefficient of our Emotional (deep) Neural Cir-cuitry per topic in the HHI scenario.
Characteristic Lottery Food School Family Pet
Valence 0.65 0.64 0.41 0.67 0.57
Arousal 0.67 0.72 0.42 0.56 0.49
Emotional Concept 0.84 0.71 0.47 0.52 0.53
Table 7.6: Interclass correlation coefficient per topic in the HRI scenario.
Characteristic Lottery Food School Family Pet
Valence 0.78 0.67 0.31 0.58 0.47
Arousal 0.72 0.61 0.57 0.49 0.42
Emotion Concept 0.79 0.75 0.62 0.51 0.57
Table 7.7: Interclass correlation coefficient of our Emotional (deep) Neural Cir-cuitry per subject in the HHI scenario.
Session 2 3 4 5
Subject S0 S1 S0 S1 S0 S1 S0 S1
Valence 0.63 0.54 0.67 0.59 0.69 0.67 0.54 0.59
Arousal 0.55 0.57 0.67 0.59 0.67 0.60 0.57 0.53
Emotional Concepts 0.79 0.67 0.74 0.79 0.61 0.74 0.67 0.59
Session 6 7 8
Subject S0 S1 S0 S1 S0 S1
Valence 0.57 0.61 0.64 0.61 0.49 0.68
Arousal 0.54 0.61 0.50 0.87 0.71 0.84
Emotional Concepts 0.68 0.87 0.68 0.63 0.64 0.76
that for these expressions were more difficult to annotate, which is reflected in ourmodel’s behavior.
The correlation coefficients calculated on the Affective Memory for the HHIscenario are showed in Table 7.7. Here, it is possible to see that for most ofthe subjects, the network presented a slightly good correlation, while only a fewpresented a very good one. Also, it is possible to see that the correlations obtainedby the emotion concept were again the highest.
For the subjects in the HRI scenario, the correlation coefficients are presented inTable 7.8. It is possible to see that, different from the HHI scenario, the correlationbetween the model’s results on recognizing emotion concepts and the annotators
135

Chapter 7. Integration of Emotional Attention and Memory
Table 7.8: Interclass correlation coefficient of our Emotional (deep) Neural Cir-cuitry per subject in the HRI scenario.
Subject S1 S2 S3 S4 S5 S6 S7 S8 S9
Valence 0.58 0.42 0.67 0.59 0.42 0.80 0.45 0.61 0.78
Arousal 0.52 0.62 0.57 0.60 0.67 0.62 0.59 0.48 0.58
Emotional Concept 0.74 0.57 0.62 0.61 0.57 0.59 0.57 0.69 0.72
are rather small, showing that for this scenario the network could not represent theexpressions as well as in the HHI scenario. The other dimensions show a similarbehavior, showing that our Affective Memory can learn and represent subjectbehaviors in a similar manner as the annotators perceived them.
7.6 Discussion
In this chapter we presented two different emotional modulators: attention andmemory. These modulators were combined with our perception and representa-tion models, and we introduce our Emotional Deep Neural Circuitry. This modelwas used in different tasks, from emotion expression recognition to human behav-ioral description, and interaction analysis. Although we showed how the modelbehaved in this tasks, a deeper analysis on the model’s representation helps us tounderstand better the behavior of our architecture.Thus, the sections below dis-cuss two properties of our model: different emotional attention mechanisms, andthe effect of memory modulation.
7.6.1 Emotional Attention Mechanisms
In our emotional attention model, we are using probability distributions based onimage regions for the target output values. During the training, do not rely ona discrete teaching signal such as target labels that shape the filters into findingdetermined structures, as in traditional CNN-based approaches.
Instead, the model implicitly learns that a determined structure is in the regionof interest, in agreement with the teaching signal. Because of that and the challengeof the localization task, our model takes a longer time to train, requiring morethan a common classifier. On the other hand, the structures that the model learnsto filter are not strongly labeled, and by visualizing this knowledge using thedeconvolution process presented in Chapter 4, we are able to identify how thenetwork learned to localize expressions and to identify different expressions.
Another interesting aspect of our architecture is how it behaves when differentcombinations of stimuli are presented. Our teaching signal determines the loca-tions where expressions are displayed, but it also provides information on whichexpression to focus on. We showed this in a scenario with only one expression being
136

7.6. Discussion
Figure 7.8: Example of the output of the model, when one “Happy” expressionwas presented. The input image values were multiplied by the network outputvalues along the corresponding axes resulting in the illustrated region of interest.
displayed (Figure 7.8). We can see how the model detected the expression on thex- and y- axes, and how the shape of the output distribution changes dependingon the size of the area displaying an expression.
In a second example, we used two expressions as input: one “Happy” andone “Neutral” expression. The output of the network changed in this scenario,and instead of a clear bump, it produced a wider distribution with a smaller bumpshowing where the neutral expression was located. Figure 7.9 illustrates this effect:the network correctly focuses on the happy expression.
Lastly, we evaluated the performance of the model in a scenario where two“Happy” expressions were presented, with one being more expressive than theother. In this case, the network chose to focus on the most expressive one. Figure7.10 illustrates this process. It is possible to see on the x axis that the network hastwo clear bumps, but a bigger one for the most expressive expression. On the yaxis, the network produced a larger bump, large enough to cover both expressions.
7.6.2 Memory Modulation
In our experiments with the Emotional Deep Neural Circuitry, we evaluated howthe network behaves without the memory modulation. To evaluate how the mod-ulation changes the learned representations, we proceed to show one full dialogueinteraction to the model, containing one subject and one topic. We proceed withthe evaluation on two subjects, 5 6 and 5 4, of the HHI scenario, with videos for
137

Chapter 7. Integration of Emotional Attention and Memory
Figure 7.9: Example of the output of the model, when two expressions, “Happy”and neutral, were presented. It is possible to see that the model tends to detectboth expressions, but has a stronger activation on the “Happy” one.
Figure 7.10: Example of the output of the model, when two “Happy” expressionswere presented. The emotion which produced the higher activation peak getsprimarily highlighted in the region of interest.
138

7.6. Discussion
Figure 7.11: Illustration of the effects of memory modulation from the Mood Mem-ory in the Affective Memory for two subjects in the Food and Pet scenarios.
the topics School and Pet. Figure 7.11 illustrates the arousal, valence and emo-tional concepts of the neurons for the Affective Memory, Mood Memory and anAffective Memory with mood modulation for this experiment.
It is possible to see that the Mood Memory contains much less information,however, code for the general behavior of the scene. On subject 5 6 it is possibleto see that the Mood Memory codes information with very similar arousal, valenceand emotional concepts. When used as a modulator, what happens is that theamount of information decreases drastically, however, the structure and amplitudeof the three dimensions do not change much.
We proceed then to investigate only one subject, 2 7, but in two different topicsin the HRI scenario: Food and Pet. It is possible to see again how the MoodMemory reduced the perceived information, while keeping the same topologicalstructure. In the Pet topic, the Mood Memory had very little coded information,and thus had a stronger effect on the modulated Affective Memory. This happensdue to the fact that this interaction was much shorter than the others, presentingto the network fewer expressions. When a larger amount of expressions are present,as in the Food topic, the network tends to behave better, as the Mood Memoryhas more information to update.
139

Chapter 7. Integration of Emotional Attention and Memory
Figure 7.12: Illustration of the effects of memory modulation from the Mood Mem-ory in the Affective Memory for two subjects in the School and Pet scenarios.
7.7 Summary
Our last model deals with the integration of different modulation mechanismsto improve the emotion concept learning and representation. The first of thesemechanisms was an emotional attention model. This model introduces the use ofConvolutional Neural Networks (CNNs) for localization tasks, using the convolu-tional filters to identify where, in an input image, an expression is being performed.By visualizing the model’s internal representation, we showed that this networklearned, implicitly, how to represent face expressions and body movements in dif-ferent filters. We use these filters as modulators for our Cross-Channel Convolu-tional Neural Network (CCCNN) architecture, which improved the capability ofthe model to recognize visual expressions.
The second modulation mechanism proposed in this chapter was a memorymodel. Using Growing When Required Networks (GWR), it was possible to in-troduce a novel emotional memory to the network, which could be adjusted tolearning and forgetting in different time steps. This allowed us to create individualmemories which are related to particular persons, situations and periods of time,simulating different affective memory mechanisms.
Using the attention and memory modulations, we introduced the Emotional
140

7.7. Summary
Deep Neural Circuitry which integrates our multimodal expression representationmodel and the attention and memory modulation. Such model was used in differentemotional behavior analysis task using the KT Emotional Interaction corpus, andthe results showed that our model could represent complex emotional behaviorfrom different users and situations. With this model, we were able to describe theinteractions present in the corpus, and identify differences between subjects anddifferent human-human and human-robot interactions.
141

Chapter 7. Integration of Emotional Attention and Memory
142

Chapter 8
Discussions and Conclusions
Emotions are present in several different parts of our lives. They are present whenwe communicate with each other, when we learn and experience new things, andwhen we remember past events, for example. Our understanding of emotions isstill in the beginning, and it is an interdisciplinary topic ranging from philosophyto neuroscience and robotics. In particular, the development of such concepts andideas in autonomous intelligent systems is still an open field, with several differentproblems to be solved. This thesis aims to address some of these problems, by usingdifferent computational models inspired by behavioral and neural mechanisms.
This chapter shows a discussion on how each of the models presented in thisthesis addresses each of the proposed research questions, limitations and futureworks, and the final conclusions.
8.1 Emotion Representation
The first question addressed by this thesis is: “Can a deep neural network representmultimodal spontaneous human expressions?”. People express themselves differ-ently, depending on many different factors. The same person can display happinessdifferently in the morning, when he sees a bird singing, or in the afternoon, whenmeeting with a close friend. Although the six universal emotions [81] are said tobe understandable independent of cultural background, the expression itself canbe very person dependent. Adding this to the fact that the perception of suchexpressions is a multimodal problem, involving, among others, auditory and visualsystems, to represent these expressions in an artificial system is a challenging task.
Several different expression descriptor computational models were proposedand evaluated, as discussed in Chapter 3, however, most of them have severelimitations: not being able to deal with multimodal information [307], spontaneousexpressions [186] or different subjects [1]. Such limitations occur mostly becausethe models heavily rely on very extensive feature pre-processing techniques [283]which post substantial restrictions: using the same lighting conditions, having alow number of subjects, noise-free data, among others.
To address our question, and minimize the limitations showed in the presented
143

Chapter 8. Discussions and Conclusions
research, our model, introduced in Chapter 5, implements a Cross-Channel Con-volutional Neural Network (CCCNN), which can learn implicit features from mul-timodal data using different modality-specific channels. Our model is based onConvolutional Neural Network (CNN) [179], which were evaluated in different emo-tion expression recognition tasks [149, 204]. Such models showed an improvementin the capacity of dealing with spontaneous expressions because such networkslearn how to represent the input stimuli, without relying on human knowledge [1].However, these models usually need a large amount of data to learn general repre-sentations [302]. Another known problem is that such models rely on many neuralconnections to learn how to represent the input stimuli, and by using multimodalinformation the number of neurons necessary to obtain a general representationtends to increase, making it harder to train the network [274].
In the CCCNN, we designed specifics channel to process independent modalitystreams, in a structure that resembles the ventral and dorsal stream in the visualand auditory cortices of the brain [111]. This architecture helps to induce specificfilters for each modality, reducing the number of neurons in the architecture. Eachmodality-specific channels use a Cross-channel layer to integrate the multimodalrepresentation. This architecture uses the high-level feature abstraction obtainedby each of the specific channels to create a multimodal representation withoutthe necessity of using many convolutional layers. We also introduced the use ofshunting inhibitory neurons in our model, in a way to force a high specializationon our face expression channel, which improved the expression representation.
In our evaluations, we showed that the CCCNN performed well in differentemotion expression recognition tasks: individual visual and auditory modalitiesprocessing, multimodal streams representation, acted and spontaneous expressionrecognition. In each of these tasks, the CCCNN presented competitive, and insome cases even better results when compared to state-of-the-art techniques. Ournetwork was shown to have a high degree of generalization, being able to usetransfer learning principles to create robust expression representations.
By providing analyses on the CCCNN internal learned representation, we gainimportant insight into the networks’ behavior. We could show that the networkspecialized specific regions of neurons which react to particular features in theinput. We could demonstrate that the network had a hierarchical behavior onfeature representation, showing very low-level features, such as lines and motiondirection in the first layers and complex facial structures and movement patternsin deeper ones. The visualizations help us to understand why our network cangeneralize so well, and how it learns multimodal expressions.
Our CCCNN demonstrated that a deep neural network was able to learn howto represent multimodal expressions. The model introduced the use of modality-specific channels, shunting inhibitory neurons and Cross-channels, which made thelearned features more robust than ordinary CNNs. These mechanisms made ourmodel able to recognize multimodal spontaneous expressions with a high degree ofgeneralization and introduced the use of implicit feature representation, extendingthe concept of automatic emotion recognition systems.
144

8.2. Emotional Concept Learning
8.2 Emotional Concept Learning
Once we introduced our robust multimodal spontaneous expression descriptormodel, we proceed to address our second question: “How to learn different emo-tional concepts from multimodal spontaneous expression representations?”. Emo-tions can be represented by different concepts, as presented in Chapter 2: usingcategorical labels [240] or dimensional values [13], as arousal and valence. Al-though these concepts are used in various tasks, both can be used to representemotion expressions, with their contextual information. This means that whilethe categorical labels give a universal meaning for the expression (Happy, Sad, orSurprised one), the dimensional representation tries to remove the cultural andpersonal context when representing it. This would make a smile be represented bydifferent persons the same way using a dimensional approach, but interpreted asdifferent emotional concepts based on the person’s experience and background.
To approach this problem, we introduce the use of a self-organizing layer at-tached to our Cross-Channel Convolutional Neural Network (CCCNN), as detailedin Chapter 6. In Chapter 5, we showed that the CCCNN learned how to repre-sent multimodal expressions in a hierarchical way, and we use this property as abasis for our emotional concepts learning model. Then, we extend the model byadopting a self-organizing layer, which creates neural clusters to represent differentemotion concepts.
The CCCNN uses a feedforward connections to create a separation space andclassifies different expressions into categorical emotions. Replacing these connec-tions with a self-organizing layer [163], we give the model the capability to learnhow to represent similar expressions into clusters. The self-organizing layer istrained unsupervised, which means that the network itself identifies how similarthe expressions are, and represent them with neighboring neurons. These neuralclusters are used as a topological representation of the network’s knowledge, andthey can be understood in different contextual tasks. This means that neighboringneurons can be used to represent an emotional category, such as Happy or Sad, orto identify similar expressions, such as a calm smile or an open mouth scared face.
We evaluate our model in three different tasks: emotion categorical classifica-tion, emotional concept learning, and behavioral analysis. The classification taskshowed that the neural clusters are more reliable in determining emotion conceptsthan categorical emotions-based systems, and showed better recognition and gen-eralization capabilities. This happens because the clusters introduce neighboringneurons that represent similar input, which means that each neuron is trained toadapt its knowledge to similar expressions. As the network is trained unsuper-vised, the network learning process is not biased by any emotional concept andeach cluster represents different expressions and not necessarily emotion categories.This gives the model the capability to learn expressions and not emotion concepts.However, the model can be used in tasks where emotion concepts are important,such as emotion recognition tasks, by selecting clusters which better represent thenecessary concepts.
Our emotional concept learning experiments showed that the neural clusters
145

Chapter 8. Discussions and Conclusions
could be used to learn and represent humans interactions in different scenarios.Each neuron in the self-organizing layer acts as a prototype expression, meaningthat each neuron indicates how the network represents what it was presented. Weevaluate the capability of the network to learn new expressions by visualizing howdifferent clusters were formed and which neurons were triggered. The networkwas able to represent different emotional concepts, and the topological structureshowed to be consistent with both emotional categories representation [240] anddimensional ones [13].
We demonstrated how the network could be used on an interaction analysistask. By identifying different clusters and prototype neurons, we showed howdifferent subjects behaved when expressing the same emotions. This visualizationhelped us to describe patterns of the human’s behavior, identifying how differentthe subjects expressed differently while trying to express happiness or sadness, forexample.
Our second model shows that we can learn and represent different emotionalconcepts, expand the idea of emotion recognition. The use of self-organizing un-supervised networks allows our model to learn from the CCCNN representationswithout the necessity of any label, and how to create similar emotional concepts.The evaluation of the network showed that it could learn new expressions, adaptingits internal knowledge to never seen data, and it can be used in different emotionalanalysis tasks
8.3 Attention and Memory Modulation Integra-
tion
The last question addressed by this thesis is: “How to adapt attention and mem-ory mechanisms as modulators for emotion perception and learning?”. Attentionis one of the most important modulators in human perception, and it is present inseveral other processing mechanisms, and emotional attention was shown to influ-ence what and how we perceive the environment around us, as detailed in Chapter3. Emotional memory also has an important role in modulating different processes,from perception to recognition and learning. The presence of these mechanismsenhance the way humans deal with emotional experiences, and introducing themto affective computing models could increase their robustness in representation,recognition, and generalization.
We introduce the use of an emotional attention model and different emotionalmemory architectures, all presented in Chapter 7. Besides their main tasks, asattention and memory models, we introduce them in a modulation architecture,which enhanced the capability of our Cross-Channel Convolution Neural Network(CCCNN) and self-organizing layer to learn, represent and recognize emotionalexpressions.
First, we introduced our emotional attention model, which is implementedbased on Convolution Neural Networks (CNN). Usually, CNNs have expertise on
146

8.3. Attention and Memory Modulation Integration
classification tasks, but not yet explored for localization and attention scenarios.We introduce the use of a CNN for a visual region of interest determination. How-ever, we adapt it for emotional attention tasks. Our model learned, without anyenforcement, how to differ face expressions from body movements, and how to usethis information to determine happy and sad expressions from neutral ones.
Our attention model was able to learn how to identify different expressions,without the use of emotion categories. Also, the model could identify when morethan one expression was presented, representing them with different activationintensities. That means that the model learned, implicitly, how to determineneutral expressions from happy or sad ones, and even detect when both happenstogether.
By visualizing our attention model, it was possible to see that it learned how torepresent face expressions and body movements in different parts of the network.The hierarchical structure of the CNN allowed the model to specify different filtersin describing high-level facial and movement features. We proceed to integratethis model to our CCCNN, using such filters as a modulator for our facial andmovement specific channels. First, we use the region detected by the attentionmodel as input for the CCCNN, and then we use feedback connections betweenthe attention model’s specific filters and the CCCNN channels. By doing this, wewere able to improve the recognition capabilities of the CCCNN, and to present anintegrated model which can detect and recognize emotion expressions in an entirevisual scene.
Our memory model is based on unsupervised Growing-When-Required (GWR)networks [206]. Such networks are used to represent perceived expressions, andtheir ability to learn and forget learned concepts is the basis of our architecture.We proceed to create several GWRs, one representing a different type of mem-ory with different forgetting factors. This gives our model a robustness to learndifferent expressions from several persons and scenarios or to create its internalrepresentation based on specific events. This allows us to have specific emotionalmemories for a particular person, a place, or a period of time.
Integrating all these models, we propose an Emotion Deep Neural Circuitry.Such circuitry connects our CCCNN, with the attention modulator, with differenttypes of memories. We introduce a memory modulator to be used to improvethe model’s representation by adapting it to different persons, scenarios or eventhe system’s mood. This system was able to identify complex behavior in varioushuman-human and human-robot interactions, and enhanced the perception capa-bilities of the model. Also, the use of the modulators improved the generalizationand recognition capabilities of the CCCNN.
Our Emotional Deep Neural Circuitry was evaluated in several different tasks:from recognition to localization and memory storage. Analyses on how the net-work learned several emotional concepts from various persons and the role of themodulators showed that our model could be used in very complex emotional anal-yses tasks. The model integrates different aspects of emotions in an unsupervisedarchitecture which can adapt itself in an online fashion, moving a step closer toreal-world scenarios.
147

Chapter 8. Discussions and Conclusions
8.4 Limitations and Future Work
The models and ideas presented in this thesis were evaluated in several differ-ent tasks, however, to provide their use in a real-world scenario, the proposedtechniques need to be refined in several directions. Currently, the model cannotbe deployed in most of the robotic platforms as it needs high-end computationalhardware to be trained. The amount of data necessary for a real-world generaliza-tion is enormous, and the data used during the evaluation of the model restrictsits use in such cases.
The use of recurrent models for feature extraction and learning is encouragedand the study of how such models affect the learned representation would providevaluable information about the model. A deeper analysis of the auditory represen-tations will be necessary, to understand how the model learns emotional auditoryfeatures. Adapting the model to learn from raw audio signals would be the ideal.
The self-organizing layers provide an associative relation between the visualand auditory modalities of the CCCNN. However, our current model does not dealwith information conflict. Adding such mechanism would increase the robustnessand the capability of the model to learn multimodal expressions.
Our attention system does not take into consideration auditory information,which could increase the model’s accuracy. Similarly to the self-organizing layers,such a model could make use of conflict solving mechanisms to deal with thepresence of conflicting attention information found in real world scenarios.
The analysis of our model could be expanded to several different levels. Fromthe representation of memory, we encourage to study how the mechanisms proposedhere behave when facing complex outdoor scenarios. The development of suchmodel is not bounded by any constraint, and the update of different conceptsproposed here, if beneficial to the model, is also encouraged.
8.5 Conclusions
In conclusion, this thesis contributes to the affective computing field demonstratinghow different emotional concepts can be integrated. Dealing with spontaneousmultimodal expression is hard, but the use of deep neural models which learn howto create better expression representations showed to be a good solution. The use ofself-organizing networks to learn different emotional concepts provided the modelwith interesting properties, which are not common in the works on the field, such aslearning of new expressions. The use of emotional attention and memory gave theproposed models a robustness on dealing with very complex behavioral scenarios,and enhanced their recognition and generalization capabilities, contributing to theaffective computing field.
148

Appendix A
KT Emotional Interaction Corpus
This appendix shows the plots for the complete analysis on each of the topics of theKT Emotional Interaction Corpus. The first two plots, displayed in Figures A.1and A.2 display how the annotators evaluated the behavior of the subjects whileperforming the dialogues of each of the topics. The analysis of how the annotatorsevaluated each subject behavior are displayed on the plots of Figures displayed inFigures A.3 and A.4 for HHI scenarios and Figures A.5 and A.6 for HRI scenarios.
149

Appendix - Publications Originating from this Thesis
Figure A.1: Plots that shows the distribution of annotations for the HHI scenario,separated by topics. The x axis represents valence, and the y axis representsarousal. The dot size represents dominance, where a small dot is a weak dominanceand a large dot a strong dominance.
150

Appendix - Publications Originating from this Thesis
Figure A.2: Plots that shows the distribution of annotations for the HRI scenario,separated by topics. The x axis represents valence, and the y axis representsarousal. The dot size represents dominance, where a small dot is a weak dominanceand a large dot a strong dominance.
151

Appendix - Publications Originating from this Thesis
Figure A.3: Plots that shows the distribution of annotations for the HHI scenario,separated by Subjects. In this figure, the first 8 subjects are shown. The x axisrepresents valence, and the y axis represents arousal. The dot size representsdominance, where a small dot is a weak dominance and a large dot a strongdominance.
Figure A.4: Plots that shows the distribution of annotations for the HHI scenario,separated by Subjects. In this figure, the last 7 subjects are shown. The x axisrepresents valence, and the y axis represents arousal. The dot size representsdominance, where a small dot is a weak dominance and a large dot a strongdominance.
152

Appendix - Publications Originating from this Thesis
Figure A.5: Plots that shows the distribution of annotations for the HRI scenario,separated by Subjects. In this figure, the first 6 subjects are shown. The x axisrepresents valence, and the y axis represents arousal. The dot size representsdominance, where a small dot is a weak dominance and a large dot a strongdominance.
Figure A.6: Plots that shows the distribution of annotations for the HRI scenario,separated by Subjects. In this figure, the last 3 subjects are shown. The x axisrepresents valence, and the y axis represents arousal. The dot size representsdominance, where a small dot is a weak dominance and a large dot a strongdominance.
153

Appendix B
Publications Originating from
this Thesis
Some of the concepts, models and experiments described in this thesis were pub-lished in different journals and conference proceedings.
• Barros, P., Wermter, S. Developing Crossmodal Expression Recognition basedon a Deep Neural Model. Adaptive Behavior, Volume 24, Pages 373-396,2016.
• Barros,P. ,Weber, C., Wermter, S. Learning Auditory Representations forEmotion Recognition. Proceedings of International Joint Conference on Neu-ral Networks (IJCNN), pp. 921-928, Vancouver, Canada, 2016.
• Barros, P., Strahl, E., Wermter, S. The iCub Chronicles - Attention to Emo-tions! , Proceedings of the 10th AAAI Video Competition at the Conferenceon Artificial Intelligence (AAAI-16), Phoenix, USA, 2016.
• Barros, P., Jirak, D., Weber, C., Wermter, S. Multimodal emotional staterecognition using sequence-dependent deep hierarchical features. Neural Net-works, Volume 72, Pages 140-151, December, 2015.
• Barros, P., Weber, C., Wermter, S. Emotional Expression Recognition with aCross-Channel Convolutional Neural Network for Human-Robot Interaction.Proceedings of the IEEE-RAS International Conference on Humanoid Robots(Humanoids), pp. 582-587, Seoul, South Korea, 2015.
• Barros, P., Wermter, S. Recognizing Complex Mental States with Deep Hier-archical Features for Human-Robot Interaction. Proceedings of the IEEE/RSJInternational Conference on Intelligent Robots and Systems, pp. 4065-4070,Hamburg, Germany, 2015.
• Barros, P., Parisi, G. I., Jirak D. and Wermter, S. Real-time Gesture Recog-nition Using a Humanoid Robot with a Deep Neural Architecture. Pro-ceedings of the IEEE-RAS International Conference on Humanoid Robots(Humanoids), pp. 83-88, Spain, 2014.
154

Appendix - Publications Originating from this Thesis
• Barros, P., Magg, S., Weber, C., Wermter, S. A Multichannel ConvolutionalNeural Network for Hand Posture Recognition. In Wermter, S., et al., edi-tors. Proceedings of the 24th International Conference on Artificial NeuralNetworks (ICANN 2014), pp. 403-410, Hamburg, Germany, 2014.
The models and concepts presented in this thesis were also applied to differentdomains, and published in different journals and conference proceedings.
• Hinz, T., Barros, P., Wermter, S. The Effects of Regularization on LearningFacial Expressions with Convolutional Neural Networks. In Proceedings ofthe 25th International Conference on Artificial Neural Networks (ICANN2016), In Press, Barcelona, Spain, September 2016.
• Mousavi, N., Siqueira, H., Barros, P.,Fernandes, B., Wermter, S. Under-standing How Deep Neural Networks Learn Face Expressions. Proceedingsof International Joint Conference on Neural Networks (IJCNN), In press,Vancouver, Canada, 2016.
• Speck, D., Barros, P., Weber, C. and Wermter, S. Ball Localization forRobocup Soccer using Convolutional Neural Networks. RoboCup Sympo-sium, Leipzig, Germany, 2016. - Best Paper Award
• Tsironi, E., Barros, P., and Wermter, S. Gesture Recognition with a Convo-lutional Long Short-Term Memory Recurrent Neural Network. Proceedingsof the European Symposium on Artificial Neural Networks, ComputationalIntelligence and Machine Learning (ESANN), pp. 213-218, Bruges, Belgium,2016.
• Hinaut, X., Twiefel, J., Borghetti Soares, M., Barros, P., Mici, L., Wermter,S. Humanoidly Speaking How the Nao humanoid robot can learn the name ofobjects and interact with them through common speech. International JointConference on Artificial Intelligence (IJCAI), Video Competition, BuenosAires, Argentina, 2015.
• Hamester, D., Barros, P., Wermter, S. Face Expression Recognition with a 2-Channel Convolutional Neural Network. Proceedings of International JointConference on Neural Networks (IJCNN), pp. 1787-1794, Killarney, Ireland,2015.
• Jirak, D., Barros, P., Wermter, S. Dynamic Gesture Recognition Using EchoState Networks. Proceedings of 23th European Symposium on Artifical Neu-ral Networks, Computational Intelligence and Machine Learning, ESANN’15,pp. 475-480, Bruges, Belgium, 2015.
• Borghetti Soares, M., Barros, P., Parisi, G. I., Wermter, S. Learning objectsfrom RGB-D sensors using point cloud-based neural networks. Proceedingsof 23th European Symposium on Artifical Neural Networks, ComputationalIntelligence and Machine Learning, ESANN’15, pp. 439-444, Bruges, Bel-gium, 2015.
155

Appendix - Acknowledgements
• Borghetti Soares, M., Barros, P., Wermter, S. Learning Objects From RGB-DSensors for Cleaning Tasks Using a Team of Cooperative Humanoid Robots.Proceedings of 15th Towards Autonomous Robots, TAROS 2014, LNAI 8717,pp. 273-274, Springer Heidelberg. Birmingham, UK, October 1-3, 2014.
• Parisi, G. I., Barros, P.,Wermter, S. FINGeR: Framework for InteractiveNeural-based Gesture Recognition. Proceedings of the European Sympo-sium on Artificial Neural Networks, Computational Intelligence and MachineLearning (ESANN ’14), pp. 443-447, Bruges, Belgium, 2014.
156

Appendix C
Acknowledgements
The Ph.D. studies are very long and solitaire times. However, during the threeyears since I started this journey, I had so many persons in my life that helpedme, supported me, guided me and, the most important, believed in me and on mywork. I would like here to express some words of gratitude towards these persons.
I would like to, firstly, thank my supervisor, Prof. Stefan Wermter, for so manyvaluable advice, guidance, and support during my Ph.D. journey. I would like alsoto thank Dr. Cornelius Weber, Dr. Sascha Griffiths and Dr. Sven Magg for thehelpful discussions and feedback. Would like to highlight here the importance ofthe opportunity you gave me to start my Ph.D. here, and how this changed mylife.
Although the Ph.D. is a very lonely journey, I could rely on the KnowledgeTechnology staff to support me. I would like to thank, especially, Katja Kostersand Erik Strahl, for all the help and kindness they showed to me since I arrived inthe group. Also would like to thank the support of the many colleagues from thegroup, the various discussions and talks we had, beers we drank and friendshipswe forged.
A big thank you to Prof. Bruno Fernandes and Prof. Byron Leite, and theentire RPPDI research group from the University of Pernambuco. I thank theirsupport and guidance, and I am looking forward to proceeding with our collabora-tions. Yes, Vancouver was fantastic. Also would like to thank Prof. Jorge Correia,who help me since I started my graduation and gave me valuable feedback on thisthesis and in my work.
Outside the academic environment, many different persons were part of thedevelopment of my studies. First, I would like to remember my fantastic NEXgroup, which proved that distance is just a number, and we are united whereverwe are. Also important to mention my dear UAST/Chronos friends! This workstarted there, ten years ago, in Mineko’s restaurant. I am so proud of what all ofus reached in our lives, and I am looking forward to seeing where we go from here.Important to mention my around-the-world family, which are the best friends aperson can have: Marcio “Winne” Alfredo, Ilzy Sousa, “Marcelo Mars Mauricio”,Francisco “Galego” Junior, Sara “Saritz” and Joao Victor Cavalcanti.
In my life my family was always present, even if we do not see each other so
157

Bibliography
often. I have persons who inspired me, but none most than my parents. I hope Icontinue to learn with them as they still have so much to teach me. And familyis not only the ones you share blood with, but the ones you find in your life, andhere in Germany I found a very important part of my life. I would like to thankDoreen Jirak for all the support, help and inspiration that she so kindly offeredme. I would like to say that you are an integral part of this work, and withoutyou, for sure it would not have happened. I am looking forward to seeing how wewill change this world together.
Finally, I would like to say that this work was partially supported by CAPES,the Brazilian Federal Agency for the Support and Evaluation of Graduate Educa-tion under the project number 5951-13-5, the German Research Foundation DFGunder project CML (TRR 169), and the Hamburg Landesforschungsforderungspro-jekt.
Muito Obrigado!
158

Bibliography
[1] Ossama Abdel-Hamid, Abdel-rahman Mohamed, Hui Jiang, Li Deng, Ger-ald Penn, and Dong Yu. Convolutional neural networks for speech recog-nition. Audio, Speech, and Language Processing, IEEE/ACM Transactionson, 22(10):1533–1545, 2014.
[2] Ralph Adolphs. Neural systems for recognizing emotion. Current Opinionin Neurobiology, 12(2):169 – 177, 2002.
[3] S. Afzal and P. Robinson. Natural affect data - collection and annotation ina learning context. In 3rd International Conference on Affective Computingand Intelligent Interaction., pages 1–7, Sept 2009.
[4] Alessandra Angelucci and Jean Bullier. Reaching beyond the classical recep-tive field of v1 neurons: horizontal or feedback axons? Journal of Physiology-Paris, 97(2):141–154, 2003.
[5] Arash Foroughmand Arabi and Guojun Lu. Enhanced polyphonic musicgenre classification using high level features. In Signal and Image ProcessingApplications (ICSIPA), 2009 IEEE International Conference on, pages 101–106. IEEE, 2009.
[6] Magda B Arnold. Emotion and personality. Columbia University Press,1960.
[7] Minoru Asada. Development of artificial empathy. Neuroscience research,90:41–50, 2015.
[8] Anthony P Atkinson and Ralph Adolphs. Visual emotion perception. Emo-tion and consciousness, page 150, 2005.
[9] Ntombikayise Banda and Peter Robinson. Noise analysis in audio-visualemotion recognition. In Proceedings of the International Conference on Mul-timodal Interaction, pages 1–4. Citeseer, 2011.
[10] Debarati Bandyopadhyay, V.S. Chandrasekhar Pammi, and Narayanan Srini-vasan. Chapter 3 - role of affect in decision making. In V.S. ChandrasekharPammi and Narayanan Srinivasan, editors, Decision Making Neural and Be-havioural Approaches, volume 202 of Progress in Brain Research, pages 37 –53. Elsevier, 2013.
159

Bibliography
[11] Lauren Barghout-Stein. How Global Perceptual Context Changes Local Con-trast Processing. University of California, Berkeley, 2003.
[12] Lisa Feldman Barrett. Solving the emotion paradox: Categorization and theexperience of emotion. Personality and social psychology review, 10(1):20–46,2006.
[13] Lisa Feldman Barrett and Moshe Bar. See it with feeling: affective pre-dictions during object perception. Philosophical Transactions of the RoyalSociety of London B: Biological Sciences, 364(1521):1325–1334, 2009.
[14] P. Barros, G.I. Parisi, D. Jirak, and S. Wermter. Real-time gesture recogni-tion using a humanoid robot with a deep neural architecture. In HumanoidRobots (Humanoids), 2014 14th IEEE-RAS International Conference on,pages 646–651, Nov 2014.
[15] Pablo Barros, Doreen Jirak, Cornelius Weber, and Stefan Wermter. Multi-modal emotional state recognition using sequence-dependent deep hierarchi-cal features. Neural Networks, 72:140–151, 2015.
[16] Marian Stewart Bartlett, Paul A Viola, Terrence J Sejnowski, Beatrice AGolomb, Jan Larsen, Joseph C Hager, and Paul Ekman. Classifying facialaction. Advances in neural information processing systems, pages 823–829,1996.
[17] Johannes Bauer, Jorge Davila-Chacon, Erik Strahl, and Stefan Wermter.Smoke and mirrorsvirtual realities for sensor fusion experiments inbiomimetic robotics. In Multisensor Fusion and Integration for IntelligentSystems (MFI), 2012 IEEE Conference on, pages 114–119. IEEE, 2012.
[18] James Beament. How we hear music: The relationship between music andthe hearing mechanism. Boydell Press, 2003.
[19] Michael S Beauchamp. The social mysteries of the superior temporal sulcus.Trends in cognitive sciences, 19(9):489–490, 2015.
[20] David James Beymer. Face recognition under varying pose. In ComputerVision and Pattern Recognition, 1994. Proceedings CVPR’94., 1994 IEEEComputer Society Conference on, pages 756–761. IEEE, 1994.
[21] Boris Birmaher, Suneeta Khetarpal, David Brent, Marlane Cully, Lisa Bal-ach, Joan Kaufman, and Sandra McKenzie Neer. The screen for child anxietyrelated emotional disorders (scared): scale construction and psychometriccharacteristics. Journal of the American Academy of Child & AdolescentPsychiatry, 36(4):545–553, 1997.
[22] Hugh T Blair, Glenn E Schafe, Elizabeth P Bauer, Sarina M Rodrigues, andJoseph E LeDoux. Synaptic plasticity in the lateral amygdala: a cellularhypothesis of fear conditioning. Learning & memory, 8(5):229–242, 2001.
160

Bibliography
[23] Fredda Blanchard-Fields. Everyday problem solving and emotion an adultdevelopmental perspective. Current Directions in Psychological Science,16(1):26–31, 2007.
[24] Richard T Born and David C Bradley. Structure and function of visual areamt. Annu. Rev. Neurosci., 28:157–189, 2005.
[25] Danny Oude Bos. Eeg-based emotion recognition. The Influence of Visualand Auditory Stimuli, pages 1–17, 2006.
[26] Gordon H Bower. Mood and memory. American psychologist, 36(2):129–148,1981.
[27] Oliver J Braddick, Justin MD O’Brien, John Wattam-Bell, Janette Atkinson,Tom Hartley, and Robert Turner. Brain areas sensitive to coherent visualmotion. Perception, 30(1):61–72, 2001.
[28] Clive R Bramham and Elhoucine Messaoudi. Bdnf function in adult synapticplasticity: the synaptic consolidation hypothesis. Progress in neurobiology,76(2):99–125, 2005.
[29] Margaret J Briggs-Gowan, Alice S Carter, Julia R Irwin, Karen Wachtel,and Domenic V Cicchetti. The brief infant-toddler social and emotional as-sessment: screening for social-emotional problems and delays in competence.Journal of pediatric psychology, 29(2):143–155, 2004.
[30] Charles Bruce, Robert Desimone, and Charles G Gross. Visual properties ofneurons in a polysensory area in superior temporal sulcus of the macaque.Journal of neurophysiology, 46(2):369–384, 1981.
[31] Vicki Bruce and Andy Young. Understanding face recognition. British jour-nal of psychology, 77(3):305–327, 1986.
[32] Jean Bullier. Integrated model of visual processing. Brain Research Reviews,36(2):96–107, 2001.
[33] William E Bunney and David A Hamburg. Methods for reliable longitudinalobservation of behavior: Development of a method for systematic observationof emotional behavior on psychiatric wards. Archives of General Psychiatry,9(3):280–294, 1963.
[34] Carlos Busso, Murtaza Bulut, Chi-Chun Lee, Abe Kazemzadeh, EmilyMower, Samuel Kim, Jeannette N Chang, Sungbok Lee, and Shrikanth SNarayanan. Iemocap: Interactive emotional dyadic motion capture database.Language resources and evaluation, 42(4):335–359, 2008.
[35] Carlos Busso, Zhigang Deng, Serdar Yildirim, Murtaza Bulut, Chul Min Lee,Abe Kazemzadeh, Sungbok Lee, Ulrich Neumann, and Shrikanth Narayanan.
161

Bibliography
Analysis of emotion recognition using facial expressions, speech and multi-modal information. In Proceedings of the 6th international conference onMultimodal interfaces, pages 205–211. ACM, 2004.
[36] Michel Cabanac. What is emotion? Behavioural Processes, 60(2):69 – 83,2002.
[37] Larry Cahill and James L McGaugh. A novel demonstration of enhancedmemory associated with emotional arousal. Consciousness and cognition,4(4):410–421, 1995.
[38] Salvatore Campanella and Pascal Belin. Integrating face and voice in personperception. Trends in cognitive sciences, 11(12):535–543, 2007.
[39] R Campbell, Charles A Heywood, A Cowey, M Regard, and T Landis. Sen-sitivity to eye gaze in prosopagnosic patients and monkeys with superiortemporal sulcus ablation. Neuropsychologia, 28(11):1123–1142, 1990.
[40] George Caridakis, Ginevra Castellano, Loic Kessous, Amaryllis Raouzaiou,Lori Malatesta, Stelios Asteriadis, and Kostas Karpouzis. Multimodal emo-tion recognition from expressive faces, body gestures and speech. In IFIPInternational Conference on Artificial Intelligence Applications and Innova-tions, pages 375–388. Springer, 2007.
[41] George Caridakis, Lori Malatesta, Loic Kessous, Noam Amir, AmaryllisRaouzaiou, and Kostas Karpouzis. Modeling naturalistic affective statesvia facial and vocal expressions recognition. In Proceedings of the 8th inter-national conference on Multimodal interfaces, pages 146–154. ACM, 2006.
[42] Joshua Michael Carlson, Tsafrir Greenberg, and Lilianne R Mujica-Parodi.Blind rage? heightened anger is associated with altered amygdala responsesto masked and unmasked fearful faces. Psychiatry Research: Neuroimaging,182(3):281–283, 2010.
[43] Ginevra Castellano, Loic Kessous, and George Caridakis. Emotion recogni-tion through multiple modalities: Face, body gesture, speech. In ChristianPeter and Russell Beale, editors, Affect and Emotion in Human-ComputerInteraction, volume 4868 of Lecture Notes in Computer Science, pages 92–103. Springer Berlin Heidelberg, 2008.
[44] Rama Chellappa, Charles L Wilson, and Saad Sirohey. Human and machinerecognition of faces: A survey. Proceedings of the IEEE, 83(5):705–741, 1995.
[45] Shizhi Chen, YingLi Tian, Qingshan Liu, and Dimitris N. Metaxas. Rec-ognizing expressions from face and body gesture by temporal normalizedmotion and appearance features. Image and Vision Computing, 31(2):175 –185, 2013. Affect Analysis In Continuous Input.
162

Bibliography
[46] Sven-Ake Christianson. The handbook of emotion and memory: Researchand theory. Psychology Press, 2014.
[47] Sven-Ake Christianson and Elizabeth F Loftus. Some characteristics of peo-ples traumatic memories. Bulletin of the Psychonomic Society, 28(3):195–198, 1990.
[48] Jason A Clark. Relations of homology between higher cognitive emotionsand basic emotions. Biology & Philosophy, 25(1):75–94, 2010.
[49] Adam Coates and Andrew Y Ng. Selecting receptive fields in deep networks.In Advances in Neural Information Processing Systems, pages 2528–2536,2011.
[50] Ira Cohen, Ashutosh Garg, Thomas S Huang, et al. Emotion recognition fromfacial expressions using multilevel hmm. In Neural information processingsystems, volume 2. Citeseer, 2000.
[51] Jeffrey F Cohn, Adena J Zlochower, James Lien, and Takeo Kanade. Au-tomated face analysis by feature point tracking has high concurrent validitywith manual facs coding. Psychophysiology, 36(01):35–43, 1999.
[52] Randall Collins. Social movements and the focus of emotional attention.Passionate politics: Emotions and social movements, pages 27–44, 2001.
[53] Wikimedia Commons. Image showing dorsal stream (green) and ventralstream (purple) in the human brain visual system, 2007.
[54] Leda Cosmides and John Tooby. Evolutionary psychology and the emotions.Handbook of emotions, 2:91–115, 2000.
[55] Mark Coulson. Attributing emotion to static body postures: Recognitionaccuracy, confusions, and viewpoint dependence. Journal of nonverbal be-havior, 28(2):117–139, 2004.
[56] Roddy Cowie and Randolph R Cornelius. Describing the emotional statesthat are expressed in speech. Speech communication, 40(1):5–32, 2003.
[57] Roddy Cowie, Ellen Douglas-Cowie, Nicolas Tsapatsoulis, George Votsis,Stefanos Kollias, Winfried Fellenz, and John G Taylor. Emotion recognitionin human-computer interaction. IEEE Signal processing magazine, 18(1):32–80, 2001.
[58] Antonio R Damasio. Descartes’ error. Random House, 2006.
[59] Justin d’Arms and Daniel Jacobson. The moralistic fallacy: onthe’appropriateness’ of emotions. Philosophical and Phenomenological Re-search, pages 65–90, 2000.
163

Bibliography
[60] Charles Darwin. The expression of the emotions in man and animals. JohnMurray, 1873.
[61] Beatrice De Gelder and Jean Vroomen. The perception of emotions by earand by eye. Cognition & Emotion, 14(3):289–311, 2000.
[62] Liyanage C De Silva, Tsutomu Miyasato, and Ryohei Nakatsu. Facial emo-tion recognition using multi-modal information. In Information, Communi-cations and Signal Processing, 1997. ICICS., Proceedings of 1997 Interna-tional Conference on, volume 1, pages 397–401. IEEE, 1997.
[63] Marieke De Vries, Rob W Holland, and Cilia LM Witteman. Fitting deci-sions: Mood and intuitive versus deliberative decision strategies. Cognitionand Emotion, 22(5):931–943, 2008.
[64] Frank Dellaert, Thomas Polzin, and Alex Waibel. Recognizing emotion inspeech. In Spoken Language, 1996. ICSLP 96. Proceedings., Fourth Interna-tional Conference on, volume 3, pages 1970–1973. IEEE, 1996.
[65] Li Deng, Geoffrey Hinton, and Brian Kingsbury. New types of deep neu-ral network learning for speech recognition and related applications: Anoverview. In Acoustics, Speech and Signal Processing (ICASSP), 2013 IEEEInternational Conference on, pages 8599–8603. IEEE, 2013.
[66] Pieter MA Desmet. Design for mood: Twenty activity-based opportunitiesto design for mood regulation. International Journal of Design, 9(2):1–19,2015.
[67] Diana Deutsch. Hearing music in ensembles. Physics today, 63(2):40–45,2010.
[68] Laurence Devillers, Laurence Vidrascu, and Lori Lamel. Challenges in real-life emotion annotation and machine learning based detection. Neural Net-works, 18(4):407–422, 2005.
[69] Abhinav Dhall et al. Collecting large, richly annotated facial-expressiondatabases from movies. 2012.
[70] Abhinav Dhall, Roland Goecke, Jyoti Joshi, Karan Sikka, and Tom Gedeon.Emotion recognition in the wild challenge 2014: Baseline, data and protocol.In Proceedings of the 16th International Conference on Multimodal Interac-tion, pages 461–466. ACM, 2014.
[71] Thomas Dixon. From passions to emotions: The creation of a secular psy-chological category. Cambridge University Press, 2003.
[72] Raymond J Dolan. Emotion, cognition, and behavior. science,298(5596):1191–1194, 2002.
164

Bibliography
[73] Raymond J Dolan, John S Morris, and Beatrice de Gelder. Crossmodalbinding of fear in voice and face. Proceedings of the National Academy ofSciences, 98(17):10006–10010, 2001.
[74] Jon Driver. A selective review of selective attention research from the pastcentury. British Journal of Psychology, 92(1):53–78, 2001.
[75] R Dubner and SM Zeki. Response properties and receptive fields of cells in ananatomically defined region of the superior temporal sulcus in the monkey.Brain research, 35(2):528–532, 1971.
[76] Yadin Dudai. The neurobiology of consolidations, or, how stable is the en-gram? Annu. Rev. Psychol., 55:51–86, 2004.
[77] Kristen Dunfield, Valerie A Kuhlmeier, Laura OConnell, and Elizabeth Kel-ley. Examining the diversity of prosocial behavior: Helping, sharing, andcomforting in infancy. Infancy, 16(3):227–247, 2011.
[78] John D Eastwood, Daniel Smilek, and Philip M Merikle. Differential atten-tional guidance by unattended faces expressing positive and negative emo-tion. Perception & Psychophysics, 63(6):1004–1013, 2001.
[79] Nancy Eisenberg. Emotion, regulation, and moral development. Annualreview of psychology, 51(1):665–697, 2000.
[80] Paul Ekman. The argument and evidence about universals in facial expres-sions of emotion. John Wiley and Sons, 1989.
[81] Paul Ekman. An argument for basic emotions. Cognition & emotion, 6(3-4):169–200, 1992.
[82] Paul Ekman. Emotions revealed: Recognizing faces and feelings to improvecommunication and emotional life. Macmillan, 2007.
[83] Paul Ekman. Lie catching and microexpressions. The philosophy of deception,pages 118–133, 2009.
[84] Paul Ekman and Wallace V. Friesen. Constants across cultures in the faceand emotion. Journal of Personality and Social Psychology, 17(2):124–129,1971.
[85] Paul Ekman and Wallace V Friesen. Facial action coding system. ConsultingPsychologists Press, Stanford University, Palo Alto, 1977.
[86] Paul Ekman and Erika L Rosenberg. What the face reveals: Basic and appliedstudies of spontaneous expression using the Facial Action Coding System(FACS). Oxford University Press, USA, 1997.
165

Bibliography
[87] Moataz El Ayadi, Mohamed S Kamel, and Fakhri Karray. Survey on speechemotion recognition: Features, classification schemes, and databases. PatternRecognition, 44(3):572–587, 2011.
[88] Dumitru Erhan, Yoshua Bengio, Aaron Courville, Pierre-Antoine Manzagol,Pascal Vincent, and Samy Bengio. Why does unsupervised pre-training helpdeep learning? J. Mach. Learn. Res., 11:625–660, March 2010.
[89] Irfan A Essa and Alex P Pentland. Facial expression recognition using adynamic model and motion energy. In Computer Vision, 1995. Proceedings.,Fifth International Conference on, pages 360–367. IEEE, 1995.
[90] Irfan A. Essa and Alex Paul Pentland. Coding, analysis, interpretation, andrecognition of facial expressions. IEEE transactions on pattern analysis andmachine intelligence, 19(7):757–763, 1997.
[91] David C. Van Essen and Jack L. Gallant. Neural mechanisms of form andmotion processing in the primate visual system. Neuron, 13(1):1 – 10, 1994.
[92] Thomas Ethofer, Silke Anders, Michael Erb, Christina Droll, Lydia Royen,Ralf Saur, Susanne Reiterer, Wolfgang Grodd, and Dirk Wildgruber. Impactof voice on emotional judgment of faces: An event-related fmri study. Humanbrain mapping, 27(9):707–714, 2006.
[93] Michael W Eysenck. Arousal, learning, and memory. Psychological Bulletin,83(3):389, 1976.
[94] B. Fasel. Head-pose invariant facial expression recognition using convolu-tional neural networks. In Proceedings of the fourth IEEE InternationalConference on Multimodal Interfaces, 2002, pages 529–534, 2002.
[95] Beverley Fehr and James A Russell. Concept of emotion viewed from a pro-totype perspective. Journal of experimental psychology: General, 113(3):464,1984.
[96] Francesco Foroni and Gun R Semin. Language that puts you in touch withyour bodily feelings the multimodal responsiveness of affective expressions.Psychological Science, 20(8):974–980, 2009.
[97] Elaine Fox. Processing emotional facial expressions: The role of anxietyand awareness. Cognitive, Affective, & Behavioral Neuroscience, 2(1):52–63,2002.
[98] Elaine Fox. Emotion Science: An Integration of Cognitive and NeuroscienceApproaches. Palgrave Macmillan, 2008.
[99] Yves Fregnac, Cyril Monier, Frederic Chavane, Pierre Baudot, and Lyle Gra-ham. Shunting inhibition, a silent step in visual cortical computation. Jour-nal of Physiology, pages 441–451, 2003.
166

Bibliography
[100] Simone Frintrop, Erich Rome, and Henrik I Christensen. Computationalvisual attention systems and their cognitive foundations: A survey. ACMTransactions on Applied Perception (TAP), 7(1):6, 2010.
[101] Nilima Salankar Fulmare, Prasun Chakrabarti, and Divakar Yadav. Un-derstanding and estimation of emotional expression using acoustic analysisof natural speech. International Journal on Natural Language Computing(IJNLC), 2(4), 2013.
[102] Harn-M Gardiner, Ruth Clark Metcalf, and John G Beebe-Center. Feelingand emotion: A history of theories. American Book Publishing, 1937.
[103] Michael S Gazzaniga. The cognitive neurosciences. MIT press, 2004.
[104] Joe George and Lior Shamir. Unsupervised analysis of similarities betweenmusicians and musical genres using spectrograms. Artificial Intelligence Re-search, 4(2):p61, 2015.
[105] Mark S George, Terence A Ketter, Debra S Gill, James V Haxby, Leslie GUngerleider, Peter Herscovitch, and Robert M Post. Brain regions involved inrecognizing facial emotion or identity: an oxygen-15 pet study. The Journalof neuropsychiatry and clinical neurosciences, 1993.
[106] Mark S George, Priti I Parekh, Ned Rosinsky, Terence A Ketter, Tim AKimbrell, Kenneth M Heilman, Peter Herscovitch, and Robert M Post. Un-derstanding emotional prosody activates right hemisphere regions. Archivesof neurology, 53(7):665–670, 1996.
[107] Alessandra Geraci and Luca Surian. The developmental roots of fairness:Infants reactions to equal and unequal distributions of resources. Develop-mental science, 14(5):1012–1020, 2011.
[108] Xavier Glorot, Antoine Bordes, and Yoshua Bengio. Deep sparse rectifierneural networks. In Geoffrey J. Gordon and David B. Dunson, editors, Pro-ceedings of the Fourteenth International Conference on Artificial Intelligenceand Statistics (AISTATS-11), volume 15, pages 315–323. Journal of MachineLearning Research - Workshop and Conference Proceedings, 2011.
[109] Erin Goddard, Damien J Mannion, J Scott McDonald, Samuel G Solomon,and Colin WG Clifford. Color responsiveness argues against a dorsal com-ponent of human v4. Journal of vision, 11(4):3–3, 2011.
[110] William V Good, James E Jan, Luis DeSa, A James Barkovich, MyrykaGroenveld, et al. Cortical visual impairment in children. Survey of ophthal-mology, 38(4):351–364, 1994.
[111] Melvyn A Goodale and A David Milner. Separate visual pathways for per-ception and action. Trends in neurosciences, 15(1):20–25, 1992.
167

Bibliography
[112] Melvyn A Goodale and A David Milner. Separate visual pathways for per-ception and action. Trends in neurosciences, 15(1):20–25, 1992.
[113] Stephen Grossberg. Neural Networks and Natural Intelligence. MIT Press,Cambridge, MA, USA, 1992.
[114] ED Grossman and R Blake. Brain activity evoked by inverted and imaginedbiological motion. Vision research, 41(10):1475–1482, 2001.
[115] Tobias Grossmann. The development of emotion perception in face and voiceduring infancy. Restorative neurology and neuroscience, 28(2):219, 2010.
[116] Tobias Grossmann, Tricia Striano, and Angela D Friederici. Crossmodalintegration of emotional information from face and voice in the infant brain.Developmental Science, 9(3):309–315, 2006.
[117] H. Gunes and M. Piccardi. A bimodal face and body gesture database forautomatic analysis of human nonverbal affective behavior. In 18th Inter-national Conference on Pattern Recognition(ICPR), 2006, volume 1, pages1148–1153, 2006.
[118] H. Gunes and M. Piccardi. Automatic temporal segment detection and affectrecognition from face and body display. Systems, Man, and Cybernetics, PartB: Cybernetics, IEEE Transactions on, 39(1):64–84, Feb 2009.
[119] Jonathan Haidt, Craig Joseph, et al. The moral mind: How five sets ofinnate intuitions guide the development of many culture-specific virtues, andperhaps even modules. The innate mind, 3:367–391, 2007.
[120] J Kiley Hamlin. Moral judgment and action in preverbal infants and tod-dlers evidence for an innate moral core. Current Directions in PsychologicalScience, 22(3):186–193, 2013.
[121] J Kiley Hamlin. The infantile origins of our moral brains. The Moral Brain:A Multidisciplinary Perspective, page 105, 2015.
[122] J Kiley Hamlin, Karen Wynn, and Paul Bloom. Social evaluation by prever-bal infants. Nature, 450(7169):557–559, 2007.
[123] S. Haq and P.J.B. Jackson. Machine Audition: Principles, Algorithms andSystems, chapter Multimodal Emotion Recognition, pages 398–423. IGIGlobal, Hershey PA, Aug. 2010.
[124] Sanaul Haq, Philip JB Jackson, and J Edge. Speaker-dependent audio-visualemotion recognition. In AVSP, pages 53–58, 2009.
[125] Susan Harter and Bonnie J Buddin. Children’s understanding of the simul-taneity of two emotions: A five-stage developmental acquisition sequence.Developmental psychology, 23(3):388, 1987.
168

Bibliography
[126] ME Hasselmo, ET Rolls, GC Baylis, and V Nalwa. Object-centered encodingby face-selective neurons in the cortex in the superior temporal sulcus of themonkey. Experimental Brain Research, 75(2):417–429, 1989.
[127] Michael E Hasselmo, Edmund T Rolls, and Gordon C Baylis. The roleof expression and identity in the face-selective responses of neurons in thetemporal visual cortex of the monkey. Behavioural brain research, 32(3):203–218, 1989.
[128] Darren Hau and Ke Chen. Exploring hierarchical speech representations witha deep convolutional neural network. UKCI 2011 Accepted Papers, page 37,2011.
[129] Donald Olding Hebb. The organization of behavior: A neuropsychologicalapproach. John Wiley & Sons, 1949.
[130] Gregory Hickok. The cortical organization of speech processing: Feedbackcontrol and predictive coding the context of a dual-stream model. Journalof communication disorders, 45(6):393–402, 2012.
[131] Gregory Hickok. The cortical organization of speech processing: Feedbackcontrol and predictive coding the context of a dual-stream model. Journalof communication disorders, 45(6):393–402, 2012.
[132] Gregory Hickok and David Poeppel. Dorsal and ventral streams: a frameworkfor understanding aspects of the functional anatomy of language. Cognition,92(1):67–99, 2004.
[133] Gregory Hickok and David Poeppel. The cortical organization of speechprocessing. Nature Reviews Neuroscience, 8(5):393–402, 2007.
[134] G. Hinton, Li Deng, Dong Yu, G.E. Dahl, A. Mohamed, N. Jaitly, A. Senior,V. Vanhoucke, P. Nguyen, T.N. Sainath, and B. Kingsbury. Deep neuralnetworks for acoustic modeling in speech recognition: The shared views offour research groups. Signal Processing Magazine, IEEE, 29(6):82–97, 2012.
[135] Geoffrey E Hinton and James A Anderson. Parallel models of associativememory: updated edition. Psychology press, 2014.
[136] Geoffrey E. Hinton, Simon Osindero, and Yee-Whye Teh. A fast learningalgorithm for deep belief nets. Neural Comput., 18(7):1527–1554, July 2006.
[137] Anett Hoppe and Marco Tabacchi. Towards a modelization of the elusiveconcept of wisdom using fuzzy techniques. In Fuzzy Information ProcessingSociety (NAFIPS), 2012 Annual Meeting of the North American, pages 1–5.IEEE, 2012.
169

Bibliography
[138] Yin-Fu Huang, Sheng-Min Lin, Huan-Yu Wu, and Yu-Siou Li. Music genreclassification based on local feature selection using a self-adaptive harmonysearch algorithm. Data & Knowledge Engineering, 92:60–76, 2014.
[139] David H. Hubel and Torsten N. Wiesel. Receptive fields of single neurons inthe cat’s striate cortex. Journal of Physiology, 148:574–591, 1959.
[140] David Hume. Emotions and moods. Organizational behavior, pages 258–297,2012.
[141] Spiros V Ioannou, Amaryllis T Raouzaiou, Vasilis A Tzouvaras, Theofilos PMailis, Kostas C Karpouzis, and Stefanos D Kollias. Emotion recognitionthrough facial expression analysis based on a neurofuzzy network. NeuralNetworks, 18(4):423–435, 2005.
[142] Carroll E Izard. The psychology of emotions. Springer Science & BusinessMedia, 1991.
[143] Carroll E Izard. Innate and universal facial expressions: evidence from devel-opmental and cross-cultural research. American Psychological Association,1994.
[144] Carroll E Izard. Human emotions. Springer Science & Business Media, 2013.
[145] William James. What is an emotion? Mind, (34):188–205, 1884.
[146] Shuiwang Ji, Wei Xu, Ming Yang, and Kai Yu. 3d convolutional neuralnetworks for human action recognition. Pattern Analysis and Machine In-telligence, IEEE Transactions on, 35(1):221–231, Jan 2013.
[147] Qin Jin, Chengxin Li, Shizhe Chen, and Huimin Wu. Speech emotion recog-nition with acoustic and lexical features. In Acoustics, Speech and SignalProcessing (ICASSP), 2015 IEEE International Conference on, pages 4749–4753, April 2015.
[148] Richard Joyce. The evolution of morality. MIT press, 2007.
[149] Samira Ebrahimi Kahou, Christopher Pal, Xavier Bouthillier, PierreFroumenty, Caglar Gulcehre, Roland Memisevic, Pascal Vincent, AaronCourville, Yoshua Bengio, Raul Chandias Ferrari, Mehdi Mirza, SebastienJean, Pierre-Luc Carrier, Yann Dauphin, Nicolas Boulanger-Lewandowski,Abhishek Aggarwal, Jeremie Zumer, Pascal Lamblin, Jean-Philippe Ray-mond, Guillaume Desjardins, Razvan Pascanu, David Warde-Farley, AtousaTorabi, Arjun Sharma, Emmanuel Bengio, Myriam Cote, Kishore ReddyKonda, and Zhenzhou Wu. Combining modality specific deep neural net-works for emotion recognition in video. In Proceedings of the 15th ACM onInternational Conference on Multimodal Interaction, ICMI ’13, pages 543–550, New York, NY, USA, 2013. ACM.
170
Bibliography
[150] A. Karpathy, G. Toderici, S. Shetty, T. Leung, R. Sukthankar, and Li Fei-Fei. Large-scale video classification with convolutional neural networks. InComputer Vision and Pattern Recognition (CVPR), 2014 IEEE Conferenceon, pages 1725–1732, June 2014.
[151] Andrej Karpathy, George Toderici, Sanketh Shetty, Thomas Leung, RahulSukthankar, and Li Fei-Fei. Large-scale video classification with convolu-tional neural networks. In Proceedings of the IEEE conference on ComputerVision and Pattern Recognition, pages 1725–1732, 2014.
[152] MASE Kenji. Recognition of facial expression from optical flow. IEICETRANSACTIONS on Information and Systems, 74(10):3474–3483, 1991.
[153] Elizabeth A Kensinger. Remembering emotional experiences: The contribu-tion of valence and arousal. Reviews in the Neurosciences, 15(4):241–252,2004.
[154] Pooya Khorrami, Thomas Paine, and Thomas Huang. Do deep neural net-works learn facial action units when doing expression recognition? In Pro-ceedings of the IEEE International Conference on Computer Vision Work-shops, pages 19–27, 2015.
[155] Hyung-O Kim, Soohwan Kim, and Sung-Kee Park. Pointing gesture-basedunknown object extraction for learning objects with robot. In InternationalConference on Control, Automation and Systems, 2008. ICCAS 2008, pages2156–2161, 2008.
[156] Kyung Hwan Kim, SW Bang, and SR Kim. Emotion recognition systemusing short-term monitoring of physiological signals. Medical and biologicalengineering and computing, 42(3):419–427, 2004.
[157] Sunghwan Mac Kim, Alessandro Valitutti, and Rafael A Calvo. Evaluationof unsupervised emotion models to textual affect recognition. In Proceed-ings of the NAACL HLT 2010 Workshop on Computational Approaches toAnalysis and Generation of Emotion in Text, pages 62–70. Association forComputational Linguistics, 2010.
[158] Andrea Kleinsmith and Nadia Bianchi-Berthouze. Affective body expres-sion perception and recognition: A survey. IEEE Transactions on AffectiveComputing, 4(1):15–33, 2013.
[159] Hiroshi Kobayashi and Fumio Hara. Recognition of six basic facial expressionand their strength by neural network. In Robot and Human Communication,1992. Proceedings., IEEE International Workshop on, pages 381–386. IEEE,1992.
[160] Gary G Koch. Intraclass correlation coefficient. Encyclopedia of statisticalsciences, 1982.
171

Bibliography
[161] Lawrence Kohlberg. Stages in the development of moral thought and action,1969.
[162] Teuvo Kohonen. Adaptive, associative, and self-organizing functions in neu-ral computing. Applied Optics, 26(23):4910–4918, 1987.
[163] Teuvo Kohonen. The self-organizing map. Proceedings of the IEEE,78(9):1464–1480, 1990.
[164] Teuvo Kohonen. Self-organization and associative memory, volume 8.Springer Science & Business Media, 2012.
[165] Teuvo Kohonen and Panu Somervuo. Self-organizing maps of symbol strings.Neurocomputing, 21(1):19–30, 1998.
[166] David Konstan. The emotions of the ancient Greeks: Studies in Aristotleand classical literature, volume 5. University of Toronto Press, 2006.
[167] Irene Kotsia and Ioannis Pitas. Facial expression recognition in image se-quences using geometric deformation features and support vector machines.IEEE Transactions on Image Processing, 16(1):172–187, 2007.
[168] Robert Kraut. Love de re. Midwest studies in philosophy, 10(1):413–430,1987.
[169] Richard J. Krauzlis, Lee P. Lovejoy, and Alexandre Zenon. Superior colliculusand visual spatial attention. Annual review of neuroscience, 36(1):165–182,July 2013.
[170] Mariska E Kret, Karin Roelofs, Jeroen J Stekelenburg, and Beatricede Gelder. Emotional signals from faces, bodies and scenes influence ob-servers’ face expressions, fixations and pupil-size. Frontiers in human neu-roscience, 7, 2013.
[171] Alex Krizhevsky, Ilya Sutskever, and Geoffrey E Hinton. Imagenet clas-sification with deep convolutional neural networks. In Advances in neuralinformation processing systems, pages 1097–1105, 2012.
[172] Dharshan Kumaran. Short-term memory and the human hippocampus. TheJournal of Neuroscience, 28(15):3837–3838, 2008.
[173] Oh-Wook Kwon, Kwokleung Chan, Jiucang Hao, and Te-Won Lee. Emotionrecognition by speech signals. In INTERSPEECH. Citeseer, 2003.
[174] Kevin S LaBar and Elizabeth A Phelps. Arousal-mediated memory consoli-dation: Role of the medial temporal lobe in humans. Psychological Science,9(6):490–493, 1998.
[175] Peter J Lang. The emotion probe: Studies of motivation and attention.American psychologist, 50(5):372, 1995.
172

Bibliography
[176] I Lawrence and Kuei Lin. A concordance correlation coefficient to evaluatereproducibility. Biometrics, pages 255–268, 1989.
[177] Richard S Lazarus. Progress on a cognitive-motivational-relational theory ofemotion. American psychologist, 46(8):819, 1991.
[178] Richard S Lazarus and Susan Folkman. Stress, appraisal, and coping.Springer publishing company, 1984.
[179] Yann Lecun, Lon Bottou, Yoshua Bengio, and Patrick Haffner. Gradient-based learning applied to document recognition. In Proceedings of the IEEE,pages 2278–2324, 1998.
[180] Joseph LeDoux. Rethinking the emotional brain. Neuron, 73(4):653–676,2012.
[181] Joseph LeDoux and Jules R Bemporad. The emotional brain. Journal of theAmerican Academy of Psychoanalysis, 25(3):525–528, 1997.
[182] Joseph E LeDoux. Emotion circuits in the brain. Annu. Rev. Neurosci,23:155–184, 2000.
[183] Joseph E LeDoux. Emotion circuits in the brain. Focus, 7(2):274–274, 2009.
[184] Chi-Chun Lee, Emily Mower, Carlos Busso, Sungbok Lee, and ShrikanthNarayanan. Emotion recognition using a hierarchical binary decision treeapproach. Speech Communication, 53(9):1162–1171, 2011.
[185] Genevieve Leuba and Rudolf Kraftsik. Changes in volume, surface estimate,three-dimensional shape and total number of neurons of the human primaryvisual cortex from midgestation until old age. Anatomy and embryology,190(4):351–366, 1994.
[186] Gil Levi and Tal Hassner. Emotion recognition in the wild via convolutionalneural networks and mapped binary patterns. In Proceedings of the 2015ACM on International Conference on Multimodal Interaction, pages 503–510. ACM, 2015.
[187] Linda J Levine and David A Pizarro. Emotion and memory research: Agrumpy overview. Social Cognition, 22(5: Special issue):530–554, 2004.
[188] Michael Lewis. Childrens emotions and moods: Developmental theory andmeasurement. Springer Science & Business Media, 2012.
[189] Penelope A Lewis and Hugo D Critchley. Mood-dependent memory. Trendsin cognitive sciences, 7(10):431–433, 2003.
173

Bibliography
[190] Tom LH Li, Antoni B Chan, and Andy HW Chun. Automatic musicalpattern feature extraction using convolutional neural network. In Proceedingsof the International MultiConference of Engineers and Computer Scientists,volume 1. Citeseer, 2010.
[191] James J Lien, Takeo Kanade, Jeffrey F Cohn, and Ching-Chung Li. Auto-mated facial expression recognition based on facs action units. In AutomaticFace and Gesture Recognition, 1998. Proceedings. Third IEEE InternationalConference on, pages 390–395. IEEE, 1998.
[192] JJ-J Lien, T Kanade, JF Cohn, and Ching-Chung Li. Subtly different facialexpression recognition and expression intensity estimation. In ComputerVision and Pattern Recognition, 1998. Proceedings. 1998 IEEE ComputerSociety Conference on, pages 853–859. IEEE, 1998.
[193] Yi-Lin Lin and Gang Wei. Speech emotion recognition based on hmm andsvm. In 2005 International Conference on Machine Learning and Cybernet-ics, volume 8, pages 4898–4901. IEEE, 2005.
[194] Yuan-Pin Lin, Chi-Hong Wang, Tzyy-Ping Jung, Tien-Lin Wu, Shyh-KangJeng, Jeng-Ren Duann, and Jyh-Horng Chen. Eeg-based emotion recog-nition in music listening. IEEE Transactions on Biomedical Engineering,57(7):1798–1806, 2010.
[195] Mengmeng Liu, Hui Chen, Yang Li, and Fengjun Zhang. Emotional tone-based audio continuous emotion recognition. In Xiangjian He, Suhuai Luo,Dacheng Tao, Changsheng Xu, Jie Yang, and MuhammadAbul Hasan, edi-tors, MultiMedia Modeling, volume 8936 of Lecture Notes in Computer Sci-ence, pages 470–480. Springer International Publishing, 2015.
[196] Mengyi Liu, Ruiping Wang, Shaoxin Li, Shiguang Shan, Zhiwu Huang, andXilin Chen. Combining multiple kernel methods on riemannian manifold foremotion recognition in the wild. In Proceedings of the 16th InternationalConference on Multimodal Interaction, pages 494–501. ACM, 2014.
[197] Yisi Liu, Olga Sourina, and Minh Khoa Nguyen. Real-time eeg-based emo-tion recognition and its applications. In Transactions on computational sci-ence XII, pages 256–277. Springer, 2011.
[198] Damien Lockner and Nathalie Bonnardel. Towards the evaluation of emo-tional interfaces. In Human-Computer Interaction: Design and Evaluation,pages 500–511. Springer, 2015.
[199] R Lopez, Eva Balsa-Canto, and E Onate. Neural networks for variationalproblems in engineering. International Journal for Numerical Methods inEngineering, 75(11):1341–1360, 2008.
174

Bibliography
[200] Leo L Lui, James A Bourne, and Marcello GP Rosa. Functional responseproperties of neurons in the dorsomedial visual area of new world monkeys(callithrix jacchus). Cerebral Cortex, 16(2):162–177, 2006.
[201] James MacQueen et al. Some methods for classification and analysis ofmultivariate observations. In Proceedings of the fifth Berkeley symposium onmathematical statistics and probability, volume 1, pages 281–297. Oakland,CA, USA., 1967.
[202] Richard J Maddock, Amy S Garrett, and Michael H Buonocore. Posteriorcingulate cortex activation by emotional words: fmri evidence from a valencedecision task. Human brain mapping, 18(1):30–41, 2003.
[203] Jens Madsen, Bjørn Sand Jensen, and Jan Larsen. Learning combinations ofmultiple feature representations for music emotion prediction. In Proceedingsof the 1st International Workshop on Affect & Sentiment in Multimedia,ASM ’15, pages 3–8, New York, NY, USA, 2015. ACM.
[204] Qirong Mao, Ming Dong, Zhengwei Huang, and Yongzhao Zhan. Learningsalient features for speech emotion recognition using convolutional neuralnetworks. IEEE Transactions on Multimedia, 16(8):2203–2213, 2014.
[205] Stacy Marsella and Jonathan Gratch. Modeling coping behavior in virtualhumans: don’t worry, be happy. In Proceedings of the second internationaljoint conference on Autonomous agents and multiagent systems, pages 313–320. ACM, 2003.
[206] Stephen Marsland, Jonathan Shapiro, and Ulrich Nehmzow. A self-organising network that grows when required. Neural Networks, 15(8):1041–1058, 2002.
[207] Grace B Martin and Russell D Clark. Distress crying in neonates: Speciesand peer specificity. Developmental psychology, 18(1):3, 1982.
[208] Dominic W Massaro and Peter B Egan. Perceiving affect from the voice andthe face. Psychonomic Bulletin & Review, 3(2):215–221, 1996.
[209] Masakazu Matsugu, Katsuhiko Mori, Yusuke Mitari, and Yuji Kaneda. Sub-ject independent facial expression recognition with robust face detection us-ing a convolutional neural network. Neural Networks, 16(5):555–559, 2003.
[210] Giorgio Metta, Giulio Sandini, David Vernon, Lorenzo Natale, and FrancescoNori. The icub humanoid robot: an open platform for research in embodiedcognition. In Proceedings of the 8th workshop on performance metrics forintelligent systems, pages 50–56. ACM, 2008.
[211] John Mikhail. Elements of moral cognition: Rawls’ linguistic analogy and thecognitive science of moral and legal judgment. Cambridge University Press,2011.
175

Bibliography
[212] Jeffrey Moran and Robert Desimone. Selective attention gates visual process-ing in the extrastriate cortex. Frontiers in cognitive neuroscience, 229:342–345, 1985.
[213] John S Morris, Beatrice DeGelder, Lawrence Weiskrantz, and Ray J Dolan.Differential extrageniculostriate and amygdala responses to presentation ofemotional faces in a cortically blind field. Brain, 124(6):1241–1252, 2001.
[214] John S Morris, Arne Ohman, and Raymond J Dolan. Conscious and uncon-scious emotional learning in the human amygdala. Nature, 393(6684):467–470, 1998.
[215] Hariharan Muthusamy, Kemal Polat, and Sazali Yaacob. Particle swarmoptimization based feature enhancement and feature selection for improvedemotion recognition in speech and glottal signals. PloS one, 10(3):e0120344,2015.
[216] Jin Narumoto, Tomohisa Okada, Norihiro Sadato, Kenji Fukui, and Yoshi-haru Yonekura. Attention to emotion modulates fmri activity in human rightsuperior temporal sulcus. Cognitive Brain Research, 12(2):225–231, 2001.
[217] Jerome Neu. Emotion, Thought, & Therapy: A Study of Hume and Spinozaand the Relationship of Philosophical Theories of the Emotions to Psycho-logical Theories of Therapy. Univ of California Press, 1977.
[218] Kevin N Ochsner. Are affective events richly recollected or simply familiar?the experience and process of recognizing feelings past. Journal of Experi-mental Psychology: General, 129(2):242, 2000.
[219] Kevin N Ochsner and James J Gross. The cognitive control of emotion.Trends in cognitive sciences, 9(5):242–249, 2005.
[220] Randall C O’Reilly and Michael J Frank. Making working memory work: acomputational model of learning in the prefrontal cortex and basal ganglia.Neural computation, 18(2):283–328, 2006.
[221] Andrew Ortony, Gerald L Clore, and Allan Collins. The cognitive structureof emotions. Cambridge university press, 1990.
[222] Yannis Panagakis and Constantine Kotropoulos. Music genre classificationvia topology preserving non-negative tensor factorization and sparse repre-sentations. In Acoustics speech and signal processing (ICASSP), 2010 IEEEinternational conference on, pages 249–252. IEEE, 2010.
[223] Jaak Panksepp. Affective neuroscience: The foundations of human and an-imal emotions. Oxford university press, 1998.
176

Bibliography
[224] Maja Pantic and Ioannis Patras. Dynamics of facial expression: recogni-tion of facial actions and their temporal segments from face profile imagesequences. IEEE Transactions on Systems, Man, and Cybernetics, Part B(Cybernetics), 36(2):433–449, 2006.
[225] Maja Pantic and Leon JM Rothkrantz. Facial action recognition for facialexpression analysis from static face images. IEEE Transactions on Systems,Man, and Cybernetics, Part B (Cybernetics), 34(3):1449–1461, 2004.
[226] Geoffrey JM Parker, Simona Luzzi, Daniel C Alexander, Claudia AMWheeler-Kingshott, Olga Ciccarelli, and Matthew A Lambon Ralph. Lat-eralization of ventral and dorsal auditory-language pathways in the humanbrain. Neuroimage, 24(3):656–666, 2005.
[227] Joseph J Paton, Marina A Belova, Sara E Morrison, and C Daniel Salzman.The primate amygdala represents the positive and negative value of visualstimuli during learning. Nature, 439(7078):865–870, 2006.
[228] Luiz Pessoa. On the relationship between emotion and cognition. Naturereviews neuroscience, 9(2):148–158, 2008.
[229] Luiz Pessoa, Sabine Kastner, and Leslie G Ungerleider. Attentional controlof the processing of neutral and emotional stimuli. Cognitive Brain Research,15(1):31–45, 2002.
[230] V Petrushin. Emotion in speech: Recognition and application to call centers.In Proceedings of Artificial Neural Networks in Engineering, volume 710,1999.
[231] Tomas Pfister, Xiaobai Li, Guoying Zhao, and Matti Pietikainen. Recognis-ing spontaneous facial micro-expressions. In 2011 International Conferenceon Computer Vision, pages 1449–1456. IEEE, 2011.
[232] Elizabeth A Phelps. Human emotion and memory: interactions of the amyg-dala and hippocampal complex. Current opinion in neurobiology, 14(2):198–202, 2004.
[233] Elizabeth A. Phelps, Sam Ling, and Marisa Carrasco. Emotion facilitatesperception and potentiates the perceptual benefits of attention. Psychologicalscience, 17(4):292–299, April 2006.
[234] Jean Piaget. The moral judgement of the child. Simon and Schuster, 1997.
[235] Rosalind W Picard and Roalind Picard. Affective computing, volume 252.MIT press Cambridge, 1997.
[236] Rosalind W. Picard, Elias Vyzas, and Jennifer Healey. Toward machine emo-tional intelligence: Analysis of affective physiological state. IEEE transac-tions on pattern analysis and machine intelligence, 23(10):1175–1191, 2001.
177

Bibliography
[237] James O Pickles. An introduction to the physiology of hearing. Brill, 2012.
[238] Michael Pitz and Hermann Ney. Vocal tract normalization as linear trans-formation of mfcc. In INTERSPEECH, volume 3, pages 1445–1448, 2003.
[239] Plato and Sir Henry Desmond Pritchard Lee. Plato, The Republic. PenguinBooks, 1955.
[240] Robert Plutchik. The nature of emotions human emotions have deep evolu-tionary roots, a fact that may explain their complexity and provide tools forclinical practice. American Scientist, 89(4):344–350, 2001.
[241] Thomas S Polzin and Alex Waibel. Detecting emotions in speech. In Pro-ceedings of the CMC, volume 16. Citeseer, 1998.
[242] Francisco Pons, Paul L Harris, and Marc de Rosnay. Emotion comprehensionbetween 3 and 11 years: Developmental periods and hierarchical organiza-tion. European journal of developmental psychology, 1(2):127–152, 2004.
[243] Stephen Porter and Leanne Brinke. Reading between the lies identifyingconcealed and falsified emotions in universal facial expressions. PsychologicalScience, 19(5):508–514, 2008.
[244] Gilles Pourtois, Beatrice de Gelder, Anne Bol, and Marc Crommelinck. Per-ception of facial expressions and voices and of their combination in the humanbrain. Cortex, 41(1):49–59, 2005.
[245] Fangtu T Qiu and Rudiger Von Der Heydt. Figure and ground in the visualcortex: V2 combines stereoscopic cues with gestalt rules. Neuron, 47(1):155–166, 2005.
[246] P. Rani and N. Sarkar. Emotion-sensitive robots - a new paradigm for human-robot interaction. In Humanoid Robots, 2004 4th IEEE/RAS InternationalConference on, volume 1, pages 149–167 Vol. 1, Nov 2004.
[247] M. Ranzato, Fu Jie Huang, Y.-L. Boureau, and Y. LeCun. Unsupervisedlearning of invariant feature hierarchies with applications to object recog-nition. In IEEE Conference on Computer Vision and Pattern Recognition(CVPR), pages 1–8, June 2007.
[248] Josef P Rauschecker. Ventral and dorsal streams in the evolution of speechand language. Frontiers in evolutionary neuroscience, 4:7, 2012.
[249] Anne Richards and Isabelle Blanchette. Independent manipulation of emo-tion in an emotional stroop task using classical conditioning. Emotion,4(3):275, 2004.
[250] Jane M Richards and James J Gross. Emotion regulation and memory:the cognitive costs of keeping one’s cool. Journal of personality and socialpsychology, 79(3):410, 2000.
178

Bibliography
[251] Fabien Ringeval, Shahin Amiriparian, Florian Eyben, Klaus Scherer, andBjorn Schuller. Emotion recognition in the wild: Incorporating voice andlip activity in multimodal decision-level fusion. In Proceedings of the 16thInternational Conference on Multimodal Interaction, ICMI ’14, pages 473–480, New York, NY, USA, 2014. ACM.
[252] Anna W Roe, Leonardo Chelazzi, Charles E Connor, Bevil R Conway, IchiroFujita, Jack L Gallant, Haidong Lu, and Wim Vanduffel. Toward a unifiedtheory of visual area v4. Neuron, 74(1):12–29, 2012.
[253] EdmundT Rolls. Emotion explained. Oxford University Press, USA, 2005.
[254] Marcello GP Rosa and Rowan Tweedale. Visual areas in lateral and ven-tral extrastriate cortices of the marmoset monkey. Journal of ComparativeNeurology, 422(4):621–651, 2000.
[255] Ira J Roseman. Cognitive determinants of emotion: A structural theory.Review of personality & social psychology, 1984.
[256] Frank Rosenblatt. The perceptron: a probabilistic model for informationstorage and organization in the brain. Psychological review, 65(6):386, 1958.
[257] Mark Rosenblum, Yaser Yacoob, and Larry S Davis. Human expressionrecognition from motion using a radial basis function network architecture.IEEE transactions on neural networks, 7(5):1121–1138, 1996.
[258] David C Rubin and Jennifer M Talarico. A comparison of dimensional modelsof emotion: Evidence from emotions, prototypical events, autobiographicalmemories, and words. Memory, 17(8):802–808, 2009.
[259] David E Rumelhart, Richard Durbin, Richard Golden, and Yves Chauvin.Backpropagation: The basic theory. Backpropagation: Theory, Architecturesand Applications, pages 1–34, 1995.
[260] James A Russell. A circumplex model of affect. Journal of personality andsocial psychology, 39(6):1161, 1980.
[261] James A Russell. 13-reading emotion from and into faces: resurrecting adimensional-contextual perspective,. The psychology of facial expression,pages 295–320, 1997.
[262] James A Russell. Core affect and the psychological construction of emotion.Psychological review, 110(1):145, 2003.
[263] Abraham Sagi and Martin L Hoffman. Empathic distress in the newborn.Developmental Psychology, 12(2):175, 1976.
179

Bibliography
[264] Tara N. Sainath, Brian Kingsbury, George Saon, Hagen Soltau, Abdel rah-man Mohamed, George Dahl, and Bhuvana Ramabhadran. Deep convolu-tional neural networks for large-scale speech tasks. Neural Networks, 64:39– 48, 2015. Special Issue on Deep Learning of Representations.
[265] Hide-aki Saito, Masao Yukie, Keiji Tanaka, Kazuo Hikosaka, Yoshiro Fukada,and E Iwai. Integration of direction signals of image motion in the supe-rior temporal sulcus of the macaque monkey. The Journal of Neuroscience,6(1):145–157, 1986.
[266] Eliala Salvadori, Tatiana Blazsekova, Agnes Volein, Zsuzsanna Karap, DenisTatone, Olivier Mascaro, and Gergely Csibra. Probing the strength of infants’preference for helpers over hinderers: two replication attempts of hamlin andwynn (2011). PloS one, 10(11):e0140570, 2015.
[267] Rajib Sarkar and Sanjoy Kumar Saha. Music genre classification using emdand pitch based feature. In Advances in Pattern Recognition (ICAPR), 2015Eighth International Conference on, pages 1–6. IEEE, 2015.
[268] Dorothee Saur, Bjorn W Kreher, Susanne Schnell, Dorothee Kummerer,Philipp Kellmeyer, Magnus-Sebastian Vry, Roza Umarova, MariacristinaMusso, Volkmar Glauche, Stefanie Abel, et al. Ventral and dorsal path-ways for language. Proceedings of the national academy of Sciences,105(46):18035–18040, 2008.
[269] Daniel L Schacter. Searching for Memory: The Brain, Th. Basic Books,2008.
[270] Klaus R Scherer. What are emotions? and how can they be measured?Social science information, 44(4):695–729, 2005.
[271] Stefan Scherer, Mohamed Oubbati, Friedhelm Schwenker, and GuntherPalm. Real-time emotion recognition from speech using echo state networks.In IAPR Workshop on Artificial Neural Networks in Pattern Recognition,pages 205–216. Springer, 2008.
[272] Jan Schluter and Sebastian Bock. Improved musical onset detection withconvolutional neural networks. In Acoustics, Speech and Signal Processing(ICASSP), 2014 IEEE International Conference on, pages 6979–6983. IEEE,2014.
[273] Allan N Schore. Affect regulation and the origin of the self: The neurobiologyof emotional development. Routledge, 2015.
[274] Nicu Sebe, Ira Cohen, Thomas S Huang, et al. Multimodal emotion recog-nition. Handbook of Pattern Recognition and Computer Vision, 4:387–419,2005.
180

Bibliography
[275] Charles R Seger, Eliot R Smith, Zoe Kinias, and Diane M Mackie. Knowinghow they feel: Perceiving emotions felt by outgroups. Journal of Experimen-tal Social Psychology, 45(1):80–89, 2009.
[276] Daniel Senkowski, Till R Schneider, John J Foxe, and Andreas K Engel.Crossmodal binding through neural coherence: implications for multisensoryprocessing. Trends in neurosciences, 31(8):401–409, 2008.
[277] Siddharth Sigtia and Sam Dixon. Improved music feature learning with deepneural networks. In Acoustics, Speech and Signal Processing (ICASSP), 2014IEEE International Conference on, pages 6959–6963. IEEE, 2014.
[278] Adam M Sillito, Javier Cudeiro, and Helen E Jones. Always returning:feedback and sensory processing in visual cortex and thalamus. Trends inneurosciences, 29(6):307–316, 2006.
[279] Patrice Y Simard, David Steinkraus, and John C Platt. Best practices forconvolutional neural networks applied to visual document analysis. In IC-DAR, volume 3, pages 958–962, 2003.
[280] Craig A Smith and Phoebe C Ellsworth. Patterns of cognitive appraisal inemotion. Journal of personality and social psychology, 48(4):813, 1985.
[281] Craig A Smith and Richard S Lazarus. Emotion and adaptation. GuilfordPress, 1990.
[282] Larry R Squire. Memory and brain. 1987.
[283] Bo Sun, Liandong Li, Guoyan Zhou, and Jun He. Facial expression recogni-tion in the wild based on multimodal texture features. Journal of ElectronicImaging, 25(6):061407–061407, 2016.
[284] Raquel Tato, Rocio Santos, Ralf Kompe, and Jose M Pardo. Emotional spaceimproves emotion recognition. In INTERSPEECH, 2002.
[285] Don M Tucker, Douglas Derryberry, Phan Luu, and KL Phan. Anatomy andphysiology of human emotion: Vertical integration of brainstem, limbic, andcortical systems. The neuropsychology of emotion, pages 56–79, 2000.
[286] George Tzanetakis and Perry Cook. Musical genre classification of audiosignals. Speech and Audio Processing, IEEE transactions on, 10(5):293–302,2002.
[287] Alfred Ultsch. U*-matrix: a tool to visualize clusters in high dimensionaldata. Technical Report 10, Universtiy of Marburg, 2003.
[288] Mauro Ursino, Cristiano Cuppini, and Elisa Magosso. Neurocomputationalapproaches to modelling multisensory integration in the brain: A review.Neural Networks, 60:141 – 165, 2014.
181

Bibliography
[289] Diana Roupas Van Lancker and Gerald J Canter. Impairment of voice andface recognition in patients with hemispheric damage. Brain and cognition,1(2):185–195, 1982.
[290] S. Velusamy, H. Kannan, B. Anand, A. Sharma, and B. Navathe. A methodto infer emotions from facial action units. In 2011 IEEE International Con-ference on Acoustics, Speech and Signal Processing (ICASSP), pages 2028–2031, May 2011.
[291] Paul Viola and MichaelJ. Jones. Robust real-time face detection. Interna-tional Journal of Computer Vision, 57(2):137–154, 2004.
[292] Barbara Von Eckardt. What is cognitive science? MIT press, 1995.
[293] Patrik Vuilleumier. How brains beware: neural mechanisms of emotionalattention. Trends in Cognitive Sciences, 9(12):585–594, 2005.
[294] Patrik Vuilleumier and Yang-Ming Huang. Emotional attention uncover-ing the mechanisms of affective biases in perception. Current Directions inPsychological Science, 18(3):148–152, 2009.
[295] Patrik Vuilleumier and Sophie Schwartz. Emotional facial expressions cap-ture attention. Neurology, 56(2):153–158, 2001.
[296] Li Wang, Ting Liu, Gang Wang, Kap Luk Chan, and Qingxiong Yang. Videotracking using learned hierarchical features. Image Processing, IEEE Trans-actions on, 24(4):1424–1435, April 2015.
[297] Yi-Qing Wang. An Analysis of the Viola-Jones Face Detection Algorithm.Image Processing On Line, 4:128–148, 2014.
[298] Felix Warneken and Michael Tomasello. Varieties of altruism in children andchimpanzees. Trends in cognitive sciences, 13(9):397–402, 2009.
[299] Philip CWatkins, Karen Vache, Steven P Verney, and Andrew Mathews. Un-conscious mood-congruent memory bias in depression. Journal of AbnormalPsychology, 105(1):34, 1996.
[300] Jeremy M Wolfe and Todd S Horowitz. What attributes guide the deploy-ment of visual attention and how do they do it? Nature reviews neuroscience,5(6):495–501, 2004.
[301] Sherif M Yacoub, Steven J Simske, Xiaofan Lin, and John Burns. Recognitionof emotions in interactive voice response systems. In INTERSPEECH, 2003.
[302] Anbang Yao, Junchao Shao, Ningning Ma, and Yurong Chen. Capturingau-aware facial features and their latent relations for emotion recognition inthe wild. In Proceedings of the 2015 ACM on International Conference onMultimodal Interaction, pages 451–458. ACM, 2015.
182

Bibliography
[303] Masaki Yuki, William W Maddux, and Takahiko Masuda. Are the windowsto the soul the same in the east and west? cultural differences in using theeyes and mouth as cues to recognize emotions in japan and the united states.Journal of Experimental Social Psychology, 43(2):303–311, 2007.
[304] Jonathan R Zadra and Gerald L Clore. Emotion and perception: The roleof affective information. Wiley interdisciplinary reviews: cognitive science,2(6):676–685, 2011.
[305] Leslie A Zebrowitz. Social perception. Thomson Brooks/Cole Publishing Co,1990.
[306] Matthew D Zeiler and Rob Fergus. Visualizing and understanding convolu-tional networks. In Computer vision–ECCV 2014, pages 818–833. Springer,2014.
[307] Zhihong Zeng, Maja Pantic, Glenn I Roisman, and Thomas S Huang. Asurvey of affect recognition methods: Audio, visual, and spontaneous ex-pressions. IEEE transactions on pattern analysis and machine intelligence,31(1):39–58, 2009.
183

Bibliography
184

Declaration of Oath
Eidesstattliche Versicherung
I hereby declare, on oath, that I have written the present dissertation by my ownand have not used other than the acknowledged resources and aids.
Hiermit erklare ich an Eides statt, dass ich die vorliegende Dissertationsschriftselbst verfasst und keine anderen als die angegebenen Quellen und Hilfsmittel be-nutzt habe.
Hamburg, Tuesday 23rd August 2016 Pablo Vinicius Alves de BarrosCity and Date SignatureOrt und Datum Unterschrift
185
