modeled future peak streamflows in four coastal maine … · modeled future peak streamflows in...
TRANSCRIPT
Prepared in cooperation with the Maine Department of Transportation
Modeled Future Peak Streamflows in Four Coastal Maine Rivers
Scientific Investigations Report 2013–5080
U.S. Department of the InteriorU.S. Geological Survey

Cover. Photograph of Ducktrap River near Lincolnville, coastal Maine, April 4, 2009.

Modeled Future Peak Streamflows in Four Coastal Maine Rivers
By Glenn A. Hodgkins and Robert W. Dudley
Prepared in cooperation with the Maine Department of Transportation
Scientific Investigations Report 2013–5080
U.S. Department of the InteriorU.S. Geological Survey

U.S. Department of the InteriorSALLY JEWELL, Secretary
U.S. Geological SurveySuzette M. Kimball, Acting Director
U.S. Geological Survey, Reston, Virginia: 2013
For more information on the USGS—the Federal source for science about the Earth, its natural and living resources, natural hazards, and the environment, visit http://www.usgs.gov or call 1–888–ASK–USGS.
For an overview of USGS information products, including maps, imagery, and publications, visit http://www.usgs.gov/pubprod
To order this and other USGS information products, visit http://store.usgs.gov
Any use of trade, firm, or product names is for descriptive purposes only and does not imply endorsement by the U.S. Government.
Although this information product, for the most part, is in the public domain, it also may contain copyrighted materials as noted in the text. Permission to reproduce copyrighted items must be secured from the copyright owner.
Suggested citation:Hodgkins, G.A., and Dudley, R.W., 2013, Modeled future peak streamflows in four coastal Maine rivers: U.S. Geological Survey Scientific Investigations Report 2013–5080, 18 p., http://pubs.usgs.gov/sir/2013/5080/.

iii
Contents
Abstract ...........................................................................................................................................................1Introduction.....................................................................................................................................................2
Observed Peak Flows in Maine and New England .........................................................................2Observed Flood Frequency Changes in Maine ................................................................................2Projected Future Climate and High Streamflows in the Northeastern United States ...............3
Description of the Study River Basins ........................................................................................................3Physiography, Land Cover and Use, and Surficial Geology ...........................................................6Climate ....................................................................................................................................................6Streamflow .............................................................................................................................................6
Methods...........................................................................................................................................................7Basin Rainfall-Runoff Models .............................................................................................................7Flood Frequency Analyses ..................................................................................................................9Computing Magnitude of Changes ..................................................................................................10
Historical Modeled Peak Flows Compared to Observed Values .........................................................10Historical Modeled Flood Frequency Compared to Observed Values ................................................10Changes in Peak Flows on the Basis of Changes in Air Temperature and Precipitation ................11Changes in Flood Frequency on the Basis of Changes in Air Temperature and Precipitation .......12Causes of Modeled Changes in Peak Flows and Flood Frequency .....................................................13Summary and Conclusions .........................................................................................................................15References Cited..........................................................................................................................................16
Figures 1. Map showing location of rivers selected for study in coastal Maine .................................4 2. Map showing the Pleasant and Narraguagus River Basins in the Eastern Coastal
Climate-Response Region, and the Sheepscot and Royal River Basins in the Southern Coastal Climate-Response Region, Maine ..............................................................5
3. Graph showing historical median monthly streamflows for the four study basins in coastal Maine ................................................................................................................................7
4. Schematic diagram of the operational design of the Precipitation-Runoff Modeling System (PRMS) .............................................................................................................................8
Tables 1. Historical modeled annual daily maximum peak flows compared to historical
annual daily maximum peak flows. .........................................................................................10 2. Differences between historical modeled peak flows with 50-percent and 1-percent
annual exceedance probabilities (AEPs) and observed peak flows with 50-percent and 1-percent AEPs ....................................................................................................................11
3. Annual daily maximum peak-flow changes based on changes in precipitation and air temperature ...........................................................................................................................12
4. Fifty-percent annual exceedance probability peak-flow changes based on changes in precipitation and air temperature ........................................................................................13

iv
5. One-percent annual exceedance probability peak-flow changes based on changes in precipitation and air temperature ........................................................................................14
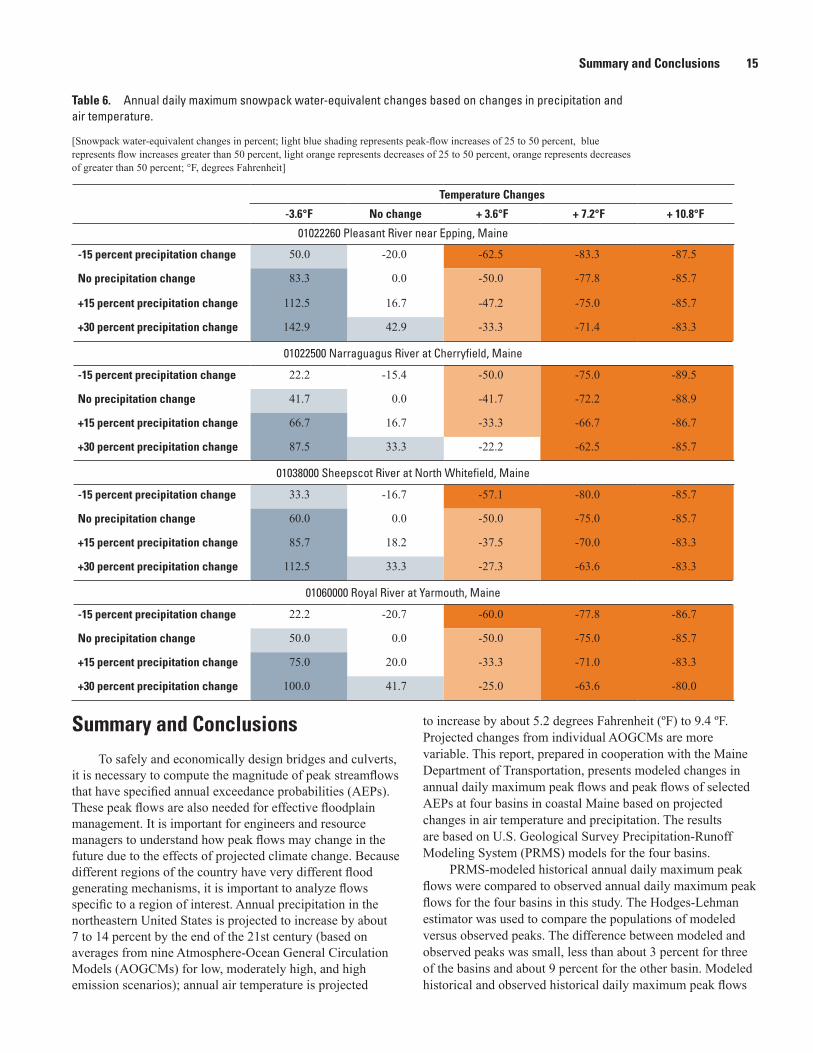
6. Annual daily maximum snowpack water-equivalent changes based on changes in precipitation and air temperature ............................................................................................15
Multiply By To obtainLength
inch (in) 2.54 centimeter (cm)inch (in) 25.4 millimeter (mm)foot (ft) 0.3048 meter (m)mile (mi) 1.609 kilometer (km)
Areasquare mile (mi2) 259.0 hectare (ha)square mile (mi2) 2.590 square kilometer (km2)
Flow ratecubic foot per second (ft3/s) 0.02832 cubic meter per second (m3/s)
Conversion Factors and Datum
Temperature in degrees Celsius (°C) may be converted to degrees Fahrenheit (°F) as follows:
°F=(1.8×°C)+32
Temperature in degrees Fahrenheit (°F) may be converted to degrees Celsius (°C) as follows:
°C=(°F-32)/1.8
Vertical coordinate information is referenced to the North American Vertical Datum of 1988 (NAVD 88).
Horizontal coordinate information is referenced to the North American Datum of 1983 (NAD 83).
Altitude, as used in this report, refers to distance above the vertical datum.
AbbreviationsAEP Annual exceedance probability
AOGCM Atmosphere-ocean general circulation model
MaineDOT Maine Department of Transportation
PRMS Precipitation-Runoff Modeling System
USGS U.S. Geological Survey

Modeled Future Peak Streamflows in Four Coastal Maine Rivers
By Glenn A. Hodgkins and Robert W. Dudley
AbstractTo safely and economically design bridges and culverts,
it is necessary to compute the magnitude of peak streamflows that have specified annual exceedance probabilities (AEPs). Annual precipitation and air temperature in the northeastern United States are, in general, projected to increase during the 21st century. It is therefore important for engineers and resource managers to understand how peak flows may change in the future. This report, prepared in cooperation with the Maine Department of Transportation (MaineDOT), presents modeled changes in peak flows at four basins in coastal Maine on the basis of projected changes in air temperature and precipitation.
To estimate future peak streamflows at the four basins in this study, historical values for climate (temperature and precipitation) in the basins were adjusted by different amounts and input to a hydrologic model of each study basin. To encompass the projected changes in climate in coastal Maine by the end of the 21st century, air temperatures were adjusted by four different amounts, from -3.6 degrees Fahrenheit (ºF) (-2 degrees Celsius (ºC)) to +10.8 ºF (+6 ºC) of observed temperatures. Precipitation was adjusted by three different percentage values from -15 percent to +30 percent of observed precipitation. The resulting 20 combinations of temperature and precipitation changes (includes the no-change scenarios) were input to Precipitation-Runoff Modeling System (PRMS) watershed models, and annual daily maximum peak flows were calculated for each combination. Modeled peak flows from the adjusted changes in temperature and precipitation were compared to unadjusted (historical) modeled peak flows.
Annual daily maximum peak flows increase or decrease, depending on whether temperature or precipitation is adjusted; increases in air temperature (with no change in precipitation) lead to decreases in peak flows, whereas increases in precipitation (with no change in temperature) lead to increases in peak flows. As the magnitude of air temperatures increase in the four basins, peak flows decrease by larger amounts. If precipitation is held constant (no change from historical values), 17 to 26 percent decreases in peak flow occur at
the four basins when temperature is increased by 7.2°F. If temperature is held constant, 26 to 38 percent increases in peak flow result from a 15-percent increase in precipitation. The largest decreases in peak flows at the four basins result from 15-percent decreases in precipitation combined with temperature increases of 10.8°F. The largest increases in peak flows generally result from 30-percent increases in precipitation combined with 3.6 °F decreases in temperatures.
In many cases when temperature and precipitation both increase, small increases or decreases in annual daily maximum peak flows result. For likely changes projected for the northeastern United States for the middle of the 21st century (temperature increase of 3.6 °F and precipitation increases of 0 to 15 percent), peak-flow changes at the four coastal Maine basins in this study are modeled to be evenly distributed between increases and decreases of less than 25 percent.
Peak flows with 50-percent and 1-percent AEPs (equivalent to 2-year and 100-year recurrence interval peak flows, respectively) were calculated for the four basins in the study using the PRMS-modeled annual daily maximum peak flows. Modeled peak flows with 50-percent and 1-percent AEPs with adjusted temperatures and precipitation were compared to unadjusted (historical) modeled values. Changes in peak flows with 50-percent AEPs are similar to changes in annual daily maximum peak flow; changes in peak flows with 1-percent AEPs are similar in pattern to changes in annual daily maximum peak flow, but some of the changes associated with increasing precipitation are much larger than changes in annual daily maximum peak flow.
Substantial decreases in maximum annual winter snowpack water equivalent are modeled to occur with increasing air temperatures at the four basins in the study. (Snowpack is the snow on the ground that accumulates during a winter, and water equivalent is the amount of water in a snowpack if it were melted.) The decrease in modeled peak flows with increasing air temperature, given no change in precipitation amount, is likely caused by these decreases in winter snowpack and resulting decreases in snowmelt runoff.

2 Modeled Future Peak Streamflows in Four Coastal Maine Rivers
IntroductionTo safely and economically design bridges and culverts,
it is necessary to compute the magnitude of peak streamflows that have specified annual exceedance probabilities (AEPs)—the chance that peak flows will be equal to or greater than a specified peak flow in any given year. These peak flows are also needed by Federal, State, regional, and local officials for effective floodplain management. Past designs of bridges and culverts in Maine and elsewhere are predicated on the concept of stationarity (the concept that over long periods of time, the magnitude and frequency of peak streamflows do not change). The assumption of peak-flow stationarity has long been compromised by direct human watershed changes such as reservoir regulation and land-use change (Milly and others, 2008). Stationarity related to climatic changes was questioned a few decades ago (Dooge, 1986) but recently has received much attention because of the potential effects of Earth’s changing climate on regional temperature and precipitation regimes and resulting influences on peak flows (Milly and others, 2008). It is therefore important for engineers and resource managers to understand how peak flows may change in the future. Because different regions of the country have different flood-generating mechanisms, it is important to analyze flows specific to a region of interest.
Flood-frequency analyses use statistical methods to compute peak streamflows for selected AEPs. In past flood reports, flood frequencies were expressed as “recurrence intervals” such as the “100-year flood.” The use of recurrence-interval terminology is now discouraged by the U.S. Geological Survey (USGS) because it sometimes causes confusion for the general public; it is sometimes interpreted as implying that there is a set time interval between floods of a particular magnitude, when in fact floods are random processes that are best understood using probabilistic terms. The AEP is the probability that a flood of specific magnitude will occur in a given year and is equivalent to the reciprocal of the recurrence interval. For example, a flood with an annual exceedance probability of 1 percent corresponds to a 100-year flood.
Hodgkins (2010), in a USGS report in cooperation with the Maine Department of Transportation (MaineDOT), analyzed historical peak-flow changes in Maine and their implications for flood frequency analyses. Results of this work are described in the following sections. The current report, also in cooperation with MaineDOT, presents estimated future changes in annual daily maximum peak flows and peak flows with 50-percent and 1-percent AEPs at four basins in coastal Maine on the basis of projected future changes in air temperature and precipitation. The results are derived from USGS Precipitation-Runoff Modeling System (PRMS) model output for the four basins, combined with flood frequency analyses. The results will help MaineDOT and others consider changes in flood magnitudes that may occur in the future and could inform the hydraulic sizing of bridges
and culverts. The results will also help those responsible for flood-plain management.
Observed Peak Flows in Maine and New England
Studies have documented changes in several components of the water cycle, including streamflows, in Maine and New England during the last 30 to 40 years (summarized in Hodgkins and others, 2009). Winter-spring streamflows, which usually include a combination of snowmelt runoff and rain and are typically the highest flows of the year, became significantly (p < 0.1) earlier in northern and mountainous sections of Maine during the 20th century, with most of the 1- to 2-week change occurring in the last 30 years (Dudley and Hodgkins, 2002; Hodgkins and others, 2003; Hodgkins and Dudley, 2006). Annual peak flows have increased significantly at about one-third of streamgages in Maine during the last 50 to 100 years (Hodgkins and Dudley, 2005; Collins, 2009); no streamgages recorded significantly decreasing peak flows. The number of more frequently occurring peak flows have increased in Maine (Armstrong and others, 2011), and summer stormflow magnitudes have increased at many rivers (Hodgkins and Dudley, 2011). Historical peak-flow changes may have occurred as a step change around 1970 (Collins, 2009; Armstrong and others, 2011), as has been observed at streamgages in Maine for changes in the timing of winter-spring streamflows (Hodgkins and Dudley, 2006). The median change in annual peak streamflows for 20 unregulated Maine streamgages (average of 74 years of data through 2006) was an increase of 18.4 percent assuming a linear change over time and 15.0 percent assuming a step change around 1970 (Hodgkins, 2010).
Observed Flood Frequency Changes in Maine
In a previous study, Hodgkins (2010) computed peak flows with 1-percent and 20-percent annual exceedance probabilities (AEPs) for 28 streamgages in Maine using the full annual peak-flow record for each streamgage and multiple sub-periods of that record. Peak-flow magnitudes computed from sub-periods were then compared to those computed from the full period. The 1967–96 sub-period generated the highest 1-percent and 20-percent AEP peak flows overall when compared to peak flows based on the full period of record; the median difference for 28 streamgages was 8 percent for both 1-percent and 20-percent AEP peak flows. The 1977–2006 and 1971–2006 sub-periods also generated AEP peak-flow magnitudes higher than AEP peak flows based on the full period of record but not as high as those for the AEP peak flows based on the 1967–96 sub-period. Overall, differences based on 20 unregulated streamgages were similar to differences using the data for all 28 streamgages (8 of which had substantial reservoir regulation in their basins).
Description of the Study River Basins 3
Projected Future Climate and High Streamflows in the Northeastern United States
Annual precipitation in the northeastern United States is projected to increase by about 5 to 8 percent by the middle of the 21st century (averages from nine Atmosphere-Ocean General Circulation Models (AOGCMs) for the B1, A2, and A1FI emission scenarios) and increase by about 7 to 14 percent by the end of the 21st century (Hayhoe and others, 2007). These three emissions scenarios represent low, moderately high, and high global greenhouse gas emissions, respectively, over the 21st century (Lettenmaier and others, 2008). Projections from individual AOGCMs and scenarios show no change in annual precipitation to increases of about 14 percent by mid-century, and they show decreases of approximately 9 percent to increases of 18 percent near the end of the 21st century. Future winter precipitation is projected to increase by 6 to 16 percent by mid-century (AOGCM averages for the three emissions scenarios), and it is projected to increase by 12 to 30 percent near the end of the century. Summer precipitation is not projected to change much during the 21st century on the basis of average results from the AOGCMs.
Annual air temperature in the northeastern United States is projected to increase by about 3.8 to 5.2 degrees Fahrenheit (ºF) by the middle of the 21st century (average of nine AOGCMs for the B1, A2, and A1FI scenarios) and increase by approximately 5.2 to 9.4 ºF by the end of the 21st century (Hayhoe and others, 2007). Individual AOGCMs show increases of about 0.7 to 6.7 ºF by mid-century and increases of approximately 1.6 to 12.4 ºF near the end of the 21st century. Future winter temperatures are projected to increase by about 2.0 to 5.6 ºF by mid-century (average of nine AOGCMs for the B1, A2, and A1FI scenarios) and increase by approximately 3.1 to 9.7 ºF near the end of the 21st century. Future summer temperatures are projected to increase by about 3.1 to 5.6 ºF by mid-century and to increase by approximately 4.3 to 10.6 ºF near the end of the 21st century.
Hayhoe and others (2007) used climate projections as input to the variable infiltration capacity (VIC) hydrologic model to project future high flows in the northeastern United States. On the basis of this modeling, spring streamflow timing is projected to shift earlier during the next 90 years, and high streamflows (50 to 95th percentile annual flows) are projected to increase.
Increased precipitation intensity and variability are projected to increase flood risks in many areas of the world during the 21st century (Bates and others, 2008). However, increased air temperatures have been shown to lead to decreased flooding in some areas because of the reduction of water storage in winter snowpack and resulting decreased snowmelt runoff (Arora and Boer, 2001; Voss and others, 2002; Hamlet and Lettenmaier, 2007). Winter snowpack is the snow on the ground that accumulates during winter. Loss of winter snowpack can also increase flood risks in areas with mixed winter runoff from snowmelt and rain (Hamlet
and Lettenmaier, 2007; Tohver and Hamlet, 2010); in these areas, the watershed contributing to floods can be enlarged with warmer air temperatures from elevational shifts in the snow line.
Description of the Study River BasinsThe basins of the four coastal Maine rivers in this
study—the Pleasant, Narragaugus, Sheepscot, and Royal Rivers—have minimal or no regulation of streamflows and continuous streamgage data for 19 to 70 years. The study basins (figs. 1, 2) are in different “climate-response” regions, as defined by the framework for a USGS hydrologic climate-response network in Maine (Hodgkins and others, 2009), and are therefore considered representative of the geographic and climatic variability of coastal Maine. The Pleasant and Narraguagus River Basins are in the eastern coastal climate-response region, and the Sheepscot and Royal River Basins are in the southern coastal climate-response region.
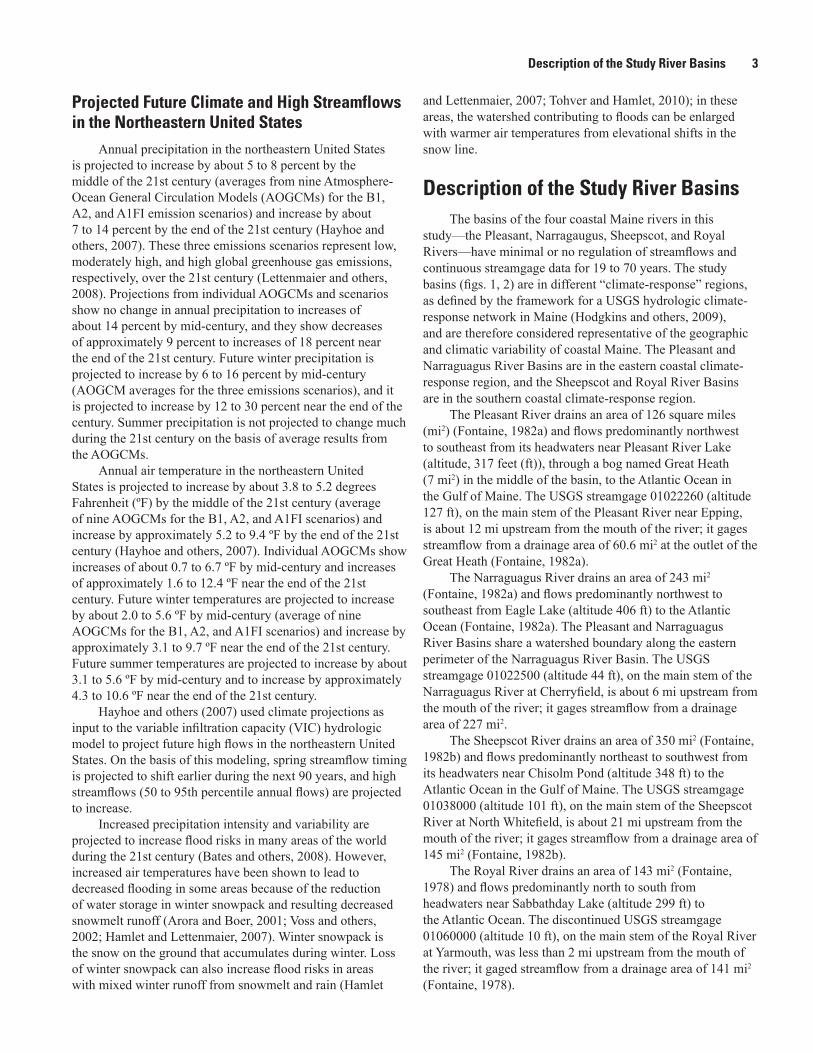
The Pleasant River drains an area of 126 square miles (mi2) (Fontaine, 1982a) and flows predominantly northwest to southeast from its headwaters near Pleasant River Lake (altitude, 317 feet (ft)), through a bog named Great Heath (7 mi2) in the middle of the basin, to the Atlantic Ocean in the Gulf of Maine. The USGS streamgage 01022260 (altitude 127 ft), on the main stem of the Pleasant River near Epping, is about 12 mi upstream from the mouth of the river; it gages streamflow from a drainage area of 60.6 mi2 at the outlet of the Great Heath (Fontaine, 1982a).
The Narraguagus River drains an area of 243 mi2 (Fontaine, 1982a) and flows predominantly northwest to southeast from Eagle Lake (altitude 406 ft) to the Atlantic Ocean (Fontaine, 1982a). The Pleasant and Narraguagus River Basins share a watershed boundary along the eastern perimeter of the Narraguagus River Basin. The USGS streamgage 01022500 (altitude 44 ft), on the main stem of the Narraguagus River at Cherryfield, is about 6 mi upstream from the mouth of the river; it gages streamflow from a drainage area of 227 mi2.
The Sheepscot River drains an area of 350 mi2 (Fontaine, 1982b) and flows predominantly northeast to southwest from its headwaters near Chisolm Pond (altitude 348 ft) to the Atlantic Ocean in the Gulf of Maine. The USGS streamgage 01038000 (altitude 101 ft), on the main stem of the Sheepscot River at North Whitefield, is about 21 mi upstream from the mouth of the river; it gages streamflow from a drainage area of 145 mi2 (Fontaine, 1982b).
The Royal River drains an area of 143 mi2 (Fontaine, 1978) and flows predominantly north to south from headwaters near Sabbathday Lake (altitude 299 ft) to the Atlantic Ocean. The discontinued USGS streamgage 01060000 (altitude 10 ft), on the main stem of the Royal River at Yarmouth, was less than 2 mi upstream from the mouth of the river; it gaged streamflow from a drainage area of 141 mi2 (Fontaine, 1978).

4 Modeled Future Peak Streamflows in Four Coastal Maine Rivers
SOMERSET PENOBSCOT
OXFORD
FRANKLINWASHINGTON
YORK
PISCATAQUIS
HANCOCK
WALDO
KENNEBEC
CUMBERLAND
KNOXLINCOLNANDROSCOGGIN
AROOSTOOK
SAGADAHOC
Base from U.S. Geological Survey and Maine Office ofGeographic Information Systems digital files,North American Datum of 1983,Universal Transverse Mercator projection, Zone 19Scale: 1:1,500,000
0 20 30 40 MILES10
0 20 30 40 KILOMETERS10
ATLANTIC OCEAN
Gulf of Maine
Shee
psco
t Rive
r
Roy al
River
Plea sant River
Narraguagus River
UNIT
ED STATES
CANADA
STATESCANA
DA
UNITED
45°
44°
68°69°70°
ATLANTIC OCEAN
Gulf of Maine
CANADAU
NIT
ED STATES
NEWBRUNSWICKQUEBEC
NEWHAMPSHIRE
VERMONT
MAINE
NEW
YO
RK
MASSACHUSETTS
LOCATION MAP
Area enlarged
Figure 1. Location of rivers selected for study in coastal Maine.
Description of the Study River Basins 5
45°
44°
68°69°70°
Base from U.S. Geological Survey and Maine Office of Geographic Information Systems digital files,North American Datum of 1983, Universal Transverse Mercator projection, Zone 19Scale 1:1,320,000
0 20 40 MILES10
0 20 30
30
40 KILOMETERS10
01038000
Study basin boundaryClimate-response region boundaryInland post-glacial marine limitU.S. Geological Survey streamgage and numberGeographic location
EXPLANATION
EASTERN COASTALCLIMATE-RESPONSE
REGION
SOUTHERN COASTAL CLIMATE-RESPONSE REGION
INLAND POST-GLACIAL MARINE LIMIT
ATLANTIC OCEAN
Gulf of Maine
Pleasant River Lake
Pleasant River
Eagle Lake
Chisholm Pond
SabbathdayLake
West BranchSheepscot River
Narraguagus R
iver
Shee
pscot
River
Roy a l River
Great Heath
Epping
Cherryfield
North Whitefield
Yarmouth
Shaker Hill
Hogback Mountain
Pleasant MountainLead
Mountain
01060000
01038000
01022500
01022260
CANADA UNITED STATES CANADA
Figure 2. The Pleasant and Narraguagus River Basins in the Eastern Coastal Climate-Response Region, and the Sheepscot and Royal River Basins in the Southern Coastal Climate-Response Region, Maine.

6 Modeled Future Peak Streamflows in Four Coastal Maine Rivers
Physiography, Land Cover and Use, and Surficial Geology
Rolling topography with little development characterizes the four gaged river basins modeled in this study. The peak altitudes in the hilly topography of the basins range from about 610 ft in the Royal River Basin and 1,100 ft in the Sheepscot River Basin to about 1,450 ft along the basin boundaries of the Pleasant and Narraguagus Rivers. Land-cover data for Maine derived from imagery from Landsat Thematic Mappers 5 and 7 during 1999–2001 (U.S. Geological Survey, 2005) indicate that all four basins are rural and predominantly forested with deciduous, evergreen, and mixed-forest types or vegetated with scrub. Other prominent classifications of land cover include forested wetlands, open water (lakes and ponds), pastures, and hay fields in the Sheepscot and the Royal River Basins, and blueberry barrens in the Narraguagus and the Pleasant River Basins. Otherwise, all study basins have scattered areas of cultivated land, light and heavy forest cuts, regenerating forest, and light residential development and road networks.
The largest change in land use that has occurred in these basins is the regeneration of forest in formerly clear-cut or agricultural lands. Since around 1880, when the maximum clearing of farmland and the harvesting of forests in Maine occurred, the area of statewide forest cover has risen from about 70 to 90 percent (Irland, 1998). Irland estimated that, as of 1995, about 90 percent of eastern coastal Maine was forested and that about 70 to 80 percent of southern coastal Maine was forested. About 22 percent of the forest land in Maine is secondary forest on lands that were formerly farmed or pastured (Irland, 1998). Between 1880 and 1995, forest cover is estimated to have increased 18 to 22 percent in eastern coastal Maine and increased 100 to 186 percent in southern coastal Maine (Irland, 1998). Although a large amount of growth in forest cover has taken place since 1880, estimates of statewide forest cover have been stable for the last several decades (U.S. Department of Agriculture, 2005).
The study basins lie in a region of broad lowlands that the ocean inundated approximately 12,500 to 14,000 years ago as glacial ice retreated (Randall, 2000; Hunter and Smith, 2001). The inland limit of marine inundation (fig. 2) has been determined on the basis of marine-limit altitude data and the distribution of glaciomarine sediments (Thompson and Borns, 1985; Thompson and others, 1983). As a consequence of glacial retreat and marine inundation, most surficial geologic materials in the basins are compact glacial sediment (till); the remainder of the materials are silt, clay, sand, and peat, with sand and gravel ridges deposited by glacial meltwater streams (Thompson and Borns, 1985).
Climate
The climate of coastal Maine is temperate, with mild summers and cold winters. The mean annual air temperature
in eastern coastal Maine during 1971–2000 ranged from 42.8 to 45.2 °F with mean monthly air temperatures ranging from 18.2 °F in January to 68.2 °F in July (National Oceanic and Atmospheric Administration, 2002). The mean annual air temperature in southern coastal Maine during the same 30-year period ranged from 44.1 to 45.7 °F with mean monthly air temperatures ranging from 18.3 °F in January to 68.7 °F in July (National Oceanic and Atmospheric Administration, 2002).
Precipitation is fairly evenly distributed during the year throughout coastal Maine. Annual mean precipitation in eastern coastal Maine during 1971–2000 ranged from 47.6 to 51.3 inches (in.); annual mean precipitation in southern coastal Maine ranged from 44.7 to 48.0 in. (National Oceanic and Atmospheric Administration, 2002). Mean annual evapotranspiration (loss of water to the atmosphere by evaporation from the soil and transpiration from plants) from 1951 through 1980 ranged from about 18 in. in eastern coastal Maine to 19 in. in southern coastal Maine (Randall, 1996).
Streamflow
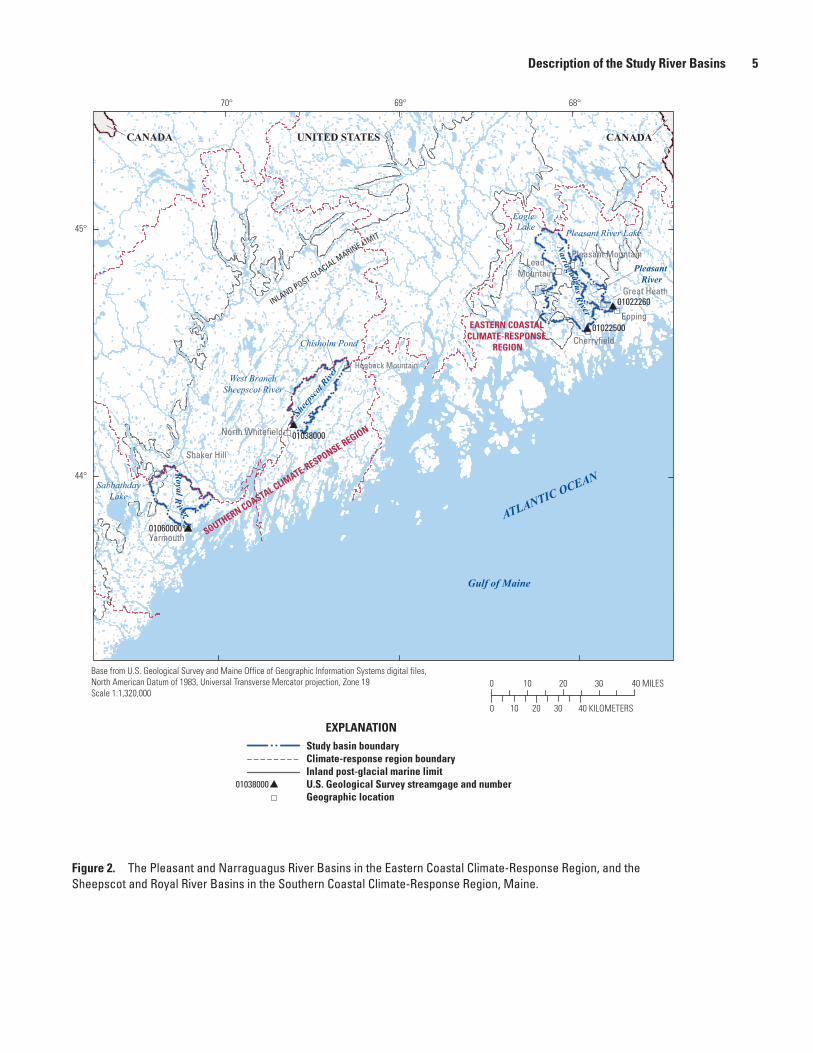
Flow in rivers in coastal Maine is maintained by a combination of groundwater inflow and surface runoff. The proportions of each parameter depend on seasonal weather conditions, surficial geology, and land cover. Median monthly streamflows in the four study basins, recorded at the four USGS streamgages in this study, show a seasonal variation that is common in Maine (fig. 3). The largest streamflows in coastal Maine typically occur in the spring (March, April, and May), when rain falls on dense (ripe) snowpack or on saturated soils. Streamflow then recedes as snowmelt ends and evapotranspiration increases (drying soils and allowing more water storage of rainfall). The recession of streamflow typically persists into late summer and early autumn (August and September) because of high evapotranspiration. Streamflow in late summer is often dominated by groundwater discharge or natural storage release (for streams without major usable reservoir storage) from lakes and wetlands and is frequently augmented by runoff from rainfall events. As evapotranspiration decreases in the autumn (October and November), precipitation generally leads to increased soil water (decreasing storage of additional autumn rainfall) and streamflow increases. Repeated rainfall events and tropical systems that contribute large amounts of precipitation can result in high streamflow during the autumn. High flows can occur in the winter (December, January, and February) with winter rainfall and snowmelt runoff; low streamflow can occur during the winter if cold temperatures result in snow and ice covered rivers for extended periods of time.
Annual peak flows in coastal Maine occur predominantly in the spring. Based on the long period of recorded streamflows at the Narragaugus River in eastern coastal Maine and the Sheepscot River in southern coastal Maine, approximately 65 percent of annual peak flows occur in the
Methods 7
Jan. Feb. March April May June July Aug. Sept. Oct. Nov. Dec.
Month (for periods of observed record specified for each stramgage in table 1)
EXPLANATION
0
0.5
1.0
1.5
2.0
2.5
3.0
3.5
4.0
4.5
5.0
01022260010225000103800001060000
Stre
amflo
w, i
n cu
bic
feet
per
sec
ond
per s
quar
e m
ile o
f dra
inag
e ar
ea
Figure 3. Historical median monthly streamflows for the four study basins in coastal Maine (Dudley and Nielsen, 2011).
spring (March through May). About 25 percent of peaks occur in the winter (December through February), about 10 percent occur in the fall (September through November), and no peaks occur in the summer (June through August).
Methods
Basin Rainfall-Runoff Models
Dudley and Nielsen (2011) describe the USGS Precipitation-Runoff Modeling System (PRMS) models used for each of the coastal basins in the current study. They describe the input data, methods of characterizing the basins and modeling the various hydrologic components in the models, and the calibration and validation of the models. PRMS (Leavesley and others, 2005; Leavesley and others, 1983) is well-suited for modeling runoff from rural basins and has been applied to many basins in the United States (Dudley and Nielsen, 2011). PRMS is a deterministic, distributed-parameter modeling system (Dudley and Nielsen, 2011). The model is deterministic in that it computationally incorporates multiple components of the hydrologic cycle as understood through known physical laws or empirical relations in
hydrologic science. The modeled hydrologic relations are typically governed by quantifiable physical characteristics of the basin. Parameters describing these characteristics are assigned in a distributed fashion, representing the spatial variation (heterogeneity) in the characteristics of the basin. In this manner, the deterministic, distributed-parameter model can simulate the hydrologic system as explicitly as possible.
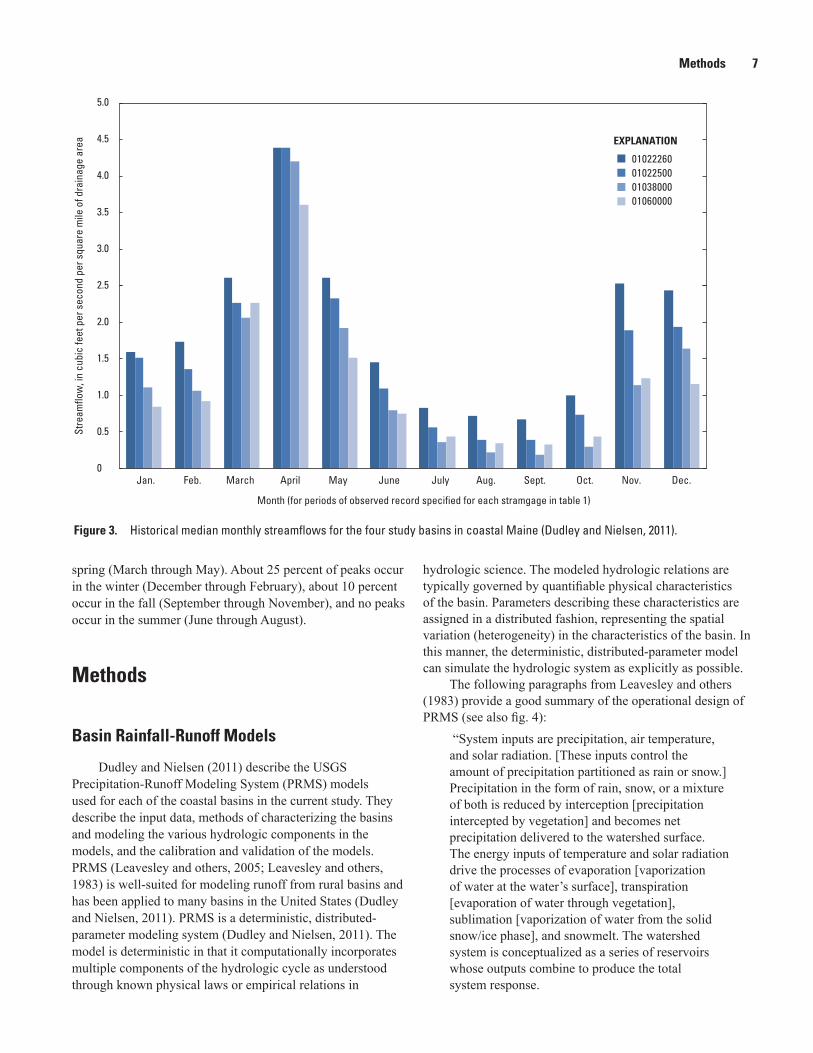
The following paragraphs from Leavesley and others (1983) provide a good summary of the operational design of PRMS (see also fig. 4):
“System inputs are precipitation, air temperature, and solar radiation. [These inputs control the amount of precipitation partitioned as rain or snow.] Precipitation in the form of rain, snow, or a mixture of both is reduced by interception [precipitation intercepted by vegetation] and becomes net precipitation delivered to the watershed surface. The energy inputs of temperature and solar radiation drive the processes of evaporation [vaporization of water at the water’s surface], transpiration [evaporation of water through vegetation], sublimation [vaporization of water from the solid snow/ice phase], and snowmelt. The watershed system is conceptualized as a series of reservoirs whose outputs combine to produce the total system response.

8 Modeled Future Peak Streamflows in Four Coastal Maine Rivers
INPUTS
Air temperature Precipitation Solar radiation
Evaporation
Evaporation
Sublimation
Sublimation
Transpiration
Transpiration
Interception
Snowpack
Snowmelt
Evap
otra
nspi
ratio
n
Grou
ndw
ater
rech
arge
recharge
StreamflowGroundwater flow
Surface runoff
SurfaceImpervious zonereservoir
Groundwater reservoir
Recharge zone
Lower zone
Evap
orat
ion
Subsurface
Subsurface
reservoir
Soil zone excess
Throughfall
runoff
Groundwater recharge
Soil zonereservoir
Subsurface runoff
Groun
dwat
ersin
k
Figure 4. Schematic diagram of the operational design of the Precipitation-Runoff Modeling System (PRMS). Dudley and Nielsen (2011), modified from Leavesley and others (1983, fig. 2).

Methods 9
The impervious-zone reservoir represents an area with no infiltration capacity. The reservoir has a maximum retention storage capacity which must be satisfied before surface runoff will occur. Retention storage is depleted by evaporation when the area is snow free.
The soil-zone reservoir represents that part of the soil mantle that can lose water through the processes of evaporation and transpiration. Average rooting depth of the predominant vegetation covering the soil surface defines the depth of this zone. Water storage in the soil zone is increased by infiltration of rainfall and snowmelt and depleted by evapotranspiration. Maximum retention storage occurs at field capacity; minimum storage (assumed to be zero) occurs at wilting point. The soil zone is treated as a two-layered system. The upper layer is termed the recharge zone and is user-defined as to depth and water-storage characteristics. Losses from the recharge zone are assumed to occur from evaporation and transpiration; losses from the lower zone occur only through transpiration.
The computation of infiltration into the soil zone is dependent on whether the input source is rain or snowmelt. All snowmelt is assumed to infiltrate until field capacity is reached. At field capacity, any additional snowmelt is apportioned between infiltration and surface runoff. At field capacity, the soil zone is assumed to have a maximum daily snowmelt infiltration capacity. All snowmelt in excess of this capacity contributes to surface runoff. Infiltration in excess of field capacity first is used to satisfy recharge to the groundwater reservoir, having a maximum daily limit. Excess infiltration, above this limit, becomes recharge to the subsurface reservoir. Water available for infiltration as the result of a rain-on-snow event is treated as snowmelt if the snowpack is not depleted and as rainfall if the snowpack is depleted.
For rainfall with no snow cover, the volume infiltrating the soil zone is computed as a function of soil characteristics, antecedent soil-moisture conditions, and storm size. For daily-flow computations, the volume of rain that becomes surface runoff is computed using a contributing-area concept [defining percentage of area in the basin that contributes to runoff]. Daily infiltration is computed as net precipitation less surface runoff.
The subsurface reservoir performs the routing of soil-water excess that percolates to shallow groundwater zones near stream channels or that moves downslope from point of infiltration to some
point of discharge above the water table. Subsurface flow is considered to be water in the saturated-unsaturated and groundwater zones that is available for relatively rapid movement to a channel system. The subsurface reservoir can be defined either as linear or nonlinear.
Recharge to the groundwater reservoir can occur from the soil zone and the subsurface reservoir. Soil zone recharge has a daily upper limit and occurs only when field capacity is exceeded in the soil zone. Subsurface reservoir recharge is computed daily as a function of a recharge rate coefficient and the volume of water stored in the subsurface reservoir. The groundwater reservoir is a linear reservoir and is the source of all base flow. Streamflow is the sum of direct surface runoff, subsurface flow, and base flow from each [Hydrologic Response Unit, an area of approximately homogeneous hydrologic response to meteorological inputs within the overall modeled basin].”For the current study, attempts were made to calibrate
the models specifically to high flows in the four study basins, rather than to a full range of flows as in Dudley and Nielsen (2011). It was found, however, that calibration to the high flows did not result in substantially better calibration than the original calibration. The original model parameters were therefore retained for the current study. The “Historical Modeled Peak Flows Compared to Observed Values” section of the current report describes how accurately the PRMS models estimate historical peak flows for the four coastal Maine basins.
Flood Frequency Analyses
Peak flows with 1-percent annual exceedance probabilities (AEPs) (100-year recurrence intervals) and 50-percent AEPs (2-year recurrence intervals) for observed and historical modeled peak flows at the four streamgages in this study were computed using the guidelines (Bulletin 17B) of the Interagency Advisory Committee on Water Data (1982). The computations involved fitting the Pearson Type III probability distribution to the logarithms (base 10) of the observed annual peak flows at a given streamgage. This required computation of the mean, the standard deviation, and the skew of the logarithms of the annual peak-flow data. Peak flows for selected exceedance probabilities were determined from the fitted curve.
Bulletin 17B guidelines were followed for the treatment of high and low outliers and for the conditional probability adjustment. All high outliers were determined to be valid and were retained in the analyses. Station skew coefficients were not weighted with a generalized skew coefficient because the value of the generalized skew could change as precipitation

10 Modeled Future Peak Streamflows in Four Coastal Maine Rivers
and temperature change in the future. Expected probability adjustments, which are explained in Bulletin 17B, were not made.
Peak flows at individual streamgages with 1-percent and 50-percent AEPs, computed as described above, were not combined with peak-flow estimates from regional regression equations for the individual streamgages. Peak flows for selected AEPs at individual (unregulated) streamgages typically are combined with peak-flow estimates from regional regression equations to improve the peak-flow estimates. It is not certain, however, that the future relation between peak flows from streams in a region will be the same as the historical relation. The main interest for this report is in the relative differences in peak flows of selected AEPs between historical and estimated future flows.
Computing Magnitude of Changes
Peak-flow and snowpack changes between modeled values based on historical climate (air temperature and precipitation) and modeled values based on projected future climate for the four study basins were computed with the Hodges-Lehmann estimator, the median of all pairwise differences between two groups of data (Helsel and Hirsch, 1992). This method is more robust to outliers than computation of the mean difference between two groups. The Hodges-Lehmann estimator was also used to analyze the difference between observed peak flows and historical modeled peak flows.
All analyses in the current report use annual daily maximum peak-flow and snowpack values because this is the smallest time scale available in the rainfall-runoff model used for this study (see Basin Rainfall-Runoff Models section). Typically, for analyzing annual maximum peak-flow changes over time and for computing flood frequency estimates (see Flood Frequency Analyses section), the instantaneous annual maximum peak flow is used. For the four basins in this study, instantaneous annual peak flows average between 7 and 12 percent higher than daily peak flows. The interest in this study, however, is the difference in peak flows between historical and potential future scenarios rather than absolute values of peak flows.
The statistical significance of peak-flow changes are not reported for this study. The magnitude and direction of hydroclimatological changes can be determined with little ambiguity; however, the concept of statistical significance is essentially meaningless when discussing systems with poorly understood time-series structure (Cohn and Lins, 2005; Koutsoyiannis and Montanari, 2007). Trend tests that fail to consider long-term persistence in the data can greatly overstate the statistical significance of observed trends when long-term persistence is present (Cohn and Lins, 2005; Khaliq and others, 2009). The magnitude of hydrologic change (assuming high quality data collected in a consistent manner over time), whether it is statistically significant or not, can be meaningful. A more detailed discussion of this issue and other issues related to statistical significance can be found in Hodgkins and Dudley (2011).
Historical Modeled Peak Flows Compared to Observed Values
Historical PRMS-modeled annual daily maximum peak flows were compared to the observed annual daily maximum peak flows for the four basins in this study. Observed peak flows refer to peak flows measured, quality controlled, and published at each streamgage for the period of record of each streamgage. The Hodges-Lehman estimator was used to compare the populations of modeled versus observed peaks (table 1). The difference between modeled peak flows and observed peak flows was small, about 3 percent or less for three of the basins (the Pleasant, Sheepscot, and Royal Rivers) and about 9 percent different for the Narraguagus River.
Historical Modeled Flood Frequency Compared to Observed Values
Historical PRMS-modeled and observed daily maximum peak flows were both used to compute peak flows with 50-percent and 1-percent annual exceedance probabilities
Table 1. Historical modeled annual daily maximum peak flows compared to historical annual daily maximum peak flows.
[Differences computed by use of the Hodges-Lehman estimator. Location of streamgages shown in figure 2. USGS, U.S. Geological Survey]
USGS streamgagePeriod of observed record
Percent difference in annual daily maximum peak flowsNumber Name
01022260 Pleasant River near Epping, Maine 1981-1991, 2001-2008 -2.5
01022500 Narraguagus River at Cherryfield, Maine 1948-2008 9.2
01038000 Sheepscot River at North Whitefield, Maine 1939-2008 -3.1
01060000 Royal River at Yarmouth, Maine 1950-2003 0.4

Changes in Peak Flows on the Basis of Changes in Air Temperature and Precipitation 11
(AEPs) (equivalent to 2-year and 100-year recurrence intervals, respectively). Modeled peak flows with 50-percent AEPs were similar to observed peak flows with 50-percent AEPs; differences ranged from -6.6 percent to 7.5 percent (table 2). Modeled peak flows with 1-percent AEPs were similar or larger than observed peak flows with 1-percent AEPs; Narraguagus River and Royal River had differences of 6.6 percent and -2.2 percent, respectively; Pleasant River and Sheepscot River had differences of 14.6 percent and 36.2 percent.
Changes in Peak Flows on the Basis of Changes in Air Temperature and Precipitation
To estimate future peak streamflows at the four basins in this study, values for historical climate (temperature and precipitation) in the basins were adjusted on the basis of changes that are projected for the 21st century in the northeastern United States (Hayhoe and others, 2007). These climate changes are detailed in the “Projected Future Climate and High Streamflows in the Northeastern United States” section of the current report. In general, the northeastern United States is projected to become warmer and wetter. Changes in coastal Maine could vary from the changes projected for the entire northeastern United States.
To encompass the projected future changes in climate in coastal Maine, air temperatures at the four study basins were adjusted by four different amounts, from -3.6 ºF (-2 ºC) to +10.8 ºF (+6 ºC) of historical temperatures (by adjusting
model parameters rather than adjusting input variables). Precipitation was adjusted by three different percentage values from -15 percent to +30 percent of observed precipitation (by adjusting input variables). The historical periods used are the same as those listed in table 1, with the exception of the Pleasant River, where climate data during 1979–2008 were used in order to have a longer period of record. Precipitation adjustments were made by adding to (or subtracting from) the magnitude of every historical precipitation event, rather than changing the frequency of precipitation. While the frequency of precipitation could change in the future, modeling by Tebaldi and others (2006) indicates increases in precipitation intensity in the northeastern United States during the next century but minimal changes in precipitation frequency. The 20 combinations of adjusted values for temperature and precipitation (includes the no-change scenarios) were used as input to the four PRMS watershed models, and annual daily maximum peak flows were calculated for each combination. The PRMS-derived peak flows from the adjusted temperature and precipitation changes were then compared to unadjusted (historical) PRMS-derived peak flows (table 3) by use of the Hodges-Lehman estimator.
Annual daily maximum peak flows increase or decrease, depending on whether temperature or precipitation is changed; increases in air temperature (with no change in precipitation) result in decreases in peak flows, whereas increases in precipitation (with no change in temperature) result in increases in peak flows (table 3). As the magnitude of air temperatures increase in the four basins, peak flows decrease by larger amounts. If precipitation is held constant, 17 to 26 percent decreases in peak flow occur when temperature is increased by 7.2°F. If temperature is held constant, large increases (greater than 25 percent) in peak flow result
Table 2. Differences between historical modeled peak flows with 50-percent and 1-percent annual exceedance probabilities (AEPs) and observed peak flows with 50-percent and 1-percent AEPs.
[Location of streamgages shown in figure 2. USGS, U.S. Geological Survey; ft3/s, cubic feet per second]
USGS StreamgageYears
of record
Peak streamflow
Number Name
Annual exceedance probability,
percent
Observed, ft3/s
Historical modeled,
ft3/s
Percent difference
01022260 Pleasant River near Epping, Maine 19 50 786 763 -2.9
01022500 Narraguagus River at Cherryfield, Maine 61 50 3740 4020 7.5
01038000 Sheepscot River at North Whitefield, Maine 70 50 1820 1700 -6.6
01060000 Royal River at Yarmouth, Maine 54 50 3340 3340 0.0
01022260 Pleasant River near Epping, Maine 19 1 1710 1960 14.6
01022500 Narraguagus River at Cherryfield, Maine 61 1 9820 10470 6.6
01038000 Sheepscot River at North Whitefield, Maine 70 1 6520 8880 36.2
01060000 Royal River at Yarmouth, Maine 54 1 9630 9420 -2.2

12 Modeled Future Peak Streamflows in Four Coastal Maine Rivers
from a 15-percent increase in precipitation, and very large increases (greater than 50 percent) occur with a 30-percent increase in precipitation. The largest decreases in annual daily maximum peak flows at the four basins result from 15-percent decreases in precipitation combined with 10.8 °F increases in temperature (table 3). The largest increases in peak flows generally result from 30-percent increases in precipitation together with 3.6 °F decreases in temperature.
In many cases where temperature and precipitation both increase, the results are small increases or decreases in annual peak flows (table 3). For likely changes projected for the northeastern United States for the middle of the 21st century (temperature increase of 3.6 °F and precipitation increases of 0 to 15 percent), peak-flow changes at the four coastal Maine basins in this study are modeled to be evenly distributed between increases and decreases of less than 25 percent.
Changes in Flood Frequency on the Basis of Changes in Air Temperature and Precipitation
To estimate future flood frequency at the four basins in this study, historical climate data (temperature and precipitation) in the basins were adjusted by different amounts, as described in the previous section. The adjusted temperature and precipitation values were then used as input to the PRMS watershed models, and annual peak flows were calculated for each adjustment. Fifty-percent and 1-percent annual exceedance probability (AEP) peak flows (equivalent to 2-year and 100-year recurrence interval peak flows, respectively) were then calculated for the four basins in the study using the PRMS annual daily maximum peak flows, as explained in the “Flood Frequency Analyses” methods section. Modeled
Temperature Changes
-3.6°F No change + 3.6°F + 7.2°F + 10.8°F
01022260 Pleasant River near Epping, Maine
-15 percent precipitation change -14.1 -26.3 -37.7 -45.7 -53.4
No precipitation change 13.5 0.0 -13.2 -25.8 -33.0
+15 percent precipitation change 47.9 30.6 17.5 4.5 -8.1
+30 percent precipitation change 80.7 68.9 55.2 38.1 24.9
01022500 Narraguagus River at Cherryfield, Maine
-15 percent precipitation change -18.8 -23.6 -32.5 -40.5 -46.4
No precipitation change 7.1 0.0 -10.3 -18.2 -24.3
+15 percent precipitation change 33.5 26.6 15.9 6.9 -0.3
+30 percent precipitation change 59.8 55.9 44.7 34.2 26.4
01038000 Sheepscot River at North Whitefield, Maine
-15 percent precipitation change -19.5 -30.1 -39.3 -47.5 -53.2
No precipitation change 8.5 0.0 -11.6 -19.6 -26.8
+15 percent precipitation change 47.7 38.1 24.9 13.7 6.0
+30 percent precipitation change 103.2 85.5 65.6 54.3 45.2
01060000 Royal River at Yarmouth, Maine
-15 percent precipitation change -18.8 -25.0 -32.2 -37.2 -43.1
No precipitation change 5.3 0.0 -9.0 -16.9 -22.6
+15 percent precipitation change 29.6 25.8 17.3 6.3 -0.9
+30 percent precipitation change 51.1 51.9 45.1 34.0 23.0
Table 3. Annual daily maximum peak-flow changes based on changes in precipitation and air temperature.
[Peak-flow changes in percent; light blue shading represents peak-flow increases of 25 to 50 percent, blue represents flow increases greater than 50 percent, light orange represents decreases of 25 to 50 percent, orange represents decreases of greater than 50 percent. Differences computed by use of the Hodges-Lehman estimator; °F, degrees Fahrenheit]

Causes of Modeled Changes in Peak Flows and Flood Frequency 13
AEP peak flows from the adjusted changes in temperature and precipitation were then compared to unadjusted (historical) modeled AEP peak flows (tables 4, 5).
Changes in peak flows with 50-percent AEPs (table 4) are similar to changes in annual daily maximum peak flows (table 3, described in the previous section). Changes in peak flows with 1-percent AEPs (table 5) are similar in pattern to changes in annual daily maximum peak flows (table 3), but the magnitude of changes vary. Changes in peak flows with 1-percent AEPs at the Pleasant River and Royal River are much larger than changes in annual peak flow for the model run with a -3.6 ºF temperature change and +30 percent precipitation change. Changes in peak flows with 1-percent AEPs for the four basins, for the model run with +10.8 ºF temperature change and -15 percent precipitation change (table 5), are fairly similar to the changes in annual daily maximum peak flow (table 3).
Causes of Modeled Changes in Peak Flows and Flood Frequency
In coastal Maine, modeled peak flows (annual daily maximum peak flows and 50-percent and 1-percent AEP peak flows) increase with increasing precipitation. The percent change in peak flows was often double or more the percent change in precipitation, if no change in temperature is modeled (tables 3–5). Modeled peak flows decrease with increasing air temperature likely because of the influence of warming air temperatures on the amount of winter snowpack (table 6). Winter snowpack (the snow on the ground that accumulates during a winter) was explicitly modeled by PRMS for the four basins in this study.
Substantial decreases in maximum annual winter snowpack water equivalent (the amount of water in a
Table 4. Fifty-percent annual exceedance probability peak-flow changes based on changes in precipitation and air temperature.
[Peak-flow changes in percent; light blue shading represents peak-flow increases of 25 to 50 percent, blue represents flow increases greater than 50 percent, light orange represents decreases of 25 to 50 percent, orange represents decreases of greater than 50 percent; °F, degrees Fahrenheit]
Temperature Changes
-3.6°F No change + 3.6°F + 7.2°F + 10.8°F
01022260 Pleasant River near Epping, Maine
-15 percent precipitation change -17.8 -27.5 -40.8 -48.4 -53.7
No precipitation change 9.0 0.0 -16.7 -29.0 -34.9
+15 percent precipitation change 41.9 33.0 16.8 1.5 -10.2
+30 percent precipitation change 77.1 70.6 53.5 37.6 26.2
01022500 Narraguagus River at Cherryfield, Maine
-15 percent precipitation change -18.2 -23.9 -31.8 -39.2 -45.7
No precipitation change 7.5 0.0 -10.7 -17.7 -24.7
+15 percent precipitation change 33.6 27.3 15.8 7.4 -0.7
+30 percent precipitation change 61.6 57.2 44.9 34.8 25.9
01038000 Sheepscot River at North Whitefield, Maine
-15 percent precipitation change -18.8 -31.9 -40.0 -47.2 -53.0
No precipitation change 12.0 0.0 -11.8 -18.8 -26.8
+15 percent precipitation change 55.4 41.6 26.8 17.0 7.2
+30 percent precipitation change 114.8 94.9 71.7 58.7 47.8
01060000 Royal River at Yarmouth, Maine
-15 percent precipitation change -17.9 -25.3 -32.7 -37.0 -42.8
No precipitation change 3.3 0.0 -8.3 -17.5 -23.2
+15 percent precipitation change 27.0 25.8 14.7 5.0 -3.5
+30 percent precipitation change 49.6 53.5 41.2 31.2 20.2

14 Modeled Future Peak Streamflows in Four Coastal Maine Rivers
Table 5. One-percent annual exceedance probability peak-flow changes based on changes in precipitation and air temperature.
[Peak-flow changes in percent; light blue shading represents peak-flow increases of 25 to 50 percent, blue represents flow increases greater than 50 percent, light orange represents decreases of 25 to 50 percent, orange represents decreases of greater than 50 percent; °F, degrees Fahrenheit]
Temperature Changes
-3.6°F No change + 3.6°F + 7.2°F + 10.8°F
01022260 Pleasant River near Epping, Maine
-15 percent precipitation change -4.1 -32.8 -51.4 -56.7 -61.5
No precipitation change 38.5 0.0 -28.6 -34.6 -40.1
+15 percent precipitation change 99.3 40.1 -1.1 -10.3 -14.3
+30 percent precipitation change 162.2 90.1 48.2 28.7 14.1
01022500 Narraguagus River at Cherryfield, Maine
-15 percent precipitation change -15.8 -25.1 -36.7 -42.5 -42.4
No precipitation change 9.6 0.0 -11.6 -21.4 -19.7
+15 percent precipitation change 39.6 26.0 10.6 0.0 4.1
+30 percent precipitation change 72.1 55.4 39.0 28.1 32.5
01038000 Sheepscot River at North Whitefield, Maine
-15 percent precipitation change -23.5 -26.7 -33.1 -45.4 -50.5
No precipitation change 15.0 0.0 -5.3 -15.5 -17.4
+15 percent precipitation change 51.7 29.0 25.5 12.6 7.8
+30 percent precipitation change 83.9 58.1 57.1 42.2 34.3
01060000 Royal River at Yarmouth, Maine
-15 percent precipitation change -31.5 -29.2 -36.6 -43.2 -47.6
No precipitation change 12.6 0.0 -11.3 -14.1 -22.5
+15 percent precipitation change 54.2 50.4 44.0 34.5 12.8
+30 percent precipitation change 110.1 93.8 94.6 94.7 68.9
snowpack if it were melted) are modeled to occur with increasing air temperatures at the four basins in the study; substantial increases in snowpack water equivalent are modeled to occur with decreasing air temperatures (table 6). Assuming no change in precipitation, maximum annual snowpack in coastal Maine is modeled to decrease by about 50 percent with a 3.6 ºF temperature increase, decrease by about 75 percent with a 7.2 ºF temperature increase, and decrease by about 85 percent with a 10.8 ºF temperature increase. Very large decreases (greater than 50 percent) in maximum winter snowpack occur in all four basins for temperature increases of 7.2 ºF or 10.8 ºF, regardless of changes in precipitation. Increases in maximum winter snowpack for decreased temperatures of 3.6 ºF become larger as precipitation increases.
The modeled changes in peak flows (annual daily maximum peak flows and 1-percent and 50-percent AEP
peak flows) as a result of changing precipitation and air temperatures are consistent with previous studies from other parts of the world. The increases in peak flow resulting from increases in precipitation at the four basins in this study are consistent with projections for many parts of the world (Bates and others, 2008). Decreased peak flows from increased temperatures at the study basins are consistent with studies from some areas of the world where increased temperatures lead to decreased snowpacks and resulting decreased snowmelt runoff (Arora and Boer, 2001; Voss and others, 2002; Hamlet and Lettenmaier, 2007). In some other areas, loss of winter snowpack may lead to increased flood risk because of increased effective watershed areas from elevational shifts in the snow line (Hamlet and Lettenmaier, 2007; Tohver and Hamlet, 2010).
Summary and Conclusions 15
Table 6. Annual daily maximum snowpack water-equivalent changes based on changes in precipitation and air temperature.
[Snowpack water-equivalent changes in percent; light blue shading represents peak-flow increases of 25 to 50 percent, blue represents flow increases greater than 50 percent, light orange represents decreases of 25 to 50 percent, orange represents decreases of greater than 50 percent; °F, degrees Fahrenheit]
Temperature Changes
-3.6°F No change + 3.6°F + 7.2°F + 10.8°F
01022260 Pleasant River near Epping, Maine
-15 percent precipitation change 50.0 -20.0 -62.5 -83.3 -87.5
No precipitation change 83.3 0.0 -50.0 -77.8 -85.7
+15 percent precipitation change 112.5 16.7 -47.2 -75.0 -85.7
+30 percent precipitation change 142.9 42.9 -33.3 -71.4 -83.3
01022500 Narraguagus River at Cherryfield, Maine
-15 percent precipitation change 22.2 -15.4 -50.0 -75.0 -89.5
No precipitation change 41.7 0.0 -41.7 -72.2 -88.9
+15 percent precipitation change 66.7 16.7 -33.3 -66.7 -86.7
+30 percent precipitation change 87.5 33.3 -22.2 -62.5 -85.7
01038000 Sheepscot River at North Whitefield, Maine
-15 percent precipitation change 33.3 -16.7 -57.1 -80.0 -85.7
No precipitation change 60.0 0.0 -50.0 -75.0 -85.7
+15 percent precipitation change 85.7 18.2 -37.5 -70.0 -83.3
+30 percent precipitation change 112.5 33.3 -27.3 -63.6 -83.3
01060000 Royal River at Yarmouth, Maine
-15 percent precipitation change 22.2 -20.7 -60.0 -77.8 -86.7
No precipitation change 50.0 0.0 -50.0 -75.0 -85.7
+15 percent precipitation change 75.0 20.0 -33.3 -71.0 -83.3
+30 percent precipitation change 100.0 41.7 -25.0 -63.6 -80.0
Summary and ConclusionsTo safely and economically design bridges and culverts,
it is necessary to compute the magnitude of peak streamflows that have specified annual exceedance probabilities (AEPs). These peak flows are also needed for effective floodplain management. It is important for engineers and resource managers to understand how peak flows may change in the future due to the effects of projected climate change. Because different regions of the country have very different flood generating mechanisms, it is important to analyze flows specific to a region of interest. Annual precipitation in the northeastern United States is projected to increase by about 7 to 14 percent by the end of the 21st century (based on averages from nine Atmosphere-Ocean General Circulation Models (AOGCMs) for low, moderately high, and high emission scenarios); annual air temperature is projected
to increase by about 5.2 degrees Fahrenheit (ºF) to 9.4 ºF. Projected changes from individual AOGCMs are more variable. This report, prepared in cooperation with the Maine Department of Transportation, presents modeled changes in annual daily maximum peak flows and peak flows of selected AEPs at four basins in coastal Maine based on projected changes in air temperature and precipitation. The results are based on U.S. Geological Survey Precipitation-Runoff Modeling System (PRMS) models for the four basins.
PRMS-modeled historical annual daily maximum peak flows were compared to observed annual daily maximum peak flows for the four basins in this study. The Hodges-Lehman estimator was used to compare the populations of modeled versus observed peaks. The difference between modeled and observed peaks was small, less than about 3 percent for three of the basins and about 9 percent for the other basin. Modeled historical and observed historical daily maximum peak flows

16 Modeled Future Peak Streamflows in Four Coastal Maine Rivers
were both used to compute peak flows with 50-percent and 1-percent AEPs (equivalent to 2-year and 100-year recurrence intervals, respectively). Modeled historical peak flows with 50-percent AEPs were similar to observed peak flows with 50-percent AEPs, with differences ranging from -6.6 percent to 7.5 percent. Modeled peak flows with 1-percent AEPs were similar or larger than observed peak flows with 1-percent AEPs; Narraguagus River and Royal River had differences of 6.6 percent and -2.2 percent, respectively; Pleasant River and Sheepscot River had differences of 14.6 percent and 36.2 percent.
To estimate future annual daily maximum peak streamflows at the four basins in this study, historical climate data (temperature and precipitation) in the basins were adjusted. To encompass the projected changes in climate in coastal Maine, air temperatures were adjusted by four different amounts, from -3.6 ºF (-2 ºC) to +10.8 ºF (+6 ºC) of observed temperatures. Precipitation was adjusted by three different percentage values from -15 percent to +30 percent of observed precipitation. The 20 combinations of adjusted temperature and precipitation values (includes the no-change scenarios) were then used as input to the four PRMS watershed models, and annual daily maximum peak flows were calculated for each combination. Modeled peak flows from the adjusted temperature and precipitation changes were then compared to unadjusted (historical) modeled peak flows.
Annual daily maximum peak flows increase or decrease, depending on whether temperature or precipitation is adjusted. Increases in air temperature (with no change in precipitation) lead to decreases in peak flows, whereas increases in precipitation (with no change in temperature) lead to increases in peak flows. As the magnitude of air temperatures increases in the four basins, peak flows decrease by larger amounts. If precipitation is held constant, 17- to 26-percent decreases in peak flow occur when temperature is increased by 7.2 °F. If temperature is held constant, large increases (greater than 25 percent) in peak flow at the basins result from a 15-percent increase in precipitation, and very large (greater than 50 percent) increases occur with a 30-percent increase in precipitation. The largest decreases in peak flows at the four basins result from a combination of 15-percent precipitation decreases and 10.8 °F temperature increases. The largest increases in peak flows generally result from 30-percent increases in precipitation and 3.6 °F decreases in temperatures.
In many cases where temperature and precipitation both increase, small increases or decreases in annual daily maximum peak flows result. For likely changes projected for the northeastern United States for the middle of the 21st century (temperature increase of 3.6 °F and precipitation increases of 0 to 15 percent), peak-flow changes at the four coastal Maine basins in this study are modeled to be evenly distributed between increases and decreases of less than 25 percent.
Peak flows with 50-percent and 1-percent AEPs were calculated for the four basins in the study using the PRMS-modeled annual daily maximum peak flows; these peak flows
with adjusted temperatures and precipitation were compared to unadjusted (historical) modeled values. Changes in peak flows with 50-percent AEPs are similar to changes in annual daily maximum peak flows; changes in peak flows with 1-percent AEPs are similar in pattern to changes in annual daily maximum peak flows, but some of the changes associated with increasing precipitation are much larger than changes in annual daily maximum peak flows.
The decrease in modeled peak flows with increasing air temperature, given no change in precipitation amount, is likely caused by changes in winter snowpack (the snow on the ground that accumulates during a winter). Substantial decreases in maximum annual winter snowpack water equivalent (the amount of water in a snowpack if it were melted) are modeled to occur with increasing air temperatures at the four basins in the study. Maximum annual snowpack in coastal Maine is modeled to decrease by about 50 percent with a 3.6 ºF temperature increase, by about 75 percent with a 7.2 ºF temperature increase, and by about 85 percent with a 10.8 ºF temperature increase (assuming no change in precipitation). Very large decreases in maximum winter snowpack for temperature increases of 7.2 ºF or 10.8 ºF occur regardless of changes in precipitation. Increases in maximum winter snowpack for decreased temperatures of 3.6 ºF become larger as precipitation increases.
The modeled changes in peak flows (annual daily maximum peak flows and 1-percent and 50-percent AEP peak flows) caused by changing precipitation and air temperatures are consistent with previous studies from other parts of the world. The increases in peak flow resulting from increases in precipitation at the four basins in this study are consistent with projections for many parts of the world. Decreased peak flows from increased temperatures at the study basins are consistent with other studies from some areas of the world where increased temperatures lead to decreased snowpacks and resulting decreased snowmelt runoff. In some other areas, loss of winter snowpack may lead to increased flood risk because of increased effective watershed areas from elevational shifts in the snow line.
References Cited
Armstrong, W.H., Collins, M.J., and Snyder, N.P., 2011, Increased frequency of low-magnitude floods in New England: Journal of the American Water Resources Association, DOI:10.1111 ⁄ j.1752-1688.2011.00613.x.
Arora, V.K., and Boer, G.J., 2001, Effects of simulated climate change on the hydrology of major river basins: Journal of Geophysical Research, v. 106, p. 3335–3348.
Bates, B.C., Kundzewicz, Z.W., Wu S., and Palutikof, J.P., eds., 2008, Climate change and water: Technical Paper of the Intergovernmental Panel on Climate Change, Geneva, IPCC Secretariat, 210 p.

References Cited 17
Cohn, T.A., and Lins, H.F., 2005, Nature’s style—Naturally trendy: Geophysical Research Letters, v. 32, L23402, doi:10.1029/2005GL024476.
Collins, M.J., 2009, Evidence for changing flood risk in New England since the late 20th century: Journal of the American Water Resources Association, v. 45, p. 279–290.
Dooge, J.C.I., 1986, Looking for hydrologic laws: Water Resources Research, v. 22, p. 46S–58S.
Dudley, R.W., and Hodgkins, G.A., 2002, Trends in streamflow, river ice, and snowpack for coastal river basins in Maine during the 20th century: U.S. Geological Survey Water-Resources Investigations Report 02–4245, 26 p.
Dudley, R.W., and Nielsen, M.G., 2011, Simulation of streamflow in the Pleasant, Narraguagus, Sheepscot, and Royal Rivers, Maine, using watershed models: U.S. Geological Survey Scientific Investigations Report 2010–5221, 31 p.
Fontaine, R.A., 1978, Drainage areas of surface-water bodies of the Royal and Presumpscot River Basins in southwestern Maine: U.S. Geological Survey Open-File Report 78–556A, 54 p.
Fontaine, R.A., 1982a, Drainage areas of surface-water bodies of eastern Maine coastal river basins: U.S. Geological Survey Open-File Report 78–556H, 54 p.
Fontaine, R.A., 1982b, Drainage areas of surface-water bodies of central Maine coastal river basins: U.S. Geological Survey Open-File Report 78–556I, 54 p.
Hamlet, A.F., and Lettenmaier, D.P., 2007, Effects of 20th century warming and climate variability on flood risk in the western U.S.: Water Resources Research, v. 43, W06427, doi:10.1029/2006WR005099.
Hayhoe, K., Wake, C.P., Huntington, T.G., Luo, L., Schwartz, M.D., Sheffield, J., Wood, E., Anderson, B., Bradbury, J., DeGaetano, A., Troy, T.J., and Wolfe, D., 2007, Past and future changes in climate and hydrological indicators in the U.S. Northeast: Climate Dynamics, v. 28, p. 381–407.
Helsel, D.R., and Hirsch, R.M., 1992, Statistical methods in water resources: New York, Elsevier, 522 p.
Hodgkins, G.A., 2010, Historical changes in annual peak flows in Maine and implications for flood-frequency analyses: U.S. Geological Survey Scientific Investigations Report 2010–5094, 38 p.
Hodgkins, G. A., and Dudley, R. W., 2005, Changes in the magnitude of annual and monthly streamflows in New England, 1902–2002: U. S. Geological Survey Scientific Investigations Report 2005–5135, 37 p.
Hodgkins, G.A., and Dudley, R.W., 2006, Changes in the timing of winter–spring streamflows in eastern North America, 1913–2002: Geophysical Research Letters, v. 33, L06402, doi:10.1029/2005GL025593.
Hodgkins, G.A., and Dudley, R.W., 2011, Historical summer base flow and stormflow trends for New England rivers, Water Resources Research, v. 47, W07528, doi:10.1029/2010WR009109.
Hodgkins, G.A., Dudley, R.W., and Huntington, T.G., 2003, Changes in the timing of high river flows in New England over the 20th century: Journal of Hydrology, v. 278, p. 242–250.
Hodgkins, G.A., Lent, R.M., Dudley, R.W., and Schalk, C.W., 2009, Framework for a U.S. Geological Survey Hydrologic Climate-Response Program in Maine: U.S. Geological Survey Scientific Investigations Report 2009–1115, 24 p.
Hunter, L.E., and Smith, G.W., 2001, Morainal banks and the deglaciation of coastal Maine, in Weddle, T.K., and Retelle, M.J., eds., Deglacial history and relative sea-level changes, Northern New England and adjacent Canada: Boulder, Colo., Geological Society of America Special Paper 351, p. 151–170.
Interagency Advisory Committee on Water Data, 1982, Guidelines for determining flood flow frequency–Bulletin 17B of the Hydrology Subcommittee: U.S. Geological Survey, Office of Water-Data Coordination, 183 p.
Irland, L.C., 1998, Maine’s forest area, 1600–1995—Review of available estimates: Maine Agricultural and Forest Experiment Station Miscellaneous Publication 736, 12 p.
Khaliq, M.N., Ouarda, T.B.M.J., and Gachon, P., 2009, Identification of temporal trends in annual and seasonal low flows occurring in Canadian rivers: The effect of short- and long-term persistence: Journal of Hydrology, v. 369, p. 183–197.
Koutsoyiannis, D., and Montanari, A., 2007, Statistical analysis of hydroclimatic time series: Uncertainty and insights: Water Resources Research, v. 43, W05429, doi:10.1029/2006WR005592.
Leavesley, G.H., Lichty, R.W., Troutman, B.M., and Saindon, L.G., 1983, Precipitation–Runoff Modeling System—User’s manual: U.S. Geological Survey Water-Resources Investigations Report 83–4238, 207 p.
Leavesley, G.H., Markstrom, S.L., Viger, R.J., and Hay, L.E., 2005, U.S. Geological Survey Modular Modeling System (MMS) Precipitation-Runoff Modeling System (PRMS) (MMS–PRMS), in Singh, V., and Frevert, D., eds., Watershed Models: Boca Raton, Fla., CRC Press, p. 159–177.
Lettenmaier, D., Major, D., Poff, L., and Running, S., 2008, Water Resources, in, The effects of climate change on agriculture, land resources, water resources, and biodiversity in the United States: A Report by the U.S. Climate Change Science Program and the Subcommittee on Global Change Research, Washington, D.C., 362 p.

18 Modeled Future Peak Streamflows in Four Coastal Maine Rivers
Milly, P.C.D., Betancourt, J., Falkenmark, M., Hirsch, R.M., Kundzewicz, Z.W., Lettenmaier, D.P., and Stouffer, R.J., 2008, Stationarity is dead: Whither water management?: Science, v. 319, p. 573–574.
National Oceanic and Atmospheric Administration, 2002, Climatography of the United States no. 81, Monthly station normals of temperature, precipitation, and heating and cooling degree days, 1971–2000: Region 17, Maine, 16 p.
Randall, A.D., 1996, Mean annual runoff, precipitation, and evapotranspiration in the glaciated northeastern United States, 1951–80: U.S. Geological Survey Open-File Report 96–395, 2 sheets.
Randall, A.D., 2000, Hydrogeologic framework of stratified-drift aquifers in the glaciated northeastern United States: U.S. Geological Survey Professional Paper 1415–B, 179 p. (plate showing hydrophysiographic regions in the glaciated northeastern United States, scale 1:2,500,000).
Tebaldi, C., Hayhoe, K, Arblaster, J.M., and Meehl, G.A., 2006, Going to the extremes—An intercomparison of model-simulated historical and future changes in extreme events: Climatic Change, v. 79, p. 185–211.
Thompson, W.B., and Borns, H.W., 1985, Surficial geologic map of Maine: Maine Geological Survey, Department of Conservation, scale 1:5,000,000, 1 sheet.
Thompson, W.B., Crossen, K.J., Borns, H.W., Jr., and Andersen, B.G., 1983, Glacial-marine deltas and late Pleistocene-Holocene crustal movements in southern Maine: Maine Geological Survey Open-File Report 83–3, 18 p.
Tohver, I., and Hamlet, A.F., 2010, Impacts of 21st century climate change on hydrologic extremes in the Pacific Northwest region of North America: Chapter 7 in Final Report for the Columbia Basin Climate Change Scenarios Project, Climate Impacts Group, Center for Science in the Earth System, Joint Institute for the Study of the Atmosphere and Ocean, University of Washington, Seattle, 20 p.
U.S. Department of Agriculture, 2005, Forests of Maine, 2003: Northeastern Forest Inventory and Analysis, 104 p.
U.S. Geological Survey, 2005, Landsat: A global land imaging project: U.S. Geological Survey Fact Sheet 023–03, 4 p.
Voss, R., May, W., and Roeckner, E., 2002, Enhanced resolution modeling study on anthropogenic climate change—Changes in extremes of the hydrological cycle: International Journal of Climatology, v. 22, p. 755-777.

Prepared by the Pembroke Publishing Service Center.
For more information concerning this report, contact:
Office ChiefU.S. Geological SurveyNew England Water Science Center Maine Office196 Whitten RoadAugusta, ME [email protected]
or visit our Web site at:http://me.water.usgs.gov

Hodgkins and Dudley —M
odeled Future Peak Streamflow
s in Four Coastal Maine Rivers—
Scientific Investigations Report 2013–5080