model study of stresses in a layered system
TRANSCRIPT
Model Study of Stresses in a Layered System B. SUBBARAJU, Assistant Director (Roads), Central Road Research Institute,
New Delhi, India
This paper reports on a study of the variation of stresses in a layered system using thin metal plates of steel, copper, and aluminum, having different physical characteristics, arranged in stacks of different ways, using SR-4 strain gages of the rosette type, when loaded with a wheel load on a soil subgrade. The stacks of metal plates were loaded directly by means of a hard rubber wheel attached to the head of a universal testing machine.
From the strain measurements, the principal stresses together with the maximum shear· stresses were evaiuaied. The studies show that the applied load being the same, the stress conditions in upper pavement layers are materially affected by variation of modulus of elasticity of the various layers of the pavement, the condition of the interface of the layers, and the direction of loading.
•THE IIlSTORY of development of highway transportation indicates the necessity for continuous highway improvements. To provide for the increasing volumes and the heavier wheel loads of highway traffic, in the most economical manner, the designer faces the following two essential problems: (a) correct assessment of the forces which the highway must resist, and (b) correct proportioning to resist those forces in the most effective and economical manner.
As far as is known to the author, there is very little information concerning experimental studies of stresses in a layered system.
The studies reported here were done primarily to establish the nature of stresses in the layered system of pavements. To accomplish this, the variation in stresses in thin metal plates of steel, copper, and aluminum were studied. The metal plates were used to study the change in stress due to four variables:
1. Varying arrangements of metal plates in stacks with regard to stiffness or mod-ulus of elasticity.
2. Varying types of contact surfaces between the plates. 3. Variation in edge support conditions. 4, Variation in the direction of the applied load.
PROCEDURE
Model Studies
The pavement stress studies were made using metal plates as model pavement layers. Each plate was 23 in. wide, 25 in. long, and Ye in. thick. The research made comprises the following specific studies:
1. The effect of changes in plate arrangement. Three materials (steel, copper, and aluminum) were used with the following stacking arrangements from top to bottom: (a) steel, copper, aluminum; and (b) aluminum, copper, steel.
2. The effect of (a) polished, (b) oiled, and (c) roughened contact surfaces between the plates.
3. The effect of changes in the edge support condition. Plates were loaded with no
Paper sponsored by Committee on Flexible Pavement Design. 22
23
edge restraint and with edge restraint provided on three sides at the rate of 200 lb per side.
4. The effect of load applied vertically and in an inclined manner.
Criteria for Choice of Metal Plates and Design of the Model
The metal plates were selected, because the materials have uniform physical properties and strain measurements can be made easily with the electric resistance gages. The system of metal plates studied does not satisfy the conditions of similitude. The length and width of the plates were fixed by the maximum size that could be accommodated in the testing machine. The thickness of 1/e in. for each plate was selected on the basis of obtaining reasonably high strains with relatively small loads in order not to overstress the subgrade. Results indicate that this decision on plate thickness was essentially correct. Not knowing the exact theoretical relations for stress and strain in the four pavement layers, it was not possible to set down the exact conditions that would be necessary for similar stresses and strains in model and prototype.
The plate system used is geometrically similar to various types of pavement-construction. As a model of particular pavement, the plate system is undoubtedly highly distorted. The contact conditions between the plates are also not similar to those existing in actual pavements. In spite of these deviations, it is considered that the stress patterns obtained will be similar to those existing in actual pavements.
Subgrade for Pavement Models
The model s labs and stacks of metal plates were supported on a soil subgrade of' ML material (unified classification system) contained in a 25%- by 23%- by 23-in. wood~n box, reinforced with an angle iron frame. The physical properties of the soil used for the subgrade are given in Table 1.
The top of the subgrade was covered with a layer of aluminum foil and the box was coated with bitumen inside to minimize moisture loss. A thin layer of less than% in. of sand was placed over the aluminum foil to obtain good bedding for the strain gages placed on the bottom of the model pavement. The average moisture in the subgrade during the period of testing was found to be between 8 to 9 percent.
Manner of Applying Load
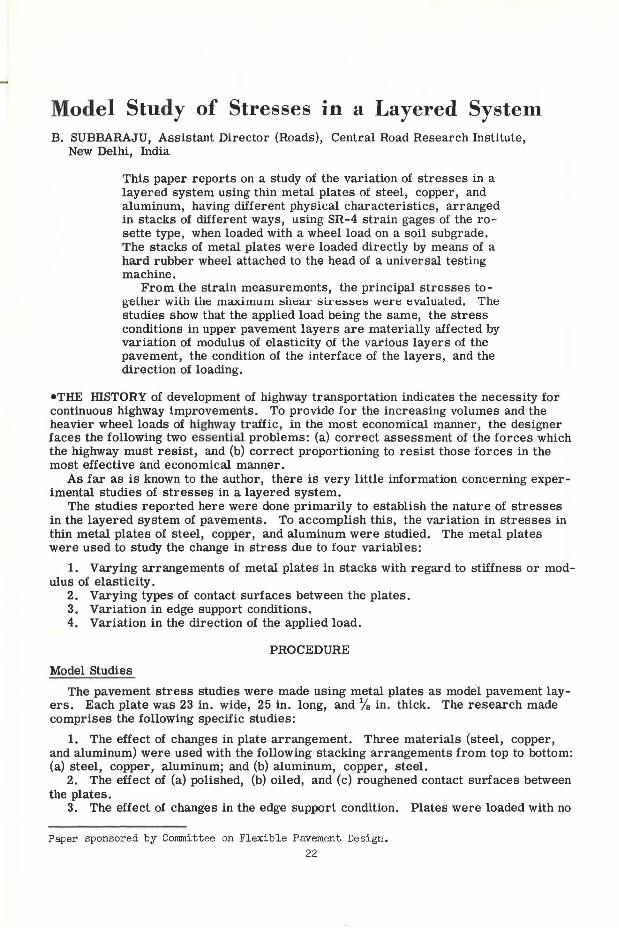
The load was applied to the metal plates in various arrangements by means of a small hard rubber wheel 4 in. in diameter attached to the head of a universal testing machine. A piece of sponge rubber 2 by 2 by%in. wasusedundertheloadingwheel. In addition to the vertical loading, with a view to studying the effect of inclined loading on the distribution of surface stresses, the loading wheel attached to the head of the universal testing machine was deflected 11%0 from the vertical by shims on one side of the seating plate of the loading wheel. Tests were run with the inclined wheel pointing towards the gage quadrant as well as pointing away from the gage quadrant both for free and restrained edge conditions. Figure 1 shows the subgrade box in the universal testing machine together with the loading arrangement. Figure 2 shows the relation of load to size of loaded area for the hard rubber wheel.
Method of Measuring Strains
Strains were measured in each case both at the top and bottom of the stack of metal plates by the use of SR-4 strain gages of the equiangular rosette type. The strain gages were mounted in one quadrant in each case. Figure 3 shows
TABLE 1
PHYSICAL PROPERTIES OF SUBGRADE SOIL
Property
Liquid limit (%) Plastic limit, (%) Plasticity index (1,) Optimum moisture a('.! ) Optimum density a (pcf) Califor nia bearing ratio b (%)
Value
25.0 21. 8 3.2
13.6 109.1 40.0
aStandard Proctor. bAt time of testing.

24
1000
900
BOO
700
-g 600 0
g_ soo --0
g 400 _J
loo
200
100
0
I I
I I
I /
I /
V ./
0--~
O·S 1·0 l·S 2•0
Loaded Area, square inches
Figure 2. Relation of load to size of loaded area for hard rubber wheel.
the steel and aluminum plates on either side with mounted gages together with the scored copper plate in the middle.
Conversion of Strain Data to Unit Strain Figure 1. Subgrade box in universal testing machine together with loading wheel, The strain data were reduced to prin
cipal stresses and shear stresses by a graphical method described by Bossart and Brewer (!),
MODEL PAVEMENTS WITH THEIR PROPERTIES
The 25- by 23- by %-in. metal plates were cut from rolled sheets of steel, copper, and aluminum. The modulus of elasticity and Poisson's ratio of the material in the plates were determined on standard tension test specimens prepared in accordance with ASTM procedure E 8 - 52 T, "Tension Testing of Metallic Materials." The modulus of elasticity, E, and Poisson's ratio, u, were calculated from measured longitudinal and lateral strains obtained with SR-4 electrical resistance strain gages during the tension tests. The values of modulus of elasticity and Poisson's ratio obtained from the various metal plates are given in Table 2. Figure 4 shows the specimens used for determining the modulus of elas-ticity and Poisson's ratio.
All the contact faces of the plates were
Figure 3. Steel and aluminum plates on either side with mounted gages; scored
copper plate in middle.
TABLE 2
VALUES OF MODULUS OF ELASTICITY AND POISSON'S RATIO OBTAINED
FOR THE VARIOUS METAL PLATES
Type of Plate
Aluminum Copper Steel
Modulus of Elasticity E
(psi)
10. 3 X 10⁶
15.9 X 10⁶
28.3 Xl06
Poisson's Ratio
0. 34 0.28 0. 23

Figure 4. t e rmining
Metal specimens used for demodulus of elast i city and
Poisson's ratio.
25
" z,
rz!_tz{t 5N ~~~ • i-;-~ -~- -- - - . z 25 u R3 Rz RI
R4 ~ 5•R
tr 2 R7 '
R5 "'
• I '"'. 5 I "'
~ R6 ' " tz I
Figure 5. Location of SR-4 gages on aluminum plate.
polished to a high degree of surface smoothness for the initial tests, using emery cloth. For later tests with roughened surfaces, the contact surfaces of the plates were scored in two perpendicular directions, using a hard, pointed steel
file. Figure 2. shows the scored copper plate in the middle.
APPLICATION OF SR-4 STRAIN ROSETTES
In this study, SR-4 equiangular rosettes of AR4-1 type were used for all strain studies on model pavements. In all the tests, the gages were located in one quadrant
of the plates under test. The gages were ;
t--~~~~~~~- z,
; Z5
Figure 6. Location of SR-4 gages on steel plate.
Figure 7, Model pavement in subgrade box with edge s restrained on three sides,
26
placed along lines at the edges and along the diagonal of the quadrant. Typical locations of gages are shown in Figures 5 and 6. For the tests on the various stacks of metal plates, a central rosette was used only on the bottom plate, and it was necessary to install and remove this gage as the stacking arrangement was varied. For the re -mainder of the gage locations, the rosette gages as mounted at the beginning were used again and again for the different stacking arrangements tested.
The SR-4 gages were mounted on the metal plates adhering to the recommended procedure by the manufacturers for mounting the gages. The gages were waterproofed by applying hot petrocene wax over them. The steel and aluminum plates with gages mounted and ready for test are shown in Figure 2.
TEST PROCEDURE
The model pavement comprising the metal plates with mounted gages was carefully seated over the prepared subgrade and, at the same time, the leads of the gages on the bottom face were drawn through holes provided in the side.
For the restrained edge condition, precalibrated springs were used for restraining the edges on three sides of the model pavements. The edges were restrained by providing the required defiection in the calibrated springs by screwing down the nuts on the angle iron frame set over the springs. Figure 7 shows a model pavement in the subgrade box with edges restrained on three sides to simulate edge condition of a road pavement. The subgrade box was then loaded into the universal testing machine and carefully centered.
The following series of eight tests were conducted:
1. Aluminum plate on top and steel plate at bottom with copper plate in between, polished surfaces, vertical loading, tested once with free and once with restrained edges.
2. Steel plate on top and aluminum plate at bottom with copper in between, polished surfaces, vertical loading, tested once with free and once with restrained edges.
3. Steel plate on top and aluminum plate at bottom with copper plate in between, oiled surfaces, vertical loading, tested once with free and once with restrained edges.
4. Aluminum plate on top and steel plate at bottom, with copper plate in between, oiled surfaces, vertical loading, tested once with free and once with restrained edges.
5. Aluminum plate on top and steel plate at bottom, with copper plate in between, roughened surfaces, vertical loading, tested once with free and once with restrained edges.
6. Steel plate on top and aluminum plate at bottom, with copper plate in between, roughened surfaces, vertical loading, tested once with free and once with restrained edges.
7. Steel plate on top and aluminum plate at bottom with copper plate in between, roughened surfaces, tested with inclined load at 11%0 to vertical (pointing away from gage quadrant), once with free and once with restrained edges.
8. Steel plate on top and aluminum plate at bottom with copper plate in between, roughened surfaces, tested with inclined load at 11 % 0 to vertical (pointing towards the gage quadrant), once with free and once with restrained edges.
The model pavement slabs were loaded directly by means of a hard rubber wheel attached to the head of a universal testing machine.
The strain measurements were made from the SR-4 gages of equiangular rosette type with an SR-4 strain indicator. The active gage is mounted on the stressed model and the compensating gage is mounted on unstressed piece of the same material. The active and compensating gages are located close together so that both are subjected to the same temperature and the strains undergone by the various gages are obtained directly from the strain indicator.
RESULTS
The principal stresses and the maximum shear stresses for all the strains measured were calculated and plots for 750-lb load with a loaded area of 1. 8 sq in. for the
27
" .. ..
Gd 0 '>.ro 0 0
Maximum Principal
Minimum " Principal
. " "a 6 6 6 0
~ 0 '1'o 00 ~
" 'b " --s. .. 3 .~ C, 3 Oo 3 1'a
\" ""10 ~ 0 Oo 0 0 •tsoo
.. 6" ..,. 3'' 9" 3 " 6 9" 3
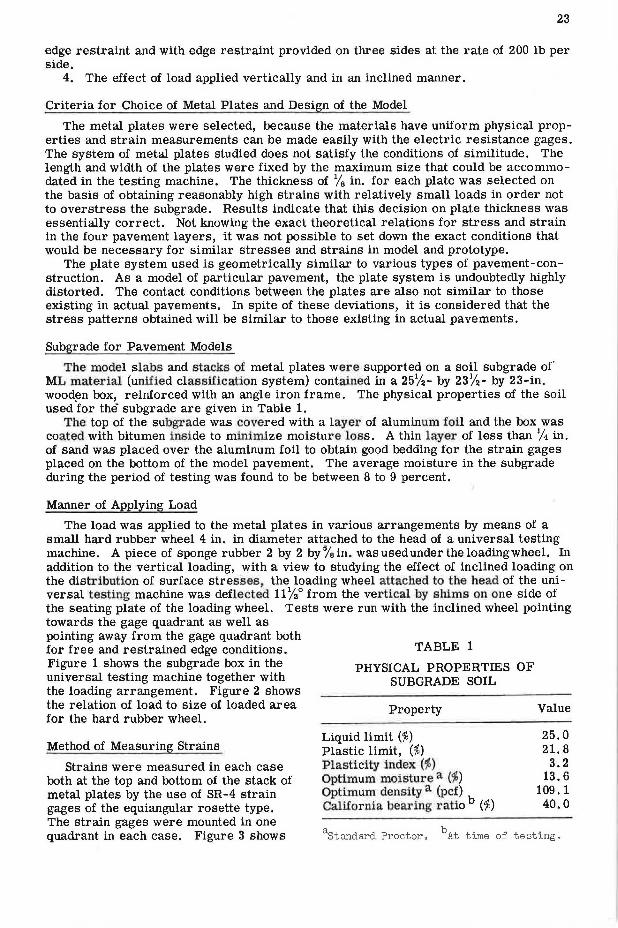
Figure 8. Test l: stress contours (psi) on top aluminum plate with free edges.
•r--- . 0
.. 6
Minimum Principal
" 6
. 3
9" +3Z700
Maximum Principal
9
. 6
. 3
0
Maximum Shear ~ ~
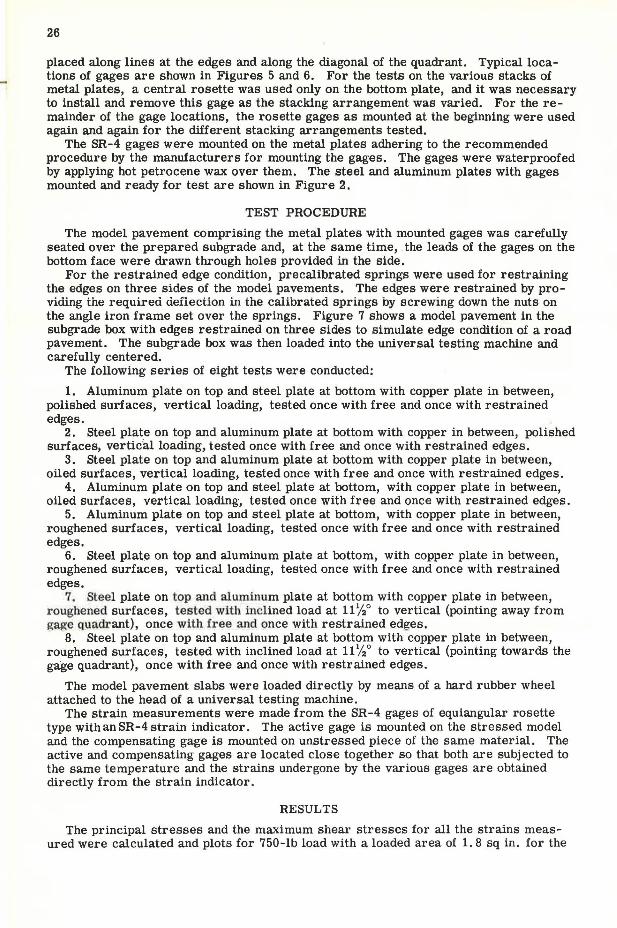
Figure 9. Test l: stress contours (psi) on bottom steel plate with free edges .
" Maximum . Maximum
0 0 9
@ Minimum Principa I Shear -zoo--- Principal 0\ .. ..
6 6 "Soo 6 -500
• -750 •10 . 3 -100 3 0 3
1-/ 'O ;so .,.lo a oo
3'' 6 ..
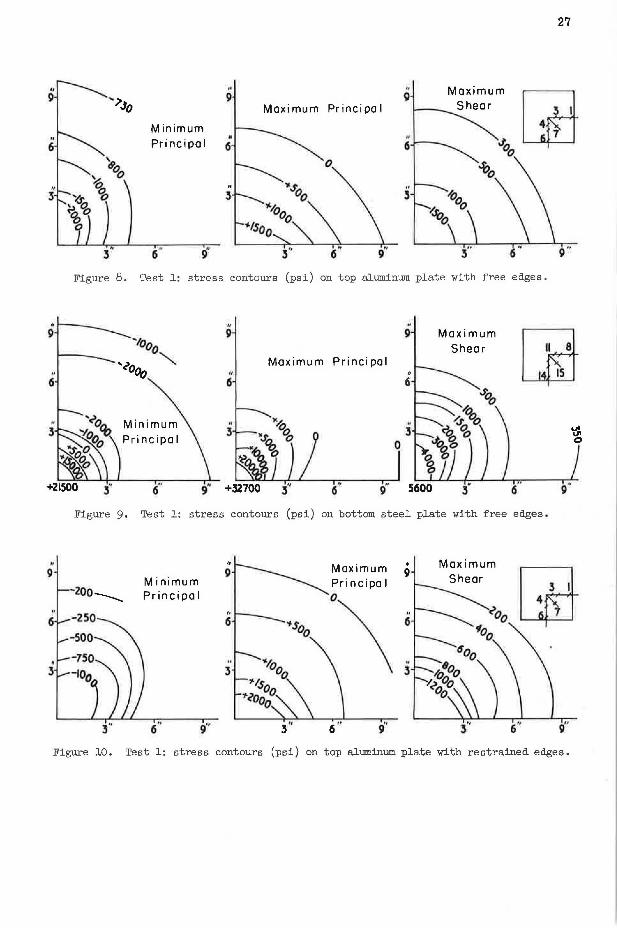
9" 3" 6 o" 3" 6'' o" Figure lO. Test l: stress contours (psi) on top aluminum plate with restrained edges.

28
" " 9 9 9 Maximum o..........._
Maxi mum Principal Shear
" " 6 6
.. 'looo 3
+15070 6" +Z:5900 3" 6" o"
Figure ll, Test l: stress contours (psi) on bottom steel plate with restrained edges.
" 9
.. 3
Minimum Principal
IC
Maximum Prine ipa I
~ 0
9
" 6
" 3
Maximum Shear
Figure l2. Test 2: stress contours (psi) on top steel plate with free edges.
·.f:> :J"'o 9 9 Maximum [ij Shear ' ' 'A
~· ~~ :~'-~~~ Do Maximum V ,- f llll., I J.JU I
Princi pa I I
" " l 3 3 I N 0 0
+1230 3• 9" +37!0 6'' 9" 1240 ~;- o"
Figure l3, Test 2: stress contours (psi) on bottom aluminum plate with free edges.

. 9
. G
" 3
" 6
" 3
• 9
" 6
" 3
29
. . 9 9 Maximum
[ta ·~ Shear Minimum Principal
., ., 6 6 ~ •• ~ 12 15
'.ta Maximum
'.£ 0~ . Principal .
Oo 3 3 '.t {f). Oa l' 0
3• 6. 9" 6" 9• 3" 6'' 9''
Figure 14. Test 2: stress contours (psi) on top steel plate with restrained edges .
., . 9 9
Utl Maximum Principal
0 Minimum
" Principal 6 6
#
3
Figure 15. Test 2 : stress contours (psi) on bottom aluminum plate with restrained edges •
0 . 9 9
~ 0
0 Maxi mum Maxi mum Shear
Minimum • Principal " Principal 6 6 5
"''<'oo~ \ ~ q,.
# " 3 3
"<'~
3'' 6'' 9" 3"' 9" 3• 6" 9"
Figure 16. Test 3: stress contours (psi) on top steel plate with free edges.
30
.. 9 9 0 9 w Maximum
Minimum Principe I Shear ''
6 6
" 3 3
0
9" 590 9"
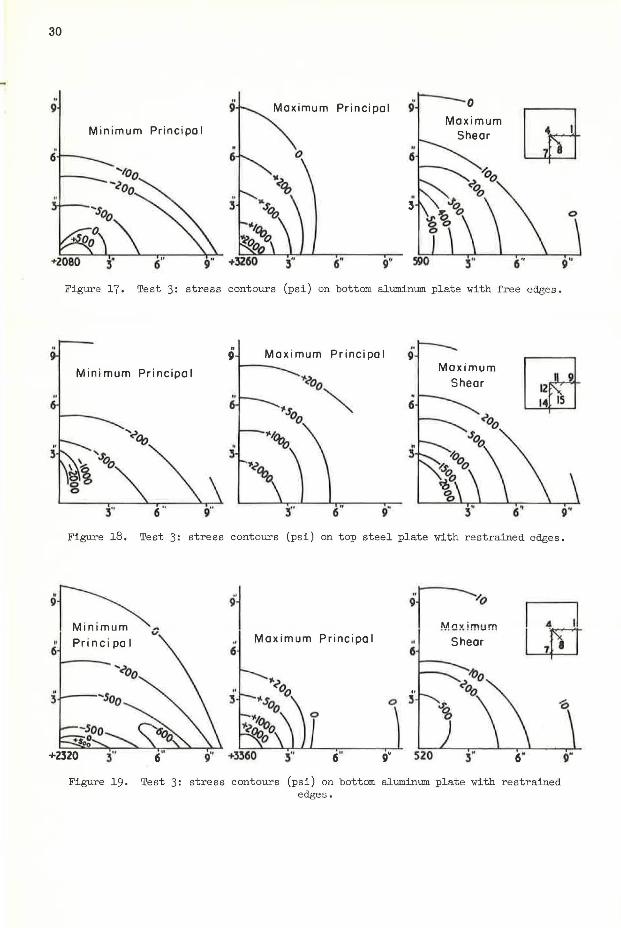
Figure 17, Test 3: stress contours (psi) on bottom aluminum plate with free edges •
9 Maximum Princi po I .. 9
Gro Minimum Principal Maximum ._.<o Shear
.. 0~ . 6 :t.so 6
0
' "~ • 3 3
9"
Figure 18, Test 3: stress contours (ps i) on top steel plate with restrained edges.
-~. •j 9 ,..o
I 4 ,I Mox!mum Maximum Principe I LID " 6
" 3
Principal .. " Shear 6 6
" 3 0 s· \ ~
3'' 9'' 3'' 6" 9' 520 3" 6"
Figure 19. Test 3: stress contours (psi) on bottom aluminum plate with restrained edges.
9"
31
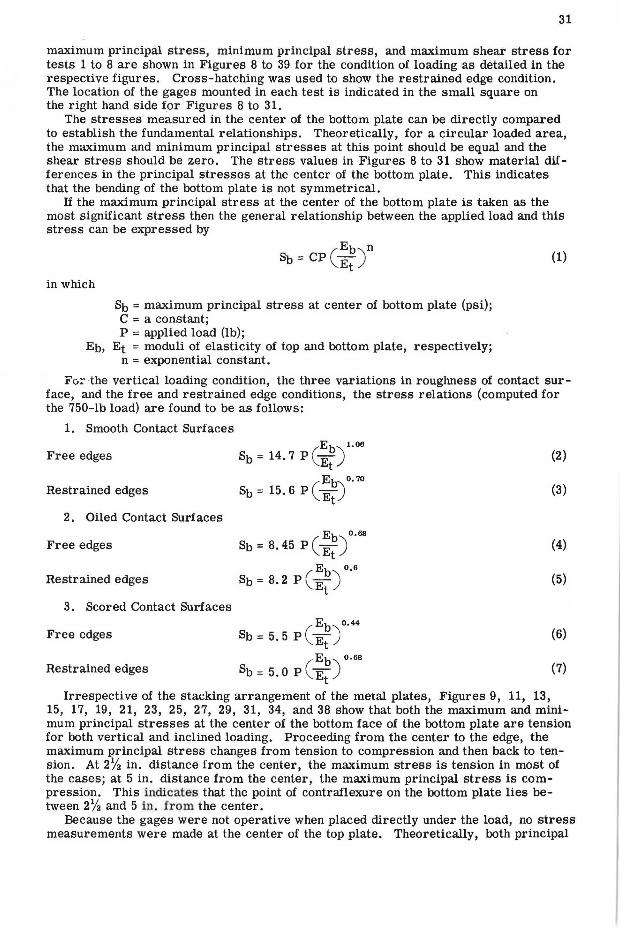
maximum principal stress, minimum principal stress, and maximum shear stress for tests 1 to 8 are shown in Figures 8 to 39 for the condition of loading as detailed in the respective figures. Cross-hatching was used to show the restrained edge condition. The location of the gages mounted in each test is indicated in the small square on the right hand side for Figures 8 to 31.
The stresses measured in the center of the bottom plate can be directly compared to establish the fundamental relationships. Theoretically, for a circular loaded area, the maximum and minimum principal stresses at this point should be equal and the shear stress should be zero. The stress values in Figures 8 to 31 show material differences in the principal stresses at the center of the bottom plate. This indicates that the bending of the bottom plate is not symmetrical.
If the maximum principal stress at the center of the bottom plate is taken as the most significant stress then the general relationship between the applied load and this stress can be expressed by
in which
Sb == maximum principal stress at center of bottom plate (psi); C == a constant; P == applied load (lb);
Eb, Et == moduli of elasticity of top and bottom plate, respectively; n = exponential constant.
(1)
Fo= -the vertical loading condition, the three variations in roughness of contact surface, and the free and restrained edge conditions, the stress relations (computed for the 750-lb load) are found to be as follows:
1. Smooth Contact Surfaces
,Eb)1.oe Free edges Sb == 14. 7 P ~Et
(Eb)o.10
Restrained edges Sb = 15. 6 P Et 2. Oiled Contact Surfaces
Free edges
Restrained edges
3. Scored Contact Surfaces
Free edges
Restrained edges
Irrespective of the stacking arrangement of the metal plates, Figures 9, 11, 13,
(2)
(3)
(4)
(5)
(6)
(7)
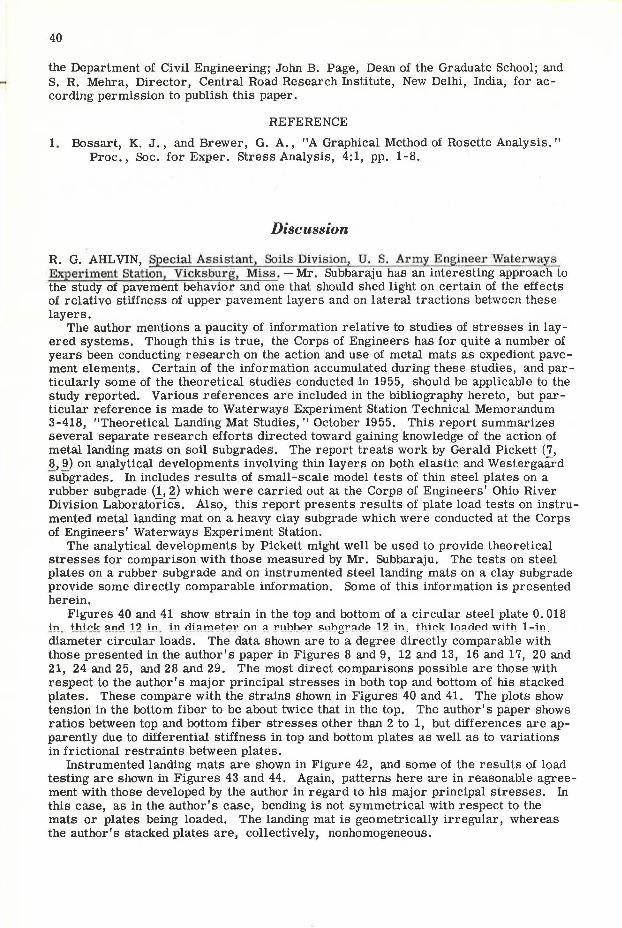
15, 17, 19, 21, 23, 25, 27, 29, 31, 34, and 38 show that both the maximum and minimum principal stresses at the center of the bottom face of the bottom plate are tension for both vertical and inclined loading. Proceeding from the center to the edge, the maximum principal stress changes from tension to compression and then back to tension. At 2% in. distance from the center, the maximum stress is tension in most of the cases; at 5 in. distance from the center, the maximum principal stress is compression. This indicates that the point of contraflexure on the bottom plate lies between 2% and 5 in. from the center.
Because the gages were not operative when placed directly under the load, no stress measurements were made at the center of the top plate. Theoretically, both principal

32
" 6
• 6
N
3
9
Minimum Principal
I I ..,.
8 g 0
6 9"
Maximum Principal
N
6
Maximum@ Shear 3 I
4 7
J'J'
9
Figure 20. Test 4: stress contours (psi) on top aluminum plate with free edges.
Minimum Principal
9 Mox imum Pr incipo I
+9590 9~ i 12700
6
Figure 21. Test 4: stress contours (psi) on bottom steel plate with free edges.
Minimum Principal ·~-
"' V • Maximum
" •..s; 3 00
"o0 Pri nci po I ~ 'b
9"
9~~.Jo
I Maximum Shear
Figure 22. Test 4: stress contours (psi) on top aluminum plate with restrained edges.
33
.. • ~
9 Pr·1nci po I
9 9
@ Minimum Maximum
Shear
• • Maximum Princ i pal .. 6 ~ 6 6
so
• • ,c~ .
5 3 ~ 3 0
+5880 3• 6" o" ... uzso 5'' 6" 9• 2700 6" o" Figure 23 . Test 4: stress contours (psi) on bottom steel plate with restrained edges .
.. 9' .
9 Maximum 9
@ Pr i ncipo I 7s
' " Minimum Pr incipal . ..
6 6 6
.. ~ .. 3 ~ 3 3
~ 0
3• 6" 9" 3" 6" , .. 3" 6" 9"
Figure 24. Test 5: stress contours (psi) on top aluminum plate with free edges .
.. Minimum 9 9 Maximum
wa Principal 0 Shear
0 . Maximum Shear ft
6 6 I
'.;.
3 <b . C, 3
9" 9"
Figure 25. Test 5: stress contours (psi) on bottom steel plate with free edges.
34
I/
9----Minimum
• 6 Principal
3" 6" 9"
,, 9
,, 6 '?
00
"J: It "o 3
.,.,0 Oo 3"
,, Shear 9
0~
Maximum <a Principal 0 ,,
3 :fo. 0
6" 9'' 3" 6'' 9"
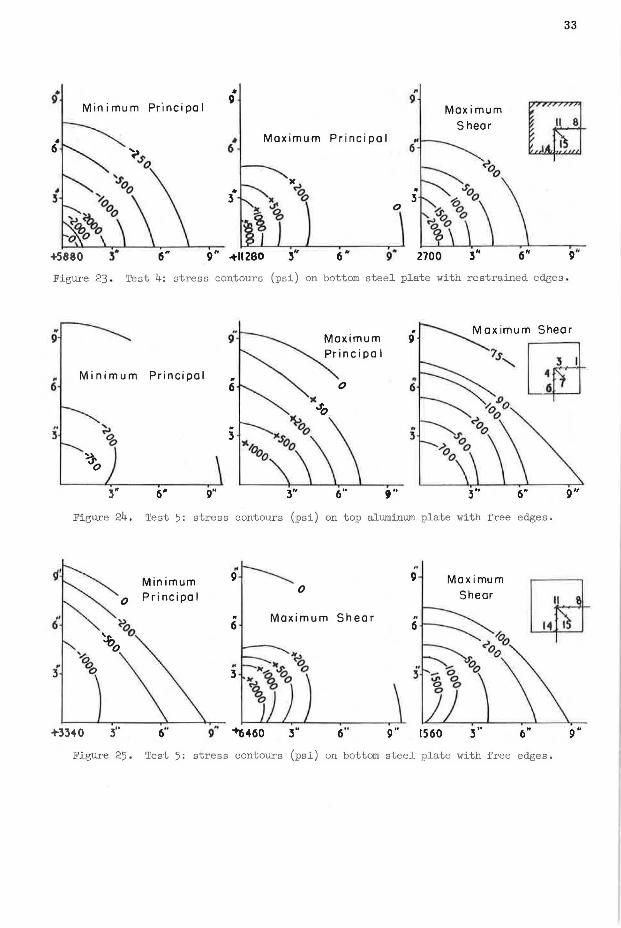
Figure 26. Test 5: stress contours (psi) on top aluminum plate with restrained ec!S<es.
,, ~ ,, Maximum Shear
9 9 9 ·~@ Maximum Princi pol ., ,, ,, ,0 12 6 6 6 0 15
<oo ,, -10 " " 3 Oo 5 3
," +7410
Figure 27. Test 5: stress contours (psi) on bottom steel plate with restrained edges.
9ro~ t, ~
6 o0
-soo
Minimum Princi pol
9''
"r-":::_ 9~imum
-)( ,, c>oo 6 .,.s
Oo ,, 3
Principal
., 3
6''
Maximum Shear
9''
Figure 28. Test 6: stress contoUrs (ps i) on top steel plate with ~ree edges.

" 9
" 6
" 5
" 9
. 6
3
35
h 9 [r3 9 Maxi mum
Maximum xd Shear
I/ Principal Oo 6
1b 'S. Oo
Figure 29. Test 6: stress contours (psi) on bottom aluminum plate with free edges.
Principal \Minim,m
Figure 30,
0
~ g
6'' 9"
Test 6: stress
Minimum Principal
" Maximum Pr i ncipal 9' Maximum 9 Shear
II c>oo 6
Soo • l()a 5 Is. i:,
Oo
5'" 6" 9" 3" 6~
contours (psi) on top steel plate with restrained edges.
9
q
6
0
Maximum Principal
Maximum Shear
Figure 3l. Test 6: stress contours (psi) on bottom aluminum plate with restrained edges .
36
Maximum 8 1
--t---..;:.- /So Minimum 9
Test 8
Test 7 Test 7
9"
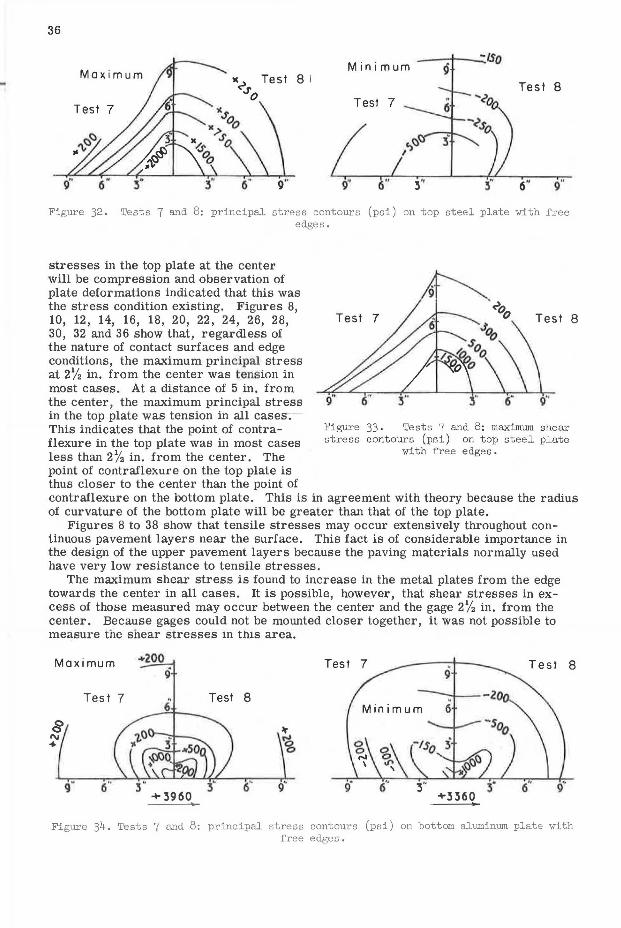
Figure 32. Tests 7 and 8: principal stress contours (psi) on top steel plate with free edges.
stresses in the top plate at the center will be compression and observation of plate deformations indicated that this was the stress condition existing. Figures 8, 10, 12, 14, 16, 18, 20, 22, 24, 26, 28, 30, 32 and 36 show that, regardless of the nature of contact surfaces and edge conditions, the maximum principal stress at 2% in. from the center was tension in most cases. At a distance of 5 in. from the center, the maximum principal stress in the top plate was tension in all case~This indicates that the point of contraflexure in the top plate was in most cases less than 2% in. from the center. The point of contraflexure on the top plate is thus closer to the center than the point of
Test 7 Test 8
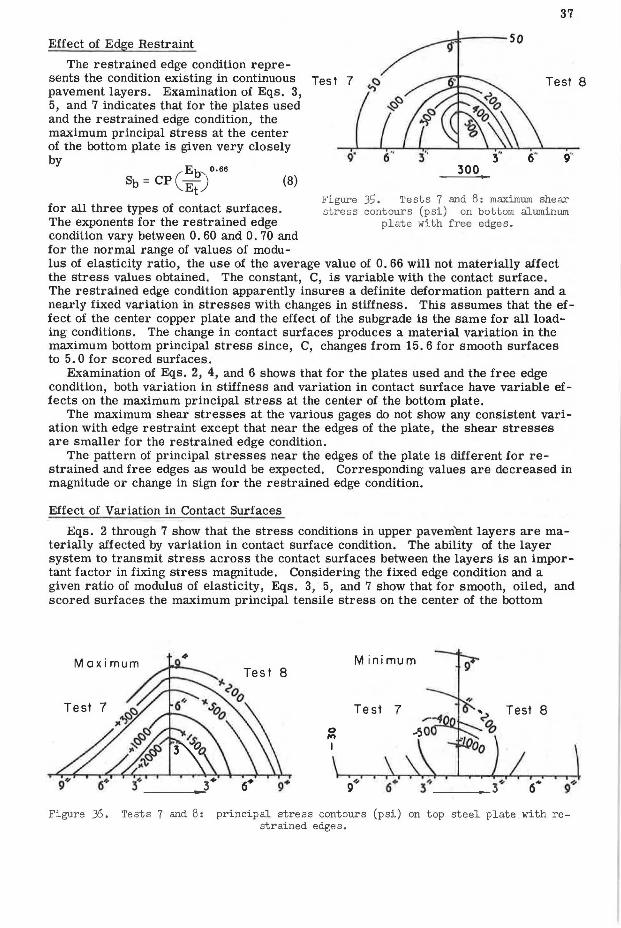
Figure 33. Te sts 7 and 8 : maximum shear stress contours (psi) on top s t ee l plate
wi th free e dges.
contraflexure on the bottom plate. This is in agreement with theory because the radius of curvature of the bottom plate will be greater than that of the top plate .
Figures 8 to 38 show that tensile stresses may occur extensively throughout continuous pavement layers near the surface. This fact is of considerable importance in the design of the upper pavement layers because the paving materials normally used have very low resistance to tensile stresses.
The maximum shear stress is found to increase in the metal plates from the edge towards the center in all cases. It is possible, however, that shear stresses in excess of those measured may occur between the center and the gage 2'/2 in. from the center. Because gages could not be mounted closer together , it was not possible to measure the shear stresses in this area .
Maximum ... 200 9 9
Test 7 i,' Test 8 . Minimum 6
8 ~
"' it, + 0 0 0
l"I \
g" 6" 5· +5960
6" g" 9· 6" 3" +5360
5" 6" 9'•
Figure 34. Tests 7 and 8: principal stress contours (psi) on bottom aluminum plate with free edges.
Effect of Edge Restraint
The restrained edge condition represents the condition existing in continuous pavement layers. Examination of Eqs. 3, 5, and 7 indicates that for the plates used and the restrained edge condition, the maximum principal stress at the center of the bottom plate is given very closely by
(Eb'\ o,66
Sb= CP Et) (8)
for all three types of contact surfaces. The exponents for the restrained edge condition vary between O. 60 and O. 70 and for the normal range of values of modu-
37
Test 7 Test 8
300
Figure 35. Tests 7 and 8: maximwn shear stress contours (psi) on bottom alwninwn
plate with free edges.
lus of elasticity ratio, the use of the average value of 0. 66 will not materially affect the stress values obtained. The constant, C, is variable with the contact surface. The restrained edge condition apparently insures a definite deformation pattern and a nearly fixed variation in stresses with changes in stiffness. This assumes that the effect of the center copper plate and the effect of the subgrade is the same for all loading conditions. The change in contact surfaces produces a material variation in the maximum bottom principal stress since, C, changes from 15. 6 for smooth surfaces to 5. 0 for scored surfaces.
Examination of Eqs. 2, 4, and 6 shows that for the plates used and the free edge condition, both variation in stiffness and variation in contact surface have variable effects on the maximum principal stress at the center of the bottom plate.
The maximum shear stresses at the various gages do not show any consistent variation with edge restraint except that near the edges of the plate, the shear stresses are smaller for the restrained edge condition.
The pattern of principal stresses near the edges of the plate is different for restrained and free edges as would be expected. Corresponding values are decreased in magnitude or change in sign for the restrained edge condition.
Effect of Variation in Contact Surfaces
Eqs. 2 through 7 show that the stress conditions in upper pavement layers are materially affected by variation in contact surface condition. The ability of the layer system to transmit stress across the contact surfaces between the layers is an important factor in fixing stress magnitude. Considering the fixed edge condition and a given ratio of modulus of elasticity, Eqs. 3, 5, and 7 show that for smooth, oiled, and scored surfaces the maximum principal tensile stress on the center of the bottom
Maximum 4' Minimum
8
Test 7 Test 7 Test 8
0 ... I
6+ 6. 9• 9-i, 6. 34 3~ 6 ... 9~
Figure 36. Tests 7 and 8: principal stress contours (psi) on top steel plate with re-strained edges.

38
layer will vary in the order 15. 6, 8. 2, and 5. 0, respectively. Hence, for continuous pavement layers, the conditions existing on the contact surfaces are very important in fixing the critical stresses in the layers.
The maximum shear stresses for both free and restrained edge conditions with smooth contact surfaces are consistently higherthanfor eitheroiledor scored contact surfaces. For the oiled contact surfaces and the scored contact surfaces both free and restrained edge conditions, there are no significant differences in maximum shear stresses except at central gages and gages 27'2 in. from the center.
Test 7
Figure 37. Tests 7 and 8: maximum shear stress contours (psi) on top steel plate
with restrained edges.
Oiled contact surfaces showed higher maximum shear stresses at these gages near the center for both edge conditions. This indicates that surface contact conditions have an important effect on maximum shear stresses, particularly at the locations close to the load.
Effect of Variations in Stiffness
Figures 8 to 31 show that the plate with the highest modulus of elasticity, which is the stiffer plate, has the highest significant stresses regardless of the arrangement of the plates. This is true for all contact surfaces and both free and restrained edges. Stiffness is therefore of fundamental importance as would be anticipated from theoretical calculations. For free edge conditions, Eqs. 2, 4, and 6 show that the effect of stiffness varies as the contact surface conditions change whereas Eqs. 3, 5, and 7 show that the effect is nearly independent of the contact surfaces for the restrained edge condition.
Effect of Inclined Loading
Figures 32 to 39 inclusive show the stress patterns obtained with the inclined loading condition. Figures 28 to 31 inclusive show the stress patterns for the same plate arrangement for vertical load only. The vertical load in each case is 750 lb. The inclined loading condition also imposes a horizontal load equal to O. 2 of the vertical load or 150 lb.
When Figures 32 to 39 are compared with Figures 28 to 31, the major effect of the inclined loading shows an increase in the maximum principal stresses in areas near
'IO Maximum "' 9"' 9 Minimum
Test 7 ,, Test 8 Test 7 Test 8 6
0 0
I 0 !, u,
0
9"' 9" 6+ 6. 9<-+5780
Figure 38. Tests 7 and 8: principal stress contours (psi) on bottom aluminum plate with restrained edges,

39
• 9 the load for both the free edge and restrained edge condition. The increase in the principal tensile stress at the center of the bottom plate is about 50 percent for Test 7 the free edge condition and 100 percent
Test 8
for the restrained edge condition. The maximum principal stresses for
areas near the load on top of the top plate are increased in magnitude (greater tension) whereas the minimum principal stresses are decreased in magnitude (smaller compression) for the inclined load condition and both free and restrained edges. On the other hand, for the bottom of the bottom plate both maximum and minimum principal stresses increase in magnitude for the inclined load condition
Figure 39. Tests 7 and 8: maximum shear stress contours (psi) on bottom aluminwn
plate with restrained edges.
with both free and restrained edges. The stress patterns for maximum and minimum principal stresses are about the same for vertical and inclined loading.
The maximum shear stresses in the top plate are about the same in magnitude for both vertical and inclined loading and for free and restrained edges. The shear stress patterns for the top plate and the inclined loading condition bulge in the direction of the horizontal component. The maximum shear stresses on the bottom plate are increased in the direction of the horizontal component for both free and restrained edges.
The increased tensile and shear stresses due to inclined loading on actual pavement layers are a probable cause of excessive pavement deformation at locations such as street intersections, where much braking of vehicles occurs.
CONCLUSIONS
The studies indicate the following conclusions:
1. The general relationship between the applied load and the maximum principal stress at the center of the bottom layer in a layered system, with no variation in thickness of layers, can be expressed by
in which
Eb n Sb= CP(E)
t
Sb = maximum principal stress at center of bottom plate (psi); C = constant, which is a variable with contact surface and other factors; P = applied load;
Eb, Et = moduli of elasticity of bottom and top plate, respectively (psi); n = variable exponential constant.
2. The stress conditions in upper pavement layers are materially affected by variation in contact surface condition. The maximum stresses in the upper layers are higher for smooth contact surfaces than for rough contact surfaces for the same load.
3. In general increased tensile and shear stresses are noticed in the case of inclined loading when compared to the vertical loading, the total load being the same in both the cases.
ACKNOWLEDGMENTS
This research was a part of the dissertation submitted by the author to the Graduate School of the Agricultural and Mechanical College of Texas, in partial fulfillment of the requirements for the Degree of Doctor of Philosophy. The author wishes to express his gratitude to Fred. J. Benson, Dean of Engineering, under whose expert guidance the work was carried out. The author is grateful to S. R. Wright, Head of
40
the Department of Civil Engineering; John B. Page, Dean of the Graduate School; and S. R. Mehra, Director, Central Road Research Institute, New Delhi, India, for according permission to publish this paper.
REFERENCE
1. Bossart, K. J., and Brewer, G. A., "A Graphical Method of Rosette Analysis." Proc., Soc. for Exper. Stress Analysis, 4:1, pp. 1-8.
Discussion
R. G. AHLVIN, Special Assistant, Soils Division, U. S. Army Engineer Waterways Experiment Station, Vicksburg, Miss. - Mr. Subbaraju has an interesting approach to the study of pavement behavior and one that should shed light on certain of the effects of relative stiffness of upper pavement layers and on lateral tractions betvv"ccn these layers.
The author mentions a paucity of information relative to studies of stresses in layered systems. Though this is true, the Corps of Engineers has for quite a number of years been conducting research on the action and use of metal mats as expedient pavement elements. Certain of the information accumulated during these studies, and particularly some of the theoretical studies conducted in 1955, should be applicable to the study reported. Various references are included in the bibliography hereto, but particular reference is made to Waterways Experiment Station Technical Memorandum 3-418, "Theoretical Landing Mat Studies," October 1955. This report summarizes several separate research efforts directed toward gaining knowledge of the action of metal landing mats on soil subgrades. The report treats work by Gerald Pickett (7, 8, 9) on analytical developments involving thin layers on both elastic and Westergaard subgrades. In includes results of small-scale model tests of thin steel plates on a rubber subgrade (1, 2) which were carried out at the Corps of Engineers' Ohio River Division Laboratories. Also, this report presents results of plate load tests on instI"umented metal landing mat on a heavy clay subgrade which were conducted at the Corps of Engineers' Waterways Experiment Station.
The analytical developments by Pickett might well be used to provide theoretical stresses for comparison with those measured by Mr. Subbaraju. The tests on steel plates on a rubber subgrade and on instrumented steel landing mats on a clay subgrade provide some directly comparable information. Some of this information is presented herein.
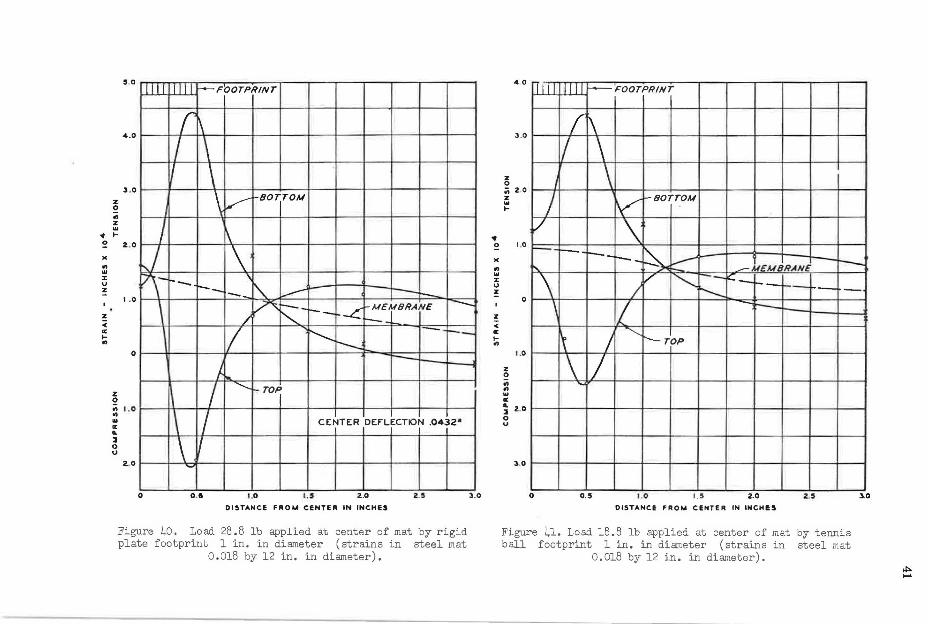
Figures 40 and 41 show strain in the top and bottom of a circular steel plate 0. 018 in . thick and 12 L11 . in diameter O!'l a rubber s11bgrade 12 in, thick loaderl with 1-tn. diameter circular loads, The data shown are to a degree directly comparable with those presented in the author's paper in Figures 8 and 9, 12 and 13, 16 and 17, 20 and 21, 24 and 25, and 28 and 29. The most direct comparisons possible are those with respect to the author's major principal stresses in both top and bottom of his stacked plates. These compare with the strains shown in Figures 40 and 41. The plots show tension in the bottom fiber to be about twice that in the top. The author's paper shows ratios between top and bottom fiber stresses other than 2 to 1, but differences are apparently due to differential stiffness in top and bottom plates as well as to variations in frictional restraints between plates.
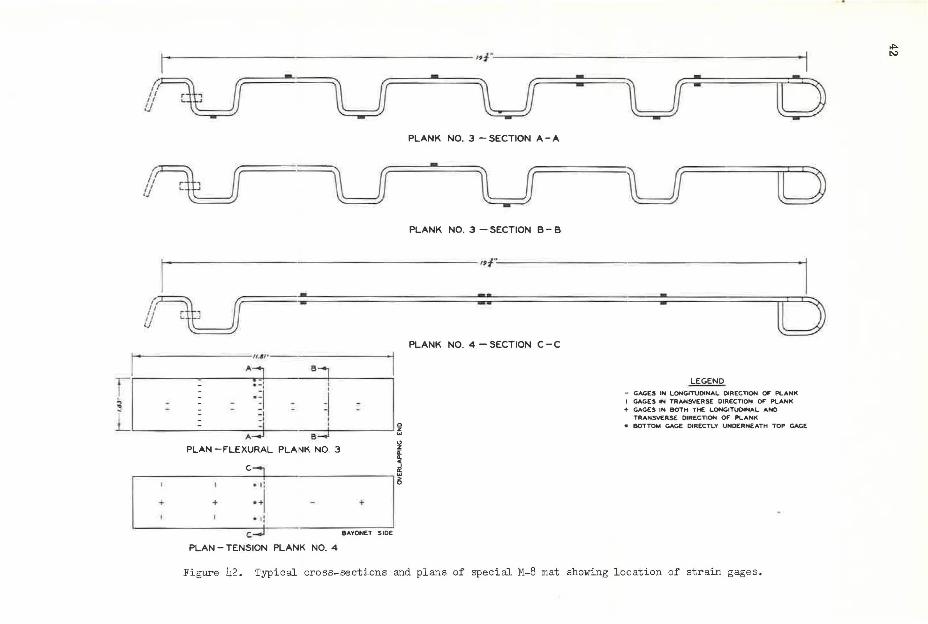
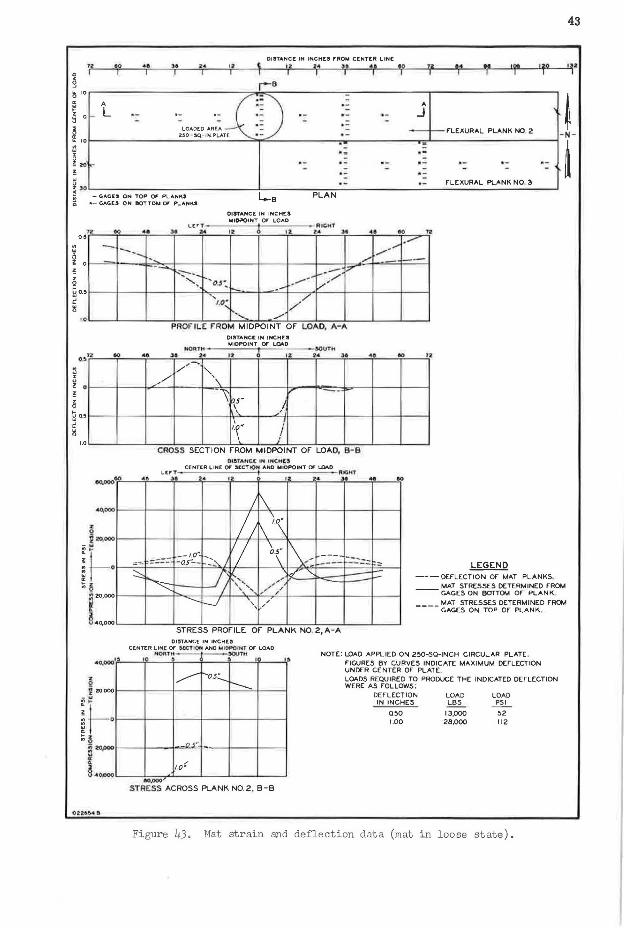
Instrumented landing mats are shown in Figure 42, and some of the results of load testing are shown in Figures 43 and 44. Again, patterns here are in reasonable agreement with those developed by the author in regard to his major principal stresses. In this case, as in the author's case, bending is not symmetrical with respect to the mats or plates being loaded. The landing mat is geometrically irregular, whereas the author's stacked plates are, collectively, nonhomogeneous.
.. ~ )( .. .. JC u !:
5 0 111 1111 f--+--FOOTPRINT
( \ I \
4.0
3 .0
z 0 ..
I \ \ V >-BOTTOM
I z .. I-
2. . 0 \
~I \ P\-~- \ --- -- ~ .---- - --1 . 0
\ ~ -- .-MEMBRANE --z 0
0
/
I ) ...
..........
I"-.
>- TOP
-L::. -- r--_
"I'---.. - r-- -r-- --
I \ \ I
;; 1.0
" .. 0: ... :I 0 u
CENTER DEFLECTION .0432•
\ I -2..0
0 o.a 1.0 I. S 2..0 2..5
DISTANCE FAOU CENTER IN INCHES
Figure 40. Lo ad 28. 8 lb applied at center of mat by rigid plate footprint 1 in. in diameter (strains in steel mat
0.018 by 12 in. in diameter).
3 .0
.. ~
)( .. .. :z: u !:
!: < 0: I-..
40 l 111 1111 ~FOOTPRINT
( I\ I \
3 .0
I \ I V
-BOTTOM 2 ,0
V \ 10
r- r-- r--_ k r--_ I,..--' -r--" -MEMBRANE
/ "' -I':_ f--- ,_ \ / r--- -
0
' I -~ "--
~ I r--- TOP
\ I 1.0
z 0 .; .. ... .. ... 2 .0 :I 0 u
3 .0
0 o.s 1.0 1.5 2..0 2.S DISTANCE FROt.t CENTER IN I .. CHES
Figure 41. Load 16.B lb applied at center of mat by tennis ball footprint 1 in. in diameter (strains in steel mat
0 .018 by 12 i n . in diameter).
3.0
i-------------------- --- ------- ,,·r ----- - -------------------------1
PLANK NO. 3 - SECTION A - A
PLANK NO. 3 - SECTION B - B
1----------- - - ----- ------------ lf/ '-' ------------------ - - --------1
:
------- - ---11~11·-- ---------"11
II _____ Ji----------;]~I, PLAN -FLEXURAL PLAl'IK NO. 3 " z
ii: a. < c--., ffi
.------------+-----------, 1;
:~1 + + +
• ti 8AY0NET SIDE
PLAN - TENSION PLANK NO. 4
::
PLANK NO. 4 -SECTION C-C
:
0 ~
CAGES IN LONGITUDINAL DIRECTION OF PLANK I CAGES IN TRANSVERSE DIRECTION OF PLANK
-t GAGES IN BOTH THE LONGITUDINAL AND TRANS'VERS£ DIRECTION Of' PLANK
• BOTTOM G,AGE DIRECTLY UNOER...CATH TOP CAGE
Figure 42 . Typical cross- se ctions and plans of speci al M-8 mat showi ng l ocation of strain gages .
43
D13TANCE IN INCH£3 P'ROM CCNT!:R LINC .. lO •• t ~ ~4 3f ·,· 'f •• I 1r 1f9 ·1· ~ is ior----------:::,,.;,._,---------::----,-------, i ~ A A
~ o L ·- J ~ 2;~~~~ 1~~E~n F'LEXURAL PLANK NO 2 - N _ ro~----'--'------':.c..:....._..:::a.,.c:::; __ ----=-__ ------r:-L---------1 i ~ .. ~ ·-w u f"LCXURAL PLANK NO. 3 .,.,...__ _______________ _. ____________________________ _.
~ 0
- GAGE.S ON TOP OP' PLANK.S •- GAGES ON BOTTOM or PLANK.S
L-e DISTANCE IN INCHES MJD,IOINT OF LOAD
PLAN
LCrT - ---- -t------AIQHT
a.'r2--"100=----•'fo'---'j~1r---~Mr---;'r2--t---i1f1--',2•'----' .. f-----,40=---'60'f--::;:,-,72
~ - ............. 5 --.......... ,,.,. .. ! of---=""'+---ta·~--~~i-----+--+---+---1--- -+---+:::.-~/"~~==:.:i::=-=~~
---...r,..-::::,-....... ... ......... / :7 ~ ' · 'o,5: -- .• - v' 9 O.!I f-- --t- --1---+-- ;,..,,,-,- -F=----+--..::.:....f-- /-,.+ ---+-- -i- --\----l ~ l.0~ /
,. • .__~ __ ....._ __ ....__~.._ __ _.r-.......... ,,_,_...:;;/_.___~ __ _._ __ ..._ __ .__ _ _,
,,." ""
o•
1.0
00 00,000
% 2 ..... _
_ 5
H-· I;~ ~ 20,000 .. ~40,000
.. ... -% 2 ~ Z0,000
H-· I;! sf ~A0,000
...
••
.
PROFILE F'ROM MIDPOINT OF LOAD, A-A DISTANCE LN INCHES MIDPOINT Of' LOAD
"OllT•-----r------,OUTtt .JI 2., l:l- 0 12 l!I 3a -~ / " / \.
"':'\ ,r --\i!.5"
\ /
' ' ,.o· ! \
CROSS SECTION FROM MIDPOINT OF LOAD, B· B DI.STAlt!CC IN INCttf.-S
LC,-T CCNTCR LINE 0, S<CTt0'1 AND MIDPOINT o, U>lt.O
ftlGH,l ,. ,.- 0 I . ,
Ji\ /; \ .
I\'\ \ .
--1.0" ----
.. ,.
.. IO
v; ~~, ---- :~ / 0\ -=----===::: =~ =---- ·Q5"-- ~--- LEGEND :::::: I) "~ "---- .....
',:,, ----_; ',
, /
/ ' ,
/ , , /
:.,,r, -=::.. -- - DffLCCTION Of MAT PLANKS, MAT STRESSES OCTERMINED f"Ro+.4 GAGCS ON BOTTOM Of" PLANK
MAT STRCSSES DETCRMINED f"ROl.1 GAGCS ON TOP Of" PLANK ,
STRESS PROFILE OF' PLANK N0. 2,A-A DISTANCE IN INCl'1E3
C[Nl'l.R LINE Of MCTIOfl AND MIDPOINT Of LOAD NOATH i )OUTti
'
~ --05::..._
---. o<"
,, 10"
eo.ooo STRESS ACROSS PLANK NO. 2, B-B
• NOT(: LOAD APPLIED ON 250-SQ-INCH CIRCULAR PLATL f"IGURCS BY CURVES INDICATE: MAXIMUM DEfLCCTION UNOCR C[NTCR Of" PLAT[. LOADS RCQUIR[D TO PROOUCC TH[ INDICATCO DCfLCCTION WCRC AS f"OLLOWS;
DffL[CTION IN INCHES
Q50 1.00
LOAD
~ 13,000 28,000
LOAD
~ 52 112
Figure 43. Mat strain and deflection data (mat in loose state).

44
OIHAHClll'IIIICMUf-nHTUllN[Ol'S(C: T IOH ,, I I f 'j ',' ... I J i'
0 L
i :.::ti.~., n.cA.»W.. ,i..,."""' no 3 iN~----,-,-~-,.-,---~--·------~-·~-==~·~·~·~=-------------------~ .... '""-., _..,..._""'~ FIG I- PLAN t,.J • .. • • (lol1t .. _ , ., ,o,o.,
----/ -- - -----~ ' , .._ 1, / i ~•\41---t---t---t---+--+---1--1--+' '->,- ,,-;----1-~1--.. /+--+-rl--1--,1---,1---+---I
\ / /
..
L ..... r -
, ,JG. 2-PROFILE FROM MIDPOINT OF LOAD, A-A
61M:CHOH
" -.. .. .. , . . - .. .. .. " .. M
/ \, -sr.flt,}60,,Gltl ,.,__,, \
I ·- -:fl/<lSS ro, o,,'liti ot.~ I/ \ - :;,~ ,
- i---~ ~", "' ,,)(,.( :-- . OirFLUi /ONOF ~T__.......... - / ,,
' , _,, ' FIG. 3. - DEFLECTION ANO STRESS PROFILE OF PLANK NO 2, C-C
C ... IUTIOtl ,---- ,...,, . " M .. .. .. " " .. ... ... - / "' I l I "<UIKSS -rQMO, ,'IE.iNK
I ' -- -~ i..- srA,u ro,or#f..-
" -- /
\.
', " /-, .,,,
"-, " / .,, ,,
' , _ ---- ~,,,,,. ,r.1'"i'°,o1orjr FIG. 4 - DEFLECTION ANO STRESS PROFILE OF PL ... NK NO 3, 0-0
FIG • .5-0EFLECTION "NO STRESS O"TA "CROSS PLANKS 2 "NO 3 SECTION B-B
NOTC- LOAD APPLl[D ON ~-JQ · INC:H LOADIHC. PLATE.
IIA,tMU W L0,.0 •£QU1•iO TO OBTAIN 100 { NCH O(r ~l .(.'1 IQII ~ ~ ._oortU j .. • J.U
Figure 44. Mat strains and deflection data (mat in l oo se state).

45
It is not meant to infer in this discussion that there is a need to modify the author's analysis, but it is hoped that the author will find the data and references of value in his research.
REFERENCES
1. "Report of Model Tests for Study of Rigidities of Landing Mats." Corps of Engineers, Ohio River Div. Labs., Cincinnati (Sept. 1953).
2. "Report of the First Series of Model Tests for Landing Mats." Corp of Engineers, Ohio River Div. Labs., Cincinnati (April 1953).
3. "Airplane Landing Mat Investigation, Engineering Tests on Steel, Pierced Type, MB, and Aluminum, Pierced Type, M9." Corps of Engineers, Waterways Experiment Station, Technical Memorandum 3-324, Vicksburg, Miss. (May 1951).
4. "Development of Tentative CBR Design Curves for Landing Mats." Corps of Engineers, Waterways Experiment Station, Miscellaneous Paper 4-29, Vicksburg, Miss. (Dec. 1952).
5. "Rolling Resistance Tests on Landing Mat." Corps of Engineers, Waterways Experiment Station, Miscellaneous Paper 4-51, Vicksburg, Miss. (Oct. 1953).
6. "Traffic Tests on Metal and Vinyl Membranes." Corps of Engineers, Waterways Experiment Station, Miscellaneous Paper 4-54, Vicksburg, Miss. (Oct. 1953).
7. Pickett, G., "Deflections, Moments and Reactive Pressures for Concrete Pavements." Kansas State College, Bull. 65 (Oct. 1951).
8. Pickett, G., "Analytical Studies of Landing Mats for Forward Airfields." Kansas State College (Dec. 1951).
9. Pickett, G., "Analytical Studies of Orthotropic Landing Mats for Forward Airfields." Kansas State College (Sept. 1953).