model, software for calculation of flammability limits and its ......safekinex - deliverable no. 19...
TRANSCRIPT

PROGRAMME “ENERGY, ENVIRONMENT AND SUSTAINABLE DEVELOPMENT”
Project SAFEKINEX: SAFe and Efficient hydrocarbon oxidation processes by KINetics and Explosion eXpertise
Contract No. EVG1-CT-2002-00072
Model, software for calculation of flammability limits and its validation
Deliverable No. 19
M.A. Silakova, V. Smetanyuk, H.J. Pasman
Delft University of Technology
April 2007

SAFEKINEX - Deliverable No. 19 - Model, software for calculation of flammability limits and its validation page i
Table of Contents: 1 INTRODUCTION ............................................................................................................................. 1
1.1 GENERAL.................................................................................................................................................... 1 1.2 SPECIFICS ON THE UPPER EXPLOSION LIMIT ............................................................................................ 2 1.3 INFLUENCE OF TEMPERATURE AND PRESSURE ON UEL, EXPERIMENTAL VALUES .................................... 3
2 VARIOUS SIMPLE APPROACHES .............................................................................................. 6
2.1 F-NUMBER METHOD................................................................................................................................... 6 2.2 CAFT CALCULATION.................................................................................................................................. 7 2.3 MIXTURE RULE AND ACTUAL CALCULATION............................................................................................... 9
3 MODEL TO CALCULATE MINIMUM PLANAR LAMINAR BURNING VELOCITY ...... 10
3.1 THE CHEMKIN PREMIX MODEL ............................................................................................................. 10 3.2 PRODUCT AND INTERMEDIATE SPECIES................................................................................................... 11 3.3 TEMPERATURE PROFILE .......................................................................................................................... 11 3.4 A BRIEF SUMMARY ON MODIFIED DAMPED NEWTON’S METHOD AND JACOBIAN MATRIX .................... 12 3.5 CALCULATING LAMINAR BURNING VELOCITY ........................................................................................... 13
4 MINIMUM IGNITION ENERGY MODEL, SPHERICAL FLAME BALL ............................ 15
5 SIMULATION BY COMPUTATION FLUID DYNAMICS ...................................................... 16
6 CONCLUSIONS.............................................................................................................................. 17
7 REFERENCES ................................................................................................................................ 17
APPENDIX I............................................................................................................................................. 21

SAFEKINEX - Deliverable No. 19 - Model, software for calculation of flammability limits and its validation page 2 (21)

SAFEKINEX - Deliverable No. 19 - Model, software for calculation of flammability limits and its validation page 1 (21)
1 Introduction 1.1 General The lower and upper explosion (also called flammable) limit are the highest (from the fuel lean side) and lowest (from the fuel rich side) concentration (in mol%) of a flammable gas (fuel) in gaseous mixture, in which a flame just fails to propagate after ignition trial. Prediction of explosion/flammability limits is of great practical significance to safety decision making. Whereas many data exist for pure substances at atmospheric conditions and ambient temperature, much less information is available on fuel mixtures and on behaviour at elevated conditions. Therefore in the SAFEKINEX project an extensive experimental programme has been carried out, of which the results are reported in Deliverables Nos. 8 and 9 [1, 2]; some comments regarding the results are made in Deliverable No. 10 [10] while the data collected are accessible via LabViewer produced as Deliverable No. 12 [31]. Since this programme although extensive, has its limitations as e.g. only a small selection of pure substances could be tested, a reliable model with which also the properties of a mixture can be predicted would therefore be very welcome. Unfortunately there are a number of inherent problems associated with determining explosion limits and with modelling these. In the first place there is the experimental determination of the flammability limit which is not unambiguous. Whether a flame propagates after an attempted ignition depends on a number of factors in addition to the composition such as the volume, shape and the position of a vessel with respect to the gravity field, and the location and power of ignition. In various studies e.g. by Takahashi [3] and in SAFEKINEX Deliverable No. 2 [4] these problems have been analysed. Too small a vessel can cool an incipient flame and cause it to be extinguished, while due to buoyancy of the hot gas a flame has a preference to propagate upward. In marginal cases, a flame can propagate upwards but cannot grow laterally anymore. In particular, when flammability limits have to be determined at higher pressures, the choice of vessel is essentially restricted to a closed spherical one, which, because of the high explosion pressures possible, by preference does not contain a viewing port. The occurrence of explosion has then to be decided on a certain pressure increase. In defining a standard for flammability testing this pressure criterion has been discussed for a long time. De Smedt et al.[5] have compared two test methods at atmospheric pressure: the vertical glass tube according to DIN 51649 [7] which can be regarded as the forerunner of the present European standard EN 1839 [8] and a spherical 20 l steel vessel. The first test method is based on a visual observation of a flame propagation, the second one is based on a pressure increase. The ASTM standard ASTM E918-83 [6] considers a pressure increase of 7% as just explosive, while the European criterion states that a pressure increase of 5% is just not explosive. De Smedt et al. [5] present examples with methane, ethane, propane and butane mixtures in air and concluded on the basis of upward propagation in the tube that a 2% pressure criterion for a 20 l vessel would be right. However, particularly in smaller vessels, 2% will not be discriminative enough since the reaction as a consequence of the igniting energy pulse will be sufficient to generate such pressure rise; therefore the European standard has chosen 5% and prescribed a minimum vessel volume of 5 l. Another uncertainty is the effect of turbulence. Usually the determination of the explosion limits is performed in quiescent mixtures. Turbulence will have however a strong influence on flame behaviour as has been described in a wealth of literature on combustion and flame. In the SAFEKINEX project in Deliverable No. 11 [11] it is shown how turbulence can increase the explosion severity as a result of increased energy release rate in the perturbed flame brush. On the other hand the minimum ignition energy increases in a gas in which turbulence is generated and also flame can be quenched by turbulence; both facts are shown in Deliverable
SAFEKINEX - Deliverable No. 19 - Model, software for calculation of flammability limits and its validation page 2 (21)
No. 7 [12]. It is therefore to be expected that the effect of turbulence on ignition will be particularly strong for the marginal flame near the limit of flammability. For the practice of process safety in flowing systems this will be an important question. Few studies have been done in this respect. A study to be mentioned here is that by Horstmann et al. [13] on the influence of turbulence on the ignitability of flowing methane-air and propane-air mixtures. The experiments done showed a slight decrease of the upper explosion limit and increase of the required minimum ignition energy (MIE) with increasing flow velocity. However with increased turbulence level MIE strongly increased as also found here (Deliverable No. 7) [12]. The above shows how the basis of validation of a model of the explosive range by experimental determination has its limitations. The uncertainties in modelling are, however, even worse; this is particularly true for the upper explosion limit. For safety reasons the requirement should be put that tolerance/uncertainty should be one-sided, i.e. towards lower composition at the LEL and to higher at the UEL. In principle the following options for calculation as a function of composition are open: 1. Empirical method: F-number determination [14] 2. Adiabatic flame temperature, or CAFT [15, 16, 17] 3. Minimum laminar burning velocity able of stable propagation [19, 22, 23] 4. Modelling a minimum ignition energy resulting in a stable, spherical flame [24] 5. Reactive flow CFD simulation of an ignition trial [26] In general it can be stated that modelling efforts are scarce. For the lower explosion limit at atmospheric conditions these efforts have had some success. In that case reaction kinetics does not play a dominant role, which simplifies matters considerably. The upper explosion limit is even more difficult to tackle. In Chapter 2 first the F-number, then the CAFT approach and finally the other options will be briefly described. 1.2 Specifics on the Upper Explosion Limit In particular at the upper explosion limit there is the problem of the changing kinetics and low reactivity of the mixture. Cut-off at the fuel lean side, hence the lower explosion limit, is usually rather sharp: There is clearly flame propagation or there is not. In contrast at the upper explosion limit, reaction in a flame is not anymore predominantly to carbon dioxide and water, but mainly to carbon monoxide and hydrogen while depending on composition and other conditions also an amount of soot is formed. Since the ignition device is in the centre of the vessel and in a near-limit situation ignition energy has to be large and reactivity beyond the upper limit is not nil, there will always be a hot pocket of reacting gas around the ignition device at ignition trial. As a result of the lower density of the heated gas this hot bubble will rise by natural convection, will contain partial oxidation products and will cool at the top of the vessel. The gas will also expand and there will be a certain pressure increase. In case a flame zone develops such near-limit flame trails first also slowly upwards, but should then come down, and in case of fuel rich mixture under further formation of soot. In Deliverable No. 10 [10] pictures are shown of the rising flame ball near UEL in comparison with stoichiometric conditions and various other typical observations near the UEL are revealed. In Deliverable No. 29 [9] it was argued that in case of less reactive hydrocarbons as e.g. the higher alkanes such as n-butane, it is not certain that a real hot flame is formed at all, since there have been strong indications of the formation of typical cool flame products as formaldehyde. Also the rates of pressure rise values at these near limit explosions are extremely low. Considering the above in Deliverable No. 10 [10] a scale is suggested that can be used to estimate the extent of hazard in the context of damage consequence of an ignition in process equipment. This can help decision making whether such marginal flame can be tolerated in view of the pressure resistance of the equipment, the volume and shape of it.

SAFEKINEX - Deliverable No. 19 - Model, software for calculation of flammability limits and its validation page 3 (21)
1.3 Influence of temperature and pressure on UEL, experimental values Of practical interest is the influence of initial temperature T and pressure p on the UEL. Vanderstraeten et al. [36] did an experimental study of pressure and temperature dependence on UEL of methane-air mixtures. More recent a study of the same group on the UEL of lower alkanes and alkenes has been published by Van den Schoor and Verplaetsen [29]. Since the range of conditions of pressure and temperature is in the area of interest of the SAFEKINEX project results will be briefly reviewed here and compared. SAFEKINEX Deliverables Nos. 8 and 9 [1, 2] considered also the effect of test vessel volume. The methane tests have been carried out in a spherical 8 l vessel and the other experiments have been performed in a 4.2 l vessel; the latter is just below the minimum volume required by standard EN 1839 [8], also the ignition was slightly different and as a criterion for explosion a 1% pressure rise was applied instead of 5% (or in case of methane a 2 oC temperature rise). The influence of T and p on LEL is small in absolute terms (almost within the limits of uncertainty in the determination of LEL in various equipments); UEL values, though, will shift to higher concentration with increasing temperature and pressure considerably. As regards temperature the authors propose a linear relationship of the form:
UEL(T) = UEL(T0) {1 + c(T - T0)/100} (1a)
where T is the initial temperature, T0 is the reference temperature, here 20 oC and UEL(T0) is the explosion limit at ambient temperature and c is a coefficient of which the value is determined from a linear fit to the data points. In fact the authors follow here the modified Burgess-Wheeler law [32] based on the assumption that at higher temperature of the medium the temperature jump to enable flame propagation can remain smaller. Since higher pressure increases heat production per unit of volume whereas heat conductivity stays the same, and also because reaction kinetics are on average higher than first order, UEL will shift with pressure to higher fuel concentration. Vanderstraeten et al. [36] propose for methane-air a parabolic relation of UEL with the pressure ratio relative to the atmospheric UEL value, which is quite satisfactory. Van den Schoor and Verplaetsen [29] suggest a linear relationship for pressure increase similar to their one for temperature, but this holds only up to a certain point. Above a certain pressure which is different for the various hydrocarbons the pressure effect vanishes and UEL keeps a more or less constant value. Zabetakis [33] suggests a relation in which to the UEL at 1 bara the logarithm of pressure times a coefficient is added. However, a fit as expressed in equation 1b, with an exponent value b varying between 0.55-0.65 appeared for the hydrocarbons higher than CH4 to be rather successful (For CH4 about 0.25). UEL1 is a constant with a value matching the upper explosion limit at 1 bar. This will be shown in section 1.3. below.
UEL(p) = UEL1 + 10pb (1b)
The combination of higher pressure and temperature causes cool flame to occur (at least aldehydes were found to be produced) as noted earlier in the SAFEKINEX project too, Deliverable No. 29 [9], and finally the mixture will auto-ignite. A comparison of the fit of Vanderstraeten et al. [36] for the temperature dependency of UEL of methane at 1 and 10 bara as reported in Deliverable No. 8 [1] is shown in Figures 1a and b. In the Tables and Figures following the data collected by Van den Schoor and Verplaetsen [29] are summarized and compared to experimental data collected in this project.

SAFEKINEX - Deliverable No. 19 - Model, software for calculation of flammability limits and its validation page 4 (21)
0
5
10
15
20
25
30
0 20 40 60 80 100 120 140 160 180 200 220 240 260initial temperature [°C]
CH
4 [m
ol-%
]BAM 2.8-dm^3 BAM 6.0-dm^3 BAM 14.0-dm^3 TUD 20-dm^3BASF 20-dm^3 WUT 40-dm^3 WUT 1250-dm^3 INERIS 2000 dm^3
0
5
10
15
20
25
30
35
0 20 40 60 80 100 120 140 160 180 200 220 240 260initial temperature [°C]
CH
4 [m
ol-%
]
BAM 2.8-dm^3 BAM 6.0-dm^3 TUD 20-dm^3 INERIS 2000 dm^3
Figures 1a and b: Temperature dependence of the explosion limits of methane/air mixtures at an initial pressure of 1 bara, determined in different volume (Deliverable No. 8 [1]). The line shows the fit for the UEL according to Vanderstraeten [36] with c-values of 0.0854 for 1 and 0.1530 for 10 bara.
Tables 1a and b: Ethane-air respectively ethylene-air experimental UEL- values for a number of pressures at ambient temperature in mol% according to Van den Schoor and Verplaetsen [29] and eqn. (1a) fit coefficient c
p [ E c UESabara] U L(T0)
L 14 l fekinex
1 15 0.1 13.3 15 .2 3 18 0.2 .2 26
6 22 0.2 .5 14 10 26 0.2 19.0 69 .0 15 30 0.3 .5 01 20 33 0.3 24.8 68 .1 25 38 0.3 .1 39 30 41 0.2 31.9 80 .5
C2H6 -air: UEL(T)=UEL(T0){1+c(T-T0)/100}
0
10
20
30
40
50
0 10 20 30 40Pressure [bara]
UE
L(T
0)
0,0
0,1
0,2
0,3
0,4
0,5
c
UEL(T0) c
p [ E c UESabara] U L(T0)
L 20 l fekinex
1 34 0.1 29.7 56 .6 3 43 0.1 .5 38 5 44.6 6 47 0.1 .7 72
10 52 0.1 52.7 86 .2 15 58 0.1 .9 63 20 64 0.1 .1 28 25 66 0.1 .3 32 30 68 0.1 .2 18
C2H4 -air: UEL(T)=UEL(T0){1+c(T-T0)/100}
0
20
40
60
80
100
0 10 20 30 40Pressure [bara]
UEL
(T0)
0,0
0,1
0,2
0,3
0,4
0,5
UEL(T0) c
Figures 2a and b: UEL(T0) of ethane-air respectively ethylene-air versus pressure and a plot applying the fit constant c for T dependency in Eqn. (1a) at various pressures.
C2H6 -air UELp=UEL1+10p0,6
0
10
20
30
40
50
0 10 20 30 40
Pressure [bara]
UEL
(T0)
Experimental
Fitted
C2H4 -air UELp=UEL1+10p0,65
0
20
40
60
80
100
0 10 20 30 40
Pressure [bara]
UEL(
T 0)
Experimental
Fitted
Figures 2c and d: UEL(T0) of ethane-air respectively ethylene-air versus pressure and a fit according to Eqn. (1b). The exponent value of 0.6 gave for ethane the best fit and 0.65 for ethylene.

SAFEKINEX - Deliverable No. 19 - Model, software for calculation of flammability limits and its validation page 5 (21)
Tables 2a and b: Propane-air respectively propylene-air experimental UEL values at ambient temperature in mol% according to Van den Schoor and Verplaetsen [29] at various pressures and eqn. (1a) fit coefficient c
p [ E c UESabara] U L(T0)
L 14 l fekinex
1 10 0.1 9.8.4 38 3 12 0.2 .6 34 5 6 16 0.3 .3 44
10 20 0.4 15.7 16 .1 20 22.1
C3H8 -air: UEL(T)=UEL(T0){1+c(T-T0)/100}
0
5
10
15
20
25
0 5 10 15Pressure [bara]
UEL
(T0)
0
0,1
0,2
0,3
0,4
0,5
c
UEL(T0) c
p [ E c UESabara] U L(T0)
L 20 l fekinex
1 12 0.1 11.7 28 .0 3 13 0.1 .7 91 5 14.0 6 16 0.3 .5 36
10 22 0.2 19.3 63 .0 30 65.0
C3H6 -air: UEL(T)=UEL(T0){1+c(T-T0)/100}
0
5
10
15
20
25
0 5 10 15Pressure [bara]
UE
L(T
0)
0
0,1
0,2
0,3
0,4
0,5
c
UEL(T0) c
Figures 3a and b: UEL(T0) of propane-air respectively propylene-air versus pressure and a plot applying Eqn. (1a) and the fit constant c for T dependency.
C3H8 -air: UELp=UEL1+10p0,55
0
5
10
15
20
25
0 5 10 15
Pressure [bara]
UE
L(T 0
)
Experimental
Fitted
C3H6 -air: UELp=UEL1+10p0,55
0
5
10
15
20
25
0 5 10 15
Pressure [bara]
UEL
(T0)
Experimental
Fitted
Figures 3c and d: UEL(T0) of propane-air respectively propylene-air versus pressure and a fit according to Eqn. (1b). The exponent value of 0.55 gave the best fit for both propane and propylene. Table 3a: n-Butane-air experimental UEL values at ambient temperature in mol% [29] and fitted eqn. (1a) coefficient
p [ E c UE
Sabara] U L(T0) L 6 l
fekinex 1 9.6 0.1 9.513 3 11 0.2 .5 02 5 10.2
Table 3b: UEL(T0) of n-butane-air versus pressure and a fit according to Eqn. (1b). The exponent value of 0.55 gave the best fit.
p [bara] UEL(T0) UELp=UEL1+10p0,55
1 9. 9.6 5 3 11 12.5 .5
At 1 bara the increase in UEL with higher temperature up to the highest value of 250 oC at which could be measured, is linear [29]. The influence of pressure starts also to be linear, even at higher temperatures, but levels off at higher pressure. The point of deflection appears for the alkenes at lower pressure than for the alkanes. The mechanism will be that increasing

SAFEKINEX - Deliverable No. 19 - Model, software for calculation of flammability limits and its validation page 6 (21)
initial temperature requires less heat to be produced to enable the flame to propagate and hence at UEL less oxygen is needed for combustion. With the longer carbon chains above a certain temperature cool flames will cause the limit to increase further. Higher pressure increases the rate of critical reactions (all of first order). This effect will however diminish in strength and even vanish when pressures continue to increase. Unfortunately fit coefficient c does not appear to be constant with pressure. For comparison the UEL values [mol%] found in the SAFEKINEX project [1, 2] have been included in the Tables with an indication of vessel volume (UEL V l Safekinex). The more stringent pressure increase criterion shows its effect; UEL Safekinex values tend to be lower.
2 Various simple approaches 2.1 F-number method The F-number method has been proposed some years ago by Kondo et al. [14] and is applicable to any of the organic gases whose molecular structure can be described by CiHjOkFlClmBrnNp. F-number is an index based on the definition:
F = 1- (U/L)½ (2)
where U is the upper explosion limit and L is the lower one. The value of F provides a classification measure: 0-0.2 is classified as just flammable, 0.2-0.4 as weakly flammable, 0.4-0.6 normally flammable, 0.6-0.8 strongly and 0.8-1 as super flammable. To calculate an F-number an analytical expression can be used on the basis of the molecular structure: Length of carbon chain, number of unsaturated bonds, ring structures and substitution of H by various groups. From 238 organic substances U and L data have been collected and the group contributions on the F-number derived. This results in 17 parameter values, from which the F-number can be recovered through an equation of the form:
F = p1(1 + p2C1 + p3ROE + p4RCO + p5RCOO + p6RNH + p7RRNG + p8RARM + p9RUS)(1 + p10RF + p11RCl + p12RBr + p13ROH + p14RNO2 + p15RNH2 + p16RCN + p17RCOOH) (3)
where p1 – p17 are coefficients; C1 takes in general the value 0, but in case of mono-carbon skeletons it is 1, except for the methane derivatives containing CO, COO, CN or COOH, for which C1 is also 0. R is the number of ether groups (OE), carbonyl (CO), ester (COO) and imine (NH) resp. divided by the number of carbon atoms in the skeleton. In case of aliphatic rings (RNG) or aromatic rings (ARM) R is the number of rings divided by the number of carbon-atoms per ring. Finally RUS denotes the number of double bonds per molecule divided by the number of carbon atoms. All others denote the number of respective atoms divided by the number of H atoms in the corresponding pure hydrocarbon molecule. For pure hydrocarbons as we consider here, the parameter values are:
p1 = 0.581 and p2 = −0.194 (4)
If the geometric mean of the values of U and L is known the limit values can be obtained from the F-number according to:
L = (UL)½(1-F) and U = (UL)½ /(1-F) (5)
For the geometric mean a correlation is sought with the stoichiometric concentration Cst. This concentration can be obtained from the molecular structure. For a simple hydrocarbon CiHj in air it follows in mole fraction from:
Cst = 1 / [1 +4.773{i + (j/4)}] (6)
SAFEKINEX - Deliverable No. 19 - Model, software for calculation of flammability limits and its validation page 7 (21)
It further turns out that Cst is not directly proportional to (UL)½ but a correlation between the deviation ∆ and the molecular weight M was found for the 238 substance data investigated:
(UL)½ = (1 + ∆) Cst in which ∆ = 0.00472(M-32.00) (7)
The correlation can now be used to make fairly reliable predictions, at least when it is applied to mixtures with air at 1 atmosphere and normal ambient temperature. Results for the hydrocarbons tested in the SAFEKINEX programme have been collected in the two most left columns of Table 4 and compared with the experimental values found (with arbitrary preference given to the 20 l vessel values). The prediction shows in general a bias to somewhat lower values at LEL and higher at UEL except for ethylene and n-butane. The difference in case of ethylene is significant. The authors of [14] determined an overall mean deviation between F-number derived from measured data and calculated ones according to the method above, of 0.047 mol% or 9.2% of the overall average LEL value. Significant difference, in particular for the UEL, is therefore possible, however measured data show in itself a large disparity, since outcomes of tests depend on many factors as explained e.g. in Deliverable No. 2 [4]. On top of that comes the uncertainty in case of the upper explosion limit as explained in section 1.2 before. In a later paper Kondo and co-workers [35] analysed the differences observed also after having performed more measurements. They distinguished three groups: The first group concerns four substances of which newly measured values agree with literature data but not with predicted ones; a second, largest group of 13 substances in which the newly measured values agree with predicted ones but not with literature data, and a third of 6 where no agreement is found with literature nor prediction. The groups contain many oxygenated substances, such as alcohols, ethers, esters, (propylene-)oxide, and amines and some highly unsaturated compounds, but no alkanes or alkenes as investigated here. 2.2 CAFT calculation Recent publications [15, 16, 17] focussed on the reliance of a model based on a minimum value of a Calculated Adiabatic Flame Temperature or CAFT to support a flame. CAFT is the increase in temperature obtained without heat losses. Shebeko et al. [15] developed a method to calculate the lower flammable limit by solving equations based on the elementary composition of the fuel, the enthalpies of reactants and products at initial and final temperature and assuming full conversion of the fuel. Coefficients used in these equations were taken from earlier papers. A temperature increase in a flame of about 1600 K seems to be a critical condition for flame propagation in mixtures at atmospheric pressure if calculated on the basis of all carbon to be oxidised to carbon dioxide and water (vapour). For the smaller molecule such as methane and ethylene the critical CAFT tends to be lower. (If at the UEL only carbon monoxide is assumed to be formed a CAFT value of about 1000 K would suffice.) Mashuga and Crowl [16] studied methane and ethylene oxygen/nitrogen systems and used commercial software, EQS4WIN to calculate the CAFT values. Since the oxidation rate of CO to CO2 produces relatively much heat, essential for propagation, they arrive at 1200 K as a minimum temperature. The rate of this reaction becomes only appreciable above 1100 K. Vidal et al. [17] investigated a series of C1-C16 alkanes and C2-C5 alkenes. They followed on the one hand the (algebraic) method by Shebeko et al. [15] which is based on determining the amount of fuel required to obtain a temperature increase of 1600 K considering the formation of CO2, H2O, C and H2 and applying equations with fixed coefficients reflecting the optimum thermodynamic equilibrium of which values were developed in earlier Russian work.

SAFEKINEX - Deliverable No. 19 - Model, software for calculation of flammability limits and its validation page 8 (21)
However Vidal et al. at the same time calculated a CAFT by means of the SuperChemsTM4 software which is based on minimization of Gibbs free energy. When using the algebraic Shebeko method for a certain mixture firstly a CAFT temperature was calculated with SuperChemsTM4 at the experimentally known LEL. Subsequently the average temperature is derived between this and the initial mixture temperature. The heat capacity of the products needed for solving the Shebeko equations was approximated by a constant value at the average temperature between the initial gas and the adiabatic flame temperature. This yields a quick estimate of the product enthalpies, which then can reproduce by the algebraic method a LEL value based on the assumption made. They showed that the assumption of constant heat capacity reproduced the experimental LEL value, taken as starting point, reasonably well. The CAFT can also be used directly by applying the adiabatic temperature jump criterion at the explosion limit of e.g. 1600 K. Obviously deviations from the experimental value are then larger. No real advantage relative to the F-number method is obtained. Table 4: Calculated explosion limits on the basis of the F-number, calculated adiabatic flame temperatures (CAFT) [K] at the explosion limits in air and the LEL derived from CAFT. Fuel EL %
Kondo [14] Calculated
via F-number
EL % Kondo [14] Experiment Literature
sources
EL % Experiment Deliverables Nos. 8 or 9
[1, 2]
CAFTLFL [K]
Del No. 16
[21]
CAFTUEL [K]
Del No. 16
[21]
CAFTLFL [K]
Vidal [17]
LEL %
Calc. Vidal [17]
Atmospheric pressure, 293 K
LEL UEL LEL UEL LEL UEL LEL
Hydrogen 4.0 77.0 4.1 77.2 459 1059 Methane 4.7 16.5 5.0 15.0 5.0 15.3 1514 1852 1482 5.0Ethane 2.3 13.4 3.0 12.5 2.8 13.2 1496 1348 1534 3.0Ethylene 2.1 19.2 2.7 36.0 2.8 29.6 1426 1269 1369 2.7Propane 1.8 10.2 2.1 9.5 2.0 9.8 1515 1322 1530 2.1Propylene 1.7 12.9 2.0 11.1 2.0 11.0 1459 1529 1621 2.4n-Butane 1.5 8.4 1.6 8.4 1.5 9.5 1480 959 1640 1.8 CO 17.4 60.2 1834 1789 Ammonia 13.4 42.5 1535 1232 1 bar, 493 K Hydrogen 3.2 82.2 346 823 Methane 4.2 18.2 1258 1478 Propylene 2.0 15.0 1398 1152 10 bar, 293 K
Hydrogen 4.9 72.8 542 1238 Methane 5.2 22.0 1563 1172 Propylene 2.0 19.0 1459 1193 The CAFT can be calculated by various other software packages such as GASEQ [18], CHEMKIN [19] and Chemical Workbench [20]. In project SAFEKINEX a simple-to-use package has been produced as Deliverable No. 16, Explosion Pressure, ExplPress [21]. It can be noticed that for normal conditions of atmospheric pressure and 20oC in case of calculation with ExplPress an adiabatic temperature increase of 1500 K seems to provide a

SAFEKINEX - Deliverable No. 19 - Model, software for calculation of flammability limits and its validation page 9 (21)
reasonable value as a critical criterion, at least with these lighter hydrocarbons. This is lower than the value used by Shebeko et al. [15] and Vidal et al. [17], but higher than that of Mashuga and Crowl [16]. This may be caused by the assumed product composition of the combustion. The fuels hydrogen and carbon monoxide do not fit in this series. Also the upper explosion limit with its soot formation cannot be approximated on the basis of a fixed CAFT value nor is the criterion usable anymore for mixtures at higher temperature. It can be concluded that the methods shown give only rather approximate results and with the required positive safety margin are rather impractical. 2.3 Mixture rule and actual calculation If the explosion limit of a mixture of hydrocarbons and oxidiser has to be calculated there is no better solution at the moment than to apply a proportional relationship. This means calculation of the limit of the various fuel components and to derive an overall limit value from the volumetric ratios and their respective limits. Very reactive species such as acetylene or oxides such as ethylene oxide may bias the limit to their side. In Appendix I a spreadsheet is shown belonging to the deliverable with which on the basis of the F-number approach the explosion limits at atmospheric pressure and ambient temperature (293 K) of a pure fuel or a mixture of fuels (up to 3 components) in air can be easily estimated. The example shown is a fuel of 50/50 methane/n-butane. With the information in section 1.3 above the influence of pressure and temperature on UEL, the UEL-value at elevated conditions can be estimated. At elevated conditions of pressure and/or temperature above a certain threshold after a sufficient induction time self-ignition can occur. When determining upper explosion limit this should be checked by means of methods described in Deliverable No. 18 [34].

SAFEKINEX - Deliverable No. 19 - Model, software for calculation of flammability limits and its validation page 10 (21)
3 Model to calculate minimum planar laminar burning velocity
3.1 The CHEMKIN Premix model CHEMKIN [19] is a software suite of models to enable simulations of the chemical kinetic behavior and gas-phase transportation needed for accurate predictions in a combustion environment. In the following we shall follow the manual to describe the Premix module which contains a ‘reactor’ model of a free propagating flame. It was hoped that calculating a minimum laminar burning velocity for a still, plane and stable flame, based on full combustion kinetics, would give a clue for the explosion limit. It however turned out that the present model and numerical convergence algorithms are too complex and too computational intensive to achieve that goal. Also an insufficient basis is available to establish a minimum laminar burning velocity cut-off. To illustrate this, the description below is given. For describing the flame dynamics in the Premix module the implicit finite difference methods are used along with a combination of time-dependent and steady-state methods which are a set of differential equations, solved for Premixed Laminar Flame-Speed Calculation. This involves a freely propagating flame. This model is used to determine a flame speed of a gas mixture at certain initial pressure and inflow temperature. By definition no heat losses are included, on which flame speed depends, while the temperature distribution, which is predicted as a result of transport data, is calculated from the energy equation. A detailed kinetics model especially developed for flame calculation and used in the SAFEKINEX project is Konnov release 0.5 [30]. To solve the problem of free propagation the following conservation equations are used:
• The conservation equation of continuity: uAM ρ=&
• The conservation equation of energy:
011
=+⎟⎠⎞
⎜⎝⎛− ∑
=
K
kkkk
PP
WhCA
dxdTA
dxd
CdxdTM ωλ &&
• The conservation equation of species:
( ) 0=−+ kkkkk WAVAY
dxd
dxdY
M ωρ &&
• The conservation equation of state:
RTWP
=ρ
where x denotes the spatial coordinate, M& the mass flow rate (which is independent on x), T the temperature, Yk the mass fraction of the kth species (there are Kg species), P the pressure, u the velocity of the fluid mixture, ρ the mass density, Wk the molecular weight of the kth species, W the mean molecular weight of the mixture, R the universal gas constant, λ the thermal conductivity of the mixture, CP the constant pressure heat capacity of the mixture, CPk the constant pressure heat capacity of the kth species, kω& the molar rate of production by chemical reaction of the kth species per unit volume, hk the specific enthalpy of the kth species, Vk the diffusion velocity of the kth species, A the cross-sectional area of the stream tube encompassing the flame (increasing due to thermal expansion) normalized by the burner area.

SAFEKINEX - Deliverable No. 19 - Model, software for calculation of flammability limits and its validation page 11 (21)
3.2 Product and Intermediate Species For the Premixed Laminar 1-D Flame model, if no product species estimates are given, CHEMKIN will calculate an equilibrium composition to be used as the product estimate. When equilibrium is used to estimate the product concentrations, a minimum value can be provided applying to all species when creating the product estimates. Within the reaction zone, straight lines are used between the initial and final values for both the reactants and products. On the reactant side of the reaction zone the reactant species profiles are flat at the reactant values. On the product side, the product species are flat at the estimated product values. Note that any given species can be both a reactant and a product species. The excess fuel in a rich flame will also be both a reactant and a product. Species can also be identified as “intermediates”. Intermediates, such as short-lived radical species, are assumed to have a Gaussian profile that peaks in the center of the reaction zone. The peak height is specified in the input to the model, and the Gaussian width is such that the profile is at 1/10 of its peak value at the edges of the reaction zone. The shape of the assumed species profiles is not very important. Smoother functions, such as cubic polynomials and hyperbolic tangents for the reactant and product species, have no apparent effect on the convergence properties of the method. Since the starting profiles are typically evaluated on a very coarse mesh, it makes little difference whether the underlying function is smooth or not. Therefore, simple linear starting profiles are used. The numerical solution procedure begins by making finite difference approximations to reduce the boundary value problem to a system of algebraic equations. The initial approximations are usually on a very coarse mesh that may have as few as five or less points. After obtaining a solution on the coarse mesh, new mesh points are added in regions where the solution or its gradients change rapidly. An initial guess is obtained for the solution on the finer mesh by interpolating the coarse mesh solution. This procedure continues until no new mesh points are needed to resolve the solution to the degree specified by the user. This continuation from coarse to fine meshes has several important benefits. The system of algebraic equations solves by the damped modified Newton algorithm. However, if the Newton algorithm fails to converge, the solution estimate is conditioned by integration in time. This provides a new starting point for the Newton algorithm that is closer to the solution, and thus more likely to be in the domain of convergence for Newton’s method. As the mesh becomes finer, the estimate interpolated from the previous mesh is within the domain of convergence of Newton’s method. This point is key to the solution strategy. 3.3 Temperature Profile Propagation of the exothermic reaction in gas mixtures occurs often at significant temperature and concentration gradients and flows of heat and materials which are generated by these gradients as flame propagation of combustible mixture. Initially, fresh unburned premixed mixture at the ambient conditions is delivered to the flame zone. As the mixture approaches the flame front it is heated by conduction and radiation from the flame zone upstream. Chemical reaction and heat release are negligible at this stage. Once temperatures are high enough to sustain combustion, chemical reaction takes place in the reaction zone. The gases emerging from this zone enter the burned gas zone where concentration and temperature are once again constant. It is difficult to draw a distinct line between preheat and reaction zones but it can be thought of as the point at which exothermic reactions just become significant. The preheat zone is

SAFEKINEX - Deliverable No. 19 - Model, software for calculation of flammability limits and its validation page 12 (21)
absolutely critical in maintaining combustion. If fresh mixture is not continuously preheated the flame will die. The reaction zone will be considered to be steady in the coordinate system x-T (see Figure 4). Initial gas with initial temperature T0 ‘moves’ the stream of heat upwards generating a temperature gradient from T0 to final temperature Tb (after full burning). When the gas temperature increases up to ignition temperature Ti, reaction starts. It will be going on until temperature reaches the value Tb. The ignition temperature is not a physical constant of a gas mixture but it depends on the condition of the whole gas system, when ignition happens. This constitutes the ignition delay time. The model does not regard Ti as a precisely determined temperature. As it is a very parochial temperature interval in which reaction becomes so fast, during the time of gas ‘motion’ from Ti to Tb the amount of heat released can be taken proportional with the distance passed.
x
+ 8| 8
δrδhT0 T0'
Ti
T
0
Tb
Figure 4: Temperature distribution of steady flame.
δh and δr – heating-up and reaction zones. Ti – initial reaction temperature or ignition
temperature. T0 – initial mixture temperature. Tb – final product temperature.
To model a system a known temperature profile is preferable. Doing so eliminates the need to model heat losses in the energy equation, but it does require that the user is able to provide the temperature profile. There are also computational advantages to using a known temperature profile, rather than solving an energy equation. The most severe non-linearities in chemical kinetics come from the exponential dependence of the reaction rates on temperature. Thus, eliminating temperature changes from the iteration may make the problem considerably easier to solve. Even if the energy equation is being solved for the temperature distribution, the iteration often converges more reliably if the species profiles are first computed using a fixed temperature profile. CHEMKIN, therefore, provides for a two-stage or three stage procedure to solve the fully coupled reacting-flow and energy equations. For Premixed Flames, a two stage procedure is used, where the first solution uses the initial temperature profile as a fixed-temperature constraint and only solves for the species composition and velocity profile. In general, the mesh used does not have to correspond to the one on which the given temperature estimate is defined. A linear interpolation of the given temperatures onto the current mesh is used. In the case where the energy equation is not included, it is therefore important to provide enough temperature points so that the profile is well resolved and relatively smooth. 3.4 A Brief Summary on Modified Damped Newton’s Method and Jacobian Matrix After discretization on a given mesh, a system of nonlinear algebraic equations is obtained which uses an embedded subroutine attempting to solve the equations by a damped Newton’s method. Newton’s method determines a sequence of iterations or approximate solutions that approach the true solution by an algorithm of splitting step. Newton’s method refers to second order methods involving at each iteration the calculation of a derivative of a desired function. A weak point of Newton’s method is that convergence usually requires a very good initial estimate since calculation of a derivative of order two of the function takes much computing
SAFEKINEX - Deliverable No. 19 - Model, software for calculation of flammability limits and its validation page 13 (21)
time. But on the other hand it provides a high order of convergence. The modified Newton’s method after k steps gives reduction of residuals of the energy equation, and in k+1 times of the species equation. The final equation is included for the purpose of maintaining a banded Jacobian structure which is too expensive and delicate to be used in practice. CHEMKIN employs the usual remedies. First, the Jacobian matrix is replaced by one element of the matrix inherited from a previous step of the algorithm. Second, the full iteration step may be cut short by insertion of a damping parameter. To calculate the next element of Jacobian the procedure uses a look-ahead, forcing certain behavior upon the algorithm. Thus, having tentatively chosen the next step the program looks ahead to the calculation of a two-steps-ahead step. This prevents the iteration from stepping away from the region where there is good reason to believe a solution lies. Should this criterion fail, the application rejects it and retries the step with a halved damping parameter or a new Jacobian matrix. The damping parameter is initially chosen to be as large as possible so that it does not violate various constraints that are set on the solution variables. The precision of the calculation depends on the relative and absolute tolerances which govern the convergence criteria for the Newton iteration. Roughly speaking the relative tolerance indicates how many significant digits the converged solution should contain, and the absolute tolerance serves to exclude solution components smaller than those following from the relative convergence criteria. Typically, the absolute tolerance should be smaller than the maximum mass fraction of any species of interest. The relative tolerance should be in the range of 10-3 to 10-4, which will serve to provide 3 to 4 digits of accuracy. If damping cannot produce a suitable correction, then a new Jacobian is computed. If, after computing a new Jacobian, a damped Newton step still cannot produce a suitable correction. 3.5 Calculating laminar burning velocity
0.6 0.8 1.0 1.2 1.4 1.6Equivalence ratio
0
10
20
30
40
Lam
inar
bur
ning
vel
ocity
, cm
/s
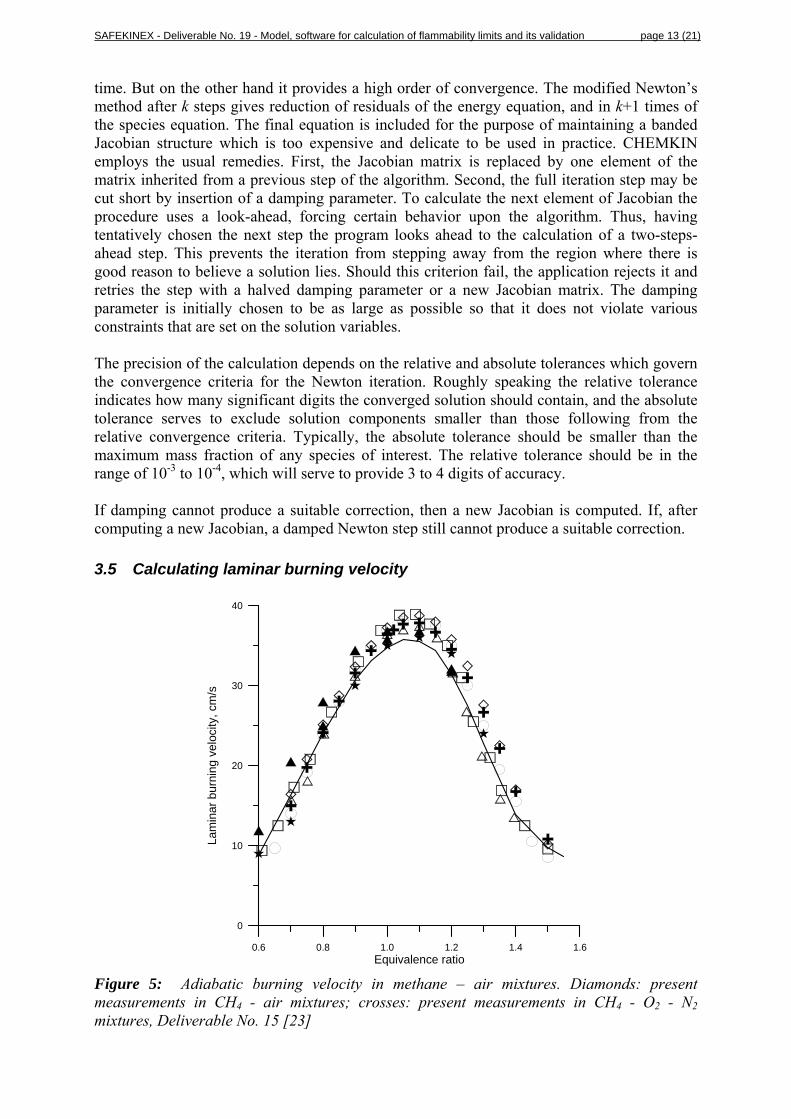
Figure 5: Adiabatic burning velocity in methane – air mixtures. Diamonds: present measurements in CH4 - air mixtures; crosses: present measurements in CH4 - O2 - N2 mixtures, Deliverable No. 15 [23]

SAFEKINEX - Deliverable No. 19 - Model, software for calculation of flammability limits and its validation page 14 (21)
In Deliverables Nos. 14 and 15 the ins and outs of laminar burning velocity calculation are discussed with the Premix module of the CHEMKIN suite of models [19], the results of calculations presented with A. Konnov’s mechanism 0.5 [30] for flame propagation, and the validation shown against experimental results for a range of hydrocarbons. The method appears to be accurate enough to cover the experimental results to close to the lower limit of flammability. Experimental uncertainty in measured burning velocity is about 1 cm/s. In Figure 5 the result is plotted of calculations (line) versus experimental results as described in Deliverable No. 15 [23]. It appeared further that for practical use the computing effort is still quite cumbersome. One calculation with CHEMKIN Premix may take a few days. In Deliverable No. 18 [34] a brief resume is given of the three alternatives to CHEMKIN from the point of view of induction time calculation: Chemical Workbench, COSILAB-2 and CANTERA. However the incentive to develop at least the latter two has been mainly calculation of burning velocity. During the project too little time and person power capacity has been available to evaluate the performance of these software products against each other. The newest model is CANTERA and it is said that the algorithms in this model to calculate burning velocity are more efficient than of the older methods. For predicting an explosion limit a criterion for a minimum burning velocity should be defined. A cut-off velocity of 5 cm/s at flame propagation limit has been proposed by e.g. Liao et al. [24]. A sound basis for this number is however not available. If simply the straight left part of the curve in Figure 5 is extrapolated linearly to 5 cm/s critical burning velocity a lower explosion limit will be found of 5.7% where 5% generally is accepted as true. With respect to possible extrapolation to the upper explosion limit due to the slow leveling off in many cases of the relation burning velocity versus equivalence ratio, the problem of a lack of a fundamental approach to define a cut-off value for the burning velocity under various conditions deepens. The uncertainty of a minimum value at explosion limit cut-off and the relatively large effort to perform the calculation makes the method at least for the time being unsuitable for practical use to predict explosion limits.
SAFEKINEX - Deliverable No. 19 - Model, software for calculation of flammability limits and its validation page 15 (21)
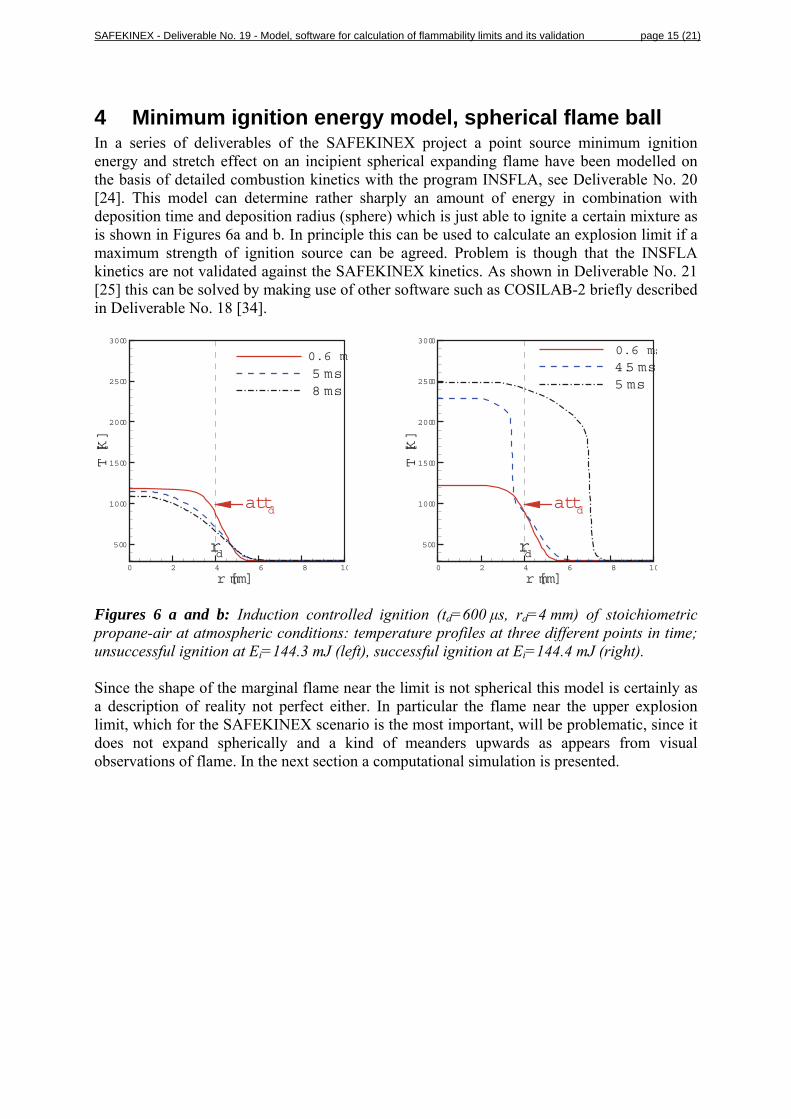
4 Minimum ignition energy model, spherical flame ball In a series of deliverables of the SAFEKINEX project a point source minimum ignition energy and stretch effect on an incipient spherical expanding flame have been modelled on the basis of detailed combustion kinetics with the program INSFLA, see Deliverable No. 20 [24]. This model can determine rather sharply an amount of energy in combination with deposition time and deposition radius (sphere) which is just able to ignite a certain mixture as is shown in Figures 6a and b. In principle this can be used to calculate an explosion limit if a maximum strength of ignition source can be agreed. Problem is though that the INSFLA kinetics are not validated against the SAFEKINEX kinetics. As shown in Deliverable No. 21 [25] this can be solved by making use of other software such as COSILAB-2 briefly described in Deliverable No. 18 [34].
r [mm]
T[K]
0 2 4 6 8 10
500
1000
1500
2000
2500
3000
5 ms8 ms
rd
attd
0.6 m
r [mm]
T[K]
0 2 4 6 8 10
500
1000
1500
2000
2500
3000
4.5 ms5 ms
rd
attd
0.6 ms
Figures 6 a and b: Induction controlled ignition (td=600 µs, rd=4 mm) of stoichiometric propane-air at atmospheric conditions: temperature profiles at three different points in time; unsuccessful ignition at Ei=144.3 mJ (left), successful ignition at Ei=144.4 mJ (right). Since the shape of the marginal flame near the limit is not spherical this model is certainly as a description of reality not perfect either. In particular the flame near the upper explosion limit, which for the SAFEKINEX scenario is the most important, will be problematic, since it does not expand spherically and a kind of meanders upwards as appears from visual observations of flame. In the next section a computational simulation is presented.

SAFEKINEX - Deliverable No. 19 - Model, software for calculation of flammability limits and its validation page 16 (21)
5 Simulation by Computation Fluid Dynamics5 Slow burning mixtures are known to exhibit a strong influence of buoyancy effects [27]. Figures 7a to d show the results of CFD simulations of upward natural convection of a hot ignition kernel in the gravity field. In this example, the (inert) mixture was tried to get ‘ignited’ (energy deposited) 10 s after termination of oxygen injection in a 20 l vessel from the canister via the fast acting valve [1].
(a) (b)
(c) (d) Figures 7a to d: Calculated iso-lines of oxygen mass fraction (left hemisphere) and temperature (right hemisphere) after deposition of ‘ignition’ energy in the test mixture in the vessel center 10 s after termination of oxygen injection: (a) ignition completion; (b) 0.3 s; (c) 1; and (d) 2 s. Initial oxygen pressure in the canister is 29.67 bar. Initial n-butane pressure in
5 The following section has been part of a study in the framework of the Russian-Netherlands scientific cooperation, project NWO No. 046.016.012 2004-2006 cosponsored by Russian Foundation for Basic Research, projects 05-08-50115a and 05-08-33411a, under guidance of Prof. S.M. Frolov and published in a paper to ECCOMAS conference, Egmond, NL, Sept. 2006 [26]

SAFEKINEX - Deliverable No. 19 - Model, software for calculation of flammability limits and its validation page 17 (21)
the vessel is 3.2 bar. Injection duration is 0.01 s. The interval between the iso-lines is uniform. These calculations were aimed at estimating the characteristic times taken for the kernel to reach the upper wall of the vessel and to cool down to the wall temperature. Combustion reactions in these calculations were not activated for the sake of simplicity. It follows from Figures 7a to d that the entire process of ‘flame kernel’ energy dissipation takes 1–2 s. In interpreting test results of determination of the upper explosion limit one has to keep in mind that conditions are therefore far from ideal to judge steady flame propagation under constant conditions and that also wall reaction interference is a real possibility. As described in Deliverable No. 29 [9] products have been definitely identified in near upper limit flame which are typical for cool flame. So, at least partially reactions are taking place according to the low temperature scheme. Finally, apart from wall effects detailed gaseous hydrocarbon oxidation reaction kinetic models are much too large to make reactive flow CFD calculation under these circumstances feasible. Even reduced models will not bring sufficient improvement in the situation. It has to be expected that studying the flame ball development in a closed vessel applying more sophisticated optical diagnostic tools will bring more clarity.
6 Conclusions A fundamental approach to calculate especially upper explosion limits is not yet possible. The interaction of chemistry and physics is too intensive and complex. Semi-empirical approaches such as calculation of a minimum ignition energy, minimum burning velocity for propagation or a minimum adiabatic flame temperature are shifting the question to what minimum energy release in combustion to consider, what minimum burning velocity or what minimum temperature to support stable flame propagation. Too large a generalisation leads to too large inaccuracy in the answers. On top of that comes that in case of uncertainty the safe side has to be kept adding another margin. The best possibility at this time is a totally empirical approach. For that purpose an Excel sheet has been included in this deliverable to conveniently apply the Japanese F-number approach. In Deliverable No. 10 [10] some words will be devoted to the hazard due to the explosion severity near the upper explosion limit, which as a result of the often very low value of severity in the region near the UEL can in such case be considered as reduced and can make adequate protection measures for that region easier.
7 References 1. Project SAFEKINEX, Contract No. EVG1-CT-2002-00072, Deliverable No. 8, Report on
experimentally determined explosion limits, explosion pressures and rates of explosion pressure rise - Part 1: methane, hydrogen and propylene, March 2006.
2. Project SAFEKINEX, Contract No. EVG1-CT-2002-00072, Deliverable No. 9, Report on experimentally determined explosion limits, explosion pressures and rates of explosion pressure rise - Part 1: ethane, ethylene, propane, n-butane, ammonia and carbon monoxide, October 2006.
3. Takahashi A, Urano Y., Tokuhashi K, Kondo S., Effect of vessel size and shape on experimental flammability limits of gases, Journal of Hazardous Materials, A105 (2003) 27-37.
4. Project SAFEKINEX, Contract No. EVG1-CT-2002-00072, Deliverable No. 2, Report on the experimental factors influencing explosion indices determination, September 2003.

SAFEKINEX - Deliverable No. 19 - Model, software for calculation of flammability limits and its validation page 18 (21)
5. De Smedt G., de Corte F., Notelé R. Berghmans J., Comparison of two standard test methods for determining explosion limits of gases at atmospheric conditions, Journal of Hazardous Materials, A70 (1999) 105-113.
6. ASTM E918-83 (Reapproved 1993), Standard practice for determining limits of flammability of chemicals at elevated temperature and pressure, American Society for Testing and Materials, Philadelphia, 1993
7. DIN 51 649 Teil 1, Bestimmung der Explosionsgrenzen von Gasen und Gasgemischen in Luft, Deutsches Institut für Normung.
8. EN 1839: Determination of explosion limits of gases and vapours(2003). 9. Project SAFEKINEX, Contract No. EVG1-CT-2002-00072, Deliverable No. 29, Report
on intermediate species concentration during the ignition process, October 2005. 10. Project SAFEKINEX, Contract No. EVG1-CT-2002-00072, Deliverable No. 10,
Interpretation of gas explosion tests; extremes in explosion severity, March 2007. 11. Project SAFEKINEX, Contract No. EVG1-CT-2002-00072, Deliverable No. 11, Effect of
turbulence on explosion severity (Kg -value), September 2006. 12. Project SAFEKINEX, Contract No. EVG1-CT-2002-00072, Deliverable No. 7, Report on
experimentally determined minimum ignition energy (MIE) as a function of pressure, fuel type and concentration, December 2005.
13. Horstmann T., Leuckel W., Maurer B. and Maas U., Influence of Turbulent Flow Conditions on the Ignition of Flammable Gas/Air Mixtures, Process Safety Progress, Vol. 20, N0.3 September 2001, 215-224.
14. Kondo S., Urano Y., Tokuhashi K., Takahashi A., Tanaka K., Prediction of flammability of gases by using F-number analysis, Journal of Hazardous Materials, A82 (2001) 113-128.
15. Shebeko Yu.N., Fan W., Bolodian I.A., Navzenya V.Yu., An analytical evaluation of flammability limits of gaseous mixture of combustible-oxidizer-diluent, Fire Safety Journal, 37 (2002) 549-568.
16. Mashuga C.V. and Crowl D.A., Flammability Zone Prediction Using Calculated Adiabatic Flame Temperatures, Process Safety Progress Vol. 18, No. 3 Fall 1999, 127-134.
17. Vidal M., Wong W., Rogers W.J., Mannan M.S., Evaluation of lower flammability limits of fuel-air diluent mixtures using calculated adiabatic flame temperatures, Journal of Hazardous Materials, 130 (2006) 21-27.
18. Morley C., http://www.gaseq.co.uk/ 19. http://www.reactiondesign.com/ 20. http://www.kintech.ru/ 21. Project SAFEKINEX, Contract No. EVG1-CT-2002-00072, Deliverable No. 16,
"Explosion pressure": The program for calculation of maximum pressure of explosion for chemical equilibrium conditions, October 2004.
22. Project SAFEKINEX, Contract No. EVG1-CT-2002-00072, Deliverable No. 14, Model and software for calculation of laminar burning velocity, January 2004.
23. Project SAFEKINEX, Contract No. EVG1-CT-2002-00072, Deliverable No. 15, Validation of laminar burning velocity model, January 2006.
24. Project SAFEKINEX, Contract No. EVG1-CT-2002-00072, Deliverable No. 20, Model software development for calculation of Markstein numbers and minimum ignition energies (MIE), September 2004.
25. Project SAFEKINEX, Contract No. EVG1-CT-2002-00072, Deliverable No. 21, Calculation of Markstein numbers, their influence on the Minimum Ignition Energy and implementation of practical software, October 2006.
26. Frolov, S. M., Basevich, V. Ya., Smetanyuk, V. A., Belyaev, A. A., & Pasman, H. J (2006) Oxidation and combustion of fuel-rich n-butane–oxygen mixture in a standard 20-liter explosion vessel. European Conference on Computational Fluid Dynamics,
SAFEKINEX - Deliverable No. 19 - Model, software for calculation of flammability limits and its validation page 19 (21)
ECCOMAS CDF, P. Wesseling, E. Oñate, J. Périaux (Eds), Egmond, 5–8 September 2006, The Netherlands.
27. A. S. Sokolik, Self-Ignition, Flame, and Detonation in Gases, Moscow, USSR Acad. Sci. Publ. (1960).
28. A. A. Pekalski, E. Terli, J. F. Zevenbergen, S. M. Lemkowitz, and H. J. Pasman, Influence of the Ignition Delay Parameters of Hydrocarbon-Air/oxygen Mixtures at Elevated Pressure and Temperature, Combustion Institute Proceedings, 30, 1133–1139 (2005).
29. Van de Schoor F., Verplaetsen F., “The upper explosion limit of lower alkanes and alkenes in air at elevated pressures and temperature”, Journal of Hazardous Materials, A128 (2006) 1-9.
30. Konnov, A.A. Detailed reaction mechanism for small hydrocarbons combustion. Release 0.5 http://homepages.vub.ac.be/~akonnov/, 2000.
31. Meissner, Z. and Kozlowski, M., SAFEKINEX LabViewer, CD-R and Manual Deliverable No. 12, November 2006.
32. Zabetakis, M.G., Lambiris, S. and Scott G.S., Flame Temperatures of Limit Mixtures, 7th Symp. (Int’l0 on Combustion, Butterworths Sci Publ. (London), 1959, pp. 484-487.
33. Zabetakis, M.G., Flammability Characteristics of Combustible Gases and Vapors, Bulletin 627, Bureau of Mines, Washington, U.S. Dept of the Interior, 1965, 622.06173.
34. Project SAFEKINEX, Contract No. EVG1-CT-2002-00072, Deliverable No.18, Model, software for calculation of AIT and its validation, December 2006.
35. Kondo S., Takahashi A., Tokuhashi, K., “Experimental exploration of discrepancies in F-number correlation of flammability limits”, Journal of Hazardous Materials, A100 (2003) 27-36.
36. Vanderstraeten B., Tuerlinckx D., Berghmans J., Vliegen S., Van’t Oost E., Smit B., Experimental Study of the pressure and temperature dependence on the upper flammability limit of methane/air mixtures, Journal of Hazardous Materials 56 (1997) 237-246.

SAFEKINEX - Deliverable No. 19 - Model, software for calculation of flammability limits and its validation page 20 (21)
SAFEKINEX - Deliverable No. 19 - Model, software for calculation of flammability limits and its validation page 21 (21)
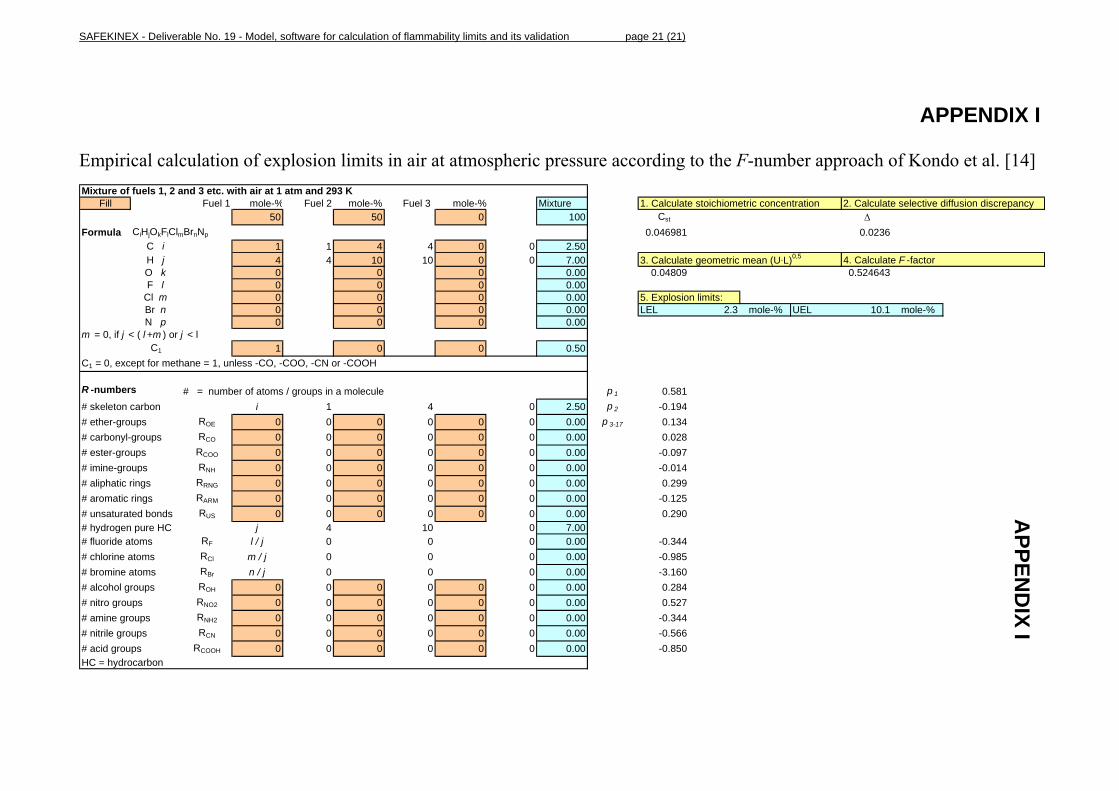
APPENDIX I Empirical calculation of explosion limits in air at atmospheric pressure according to the F-number approach of Kondo et al. [14] Mixture of fuels 1, 2 and 3 etc. with air at 1 atm and 293 K
Fill Fuel 1 mole-% Fuel 2 mole-% Fuel 3 mole-% Mixture 1. Calculate stoichiometric concentration 2. Calculate selective diffusion discrepancy 50 50 0 100 Cst ∆
Formula CiHjOkFlClmBrnNp 0.046981 0.0236C i 1 1 4 4 0 0 2.50H j 4 4 10 10 0 0 7.00 3. Calculate geometric mean (U·L)0,5 4. Calculate F -factorO k 0 0 0 0.00 0.04809 0.524643F l 0 0 0 0.00
Cl m 0 0 0 0.00 5. Explosion limits:Br n 0 0 0 0.00 LEL 2.3 mole-% UEL 10.1 mole-%N p 0 0 0 0.00
m = 0, if j < ( l +m ) or j < lC1 1 0 0 0.50
C1 = 0, except for methane = 1, unless -CO, -COO, -CN or -COOH
R -numbers # = number of atoms / groups in a molecule p 1 0.581# skeleton carbon i 1 4 0 2.50 p 2 -0.194# ether-groups ROE 0 0 0 0 0 0 0.00 p 3-17 0.134# carbonyl-groups RCO 0 0 0 0 0 0 0.00 0.028# ester-groups RCOO 0 0 0 0 0 0 0.00 -0.097# imine-groups RNH 0 0 0 0 0 0 0.00 -0.014# aliphatic rings RRNG 0 0 0 0 0 0 0.00 0.299# aromatic rings RARM 0 0 0 0 0 0 0.00 -0.125# unsaturated bonds RUS 0 0 0 0 0 0 0.00 0.290# hydrogen pure HC j 4 10 0 7.00# fluoride atoms RF l / j 0 0 0 0.00 -0.344# chlorine atoms RCl m / j 0 0 0 0.00 -0.985# bromine atoms RBr n / j 0 0 0 0.00 -3.160# alcohol groups ROH 0 0 0 0 0 0 0.00 0.284# nitro groups RNO2 0 0 0 0 0 0 0.00 0.527# amine groups RNH2 0 0 0 0 0 0 0.00 -0.344# nitrile groups RCN 0 0 0 0 0 0 0.00 -0.566# acid groups RCOOH 0 0 0 0 0 0 0.00 -0.850HC = hydrocarbon
APPEN
DIX I