model for determination of cartographic and …
TRANSCRIPT

In ternational Hydrographic Review , Monaco, LXVIII(2), July 1991
MODEL FOR DETERMINATION
OF CARTOGRAPHIC AND
HYDROGRAPHIC PRIORITIES
by Michelle GRENIER and Patrick HALLY (*)
Paper presented at the Canadian Hydrographic Conference 1991.
Abstract
The determination of priority zones for hydrographic surveys and charting is
based on manual and empirical methods permitting only to consider a limited
number of factors with the tools that are used.
A model composed of about twenty variable layers and typical parameters
to the maritime field, to hydrography and to cartography is proposed in order to
provide a base to a computerized system on microcomputer spreadsheet.
The problem, the present methodology, the model, the informatics
environment, the application, the data are described and the analysis of a real life
example of utilization is presented.
1. PROBLEM
The Canadian Hydrographic Service (CHS) is responsible for providing
nautical information (nautical charts, tide tables, sailing directions and so on) to
mariners in order to ensure navigational safety. The role of the CHS is, therefore,
to collect, process and manage data and transform it into nautical information
products for distribution. This is a long, complex and costly process. The
products are ever-changing and dependent on morphological site changes, the
construction of new port facilities or changes in transportation methods. Given
limited resources and the significant costs associated with field operations and
charting, the medium-and long-term planning of hydrographic work is essential.
(*) Canadian Hydrographic Service, Québec Region, Institut Maurice-Lamontagne, 850, route de la Mer, C.P. 1000, Mont-Joli (Québec), Canada G5H 3Z4.

Mariners’ needs vary according to the type of navigation (commercial,
pleasure boating, fisheries), developments in naval construction (greater draft),
navigational instruments (digital data) and the construction of new port facilities.
Economic considerations related to maritime activities, as well as the dynamic of
the morphology of the sea floor are criteria which must be considered, in addition
to the state of the raw data and the quality of their representation. It is, therefore,
essential to have an effective decision-making tool to systematically compare and
consider the numerous factors affecting the planning of hydrographic projects.
2. CURRENT METHODOLOGY
To date, hydrographic activities have been planned using a few simple
criteria, various manual evaluation tools and a level of expertise which
hydrographers have developed over time. In terms of hydrographic surveys, the
principal criterion used is the age of the surveys. Those sectors for which the raw
data are more than a few years old are given priority over sectors with “recent,
metric surveys, beginning with the sectors with higher maritime traffic. Sectors
which have never been charted, such as rivers used by pleasure boaters, are also
identified in order to carry out surveys that will result in the production of charts.
A scheme for the delimitation of charts is established and a five-year plan is
developed on the basis of these results.
In those sectors which have undergone major changes, charts are
periodically revised through new editions or reprints. The chart series are revised
in accordance with the five-year plan and survey deposit. The representation is
then standardized by representing the bathymetric data in metric units, and the
toponymy and notes in bilingual format. Because the work of collecting and
processing data represents a considerable task, only the criterion of replacing
outdated surveys with new, metric surveys is applied, the other criteria are
evaluated only when they are of critical importance in planning decisions. These
factors are often related to planners’ personal knowledge of the environment and
are rarely based on a systematic planning tool. Moreover, political decisions can
easily influence the incomplete analyses used as a basis for planning.
3. INCOMPLETE CRITERIA
The criterion of replacing old data (sextant and plumb line) with new
surveys itself provides a sound basis for planning.
However, in terms of rationalizing and optimizing resource utilization, other
important criteria must now be considered, namely the economic importance of
maritime activities, the complexity and dynamics of the morphology of the sea-
floor, the amount of new data available from other agencies, the density of the
data acquired, the need for revisions based on the traffic on maritime routes and
so on. In the past, these criteria were based solely ®n the personal and

undocumented knowledge of planners. It is very likely that their analyses referred
to these factors at one point, but the latter were not always systematically
evaluated in order to support their decisions.
Given the fact that the requests and needs of users of hydrographic data
(clients and the public) are varied, and that their requests are becoming
increasingly urgent, planning must, of necessity, adjust to this new reality and
take into consideration all the criteria which could affect the production of nautical
documents. It becomes essential to be able to justify the criteria which underlie
decisions regarding the surveying and charting choices and priorities. Since the
proposed model uses an automated planning tool, it makes it possible to support
planners’ decisions by providing them with a systematic analysis of the variables
affecting navigational safety and, hence, to analyse requests as a function of the
priorities derived from the model.
4. GEOGRAPHIC LAYOUT
The geographic sector being analysed (in this case, the Quebec Region of
the CHS) was divided into rectangular zones with sides measuring approximately
50-60 km, in order to cover all navigable waterways. Each of these zones was
then subdivided into cells with sides measuring approximately 1 km. Each zone
was then identified by a unique reference number. A graphic index indicating the
relationship between the zone and the territory covered was created to provide a
geographic reference for easy access (Fig. 1).
5. PROPOSED MODEL
The model contains three primary layers: the first, state of the site, is
characterized by economic and morphological variables; the second, state of the
data, contains variables pertaining to the degree of reliability of the bathymetric
data; and the third, presentation, refers to the status of existing nautical charts.
The primary layers are subdivided into secondary layers which are in turn
subdivided into tertiary layers, for a total of nineteen variables (Fig. 2).
Because of its flexibility, the model can be manipulated either to define the
overall characteristics of the territory by consulting the entire layer of all the
variables, or to analyse them at a more specific level, such as surveys or charts.
6. DESCRIPTION OF THE LAYERS
1. State of the site
1.1 — Economic activities. This layer makes it possible to quantitatively
evaluate the economic importance of maritime activities. An economic study

FIG. 1.— The Quebec Region of the Canadian Hydrographic Service.
carried out by the Economic Services Division of the Department of Fisheries and
Oceans, Quebec Region, was needed in order to provide the CHS with an
economic evaluation method it could use. The economic value of fisheries,
maritime transport, pleasure boating, and ferry activities was calculated as a
function of factors which are specific to these activities, thereby making it possible
to give a dollar value to their importance. This evaluation takes into consideration
the value of the vessels, the value of the goods they are carrying and the value
of the people on board (for insurance purposes).
1.1.1. — Maritime transport. The economic value of maritime transport was
evaluated by calculating the sum of the values of the goods being shipped, that of
the fleet and that of travel in navigable zones. These values were then encoded
and represented on 43 base maps divided into 132 subregions.
Fleet value: takes into consideration the value of vessels, the number of
which was estimated on the basis of Canadian Coast Guard data. The value of
goods being shipped was established using Statistics Canada data to establish (in
tonnes) the volume of goods on board and in transit. Cargo value was calculated
on the basis of the average price per tonne for various categories of goods being
shipped. The value of vessel traffic in the study takes two factors into conside
ration: the vessels’ average number of days at sea and the number of crew
members on board. Canadian Coast Guard statistics were used to estimate the
number of vessels in each of the zones in which maritime traffic is monitored.
The number of crew members was deduced on the basis of maritime transpor
tation statistics, which give the average number of crew members per vessel as
eight.

FlG. 2.— Proposed Model.

1.1.2. — Ferries. The economic evaluation of the value of ferry activities takes
into consideration the value of the ferry fleet, the value of traffic and that of the
operations. The Fleet value of certain vessels was determined by the Quebec
Department of Transportation; for the others, a value was established using an
investment ratio based on the capacity and size of the vessels. Traffic includes
the transportation of vehicles and passengers, and travel by crew members. The
value of the activity generated by the ferries was taken to be the sum of the
operating costs before the amortization of the vessels.
1.1.3 — Pleasure boating. The pleasure activities included in the study were
pleasure boating, sport fishing and marine mammal observation activities. Fishery
and commercial activities, as well as ferry activities, all of which are covered in
other categories, were excluded.
The 1983 Canadian Coast Guard census was used to determine the total
number of boats, their value and the average number of passengers during
outings for each of the communities.
1.1.4 — Fisheries. Commercial fishery activities were estimated on the basis of
landings, the value of the plants, the value added to the fish by the plants,
inshore and midshore fleets, traffic, the value of service infrastructures, the value
of aquaculture facilities, the value of fishing banks and the value of the corridors
linking the banks to ports of landing.
1.2 — Morphology. This secondary layer takes two factors into consideration:
the complexity of the bottom profile and changes due to the movement of
sediment. The portfolio of nautical charts was used to evaluate these variables.
1.2.1 — Complexity. In order to assess the complexity of the bottom, depth (a
limiting factor for navigational safety) was considered first in order to separate the
sectors which are less than 30 m deep from the deeper sectors. The deep sectors
were assigned a low rating which was independent of the bottom profile. How
ever, for sectors less than 30 m deep, the bottom profile was taken into consi
deration. In a shallow area, a flat bottom is less dangerous than an uneven
bottom; therefore, the latter would be given a higher rating.
1.2.2 — Changes. In terms of the dynamics of the bottom profile, a sandy
bottom would be assigned a high rating under the model, while a rocky bottom
would receive a low rating.
1.3 — Physical oceanography. This secondary layer consists of two physical
variables, namely currents and tides.
1.3.1 — Currents. This variable was assessed by consulting data found on up-to-
date nautical charts. Sectors with currents exceeding 4 knots were assigned a
high rating, sectors with currents between 2 and 3 knots were assigned a medium
rating, and those with currents measuring less than 2 knots were assigned a low
rating. Once analysed, this criterion remains stable as long as there are no major
changes to the coastline.
1.3.2 — Tides. Tides had to be considered because tidal zones are more
dangerous to navigate than sectors with no tides. Tide tables were used to divide
the territory according to tidal amplitude. In the model, sectors in which the tidal

amplitude can reach 6 m were given a high rating, a zone with average tides
reaching a height of approximately 2 m was given a medium rating, while a zone
with low small tides reaching a height of approximately 1 m was assigned a low
rating.
2. State of the data
The evaluation of the state of the data is one of the most important factors,
because bathymetric surveys have not, over the years, been carried out according
to the same methods or using the same instruments. Every factor affecting the
reliability of the data must be taken into consideration.
2.1 — Horizontal datum. The hydrographic data must be linked to a horizontal
reference system in order to confirm them in a reliable manner. The co-ordinate
system must be known in order to be able to transfer the positions of all of the
bathymetric data gathered using the same reference system. The possibility of
linking the data to a known horizontal reference was used as a parameter when
analysing this variable.
2.2 — Vertical datum. Bathymetric data are gathered from vessels equipped
with various types of acquisition systems.
The collection of data during surveys must be done in relation to a known
vertical reference system. During processing, the data are reduced to one
common reference level which is the chart datum. The sectors in which it is
impossible to relate the data gathered to the chart datum, owing to lack of
information on the plan or lack of control in the field during collection, are
assigned a higher rating than the others.
2.3 — Bathymetry
2.3.1 — Density. Survey density is a very important factor, however, until now
most of the data gathered provided only a profile of the bottom rather than
complete coverage. In order to evaluate this variable, the scale of the survey was
considered, since the distance between sounding lines is direcdy related to it.
Sectors for which the scale was larger than 1:5,000, that is, where the distance
between the sounding lines was 25 m or less, were assigned a low rating under
the model (this would also be the case for a total coverage survey). Sectors in
which the survey scale was smaller than 1:5,000 were assigned higher ratings
since the sounding lines were further apart and the probability of a shoal being
located between two sounding lines was greater.
2.3.2 — Reliability. The reliability criterion takes into consideration the types of
positioning systems and the method of depth sounding used during data collection.
Since these factors have changed as the technology evolved over the years, the
year in which the survey was carried out was used to evaluate this criterion. Pre-
1945 surveys using rudimentary systems such as sextants and plumb lines were
assigned a high rating, while surveys done between 1945 and 1970, primarily
using echo sounders, were assigned a medium rating, and recent surveys using
electronic systems were given a low rating.
2.3.3. — Topography. The topographic coverage criterion was evaluated on the
basis of the availability of topographic documents. These are considered adequate
for charting, particularly when they are available at scales of at least 1:20,000. If

this is the case, they are assigned a low rating. If sector charts are available only
at 1:50,000, a medium rating is assigned; if no information is available for the
sector or the scale is smaller than 1:50,000, a high rating is assigned.
2.3.4 — Revision cycle. Between comprehensive hydrographic surveys, it is
necessary to update the information at varying intervals in order to keep nautical
charts up-to-date. In frequently travelled sectors such as the marked channel of
the St. Lawrence, port facilities are more affected by changes than those in
outlying sectors which are not as frequently travelled (North Shore). The
evaluation of this variable takes into consideration the number of years that have
passed since the last revision survey for each geographical sector. In order to be
more realistic in the assignment of ratings for this criterion, the territory was
divided into three distinct regions representing the sectors which change
significantly and require biennial revision cycles (commercial channels, approaches
to ports), sectors which change moderately and require revisions every five years
(around channels, less important ports) and sectors with low traffic (Fig. 3).
3. Presentation.
The presentation phase is the phase during which hydrographic and carto
graphic data are actually used. The planning of hydrographic surveys is therefore
closely related to the updating of cartographic coverage. The following variables
are considered under the model to assess the quality of cartographic coverage:
the scale of the charts; the presentation in metric and/or bilingual format; the
quality of the reproduction material and the number of new documents available
affecting the updating of charts.
3.1 — Scale. This sub-layer is used to evaluate whether the current scale of
Canadian Hydrographic Service charts is adequate for navigational purposes. The
sectors for which no chart is available are assigned a high rating, as are those for
which existing coverage of the charts is inadequate for safe access to anchorage
and moorage. Sectors for which the scale of the charts is acceptable or require
only a minor improvement are assigned an average rating. Sectors for which the
cartographic coverage is adequate for navigational purposes (adequate coverage
is defined as a small or medium scale for outlying sectors and a large scale for
access to ports) were assigned a low rating.
3.2 — Metric system. This layer is evaluated simply on the basis of the
delimitation of the current charts in the portfolio. If the charts were metric a low
rating was assigned; if they were not, a high rating was assigned.
3.3 — Bilingualism. Several years ago, the Canadian Hydrographic Service set
itself the goal of updating its portfolio of nautical charts to reflect Canadian
standards on bilingualism. When the portfolio of nautical charts was reviewed,
charts that were already bilingual where given a low rating and those that were
available only in English were given a high rating.
3.4 — Reproduction material. It is necessary to analyse this variable in order
to determine the amount of work needed to touch up the negatives used to print
new editions. When a new edition of a chart is printed, changes are made to the
plates without completely redrawing them. Comprehensive surveys for the

production of new charts are carried out only abou t every forty years. In
between, changes are distributed to mariners in the form of new editions or
reprints. The reproduction process eventually causes the negatives to deteriorate;
after several editions, the negatives must be extensively repaired before they can
be re-used. S ince the m ateria l used to reproduce new editions and reprints
deteriorates over time, charts which have had more than two new editions since
they were first printed were assigned a high rating, charts which have had one or
two new editions were assigned a medium rating and new charts were assigned a
low rating.
3.5 — New inform ation. This criterion refers to the dynamic nature of nautical
charts. It is very important because it deals with a factor which is very dangerous
for mariners, namely change. The area covered by a nautical chart continues to
change after the chart has been put on the market. Each week, Notices to
Mariners are published in order to enable mariners to amend their charts to
indicate hazards identified since the date of purchase. These may result from new
survey schemes, the construction of new port facilities or the repositioning of a
navigational aid. Other information which is less dangerous in terms of navigation
is retained by the CH S for inclusion in new editions of nautical charts. All of this
information is recorded using a point system according to which the importance of
new data affecting each of the charts in the portfolio is assessed. The results are
used to evaluate this variable of the model.

7. AUTOMATION
In order to be able to use the model as effectively as possible, it was
decided to integrate it into the Apple-Macintosh environment in order to have
access to an infinite number of possibilities such as updating/manipulating various
scenarios and unlimited graphic outputing in various formats.
An electronic spreadsheet software (Wingz) was chosen in order to make it
possible to integrate the zone into spreadsheets, with the cells of the electronic
spreadsheet to the cells of the model (1 km 2) and the various layers to
spreadsheets dynamically linked by means of the software. The calculation
capabilities of linked spreadsheets enable us to do calculations integrating the data
for one zone over several or all layers, or calculations of mosaics in order to
cover several zones when analysing results. The ability to assign colours to the
values of the spreadsheet cells makes it possible to directly chart the results using
the electronic spreadsheet software (Fig. 4).
The hardware used is an Apple-Macintosh FX (8 MB of RAM) with a 19"
colour monitor and a Hewlett-Packard PaintJet printer for colour printouts.
8. INTEGRATION AND WEIGHTING OF THE LAYERS
The main reason for using an electronic spreadsheet system to support the
priority model is to be able to do calculations to integrate the various layers in
order to being out extremes and nuances which make it possible to graphically
interpret these results on a geographic basis.
These integration calculations are done by digitally combining the values of
each cell in each zone with the values of the corresponding cells in the various
layers of the same zone. This integration is carried out by means of calculations
integrating all the layers while at the same time making it possible to weight the
layers in relation to each other.
The purpose of each of the layers described above is to evaluate the
variables affecting navigational safety. It is important to note that their relative
importance varies from the point of view of navigational safety. The structure of
the model takes this fact into consideration and makes it possible to assign a
different weight to each of the variables in the primary, secondary and tertiary
layers.
The weights can be determined fairly easily by the system operator, with a
view to performing various calculations to simulate conditions, calibrate the model
or interpret the results.
In order to weight each of the variables, it is important for the planner to
test the model in a restricted sector where the interaction of the various variables
is well known. The result obtained during these tests can then be applied to the
whole of the territory covered by the model. Once the model is properly

Index-Chart
FlG. 4.— Electronic Spreadsheet.
calibrated, it should not be necessary to change these weights.
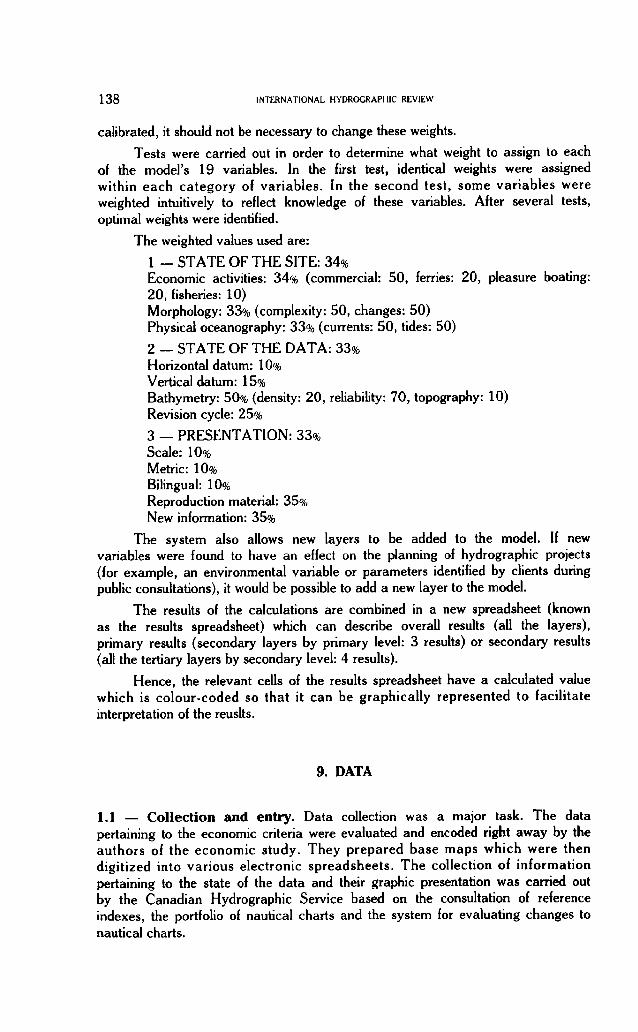
Tests were carried out in order to determine what weight to assign to each
of the model’s 19 variables. In the first test, identical weights were assigned
within each category of variables. In the second test, some variables were
weighted intuitively to reflect knowledge of these variables. After several tests,
optimal weights were identified.
The weighted values used are:
1 - STATE OF THE SITE: 34%Economic activities: 34% (commercial: 50, ferries: 20, pleasure boating:
20, fisheries: 10)
Morphology: 33% (complexity: 50, changes: 50)
Physical oceanography: 33% (currents: 50, tides: 50)
2 — STATE OF THE DATA: 33%
Horizontal datum: 10%
Vertical datum: 15%
Bathymetry: 50% (density: 20, reliability: 70, topography: 10)
Revision cycle: 25%
3 — PRESENTATION: 33%
Scale: 10%
Metric: 10%
Bilingual: 10%
Reproduction material: 35%
New information: 35%
The system also allows new layers to be added to the model. If new
variables were found to have an effect on the planning of hydrographic projects
(for example, an environmental variable or parameters identified by clients during
public consultations), it would be possible to add a new layer to the model.
The results of the calculations are combined in a new spreadsheet (known
as the results spreadsheet) which can describe overall results (all the layers),
primary results (secondary layers by primary level: 3 results) or secondary results
(all the tertiary layers by secondary level: 4 results).
Hence, the relevant cells of the results spreadsheet have a calculated value
which is colour-coded so that it can be graphically represented to facilitate
interpretation of the reuslts.
9. DATA
1.1 — Collection and entry. Data collection was a major task. The data
pertaining to the economic criteria were evaluated and encoded right away by the
authors of the economic study. They prepared base maps which were then
digitized into various electronic spreadsheets. The collection of information
pertaining to the state of the data and their graphic presentation was carried out
by the Canadian Hydrographic Service based on the consultation of reference
indexes, the portfolio of nautical charts and the system for evaluating changes to
nautical charts.

Tools such as command macros and menus were developed in order to
facilitate these operations by simplifying the work of the data-entry operators as
much as possible. The volume of data could become quite significant and could,
in the case of the Quebec region of the Canadian Hydrographic Service for
example, represent hundreds of spreadsheets and an equal number of zones, each
containing 19 interrelated spreadsheets, thereby resulting in a total of
approximately 2,000 different electronic spreadsheets. This requires the standardi
zation of the worksheet names as well as a sound archiving structure.
1*2 — Validation. Tools were developed to facilitate the validation of the
digitized data into the spreadsheets. Hard copy printouts identical to the data
collection sheets can be generated by the system in order to allow the operator to
carry out a visual verification by superimposing the two documents.
1*3 — Updating. Of course, this planning tool can be reliable only if it is
regularly updated to reflect changes in the various variables in the secondary and
tertiary layers. As far as the economic variables are concerned, a study should be
carried out every five to ten years in order to update or completely replace the
values in the model. Cycle of this kind makes it possible to reflect changes in
maritime activities, namely growth or decline.
Some variables, such as currents, tides and the complexity of the sea-floor,
are not subject to rapid changes. Therefore, it is not necessary to change the
model over the years for these three variables.
On the other hand, variables dealing with the state and presentation of the
data must, ideally, be updated at least once a year, An updating plan should be
put into place so that changes affecting these variables can be collected during
the years and entered into the system before the planning exercises for hydro- graphic projects.
Tools have also been developed to facilitate the updating operations using several basic commands.
10. RESULTS
The priority model is an instrument which can accurately reflect reality to
the extent that the raw data were carefully collected and digitized into electronic
worksheets, and that quality was controlled during these operations. Users of the
model must realize that the model is a planning tool and not a magical decision
making recipe. The tool itself is a means of verifying the interaction of a great
number of variables, a task which would not easily be accomplished using manual
evaluation methods. It has become an aid for planners by supporting their
decisions with systematic analyses. Use of this tool will enable them to more
effectively prioritize their work to take into account limited resources and
contentious choices, while at the same time ensuring that all of the known
physical and economic parameters have been considered.

11. AN ACTUAL CASE
The Montreal sector was chosen to illustrate the results that this model can
produce. It was chosen because the graphic representation is easy to interpret.
The Island of Montreal is bordered on the south by the St. Lawrence River and
the Seaway; Jésus Island is bordered on the south by the Rivière des Prairies and
on the north by the Rivière des Mille Iles.
A comparison of the results of the model with the manual analyses taken
from various databases reveals that the weighting applied to the model accurately
reflects reality. A detailed analysis of the three primary layers makes it possible
to identify the preponderant variables in each of the layers.
By analysing the state of the site layer, it is possible to clearly determine
that commercial navigation activities take place there since the commercial
channel is easily identifiable. Pleasure activities are also very important in the Lac
Saint-Louis sector. Verification with the base data reveals that the weight assigned
to the model seems to accurately describe reality.
The results of the compilation of the state of the data layer highlight the
Rivière des Mille lies sector. This is explained by the fact that there is no
bathymetric data available for this region. A maritime sector for which there is a
lack of data will be given priority so that corrective action can be taken. The
Rivière des Prairies is not highlighted, because recent surveys are available for
that sector. It should be noted that that sector of the St. Lawrence, with the
exception of the rapids, received a fairly high rating.
The model also provides quite an accurate representation of reality for the
presentation layer. In fact, the Rivière des Prairies and the Rivière des Mille Iles
sectors were given fairly high ratings because these sectors had not yet been
charted at the time of data entry. These zones must, therefore, be given a higher
priority than the sector of the St. Lawrence River for which charts already exist.
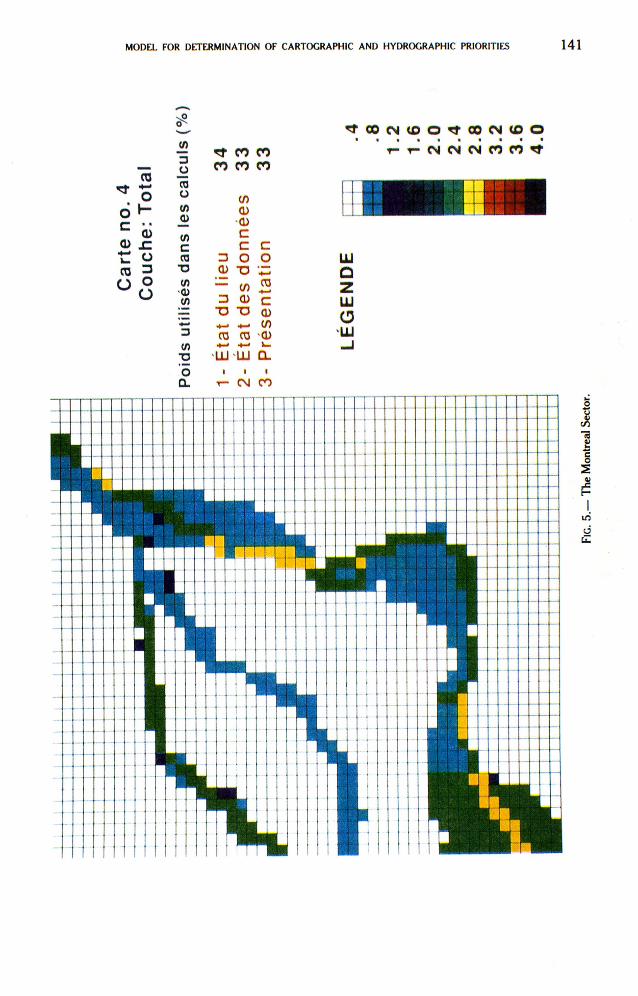
By performing the calculations for the three principal layers described above
(Fig. 5), it is possible to draw the following conclusions for the Montreal sector
from the automated model: the importance of maritime activities (commercial
navigation in the channel and pleasure boating on Lac Saint-Louis) stand out in
the overall results, especially in the Lac Saint-Louis sector. The Rivière des Mille
Iles is also identified as a priority zone owing to the fact that there are no
navigational data or charts available for this region. Sectors containing the Rivière
des Prairies sector and the St. Lawrence downstream from Montreal and outside
the channel have been assigned a fairly high rating, but have less priority than
the above-mentioned sectors.
Based on the analysis of the results of the model for the Montreal sector, it
can be concluded that comprehensive surveys should first be carried out in the
Lac Saint-Louis sector. Moreover, the Port of Montreal sector, which includes the
commercial channel, should be redone, as should the Rivière des Mille Iles.
Reviewed within the real life context of planning, the prioritization resulting
form this model might be slightly different. For example, the decision to carry out
oC
Qiv_
CO
O
CO•♦—I
oh-
Q)_co3Oo
•̂0'—'jfl CO CO3O CO CO COTOO c/51/ ) Q)Ç) -O(/) cc c cca 3 o oT3 CD T3 4—*(/) 1— V) (0■<D ■*—<(/) 3 Q) c— TJ T3 a)+-> •*-* +-< ¢/)3 co CO ■a>(/) + ->
T3 LU ■UJ CLO i 1 tCL T- CM CO
t C O O J I D O n C D C N I f l O
t - t — c \ i c n c n j c o c o * t
J:L
UJazUJ
OUJ

surveys for the Rivière des Mille Iles could be questioned, because the model
highlighted this region at the level of the state of the data layer because no data
or charts were available for this section. This does not in any way signify that
this expanse of water should be given priority or even charted. The river is
partially navigable by vessels with small drafts. This consideration should play a
part in the final planning decision. The purpose of the automated model is to
support and confirm planners’ decisions, not replace them. It is, therefore,
important to be able to put the findings of the model back into a real geopolitical
context. It becomes necessary to consider the various parameters present in the
system to aid in prioritizing and decision-making, as illustrated in the following
diagram (Fig. 6).
12. MOSAICS OF THE TERRITORY
This automated system also makes it possible to construct mosaics which
can be used to analyse the entire territory, thereby making it possible to compare
zones or regions.
In this way, the overall view of the Montreal/Quebec sector makes it
possible to identify which areas should be a priority in terms of surveying or
charting (Fig. 7).
By carrying out a detailed analysis of the mosaics of the three primary
layers (state of the site, state of the data and presentation) we noted that, in the
state of the site layer, the economic activities were differentiated from each other,
and even clearly indicated the areas of the channel in which they were the most
important. The same was true of morphological factors such as currents and
tides.
The analysis of the state of the data mosaic very clearly identified the
sectors for which no survey existed. The sectors for which recent surveys were
available were also identified.
When the mosaic of the presentation layer was analysed, the status of the
nautical charts provided very interesting results. For example, the sectors for
which recent surveys are available, but new charts are not, were clearly indicated.
The boundaries of the charts are well marked and it is easy to determine the
relative age of the charts on the basis of colour. The comprehensive mosaic of
the three layers places the interaction of the variables back into an overall
perspective.
On the comprehensive mosaic, the state of the site layer is identifiable in
that the commercial channel is indicated along the St. Lawrence. The Rivière des
Mille Iles sector is indicated because it has never been surveyed and no current
chart exists for this sector. This is the combined result of two of the primary
layers, namely the state of the data and presentation. The Lac Saint-Louis and
Sorel regions are indicated as priorities on the map because the integration of the
three layers indicates that the relevance of the variables affecting navigation is
higher than elsewhere.

RETR
OACT
ION
TO TH
E US
ERS
Decision model
FlC. 6.— Decision Model.

LUQZUJOUJ
<unCT
03</)o
O
<uszo13oo
oI</)oE
Eoz
00 CM CD OCM CO CO T f
to o ^r - CM CJIII
00 CN
I I
Fig
. 7.-
Mos
aics
of the
Terr
itory
.

13. CONCLUSION
The analysis of the results for an actual case clearly indicates the validity
of the model and automated system developed to apply it. The weighting
realistically highlights the variables in question and the overall results seem quite promising for this planning tool.
The use of an automated tool interrelating several important variables
allows planners to systematically take into consideration all of the factors which
determine the priority of hydrographic projects. The overall analyses which can be
carried out from this model make this tool significantly more useful than conventional planning methods.
The priority model is an indispensable aid; however, judgement must be
used so that the model supports planners’ decisions rather than replaces them.
In terms of consultation and improved service to the client, the evaluation
of needs is one of the most important stages of the planning process. During this
process, the needs identified are assessed in relation to the priorities of the model.
It is very important to ensure that hydrographic activities consider all the
variables that affect them, on the basis of their relative importance. Once properly
calibrated, the priority model will enable planners to make better choices in order to meet various user needs.