model-based catalyst selection for the oxidative coupling
TRANSCRIPT

1
Model-based Catalyst Selection for the Oxidative
Coupling of Methane in an Adiabatic Fixed-Bed
Reactor
Laura Pirro†, Ana Obradovic†, Bart D. Vandegehuchte‡, Guy B. Marin†, Joris W. Thybaut*,†
† Laboratory for Chemical Technology, Ghent University, Technologiepark 914, B-9052
Ghent, Belgium
‡ Total Research & Technology Feluy, Zone Industrielle Feluy C B-7181, Seneffe, Belgium
ABSTRACT: Adiabatic operation of catalytic fixed-bed reactors for Oxidative Coupling of
Methane (OCM) has been simulated using a detailed microkinetic and reactor model. For
several catalysts (1%wtSr/La2O3, 10%wtLa-20%wtSr/CaO, 4%wtSn-2%wtLi/MgO and 12%wtMn-
20%wtNa2WO4/SiO2), diverse in activity and selectivity towards C2+ products, operating
conditions have been determined that maximize C2+ yield at low inlet temperature T0 (<< 923
K). A prior analysis of light-off curves served as a guideline for optimal operating temperature
ranges for each catalyst.
Imposing a maximum temperature in the reactor (Tmax≤ 1273 K) suggested a limit for the
catalytic performances, corresponding to 13% CH4 conversion and 61% C2+ selectivity at the
reactor outlet for an active (T0= 723 K) Sr/La2O3 catalyst, and an improved 19% CH4 conversion
and 82% C2+ selectivity for a less active (T0= 853 K) NaMnW/SiO2 catalyst. The obtained

2
results indicated catalyst selectivity, rather than activity, as the key parameter for an industrially
relevant adiabatic OCM process.
1. INTRODUCTION
Oxidative Coupling of Methane (OCM) has been under the academic spotlight for the last 36
years1 thanks to its potential to convert methane-rich feedstocks directly into added-value
chemicals2, rather than via synthesis gas. Methane is the main constituent of many abundant
resources such as natural gas3, shale gas4 and biogas5. Ethylene, the desired product of OCM,
is situated at the heart of the petrochemical industry6 and its production is globally achieved via
steam cracking, which, unfortunately, is not economically viable for small scale applications or
for stranded gas reservoirs7.
The economic driver has raised ubiquitous interest toward the OCM process in the last decades.
The drawbacks that have so far hampered its industrial implementation can be understood by
from the chemistry and the thermodynamics of the key global reactions:
CH4 + 0.25 O2 → 0.5 C2H6 + 0.5 H2O ∆𝑟𝐻0 = –88 kJ/molCH4
CH4 + 0.5 O2 → 0.5 C2H4 + H2O ∆𝑟𝐻0 = –141 kJ/molCH4
C2H6 + 3.5 O2 → 2CO2 + 3H2O ∆𝑟𝐻0 –1429 kJ/molC2H6
C2H4 + 3O2 → 2CO2 + 2H2O ∆𝑟𝐻0= –1324 kJ/molC2H4
The hydrocarbon products (C2H6 and C2H4), as well as the primary reactant (CH4) itself, can
undergo total oxidation. As C2 hydrocarbons are more reactive than methane8, the maximum
achievable C2+ yield at relevant operating conditions is limited by the inverse relationship
between CH4 conversion and C2+ selectivity9.
Furthermore, coupling to C2+ products is exothermic, but the exothermicity of competitive
oxidation is much more pronounced. Considering that the threshold for catalytic methane

3
activation in OCM is situated typically around 923 K10, such thermal power release at high
temperatures causes safety and operational concerns that jeopardize the scale-up of the
reaction11.
These challenges have been tackled through optimization studies about catalytic materials12,
reactor configurations13 and process layouts14, 15, with a specific focus on C2+ selectivity and
yield maximization. Concerning OCM exothermicity, a wave of new studies has arisen from
the idea of exploiting the thermal power generated by the reaction, instead of just considering
it as a nuisance to be handled. The ignition and extinction of the reaction has in fact been
investigated for powder16, 17, pellet18 and nanofiber catalysts19, 20 and this has led to the concept
of ‘autothermal’ OCM reactors21, 22. In the present context ‘autothermal’ indicates that the
process can be self-sustained thanks to the thermal power generated by the reaction; the
operation of the reactor is therefore shifted towards lower inlet temperatures, which results in
reduced CAPital and OPerational Expenses.
Low inlet temperature operation is one of the features of the Siluria OCM process, which,
following the opening of a demonstration facility in 2015 in La Porte (Texas, USA), is so far
the only company that claims to come close to the commercialization of OCM23. The low inlet
temperature solution proposed by Siluria includes an adiabatic fixed-bed reactor for OCM24.
The gas mixture is heated up along the reactor thanks to the OCM exothermicity and the higher
temperatures achieved at the outlet are exploited to perform ethane dehydrogenation of a
secondary stream in a post-bed cracking section25.
While the majority of the laboratory scale reactors is operated in a pseudo-isothermal regime26,
27, adiabatic operation seems the only technical solution to fixed-bed industrial-scale reactors17,
thus urging on re-evaluating and comparing the performance of OCM catalysts in adiabatic
mode. OCM is in fact characterized by a peculiar two-way relationship between temperature
and selectivity: on one hand the adiabatic temperature rise is influenced by the selectivity28,

4
with non-selective oxidation reactions being more exothermic than the C-C coupling; on the
other hand the maximum achievable C2+ selectivity increases with temperature29, thanks to the
formation rate of surface methyl radicals surpassing the rate of methane oxidation. For each
catalyst, fine-tuning of the operating conditions is therefore vital to reach an optimal trade-off
between a low inlet temperature and a high C2+ selectivity and yield. In addition, operational
constraints need to be taken into account with respect to safety such as respecting the maximum
temperature allowed by the metallurgy of the reactor.
The present simulation study aims at elucidating the yield-temperature relationship in adiabatic
fixed-bed reactors for OCM and to provide guidelines for catalyst selection in the industrially-
relevant OCM process in adiabatic mode. Considering that the operating temperature range is
an important performance criterion, both in terms of inlet and maximum reactor temperature,
analyzing simulated light-off curves30 aids considerably in comparing the performance of OCM
catalysts. In the present context, light-off curves report the oxygen conversion at the outlet of
the OCM reactor as a function of the gas inlet temperature.
Adiabatic OCM has already been studied in the past using simulation models based on global
kinetic schemes31-33, such as the one from Stansch et al.34. However, these models are usually
less reliable outside their design range, which definitely did not include adiabatic test data. In
the present study, adiabatic OCM is investigated by using a detailed descriptor-based
microkinetic model35, which does not assume any rate-determining step and guarantees
thermodynamic consistency through catalytic cycles, therefore resulting in high flexibility in
describing the reaction chemistry with varying operating conditions and different catalysts.
In the first part of the work, the essential features of the previously developed microkinetic
model are summarized35-37, together with the adiabatic reactor model equations. The fixed-bed
reactor is modelled as a 1D heterogeneous Plug Flow Reactor (PFR), therefore none of the
ignition/extinction phenomena arising from multiplicity of steady states are aimed at. For the

5
readers specifically interested in such phenomena, very recent, more dedicated literature on the
topic is available27, 38, 39. Instead, the present work specifically focuses on the so-called ‘light-
off’ behavior. Background information on light-off curves is provided, clarifying the adopted
terminology and exploring their applicability to adiabatic OCM. Subsequently, the adiabatic
simulation results are presented and discussed in three sections: the first one zooming in on the
key features of adiabatic operation, the second section on light-off curves obtained for four
OCM catalysts, and the final section evaluating the impact of operational constraints on the
overall performance and on the criteria for catalyst selection.
It should be mentioned that the present simulations do not take catalyst deactivation with time-
on-stream into account. Nevertheless, qualitative trends in the catalytic performances can be
established specifically for start-of-run activities in adiabatic OCM.
2. MODELLING TOOLS
2.1 Microkinetic Model
The OCM reaction kinetics were calculated according to a detailed microkinetic model, which
accounts for the complex chemistry of the reactions occurring both in the gas phase and on the
catalyst surface. The microkinetic model comprises 39 reversible gas-phase reactions and 26
reversible reactions on the catalyst surface35; see Tables S1 and S2 in the Supporting
Information for more details. The species which have been considered are: 13 molecules (H2,
H2O, H2O2, O2, CH4, CH2O, CO, CO2, C2H2, C2H4, C2H6, C3H6, C3H8), 10 radicals (H, O,
OH, HO2, CHO, CH3O, CH3, C2H3, C2H5, C3H7) and 10 surface species (O∗, OH∗, H2O∗,
CO∗, CO2∗, CHO∗, CH2O∗, CH3O∗, C2H3O∗, C2H4O∗), plus the free active sites ∗. The gas-
phase reaction network is based on free-radical mechanisms widely adopted in combustion
chemistry, with the kinetic parameters regressed towards non-catalytic OCM experimental data;
furthermore, the mechanism has been reduced via sensitivity and contribution analyses. The

6
surface reaction network is based on catalytic cycles and thermodynamic consistency within
these cycles; it describes the overall reaction in terms of elementary steps involving adsorbed
reactants, products, and reaction intermediates associated with active sites, without assuming
any rate-determining step. The implementation of thermodynamic relationships in a
microkinetic model is one approach in relating kinetic parameters to catalyst properties and
simultaneously reducing the number of adjustable parameters. The model parameters are
classified into kinetic and catalyst descriptors. The former do not depend on the catalyst, but
relate purely to the reaction kinetics, whereas the catalyst descriptors represent the physical and
chemical properties that are characteristic of the specific features of the different catalysts that
have been investigated37. The use of catalyst descriptors, such as the chemisorption enthalpy,
the sticking probability and the active site density, allows formulating properties-performance
relations via the reaction kinetics. These descriptors are typically obtained via model regression
using isothermal experimental data and the performance of different catalytic materials can be
simulated without any prior assumptions on the rate-determining step and the dominant
pathway. A detailed explanation of the descriptors used in the OCM kinetic model has been
provided in the previous works36, and herein a summary is reported in Table S3 of the
Supporting Information.
The microkinetic model has proven to be successful in describing experimental data over 5
different catalysts in a broad range of operating conditions; with some modifications in the
kinetic parameters, it has also been used by other research groups to reproduce experimental
data obtained for nanofiber fabric catalysts40. In the present work, the following catalysts are
considered: 10%wtLa-20%wtSr/CaO37, 1%wtSr/La2O336, 4%wtSn-2%wtLi/MgO35 and 12%wtMn-
20%wtNa2WO4/SiO226. The physical and chemical properties used for the modelling purposes
can be found in the above referred literature.

7
2.2 Reactor Model
OCM kinetics were implemented into an adiabatic Plug Flow Reactor (PFR) model, which
accounts for irreducible transport limitations of radicals35 . The reactor model is:
- 1-Dimensional: no radial concentration and temperature gradients are considered on the
reactor scale; only the dimensionless axial coordinate z ∈ [0,1] is accounted for on the reactor
scale; z= x/L, where x ∈ [0,L] is the axial coordinate and L is the reactor length.
- Heterogeneous: on the particle-scale two different phases are considered. The intraparticle
phase consists of the catalyst particles and the gas contained in their pores; the interstitial
phase accounts for the gas around the particles. These two phases are represented by two
different coordinate systems on the particle scale. The intraparticle phase is described using
spherical symmetry by the radial coordinate 𝜉 ∈ [0, dP/2], where 0 is the center of the catalyst
particle and dP/2= rP is the particle radius. The interstitial phase is described using cylindrical
symmetry by the radial coordinate 𝑟 ∈ [0, dV/2], where 0 is the center of the gas phase and
dV is the characteristic dimension of the interstitial phase, i.e. the average distance between
two catalyst particles.
The thermal power generated by the reaction was included in an adiabatic energy balance,
where axial solid conduction on the reactor scale was considered negligible. This assumption
is part of the ideal PFR model, without axial dispersion, and therefore applies to reactors with
high (> 50) L/dp ratio41, operated at high (> 10) Peclet numbers, and in an operating range
leading to low (< 40) Zeldovich numbers, namely high (>> 300K) inlet temperatures and high
(> 8) methane-to-oxygen inlet ratios38.
The balance equations and the corresponding boundary conditions are reported in Table 1. For
a detailed description and the corresponding list of symbols, the reader is referred to paragraph
4 of the Supporting Information.

8
Table 1. Adiabatic Reactor Model Equations.
Interstitial Phase Intraparticle Phase
Mass
Balance35
𝐹𝑉
𝐴𝑠
𝜕𝐶𝑖,𝑔
𝜕𝑧− 𝜀𝑏
𝐷𝑚,𝑖
𝑟
𝜕
𝜕𝑟(𝑟
𝜕𝐶𝑖,𝑔
𝜕𝑟) = 𝜀𝑏𝑅𝑖,𝑔 −
𝐷𝑒,𝑖
𝜉2
𝜕
𝜕𝜉(𝜉2
𝜕𝐶𝑖,𝑐
𝜕𝜉) = 𝜀𝑐 𝑅𝑖,𝑔 + 𝑅𝑖,𝑐
Boundary
Conditions35
𝑧 = 0 ∧ 0 < 𝑟 <𝑑𝑉
2, 𝐶𝑖,𝑔 = 𝐶𝑖,0
𝜉 = 0,𝜕𝐶𝑖,𝑐
𝜕𝜉= 0
𝑧 > 0 ∧ 𝑟 = 0,𝜕𝐶𝑖,𝑔
𝜕𝑟= 0
𝜉 =𝑑𝑃
2, 𝐶𝑖,𝑔 = 𝐶𝑖,𝑐 𝑧 > 0 ∧ 𝑟 =
𝑑𝑉
2,
−𝑎𝑔𝐷𝑚,𝑖
𝜕𝐶𝑖,𝑔
𝜕𝑟= 𝑎𝑐𝐷𝑒,𝑖
𝜕𝐶𝑖,𝑐
𝜕𝜉
Energy
Balance
𝐹𝑊 𝐶𝑝,𝑔
𝐴𝑠
𝜕𝑇𝑔
𝜕𝑧=
𝜆𝑔
𝑟
𝜕
𝜕𝑟(𝑟
𝜕𝑇𝑔
𝜕𝑟)
− 𝜀𝑏 ��𝑔𝑖𝑛𝑡𝑒𝑟𝑠𝑡
∀𝜉: 𝑇𝑐 = 𝑐𝑜𝑛𝑠𝑡.
Boundary
Conditions
𝑇𝑔 = 𝑇0
𝜉 =𝑑𝑝
2: 𝑇𝑐 = 𝑇𝑔
𝑧 = 0, ∀ 𝑟:𝜕𝑇𝑔
𝜕𝑟= 0
𝑧 > 0 ∧ 𝑟 =𝑑𝑣
2,
𝑎𝑔𝜆𝑔
𝜕𝑇𝑔
𝜕𝑟= (1 − 𝜀𝑏) [𝜀𝑐 ��𝑔
𝑖𝑛𝑡𝑟𝑎𝑝
+ ��𝑐𝑖𝑛𝑡𝑟𝑎𝑝 ]
A schematic representation of the reactor model considered in the present work is reported in
Figure 1. It can be observed that two different temperatures are considered on the particle scale:
the temperature of the interstitial phase (only gas), Tg, and the temperature of the intraparticle
phase (solid + gas), Tc. The difference between the two phases is accounted for due to the low
thermal conductivity of the gas that results in temperature gradients in the interstitial phase; on
the other hand, the solid conductivity of a single catalyst particle is sufficiently high to assume
particle isothermicity. More detailed information about the relative importance of intraparticle
and interstitial temperature gradients are reported in paragraph 5 of the Supporting Information.

9
Figure 1. Schematic representation of the heterogeneous 1-D fixed-bed reactor model; adapted from 35.
In order to simplify the interpretation of the results, when a temperature profile is shown in the
following paragraphs, only one temperature is reported at each coordinate along the reactor, i.e.
the average value of the temperature of the interstitial and the intraparticle phase. This
graphical simplification does not affect the validity of our conclusions, because, given the
oxygen-lean operating conditions and the small particle dimension (≤ 300 μm) of the simulated
catalysts, the difference between the temperature at the center of the interstitial phase and the
particle surface in the present study is negligible (rate deviations < 2%42). Care should be taken
when extrapolating the results of the present work to cases where these local gradients would
not be negligible, because in case of such an exothermic reaction as OCM they might represent
a source of multiplicity of steady states43.
2.3 Light-off Curves
Given a specific catalyst and a fixed set of operating conditions, a light-off curve shows the
conversion of the limiting reagent at the outlet of a catalyst bed as a function of the fluid inlet
temperature T030. Light-off curves traditionally pertain to the domain of exhaust treatment
research44, but adiabatic OCM operation clearly shows an analogy with the cold-start of a
Intraparticle
phase
Ci,00
1
z
dt
Reactor
inlet
Reactor
outlet Ci,L
rp
0rp0 r
ξrv
Interstitial
phase
Ci,g Ci,c
rv
Tc
T0
Ci,z
Tz
Tg

10
catalytic converter: an active catalyst initiates the reaction desirably at the lowest temperature
possible to, in the case of OCM, minimize the external energy input required.
In addition to well-known applications in the design and optimization of Diesel Oxidation
Catalysts (DOC)45 and Three Way Catalytic Converters (TWC)46, light-off curves have been
employed to analyze other catalytic oxidation reactions, such as toluene47, formaldehyde48,
ammonia49 and, more extensively, methane50 combustion. For all reactions mentioned above,
light-off curves referred to the conversion of a pollutant/fuel as the limiting reagent that was
completely oxidized at the outlet of the reactor. However, if the focus is shifted from fuel
conversion to oxidant conversion, light-off curves can be useful for other exothermic, catalytic
reactions where the oxidant is fed in sub-stoichiometric amounts to prevent full oxidation of a
carbon-based feed. Some notable examples are syngas production via Catalytic Partial
Oxidation (CPOX)51 and the Oxidative Dehydrogenation (ODH) of ethane52. OCM belongs to
this group of ‘oxygen-limited’ reactions, the reacting mixture always being rich in methane
(reactant inlet molar ratio CH4/O2|z=0> 2)53.
Therefore, in the present work, light-off curves for OCM catalysts report the oxygen conversion
XO2 at the outlet reactor as a function of the gas inlet temperature T0.
The inlet temperature leading to 50% conversion of the limiting reagent (T0|XO2= 50%) is
defined as the light-off temperature (TLO)54 and it is usually close to the inflection point in the
light-off curve. Vandewalle et al.39 have demonstrated that the unicity of the steady-state for
OCM is satisfied when the reaction takes place in a PFR, therefore, only one light-off
temperature can be identified for each combination of catalyst and operating conditions.
Another variable of interest in the present study is the minimum inlet temperature required for
complete oxygen conversion (T0min|XO2= 100%), as it represents the industrially most feasible
operating point, and is here indicated with T0*.

11
A third relevant parameter is the slope of the curve in the proximity of TLO; this is indicated
with tgα and is calculated as: 𝑡𝑔𝛼 = 𝑑𝑋𝑂2
𝑑𝑇0|𝑇0=𝑇𝐿𝑂
3. SIMULATION RESULTS AND DISCUSSION
3.1 Adiabatic vs isothermal operation: a case study
In this section, a case study on a selected benchmark catalyst is briefly presented to highlight
the key characteristics of an OCM adiabatic reactor in terms of temperature and concentration
profiles. The 1%wtSr/La2O3 catalyst seems particularly promising for adiabatic operation thanks
to its high thermal resistance55, and has therefore been chosen for the present case study.
A typical simulation result of adiabatic OCM is reported in Figure 2 (red bars) in terms of CH4
conversion, and C2+ selectivity and yield. The operating conditions are the following: inlet
temperature T0= 840 K, total pressure pt= 150 kPa, reactants molar inlet ratio CH4/O2|z=0= 12,
gas hourly space velocity GHSV= 35000 h-1, space time W/FCH4,0= 3.45 kgcat s/molCH4,0, no gas-
phase dilution.

12
Figure 2. Adiabatic and isothermal simulated performances of a 1%wtSr/La2O3 fixed-bed reactor. The operating
conditions are the following: Adiabatic – T0= 840 K, GHSV≅ 35000 h-1, W/FCH4,0= 3.45 kgcat s/molCH4,0;
Isothermal – T= 1073 K, W/FCH4,0= 0.34 kgcat s/molCH4,0, GHSV≅ 350000 h-1. For both cases: pr= 150 kPa,
CH4/O2|z=0= 12, complete oxygen conversion in correspondence to the reactor outlet.
The inlet temperature value has been set to an arbitrary value lower than the minimum
temperature used for isothermal tests (i.e. < 923 K). A low pressure has been chosen in line
with the majority of literature data and following the negative impact of high pressure on OCM
gas-phase kinetics56. The pronounced excess of methane (reactants inlet ratio 6-fold higher than
stoichiometrically required for ethylene production) is in accordance with previous literature32
and should lead to a gradual and limited temperature increase along the catalyst bed. The space
time has been adapted so as to exactly establish complete oxygen conversion at the reactor
outlet. Further investigation of methane and C2 gas-phase reactivity after the point of oxygen
depletion is beyond the scope of the present work, given the focus on the comparison of catalytic
performances.
Throughout this work, only the combinations of operating conditions leading to complete
oxygen conversion are considered in view of commercial interest. Additionally, this approach
YieldSelectivityConversion
10% 9%
62%60%
6% 5%
0%
5%
10%
15%
20%
25%
30%
35%
40%
45%
50%
55%
60%
65%
Adiabatic (T0= 840K) Isothermal (T= 1073K)
CH
4C
on
vers
ion
, C
2+
Sele
cti
vit
y a
nd
Yie
ld
Adiabatic (T0= 840K) Isothermal (T= 1073K)

13
alleviates the safety concerns, which would arise in a facility downstream the OCM reactor in
presence of residual oxygen. The C2+ yield at complete oxygen conversion is further denoted
as the C2+ ultimate yield, being the maximum value that can be achieved by a catalyst at a given
set of operating conditions. The ultimate yield is therefore a critical parameter in catalyst
selection.
As a reference for this case study, the same catalytic bed was simulated in the case of perfect
isothermicity at T = 1073 K. This reaction temperature has been chosen in order to achieve
performances comparable to the adiabatic case in terms of conversion and selectivity at the
reactor outlet. The results corresponding to simulated isothermal operation are reported in green
in Figure 2. These results are obtained assuming an ideally perfect cooling strategy, which
enables to obtain the same temperature in each point of the reactor and results in no hotspot. It
is therefore clear that this assumption is not representative of the actual situation in the majority
of the pseudo-isothermal experimental set-ups11 and in the present work, as suggested also in
previous literature31, it represents a model benchmark, as opposed to the model case of a
perfectly adiabatic reactor.
Figure 2 highlights the key distinguishing feature of adiabatic operation of the fixed-bed
reactor: catalytic performances (XCH4= 10%, SC2+= 62%, YC2+= 6%) comparable to the ones in
a perfectly isothermal operation (XCH4= 9%, SC2+= 60%, YC2+= 5%) were obtained, for this
specific case study, by feeding a more than 200 K ‘colder’ gas stream.
To ensure complete oxygen conversion, the space time was varied in both cases: for the
isothermal reactor a 10 times lower space time (W/FCH4,0= 0.34 kgcat s/molCH4,0) was sufficient
to achieve complete oxygen depletion at the reactor outlet compared to the adiabatic case. The
higher space time used in the adiabatic case was in fact necessary to compensate for the low
activity at low temperature and this represents another major difference between the two
operating modes.
14
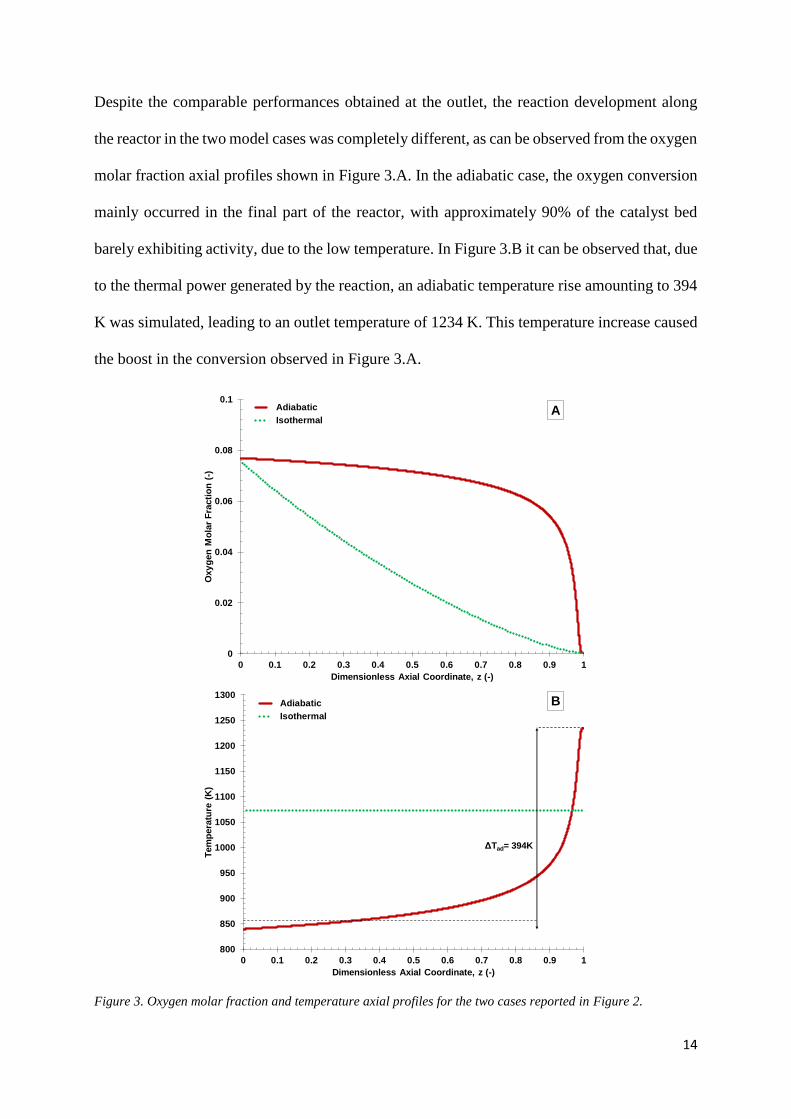
Despite the comparable performances obtained at the outlet, the reaction development along
the reactor in the two model cases was completely different, as can be observed from the oxygen
molar fraction axial profiles shown in Figure 3.A. In the adiabatic case, the oxygen conversion
mainly occurred in the final part of the reactor, with approximately 90% of the catalyst bed
barely exhibiting activity, due to the low temperature. In Figure 3.B it can be observed that, due
to the thermal power generated by the reaction, an adiabatic temperature rise amounting to 394
K was simulated, leading to an outlet temperature of 1234 K. This temperature increase caused
the boost in the conversion observed in Figure 3.A.
Figure 3. Oxygen molar fraction and temperature axial profiles for the two cases reported in Figure 2.
0
0.02
0.04
0.06
0.08
0.1
0 0.1 0.2 0.3 0.4 0.5 0.6 0.7 0.8 0.9 1
Oxy
gen
Mo
lar
Fra
cti
on
(-)
Dimensionless Axial Coordinate, z (-)
Adiabatic
IsothermalA
800
850
900
950
1000
1050
1100
1150
1200
1250
1300
0 0.1 0.2 0.3 0.4 0.5 0.6 0.7 0.8 0.9 1
Tem
pera
ture
(K
)
Dimensionless Axial Coordinate, z (-)
Adiabatic
Isothermal
ΔTad= 394K
B

15
A similar trend can be observed in Figure 4, where the particle-reactor scale concentration field
of CH3 is reported for both the adiabatic (A) and the isothermal (B) case.
Figure 4. Particle-reactor scale 3-D fields of CH3 concentration in case of adiabatic (A) and isothermal (B)
operation for the case study described in Figures 2 and 3. On the particle-scale coordinate, 0 corresponds to the
center of the catalyst particle.
For highly reactive species such as radicals, particle-scale transport phenomena play a crucial
role in the overall catalytic bed performances. We therefore zoom in on the concentration
profiles from both the reactor and the particle scale. As already reported in previous literature
about isothermal OCM35, the CH3· radical concentration is higher in the intraparticle phase
A
B

16
than in the interstitial phase, since CH3· is mainly formed via methane activation on the catalyst
surface. The concentration decreases significantly in the proximity of the particle external
surface, due to the diffusion barrier towards the interstitial phase. In the adiabatic case (Figure
4.A), the CH3· concentration profile along the reactor coordinate follows the same trend as the
temperature: a sharp temperature increase at approximately 90% of the reactor length provokes
a boost in the reaction rates and, hence, in the CH3· radical concentration, of which the
maximum value is roughly double compared to the one from the isothermal case. The adiabatic
CH3· profile is non-monotonous: the concentration peak corresponds to the temperature peak
in Figure 3.B, which is linked to complete oxygen depletion, as shown in Figure 3.A. Finally,
it is worth highlighting that the concentration differences between the intraparticle and
interstitial phase, which are present also in isothermal operation (Figure 4.B), are magnified in
the terminal part of the adiabatic reactor where mass transport limitations for the radicals are
more pronounced due to the high temperature.
3.2 Comparison of OCM catalysts by means of light-off curves
Exploiting the thermal power generated by the reaction and the consequent adiabatic
temperature rise along the reactor axis, it was demonstrated that OCM catalysts should not be
evaluated simply in terms of C2+ yield, but also in terms of the minimum inlet temperature
achieving those yields. Light-off curves were employed herein as preliminary screening tools
to compare the operating temperature ranges for different OCM catalysts.
Figure 5 reports the light-off curves for the four investigated catalysts (10%wtLa-20%wtSr/CaO,
1%wtSr/La2O3, 4%wtSn-2%wtLi/MgO and 12%wtMn-20%wtNa2WO4/SiO2), simulated at the
same operating conditions as reported in Figure 2: total pressure pt= 150 kPa, reactants molar
inlet ratio CH4/O2|z=0= 12, gas hourly space velocity GHSV= 35000 h-1, space time W/FCH4,0=
3.45 kgcat s/molCH4,0, no gas-phase dilution. The investigated temperature ranges were adapted

17
for each catalyst in order to be able to obtain the full curve, up to complete oxygen conversion.
The corresponding values for TLO and T0* are indicated on the graph.
Each data point of the reported curves represents a potential operating point for that particular
catalyst and contains a substantial amount of information, such as concentration fields, adiabatic
temperature rise and performance at the outlet of the reactor. As an example, it can be
highlighted that the adiabatic case study previously shown in Figures 2, 3 and 4 corresponds to
the point (840 K,100%) on the orange curve, pertaining to the 1%wtSr/La2O3 catalyst.
Figure 5. Light-off curves for 10%wtLa-20%wtSr/CaO, 1%wtSr/La2O3, 4%wtSn-2%wtLi/MgO and 12%wtMn-
20%wtNa2WO4/SiO2. Operating conditions: pt= 150 kPa, CH4/O2|z=0= 12, GHSV= 35000 h-1, W/FCH4,0= 3.45 kgcat
s/molCH4,0, no gas-phase dilution.
The order of increasing catalyst activity (NaMnW/SiO2 < Sn-Li/MgO < Sr/La2O3 < La-
Sr/CaO), which follows the order of decreasing light-off temperatures (1029 K > 908 K > 838
K > 790 K), corresponds well with the activity order observed at isothermal conditions as
reported in the literature for the investigated catalysts37. However, it is now quantified for the
first time that these differences in activity would lead, in this specific case study, to a difference
in light-off temperatures as high as 240 K in an adiabatic fixed-bed reactor.
0%
10%
20%
30%
40%
50%
60%
70%
80%
90%
100%
700 750 800 850 900 950 1000 1050 1100
Ou
tle
t O
xyg
en
Co
nve
rsio
n,
XO
2(-
)
Inlet Temperature, T0 (K)
La-Sr/CaO Sr/La2O3 Sn-Li/MgO NaMnW/SiO2
TLO= 790K
T0*= 792K
TLO= 838K
T0*= 840K
TLO= 908K
T0*= 916K
TLO= 1029K
T0*= 1038K

18
The four catalysts differed not only in terms of TLO but also in the shape of their light-off curves,
which was compared in terms of tgα, i.e. the slope of the tangent to the curve at TLO. This
parameter can be considered as a measure for temperature control within an adiabatic fixed-
bed reactor: the steeper the light-off curve, the more pronounced the effect of a small increase
in the inlet temperature around TLO will be on both the outlet oxygen conversion and,
consequently, the peak temperature in the reactor.
Table 2 reports tgα, together with the selectivity to C2+ hydrocarbons achieved for T0= T0* and
the corresponding adiabatic temperature rise for each catalyst.
Table 2. Slope of the tangent to the light-off curve, selectivity to C2+ hydrocarbons and adiabatic temperature rise
corresponding to T0=T0*, for the four catalysts reported in Figure 5. Operating conditions: CH4/O2|z=0= 12, pt=
150 kPa, no gas-phase dilution, GHSV= 35000 h-1, W/FCH4,0= 3.45 kgcat s/molCH4,0.
Catalyst tgα (K-1) SC2+ for T0=T0* (-) Adiabatic Temperature
Rise for T0= T0* (K)
La-Sr/CaO 16.6 10-2 45% 411
Sr/La2O3 16.4 10-2 62% 394
Sn-Li/MgO 3.9 10-2 84% 343
NaMnW/SiO2 3.4 10-2 90% 271
tgα was found to be a good indicator of the selectivity towards C2+ products at iso-oxygen
conversion, with the least selective catalysts giving rise to steeper curves. This is due to the
previously mentioned inverse relationship between selectivity and adiabatic temperature rise:
the non-selective oxidation reactions to COx generate more thermal power than the coupling
reaction, thus increasing reaction rates more rapidly and bringing the system to complete
oxygen depletion. Therefore comparing the shapes of light-off curves of different OCM
catalysts simulated at the same operating conditions can be used as a measure of the
‘explosiveness’ of the reaction.
The impact of the operating conditions on the light-off curves was evaluated for the 4%wtSn-
2%wtLi/MgO catalyst: space time, pressure, methane to oxygen inlet ratio, gas-phase dilution
and particle diameter were analyzed. The results are reported in the Supporting Information and
are summarized as follows: every change in the operating conditions which results in an

19
increase in conversion and/or a decrease in C2+ selectivity, leads to a decrease in light-off
temperature and an increase in tgα. Among the investigated variables, changes in the space time
and inlet composition were found to be the most influential on the light-off temperature and,
together with the inlet temperature, were selected as the main manipulation variables for the
next section of the study. For a quantification of the above mentioned effects, the reader is
referred to paragraph 6 of the Supporting Information.
3.3 Tuning the operating conditions for low temperature – high yield operation
Light-off curves have shown to be powerful tools in identifying and comparing the minimum
inlet temperature required for the adiabatic operation of OCM catalytic beds. This was regarded
as the first step in the selection of suitable OCM catalysts and it served as preliminary guideline
in the performance-oriented analysis, which is going to be presented in this section.
The C2+ ultimate yield, obtained by adjusting the space time in order to simulate the
performances of all catalysts at complete oxygen conversion at the reactor outlet, was herein
considered as the main catalyst selection criterion.
An optimal yield was obtained each time by fine-tuning the operating conditions: more
specifically the inlet temperature T0 and the reactants molar inlet ratio CH4/O2|z=0. The operating
pressure was fixed to the value of 150 kPa to reduce the degrees of freedom. The choice of low
pressure, already anticipated in section 3.1, was further sustained by the light-off study reported
in the Supporting Information (Fig. S4).
Four additional operational constraints were imposed in the tuning procedure:
(i) T0< 923 K, this being the primary goal of a low inlet temperature adiabatic fixed-bed
reactor for OCM;
(ii) Tmax≤ 1273 K, as maximum work temperature for non-refractory lined stainless steel
reactors57;
(iii) GHSV ≥ 1000 h-1, in order to limit the maximum reactor size;

20
(iv) C2+ selectivity ≥ 60%, to limit separation train duties downstream the OCM reactor.
Conditions (iii) and (iv) were based on the patents of Siluria Technologies58, 59 as the lowest
reported values for GHSV and C2+ selectivity; therefore, in the present work they were
considered as the threshold for the economic viability of an adiabatic OCM process.
Figure 6 shows the investigated ranges for T0 and CH4/O2|z=0 for the 1%wtSr/La2O3 catalyst,
reported as contour plots of the maximum temperature in the reactor Tmax and the C2+ ultimate
yield. In order to achieve complete oxygen conversion at the reactor outlet, the GHSV was
varied in the range 1100-82000 h-1, corresponding to a space time variation in the range of 1.57
– 116.63 kgcat/molCH4,0.
The trend in Tmax at a given reactants inlet ratio clearly follows the increasing T0. For a fixed
inlet temperature, Tmax is linked to the adiabatic temperature rise, in turn depending on the C2+
selectivity: a low reactant inlet ratio promotes non-selective oxidation reactions, thus leading
to more exothermicity. For this reason, increasing CH4/O2|z=0 lower Tmax were obtained even
when operating the reactor under higher T0.
The C2+ ultimate yield follows the same trend as the temperature: the maximum methane
conversion that can be achieved at complete oxygen conversion increases with a decreasing
inlet ratio, and both conversion and selectivity are improved at higher inlet temperatures.
With respect to the maximum temperature allowed, only the part framed by yellow line satisfies
constraint (ii): the highest C2+ yields simulated were discarded as they were obtained at Tmax
exceeding 1273 K. The maximum yield that satisfied all four constraints amounts to only 8%
(at T0= 723K, CH4/O2|z=0 = 8.7), which is in strong contrast with the 26% (at T0= 850K,
CH4/O2|z=0 = 5) obtained at a Tmax of 1521 K.

21
Figure 6. Contour plots of the maximum temperature in the adiabatic reactor Tmax and the C2+ ultimate yield as a
function of T0 and CH4/O2|z=0, for a 1%wtSr/La2O3 catalytic bed. Operating conditions: pr= 150 kPa, complete
oxygen conversion at the reactor outlet, GHSV =1100-82000 h-1, W/FCH4,0= 1.57 – 116.63 kgcat/molCH4,0. The
yellow lines identify the region of acceptable maximum temperature Tmax≤ 1273 K The red dot indicates the optimal
operating point in this region.
Tmax, K
C2+ Yield, %

22
By analyzing the yellow-framed part of the plane, the simulated C2+ ultimate yield slightly
increases at lower inlet temperatures. This is due to the higher adiabatic temperature rise that is
allowed when operating at lower T0, which in turn allows a lower CH4/O2|z=0. The resulting
increase in methane conversion overcompensates the decrease in selectivity due to a more
oxygen rich feed and leads to an overall increase in the yield.
The optimal operating point with respect to C2+ yield is indicated by the red dot in Figure 6: pt=
150 kPa, T0= 723 K, CH4/O2|z=0 = 8.7, GHSV= 1110 h-1, W/FCH4,0= 111.40 kgcat s/molCH4,0. The
obtained performances were: XCH4= 13%, SC2+= 61%, YC2+= 8% and DTad= 550 K. Due to the
low values of GHSV and SC2+, the inlet temperature was not further reduced.
By comparing these values with the results reported in Figure 2, it can be observed that the
rational fine-tuning of the operating conditions led to a 33% increase in the simulated C2+
ultimate yield, without penalizing the selectivity and at the same time fulfilling the required
operational constraints.
It is worth highlighting that, when increasing the inlet temperature along the yellow line in
Figure 6 up to T0= 850K, the decrease in YC2+ (from 8% to 7%) is accompanied by a drastic
decrease in the space time required to achieve complete oxygen conversion (from 111.40 kg cat
s/molCH4,0 to 2.66 kg cat s/molCH4,0). One of the performance indicators which is mostly affected
by this temperature-related difference in the catalyst activity is the Space Time Yield of C2+
products (C2+ STY), defined as the molC2+ produced per unit of time per kg of catalyst. The
STY in the two limiting operating points of the yellow line (T0=723K, CH4/O2|z=0= 8.7) and
(T0= 850K, CH4/O2|z=0= 10.6) increases from 3.60 10-4 to 1.35 10-2 molC2+ s/kgcat). The
advantage in terms of low inlet temperature operation and higher C2+ yield comes, hence, at the
expense of the overall productivity. For this reason, also the C2+ STY is going to be considered
in the comparison with the other catalytic materials.

23
The prior analysis of light-off curves (specifically, Figure S7 of the Supporting Information)
suggested that the utilization of air as oxidant would mitigate the adiabatic temperature rise due
to the presence of nitrogen as a diluent in the feed. In order to verify whether this could lead to
an additional improvement in the ultimate yield, a similar fine-tuning of the operating
conditions was performed using air as oxidizing agent, instead of pure oxygen. The contour
plots for Tmax and C2+ ultimate yield are reported in Figure 7. As expected, the maximum
temperatures obtained were lower compared to the undiluted case and, as a result, a higher
amount of oxygen (i.e. lower CH4/O2|z=0) could be fed to the reactor. By assuming a simplified
air composition of 79 mol% N2 and 21 mol% O2 and the range of investigated reactant inlet
ratio (CH4/O2|z=0= 5 - 10), the corresponding nitrogen dilution in the gas feed ranged from 38.5
to 25.5 mol%. The sum of the reactant partial pressures (CH4 and O2) always amounted to pr=
150 kPa to make a correct comparison. As a result, the total pressure had to be adapted for each
inlet ratio to compensate for the presence of N2, ranging from 240 kPa bar for CH4/O2|z=0= 5 to
200 kPa for CH4/O2|z=0= 10.
Figure 7 suggests an alternative operating point for a Sr/La2O3 adiabatic catalytic bed in
presence the of air instead of pure oxygen, indicated by the red dot in Figure 7: pt= 220 kPa,
T0= 750 K, CH4/O2|z=0 = 7.3, 31.1 mol% N2, GHSV= 2260 h-1, W/FCH4,0= 55.80 kgcat s/molCH4,0.
The obtained performances were: XCH4= 15%, SC2+= 60%, YC2+= 9% and DTad= 523 K.
Comparing these figures with the pure oxygen case, a slight increase in maximum achievable
C2+ ultimate yield was observed (from 8% to 9%). Indeed temperature mitigation by nitrogen
allows a lower reactant molar inlet ratio (CH4/O2|z=0= 7.3 vs 8.7), thus higher methane
conversion (XCH4= 15% vs 13%), while simultaneously maintaining Tmax below the limiting
value of 1273 K. However the T0 required in the presence of air (T0= 750 K) had to be higher
compared to the case with pure oxygen (T0= 723 K), following constraint (iv) on the C2+
selectivity owing to the higher relative amount of oxygen present in the feed.

24
Figure 7. Contour plots of the maximum temperature in the adiabatic reactor Tmax and the C2+ ultimate yield as
a function of T0 and CH4/O2|z=0, for a 1%wtSr/La2O3 catalytic bed with air co-feeding, instead of pure oxygen.
Operating conditions: pr= 150 kPa, complete oxygen conversion at the reactor outlet, GHSV =2150-39200 h-1,
W/FCH4,0= 3.11 – 13.52 kgcat/molCH4,0. Nitrogen mol% in the feed varies from 38.5% (for CH4/O2|z=0= 5) to 25.5%
(for CH4/O2|z=0= 10).The yellow lines identify the region of acceptable maximum temperature Tmax≤ 1273 K. The
red dot indicates the optimal operating point in this region.
Tmax, K
C2+ Yield, %

25
An analogous procedure, considering only pure oxygen, was followed for the other three
catalysts, using the prior analysis of light-off curves as a guideline for the identification of
potential operating intervals. The optimal operating conditions for each of them are reported in
Table 3 in order of increasing ultimate yield.
Table 3. Optimal operating conditions and corresponding adiabatic ultimate performances of the four catalysts in
exam, assuming pure oxygen as oxidizing agent. The underlined value indicates that operational constraint (iv)
was not met in the tuning procedure. The GHSV values reported in the table correspond to a space time variation
in the range W/FCH4,0= 0.97 – 125.70 kgcat s/molCH4,0.
Catalyst T0
(K)
CH4/O2|z=0
(-)
GHSV
(h-1)
DTad
(K)
XCH4
(%)
SC2+
(%)
YC2+
(%)
C2+ STY
(molC2+ s-1 kgcat-1)
La-Sr/CaO 850 10.9 125600 423 9 53 5 2.38 10-2
Sr/La2O3 723 8.7 1100 550 13 61 8 3.60 10-4
Sn-Li/MgO 750 8.5 1040 523 18 79 14 5.64 10-4
NaMnW/SiO2 853 8.9 1060 420 19 82 16 6.62 10-4
The CaO based catalyst, which, according to the comparison of light-off curves, seemed the
most suitable for low temperature operation, did not meet the requirement of minimum desired
selectivity (condition (iv)). Despite the very high activity, and the consequent high C2+ STY
obtained, the maximum C2+ selectivity that could be achieved, while simultaneously fulfilling
conditions (i), (ii) and (iii), was 53% and is indicated in bold and underlined in Table 3; this
value was obtained via a high reactant molar inlet ratio, which in turn reduced the methane
conversion and limited the overall yield to 5%. It could be concluded that the most active, but
least selective catalyst, proved to be the least suitable for a profitable adiabatic operation.
The MgO based catalyst exhibits a more moderate activity compared to the La2O3 based one,
as previously highlighted from the light-off curves analysis. Therefore T0 had to be limited to
750 K due to the GHSV constraint (iii). However, its high selectivity, as seen from isothermal
data60, led to a promising C2+ yield of 14% in adiabatic operation. In terms of C2+ STY, the
increase in selectivity resulted into a higher productivity compared to the La2O3 catalyst, even
if the GHSV was comparable. Nevertheless, it has to be verified to what extent the Sn-Li/MgO

26
catalyst is stable at the high temperatures considered: concerns about its stability and thermal
resistance were previously shown also for the isothermal operation61.
The activity of the NaMnW/SiO2 catalyst is rather low compared to the other investigated
catalysts; this is in line with the experimental results62 and had already emerged as a limiting
factor during the evaluation of light-off curves. For this reason, for this catalyst a higher T0 had
to be selected (853 K) in order meet the other operational constraints. Thanks to the high
selectivity of this catalyst, the C2+ yield amounted to 16% corresponding to the highest value
obtained in the present work while respecting the maximum temperature constraint. Also in
terms of C2+ STY the NaMnW/SiO2 catalyst showed the highest productivity, among those
fulfilling the minimum selectivity criterion. However also for this catalyst, high-temperature
stability might be a challenge22.
On the basis of these results, it was concluded that high activity is not sufficient to achieve a
desired low inlet temperature operation of an OCM adiabatic fixed-bed. In contrast to what was
a priori expected, less active but more selective catalysts seem to be more relevant, following
the reduction in adiabatic temperature rise. The drawback in terms of activity could be
compensated by a slight increase in inlet temperature or a higher amount of catalyst, even if the
latter choice penalized the output in terms of productivity.
These results highlight that the search for an optimal OCM catalyst cannot be treated
independently from the selected reactor configuration, given the limited extrapolability of
isothermal results to adiabatic operation, and pave the way for a future optimization work both
in terms of catalyst properties and operating conditions.
The performances reported in Table 3, which are in line with the experimental ones reported in
a recent patent application from SABIC63, are still far away from the threshold value of 30%
yield, commonly adopted from the work of Kuo et al.64, for OCM economic viability. However,
due the modified economic context in comparison with 1989, in the recent literature65 lower
27
yields are also considered acceptable for the industrial feasibility of the OCM reaction, as long
as selectivity exceeds 80%. Therefore, the C2+ ultimate yields simulated in the present study for
the most selective catalysts (Sn-Li/MgO and NaMnW/SiO2) are to be considered encouraging
for the scale-up of the process in its adiabatic configuration.
4. CONCLUSIONS
The present work highlighted the performances of well-known OCM catalysts, previously
assessed at isothermal operating conditions, in adiabatic fixed-bed reactors. The relationship
between C2+ selectivity and temperature, affecting both the adiabatic temperature rise in the
reactor and the achievable C2+ yield, was addressed as the major additional challenge of
adiabatic OCM.
The analysis of light-off curves aided in identifying operating temperature ranges for different
catalysts, providing insights both in activity and C2+ selectivity in adiabatic operation.
These insights were used as starting point for the rational tuning of the operating conditions for
each of the above catalysts, aimed at maximizing the C2+ ultimate yield maximization at
preferably low inlet temperatures. The major constraint limiting the achievable yield at
complete oxygen conversion was found to be the maximum allowable temperature in the
reactor. With this constraint, the ultimate yield increased at lower inlet temperatures and
catalyst selectivity rather than activity was identified as the key feature to boost yields.
The obtained results indicated that data from isothermal operation are not easily extrapolatable
to adiabatic operation and that the search for an optimal OCM catalyst should always be tailored
to the adopted reactor configuration.
The C2+ yields herein simulated for selective catalysts are considered promising enough to
encourage the design of adiabatic experiments, to be complemented with catalyst stability tests

28
(up to 1273 K), aimed at identifying optimal catalyst-operating configuration combinations for
an economically viable implementation of OCM.
Supporting Information
Gas phase and surface reaction networks; summary of catalyst descriptors used in the
microkinetic model; elucidation on the reactor model equations and numerical procedure;
description of particle-scale temperature gradients and relative equations; graphs reporting the
influence of operating variables on the position and the shape of the light-off curves of the Sn-
Li/MgO catalyst.
AUTHOR INFORMATION
Corresponding author
* Email: [email protected]
ACKNOWLEDGMENTS
This work was supported by the Research Program Agreement, with reference Total/IPA-4999
& UGent/A15-TT-1487, between TOTAL Research & Technology Feluy and Ghent
University.
The authors would like to thank Dr. Jonas Van Belleghem and Dr. Pedro Mendes for the
valuable insights provided, respectively, in the initial and final stage of the work. JWT
acknowledges the ERC for the PoC grant SERENiTi (GA n° 825783).
NOTATION
Roman Letters
C2 C2H6 + C2H4+C2H2

29
C2+ C2H6 + C2H4+C2H2+ C3H8 + C3H6
CH4/O2|z=0 reactants molar inlet ratio
dp [m] particle diameter
dv [m] average distance between two catalyst pellets
F [mol s–1] molar flow rate
GHSV [h-1] Gas Hourly Space Velocity: ratio of the volumetric
Flow rate of reactants (CH4 + O2) at standard conditions
(Sm3/h) and the vessel volume (m3)
L [m] reactor length
pr [kPa] partial pressure of the reactants
pt [kPa] total pressure
r [m] particle-scale interstitial coordinate
Si selectivity of species i, Si= (𝐹𝑖 −𝐹𝑖,0)
(𝐹𝐶𝐻4,0 −𝐹𝐶𝐻4)
STY [mol s-1 kgcat-1] Space Time Yield of a specified product
T [K] temperature
W [kg] catalyst mass
x [m] axial reactor coordinate
Xi conversion of species i, Xi= (𝐹𝑖,0 −𝐹𝑖)
𝐹𝑖,0
Yi yield of species i, Yi= XCH4 Si
z dimensionless axial reactor coordinate
Greek Letters
tgα [K-1] slope of the tangent to the light-off curve at TLO
ΔTad [K] adiabatic temperature rise
ξ [m] particle-scale intraparticle coordinate
Sub- and Superscripts
0 reactor inlet
c catalyst particle
g gas-phase
interst interstitial
intrap intraparticle
L reactor outlet
LO light-off

30
* complete oxygen conversion at reactor outlet
REFERENCES
(1) Keller, G. E.; Bhasin, M. M. Synthesis of Ethylene via Oxidative Coupling of Methane. I.
Determination of Active Catalysts. J. Catal. 1982, 73, 9-19.
(2) Schwach, P.; Pan, X. L.; Bao, X. H. Direct Conversion of Methane to Value-Added
Chemicals over Heterogeneous Catalysts: Challenges and Prospects. Chem. Rev. 2017, 117,
8497-8520.
(3) Kee, R. J.; Karakaya, C.; Zhu, H. Y. Process Intensification in the Catalytic Conversion of
Natural Gas to Fuels and Chemicals. Proc. Combust. Inst. 2017, 36, 51-76.
(4) Stangland, E. E. Shale Gas Implications for C2-C3 Olefin Production: Incumbent and Future
Technology. Annu. Rev. Chem. Biomol. Eng. 2018, 9, 341-364.
(5) Friedel, M.; Nitzsche, J.; Krause, H. Catalyst Screening and Reactor Modeling for Oxidative
Methane Coupling to Increase the Heating Value of Biogas. Chem. Ing. Tech. 2017, 89, (6),
715-723.
(6) Amghizar, I.; Vandewalle, L. A.; Van Geem, K. M.; Marin, G. B. New Trends in Olefin
Production. Engineering 2017, 3, (2), 171-178.
(7) Ren, T.; Patel, M. K.; Blok, K. Steam Cracking and Methane To Olefins: Energy Use, CO2
Emissions and Production Costs. Energy 2008, 33, 817-833.
(8) Sinev, M. Y. Modeling of Oxidative Transformations of Light Alkanes over Heterogeneous
Catalysts. Russ. J. Phys. Chem. B 2007, 1, 412-433.
(9) Su, Y. S.; Ying, J. Y.; Green, W. H. Upper Bound on the Yield for Oxidative Coupling of
Methane. J. Catal. 2003, 218, 321-333.
(10) Korf, S. J.; Roos, J. A.; Ross, J. R. H. The Development of Doped Li/MgO Catalyst
Systems for the Low-Temperature Oxidative Coupling of Methane. In Methane Conversion by
Oxidative Processes: Fundamental and Engineering Aspects, Wolf, E. E., Ed. Van Nostrand
Reinhold: 1992; pp 168-199.

31
(11) Pak, S.; Lunsford, J. H. Thermal Effects during the Oxidative Coupling of Methane over
Mn/Na2WO4/SiO2 and Mn/Na2WO4/MgO Catalysts. Appl. Catal. A-Gen. 1998, 168, 131-137.
(12) Gambo, Y.; Jalil, A. A.; Triwahyono, S.; Abdulrasheed, A. A. Recent Advances and Future
Prospect in Catalysts for Oxidative Coupling of Methane to Ethylene: a Review. J. Ind. Eng.
Chem. 2018, 59, 218-229.
(13) Cruellas, A.; Melchiori, T.; Gallucci, F.; van Sint Annaland, M. Advanced Reactor
Concepts for Oxidative Coupling of Methane. Catal. Rev.-Sci. Eng. 2017, 59, 234-294.
(14) Salerno, D.; Godini, H. R.; Penteado, A.; Esche, E.; Wozny, G. Techno-Economic
Evaluation of an Oxidative Coupling of Methane Process at Industrial Scale Production. In 26th
European Symposium on Computer Aided Process Engineering, Kravanja, Z.; Bogataj, M.,
Eds. Elsevier Science Bv: Amsterdam, 2016; Vol. 38B, pp 1785-1790.
(15) Spallina, V.; Velarde, I. C.; Jimenez, J. A. M.; Godini, H. R.; Gallucci, F.; van Sint
Annaland, M. Techno-Economic Assessment of Different Routes for Olefins Production
through the Oxidative Coupling of Methane (OCM): Advances in Benchmark Technologies.
Energy Convers. Manage. 2017, 154, 244-261.
(16) Annapragada, A. V.; Gulari, E. Fe-P-O Catalysts for Methane Utilization Catalyst
Development and Identification. J. Catal. 1990, 123, 130-146.
(17) Aseem, A.; Jeba, G. G.; Conato, M. T.; Rimer, J. D.; Harold, M. P. Oxidative Coupling of
Methane over Mixed Metal Oxide Catalysts: Steady State Multiplicity and Catalyst Durability.
Chem. Eng. J. 2018, 331, 132-143.
(18) Lee, J. Y.; Jeon, W.; Choi, J. W.; Suh, Y. W.; Ha, J. M.; Suh, D. J.; Park, Y. K. Scaled-up
Production of C2 Hydrocarbons by the Oxidative Coupling of Methane over Pelletized
Na2WO4/Mn/SiO2 Catalysts: Observing Hot Spots for the Selective Process. Fuel 2013, 106,
851-857.

32
(19) Noon, D.; Seubsai, A.; Senkan, S. Oxidative Coupling of Methane by Nanofiber Catalysts.
ChemCatChem 2013, 5, 146-149.
(20) Noon, D.; Zohour, B.; Senkan, S. Oxidative Coupling of Methane with La2O3-CeO2
Nanofiber Fabrics: a Reaction Engineering Study. J. Nat. Gas Sci. Eng. 2014, 18, 406-411.
(21) Tarasov, A. L.; Kustov, L. M. Autothermal Methane Oxidative Coupling Process over
La2O3/MgO Catalysts. Chem. Eng. Technol. 2015, 38, 2243-2252.
(22) Sarsani, S.; West, D.; Liang, W. G.; Balakotaiah, V. Autothermal Oxidative Coupling of
Methane with Ambient Feed Temperature. Chem. Eng. J. 2017, 328, 484-496.
(23) Degnan, T. Siluria and OCM – Close to Full Scale Commercializaton? Focus on Catalysts
2016, 2016, 1-2.
(24) Iyer, R.; Tkachenko, A.; Weinberger, S.; Scher, E. C.; Zurcher, F. R.; Cizeron, J. M.;
Schammel, W. P.; Gamoras, J.; Karshtedt, D.; Nyce, G. Natural Gas Processing and Systems.
U.S. Patent 9,670,113 B2, 2017.
(25) Gemini - Oxidative Coupling of Methane (OCM). https://www.linde-
engineering.com/en/process_plants/petrochemical-plants/oxidative-coupling-
methane/index.html (Accessed 08/10/2018).
(26) Karakaya, C.; Zhu, H.; Loebick, C.; Weissman, J. G.; Kee, R. J. A Detailed Reaction
Mechanism for Oxidative Coupling of Methane over Mn/Na2WO4/SiO2 Catalyst for Non-
Isothermal Conditions. Catal. Today 2018, 312, 10-22.
(27) Sun, Z.; West, D. H.; Balakotaiah, V. Bifurcation Analysis of Catalytic Partial Oxidations
in Laboratory-Scale Packed-Bed Reactors with Heat Exchange. Chem. Eng. J. 2018.
(28) Balakotaiah, V.; West, D. H. Thermal Effects and Bifurcations in Gas Phase Catalytic
Partial Oxidations. Curr. Opin. Chem. Eng. 2014, 5, 68-77.

33
(29) Sinev, M. Y.; Fattakhova, Z. T.; Lomonosov, V. I.; Gordienko, Y. A. Kinetics of Oxidative
Coupling of Methane: Bridging the Gap Between Comprehension and Description. J. Nat. Gas
Chem. 2009, 18, 273-287.
(30) Duprat, F. Light-off Curve of Catalytic Reaction and Kinetics. Chem. Eng. Sci. 2002, 57,
901-911.
(31) Santamaria, J. M.; Miro, E. E.; Wolf, E. E. Reactor Simulation Studies of Methane
Oxidative Coupling on a Na/NiTiO3 Catalyst. Ind. Eng. Chem. Res. 1991, 30, 1157-1165.
(32) Tye, C. T.; Mohamed, A. R.; Bhatia, S. Modeling of Catalytic Reactor for Oxidative
Coupling of Methane using La2O3/CaO Catalyst. Chem. Eng. J. 2002, 87, 49-59.
(33) Hoebink, J. H. B. J.; Couwenberg, P. M.; Marin, G. B. Fixed Bed Reactor Design for Gas
Phase Chain Reactions Catalysed by Solids: the Oxidative Coupling of Methane. Chem. Eng.
Sci. 1994, 49, 5453-5463.
(34) Stansch, Z.; Mleczko, L.; Baerns, M. Comprehensive Kinetics of Oxidative Coupling of
Methane over the La2O3/CaO Catalyst. Ind. Eng. Chem. Res. 1997, 36, 2568-2579.
(35) Kechagiopoulos, P. N.; Thybaut, J. W.; Marin, G. B. Oxidative Coupling of Methane: a
Microkinetic Model Accounting for Intraparticle Surface-Intermediates Concentration Profiles.
Ind. Eng. Chem. Res. 2014, 53, 1825-1840.
(36) Alexiadis, V. I.; Thybaut, J. W.; Kechagiopoulos, P. N.; Chaar, M.; Van Veen, A. C.;
Muhler, M.; Marin, G. B. Oxidative Coupling of Methane: Catalytic Behaviour Assessment via
Comprehensive Microkinetic Modelling. Appl. Catal. B-Environ. 2014, 150, 496-505.
(37) Alexiadis, V. I.; Chaar, M.; van Veen, A.; Muhler, M.; Thybaut, J. W.; Marin, G. B.
Quantitative Screening of an Extended Oxidative Coupling of Methane Catalyst Library. Appl.
Catal. B-Environ. 2016, 199, 252-259.
(38) Sun, Z.; Kota, A.; Sarsani, S.; West, D. H.; Balakotaiah, V. Bifurcation Analysis of
Methane Oxidative Coupling Without Catalyst. Chem. Eng. J. 2018, 343, 770-788.

34
(39) Vandewalle, L. A.; Lengyel, I.; West, D. H.; Van Geem, K. M.; Marin, G. B. Catalyst
Ignition and Extinction: a Microkinetics-Based Bifurcation Study of Adiabatic Reactors for
Oxidative Coupling of Methane. Chem. Eng. Sci. 2018.
(40) Karakaya, C.; Zhu, H. Y.; Zohour, B.; Senkan, S.; Kee, R. J. Detailed Reaction
Mechanisms for the Oxidative Coupling of Methane over La2O3/CeO2 Nanofiber Fabric
Catalysts. ChemCatChem 2017, 9, (24), 4538-4551.
(41) Carberry, J. J.; Wendel, M. M. A Computer Model of the Fixed Bed Catalytic Reactor: the
Adiabatic and Quasi-Adiabatic Cases. AiChE J. 1963, 9, 129-133.
(42) Mears, D. E. Diagnostic Criteria for Heat Transport Limitations in Fixed Bed Reactors. J.
Catal. 1971, 20, 127-131.
(43) Wijngaarden, R. J.; Westerterp, K. R. The Role of Pellet Thermal-Stability in Reactor
Design for Heterogeneously Catalyzed Chemical-Reactions. Chem. Eng. Sci. 1992, 47, 1517-
1522.
(44) Please, C. P.; Hagan, P. S.; Schwendeman, D. W. Light-off Behavior of Catalytic-
Converters. SIAM J. Appl. Math. 1994, 54, 72-92.
(45) Lang, W.; Laing, P.; Cheng, Y.; Hubbard, C.; Harold, M. P. Co-oxidation of CO and
Propylene on Pd/CeO2-ZrO2 and Pd/Al2O3 Monolith Catalysts: a Light-off, Kinetics and
Mechanistic Study. Appl. Catal. B-Environ. 2017, 218, 430-442.
(46) Ramanathan, K.; Balakotaiah, V.; West, D. H. Light-off Criterion and Transient Analysis
of Catalytic Monoliths. Chem. Eng. Sci. 2003, 58, 1381-1405.
(47) Wang, Y. Q.; Xiao, L.; Zhao, C. C.; Liu, F.; Li, S. Catalytic Combustion of Toluene with
Pd/La0.8Ce0.2MnO3 Supported on Different Zeolites. Environ. Prog. Sustain. Energy 2018, 37,
215-220.

35
(48) Fan, Z. Y.; Fang, W. J.; Zhang, Z. X.; Chen, M. X.; Shangguan, W. F. Highly Active Rod-
like Co3O4 Catalyst for the Formaldehyde Oxidation Reaction. Catal. Commun. 2018, 103, 10-
14.
(49) Hinokuma, S.; Shimanoe, H.; Kawabata, Y.; Matsuki, S.; Kiritoshi, S.; Machida, M.
Effects of Support Materials and Silver Loading on Catalytic Ammonia Combustion Properties.
Catal. Today 2018, 303, 2-7.
(50) Lee, J. H.; Trimm, D. L. Catalytic Combustion of Methane. Fuel Process. Technol. 1995,
42, 339-359.
(51) Bharadwaj, S. S.; Schmidt, L. D. Catalytic Partial Oxidation of Natural Gas to Syngas.
Fuel Process. Technol. 1995, 42, (2), 109-127.
(52) Gartner, C. A.; van Veen, A. C.; Lercher, J. A. Oxidative Dehydrogenation of Ethane:
Common Principles and Mechanistic Aspects. ChemCatChem 2013, 5, (11), 3196-3217.
(53) Mleczko, L.; Baerns, M. Catalytic Oxidative Coupling of Methane - Reaction-Engineering
Aspects and Process Schemes. Fuel Process. Technol. 1995, 42, 217-248.
(54) Gu, T.; Balakotaiah, V. Analysis of Upstream Creeping Reaction Zones in Catalytic
Monolith Reactors. Chem. Eng. J. 2017, 317, 267-279.
(55) Choudhary, V. R.; Rane, V. H. Acidity Basicity of Rare-Earth-Oxides and their Catalytic
Activity in Oxidative Coupling of Methane to C2 Hydrocarbons. J. Catal. 1991, 130, (2), 411-
422.
(56) Albrecht, M.; Rodemerck, U.; Linke, D.; Kondratenko, E. V. Oxidative Coupling of
Methane at Elevated Pressures: Reactor Concept and its Validation. React. Chem. Eng. 2018,
3, 151-154.
(57) Crook, P. Corrosion Resistant Nickel Alloys - Part 2. Adv. Mater. Process. 2007, 165, (7),
31-33.

36
(58) Duggal, S. R., G.; Mccormick, J.; Aronson, A.; Cizeron, J.; Jonnavittula, D. Separation
Methods and Systems for Oxidative Coupling of Methane. U.S. Patent Application Publication
2014/0012053 A1, 2017.
(59) Cizeron, J.; Radaelli, G.; Lakhapatri, S.; Freer, E.; Hong, J. K.; McCormik, J.; Sheridan,
D.; Reid, C.; Pellizzari, R.; Weinberger, S.; Edwards, J. D. Reactors and Systems for Oxidative
Coupling of Methane. U.S. Patent 10,047,020 B2, 2018.
(60) Korf, S. J.; Roos, J. A.; Veltman, L. J.; van Ommen, J. G.; Ross, J. R. H. Effect of Additives
on Lithium Doped Magnesium-Oxide Catalysts used in the Oxidative Coupling of Methane.
Appl. Catal. 1989, 56, 119-135.
(61) Arndt, S.; Laugel, G.; Levchenko, S.; Horn, R.; Baerns, M.; Scheffler, M.; Schlogl, R.;
Schomacker, R. A Critical Assessment of Li/MgO-Based Catalysts for the Oxidative Coupling
of Methane. Catal. Rev.-Sci. Eng. 2011, 53, (4), 424-514.
(62) Malekzadeh, A.; Abedini, M.; Khodadadi, A. A.; Amini, M.; Mishra, H. K.; Dalai, A. K.
Critical Influence of Mn on Low-Temperature Catalytic Activity of Mn/Na2WO4/SiO2 Catalyst
for Oxidative Coupling of Methane. Catal. Lett. 2002, 84, 45-51.
(63) Liang, W.; Sarsani, S.; West, D.; Lowrey, J.; Mamedov, A.; Lengyel, I. Low Inlet
Temperature for Oxidative Coupling of Methane. U.S. Patent Application Publication
2018/0162785 A1, 2018.
(64) Kuo, J. C. W.; Kresge, C. T.; Palermo, R. E. Evaluation of Direct Methane Conversion to
Higher Hydrocarbons and Oxygenates. Catal. Today 1989, 4, 463-470.
(65) Kondratenko, E. V.; Peppel, T.; Seeburg, D.; Kondratenko, V. A.; Kalevaru, N.; Martin,
A.; Wohlrab, S. Methane Conversion into Different Hydrocarbons or Oxygenates: Current
Status and Future Perspectives in Catalyst Development and Reactor Operation. Catal. Sci.
Technol. 2017, 7, 366-381.

37
FOR TABLE OF CONTENTS ONLY
Adiabatic
OCM
Reactor
0
L
CH4, O2
CH4, C2+, COx,…
TL>>T0
Inlet Temperature,T0 (K)
O2
Co
nve
rsio
n, X
O2
(%)
Operating Temperature
Range of Interest
Light-off
Curv e Catalyst Performances
100%
YC2+
SC2+
XCH4
Micro and Macro Scale
CH
3
Co
nc
en
tra
tio
n