model-based analysis of the likelihood of gene introgression from genetically modified crops into...
TRANSCRIPT

Ecological Modelling 162 (2003) 199–209
Model-based analysis of the likelihood of gene introgressionfrom genetically modified crops into wild relatives
C.J. Thompsona, B.J.P. Thompsonb, P.K. Adesc, R. Cousensc,P. Garnier-Gerec, K. Landmana, E. Newbigind, M.A. Burgmand,∗
a Department of Mathematics and Statistics, University of Melbourne, Vic. 3010, Australiab Colben Dynamics Pty Ltd., 19 Bellavista Road, Glen Iris, Vic. 3146, Australia
c Institute of Land and Food Resources, University of Melbourne, Vic. 3010, Australiad School of Botany, University of Melbourne, Vic. 3010, Australia
Received 27 July 2001; received in revised form 24 April 2002; accepted 6 August 2002
Abstract
The proliferation of genetically modified crops has created a need for methods to predict the likelihood of gene introgressioninto related species in situ. We present a model of a modified crop and an associated unmodified plant population removedspatially from the modified crop but not completely isolated from it, reflecting standard practices for isolation of field trials. Wedevelop models for two kinds of life histories, broadly based onBrassica andGossypium, taxa that are targets for genetic mod-ification. We find that current prescriptions for field trials are likely to lead to escape of transgenes into wild populations whenoutcrossing rates are moderate and hybrids are fertile. The results are sensitive to pollen rain within plausible bounds for modelparameters, suggesting buffer widths are an important aspect of the design of field trials. When gene introgression requires thespontaneous development of a polyploid, the likelihood of gene introgression is lower but still appreciable in realistic circum-stances. Events that are unlikely over periods of a few years become almost certain within scales of a few decades, emphasisingthe need for gene risk assessments to be set in specified time frames. The models serve to identify the parts of the system thatare poorly known and that are important in determining outcomes, providing a focus for future research. There is a need forresearch on the consequences of changes in fitness due to the transgenes, competitive interactions between related species, andthe broader ecological consequences of changes in agricultural practice resulting from the use of genetically modified crops.© 2002 Elsevier Science B.V. All rights reserved.
Keywords: Gene introgression; Genetically modified plants; Model-based risk assessment;Brassica; Gossypium
1. Introduction
With the proliferation of genetically modified (GM)products and the almost exponential growth of landuse for GM crops (AAS, 1999; James, 2000), there isa growing need to develop quantitative approach to es-
∗ Corresponding author. Tel.:+61-3-83447151;fax: +61-3-93475460.
E-mail address: [email protected] (M.A. Burgman).
timating risks to the environment of exposure to suchproducts. The possible impacts on biodiversity by GMcrops may be summarised under four headings: (1)transgenic leakage into related wild populations by hy-bridisation; (2) direct competition between GM cropplants and wild populations; (3) impacts on non-targetspecies; and (4) changes in agricultural practice,including establishment of crops in areas currentlyconsidered marginal for agriculture, made possible bynovel properties of GM plants. To date, most of the
0304-3800/02/$ – see front matter © 2002 Elsevier Science B.V. All rights reserved.PII: S0304-3800(02)00347-2
200 C.J. Thompson et al. / Ecological Modelling 162 (2003) 199–209
work on escape of genes from GM crops has been de-scriptive and qualitative (Kaptejins, 1993; Sayre andKough, 1993; Luby and McNicol, 1995), with quan-tification of some aspects of genetic systems, disper-sal, and gene introgression (di Giovanni and Beckett,1990; Adler et al., 1993; Timmons et al., 1996;Giddings et al., 1997; Hokanson et al., 1997; Moyesand Dale, 1999). The qualitative focus has been duein part to the paucity of data and, in part, to a lack ofappropriate mathematical tools.
Hails (2000)argued for a clear focus on the quantifi-cation of ecological risk. There is a growing literatureon model-based risk analysis of ecosystems that maybe applied to give more comprehensive assessmentof the risks to biodiversity from GM crops (Ginzburget al., 1982; Boyce, 1992; Burgman et al., 1993;Gurney and Nisbet, 1998). For example,Huxel (1999)examined the theoretical potential for non-nativegenotypes to introgress into wild populations, using amodel that considered hybridisation backcross steril-ity, introgression and variable heterozygote fitness.
The purpose of this study is to present a mathemat-ical model for leakage of transgenic genes into naturalpopulations and to use this model as a basis for quan-titative risk analysis. While the focus is on GM crops,we note that our analysis would be equally valid forany crop and hence could be used in any setting wherecrops and wild relatives grow in close proximity.
2. Conceptual model
We develop a general model and apply it to twospecific cases. There are very few plant speciesfor which both demographic and dispersal data areavailable. Therefore, we use a strategy employed byWoolcock and Cousens (2000)and create hypotheti-cal species based broadly on the species of interest,and use parameter estimates derived from data onsimilar species and from expert judgement. The twohypothetical species represent species from the generaBrassica andGossypium, providing a contrast in seeddispersal mechanisms and life history types. Speciesfrom these genera are the focus of many geneticstudies aimed at improving commercial properties.
The model describes a system in which there isa crop of GM plants at an arbitrary distance from anative community that includes wild relatives of the
crop. It is well established that gene flow over 1 kmor more can be significant (Ellstrand et al., 1999) andthe model reflects circumstances in which gene flowmight be important, such as the standard practice forisolation of GM crops in field trials using buffers oftens or hundreds of meters. Crop plants escape to the‘wild’ by seed dispersal through wind dispersal, an-imal feeding or spillage after harvest. Hybrids arisethrough wind-dispersed pollen from the crop, or bythe movement of pollinating animals.
We define five state variables:C, the GM crop;W, the wild relative;H, the hybrid population, whicharises every generation but may be infertile;P, a newtaxon (a polyploid), which arises from spontaneouschromosome doubling of the hybrids;E, escapeesfrom the crop population that form feral populationsin the wild.
We assume the wild species and the escapees polli-nate within a taxon, that crossing events between wild,GM crop, and GM feral plants produce hybrids, andthat fertile polyploids may be produced through spon-taneous chromosome doubling of the hybrids. Thegrowth and interactions of the system can thus be rep-resented conceptually as:
W × W → W
E × E → E
E × C → E, C
E × W → H
C × W → H
H → P
For simplicity, hybrid crosses are assumed not toproduce wild types. We assume thatE × C is a rel-atively rare event and may be ignored. Many otherhybridisation models are possible (Rieseberg, 1998).We chose this one because it provides an example ofa system that is common to many agricultural land-scapes. In the following sections, we present specificevolution equations for the system based on our sim-ple conceptual model and discuss the evolutionarybehaviour of the deterministic form of the model. Wethen present stochastic solutions of the model whengrowth rates and interaction parameters are taken tobe time-dependent random variables. Risk curves,

C.J. Thompson et al. / Ecological Modelling 162 (2003) 199–209 201
derived from the stochastic solutions as cumulativeprobability distributions, are presented and their im-plications are discussed. The stepH → P involvesgenetic processes such as chromosome replication.The likelihoods of these events are subsumed withinparameters that govern this process (below).
2.1. Model equations
In the evolution equations, we use a subscriptt onthe variables defined inSection 2to denote the valueof that variable, expressed as a population density ingeneration (time step)t. The primes (′) in the nota-tion represent ‘seeds’ and the variables without primesrepresent ‘plants’. For simplicity, we assume that thesame GM crop is planted each generation and that thesame unit generation interval applies to all species inthe system.
At time t, the total density of plants in the system is:
Tt = Wt + Et + Ht + Pt, t = 0, 1, 2, . . . (1)
and the total density of seeds in the system is:
T ′t = W ′
t + E′t + H ′
t + P ′t , t = 0, 1, 2, . . . (2)
We assume that each of the four populations makingup the system compete directly for limited resources,resulting in a total carrying capacity,K. All plantsproduce equivalent amounts of pollen. The number ofplaces available for new recruits at the end of cycletis:
At = K − (sWWt + sEEt + sHHt + sPPt) (3)
wheres is the survival rate from seedling to maturityin the absence of competition.
We assume the pollen in the patch of natural vege-tation is completely mixed and that pollen frequenciesare proportional to the frequency of plants of each typein the patch, and pollen rain from the crop depositedin the patch. We assume that plants cross with pollenof type X (X: W, E, H, P, C) with a probability pro-portional to the relative abundance of pollen typeX inthe local patch, i.e. with probabilityXt /Rt , where
Rt = Tt + Ct (4)
and Ct is the proportion of pollen derived from thecrop (equivalent to the effective number of crop plantspresent in the patch, from the perspective of pollenproduction).
The number of wild type seeds in the patch in gen-erationt is then
W ′t = fWWt
(Wt
Rt
)(5)
where fW is the fecundity of the wild population inthe absence of competition.
Similarly, the number of crop type (escapee) seedsin the patch of natural vegetation is:
E′t = C′
t + fEEt
(Et
Rt
)+ fEEt
(Ct
Rt
)(6)
whereC′t is the seed rain from the adjacent crop, and
fE is the fecundity of the escapee population. Whenfertile hybrids result from the cross of a wild (W) orhybrid (H) type and a crop type (E, H, C), the numberof hybrid seeds is:
H ′t = αWt
(Et
Rt
)+ αEt
(Wt
Rt
)+ αWt
(Ct
Rt
)
+ βHt
(Et
Rt
)+ βEt
(Ht
Rt
)+ βHt
(Ct
Rt
)
+γHt
(Wt
Rt
)+ γWt
(Ht
Rt
)+ fHHt
(Ht
Rt
)(7)
where the coefficientsα, β and γ are the ratesper (unit) cycle associated with each type of inter-population cross. They represent the relative fre-quency with which each type of cross occurs. Themodel assumes that there are no maternal effects.The success of fertilisation of a wild ovule by a croppollen is assumed to be the same as that from a cropovule (here, an escapee) by a wild pollen. This couldbe implemented by makingα (the hybridisation rate)depend on the direction of the crossing. For infertilehybrids,Eq. (7)simplifies to:
H ′t = αWt
(Et
Rt
)+ αEt
(Wt
Rt
)+ αWt
(Ct
Rt
)(8)
In some circumstances, polyploids form through thespontaneous doubling of the chromosome number ofa hybrid or fusion of two unreduced gametes. Thesepolyploids may be fertile, providing a mechanism forgene introgression when hybrids are usually sterile.

202 C.J. Thompson et al. / Ecological Modelling 162 (2003) 199–209
The density of polyploid seeds will be:
P ′t = dHt
(Ht
Rt
)+ aPt
(Wt
Rt
)+ aWt
(Pt
Rt
)
+ bPt
(Et
Rt
)+ bEt
(Pt
Rt
)+ bPt
(Ct
Rt
)
+fPPt
(Pt
Rt
)(9)
whered is the doubling rate of hybrids,a and b thehybrid production rates for polyploids with wild andcrop types, respectively, andfP is the fecundity rateof polyploids.
The equations for the number of seeds in the patchof each type assume that there is no seed bank. Thatis, seeds either germinate and are recruited into thepopulation, or they are eliminated by the start of
Et+1 =
sEEt + C′t + fEEt
(Et + Ct)
Rt
if T ′t ≤ At
sEEt + At
[C′
t + fEEt(Et + Ct)/Rt
T ′t
]if T ′
t > At
(13)
the next cycle. This assumption could be relaxed inother applications of the model (seeLutman, 1999).New recruits in the next cycle (t + 1) are those seedsthat germinate and survive competition for space. Weassume that competitive effects are limited to reducedsurvival of new germinants, consistent with the notionof self-thinning in a population that has a resident adultcomponent. Survival is reduced in proportion to thespace available (At).
Wt+1 =
sWWt + fWWt if fWWt ≤ K − sWWt
sWWt + (K − sWWt)fW
W2t
Wt
fWWt if fWWt > K − sWWt
(14)
We denoteX+t (whereX is W, E, H, P) to be the
new recruits for cyclet + 1, and assume:
X+t =
X′t if T ′
t ≤ At
X′t
At
T ′t
if T ′t > At
(10)
This is a multi-dimensional ceiling model for densitydependence affecting the survival and recruitment ofseeds. It is assumed that different types of seeds are
affected by competition equally, and find places inproportion to their relative abundances.
The total population in the following cycle is deter-mined by the number of successfully established ger-minants (Eq. (10)) and the number of survivors fromthe adult population, i.e.
Xt+1 = sXXt + X+t (11)
Thus, for the wild population, we have from (5), (10)and (11):
Wt+1 =
sWWt+fW
W2t
Rt
if T ′t ≤ At
sWWt+AtfW
W2t
RtT′t
if T ′t > At
(12)
and for the escapee population
Similar evolution equations forH andP can be derivedfrom the equations above.
2.2. Special case
In the special case when the model is simplified toreflect the dynamics of a single species, i.e. whenEt =Ht = Pt = C′
t = Ct = 0, we haveWt = Tt = Rt ,T ′
t = W ′t = fWWt , andAt = K − sWWt . The model
Eq. (12)then becomes:
Wt+1 ={
(sW + fW)Wt if (sW + fW)Wt ≤ K
K if (sW + fW)Wt > K(15)
This is the conventional ceiling type contest model fora single species (Burgman et al., 1993).
The iterativeEqs. (12) and (13)for W and E, to-gether with similar equations forH andP form a dis-crete dynamic system. When the parameters in theequations are constant, the system is deterministic, i.e.
C.J. Thompson et al. / Ecological Modelling 162 (2003) 199–209 203
the values forWt , Et , Ht , andPt are completely deter-mined from particular initial conditions that realisti-cally should includeE0 = H0 = P0 = 0, some valuefor W0 such as its equilibrium value in the absence ofcompetitors, and some values forCt andC′
t . For sim-plicity, we choose constant values forCt andC′
t andchoose units so that the carrying capacity of the patch(K) is unity. For illustrative purposes we consider twohypothetical models corresponding toBrassica andGossypium.
The ecology of the genusBrassica has been thefocus of considerable empirical research, especiallyrelated to gene flow, pollen dispersal and hybridis-ation (Crawley et al., 1993; Baranger et al., 1995;Brown and Brown, 1996; Timmons et al., 1996; Riegeret al., 1999). One of the main reasons is that the fam-ily Brassicaceae contains many commercially valu-able species, as well as wild relatives with which theyreadily hybridise.Scheffler et al. (1995)estimatedthe average hybridisation frequency between popu-lations separated by 400 m was about 0.004%, lessthan limits established for the production of certifiedseed in some jurisdictions. They concluded bees werethe most likely agent for long distance dispersal ofpollen.
The genusGossypium is composed of perennialshrubs with insect-pollinated flowers, creating op-portunities for cross-pollination and hybridisation.As most commercial cotton is tetraploid and mostwild relatives are diploid, hybrids in this system aresterile but spontaneous doubling may restore fer-tility. An example of such a system was studiedby Brown et al. (1998). They obtained estimatesfor outcrossing rates for the cropGossypium hir-sutum with two related species,G. australe and G.sturtianum (the rates were approximately 0.3 and0.1, respectively). Other studies have documentedsuccessful pollen dispersal by insects during fieldtests (Umbeck et al., 1991). Llewellyn and Fitt(1996) found pollen dispersal from cotton to berelated to the size of the source population, andhybrid production rates of less than 0.03% at dis-tances of 16 m from small-scale field trials. In ourequations, the crop is treated as a point source ofpollen.
The next step in developing the model is to describethe deterministic behaviour of the system of equations,under particular parameter estimates.
3. Deterministic model behaviour
3.1. Brassica
For theBrassica model, we note firstly that by def-inition Pt = 0 for all t ≥ 0, and thatC′ = 0 andE0 = 0 imply from (6) thatEt = 0 for all t ≥ 0.It then follows that theBrassica model reduces to atwo-species model forW andH.
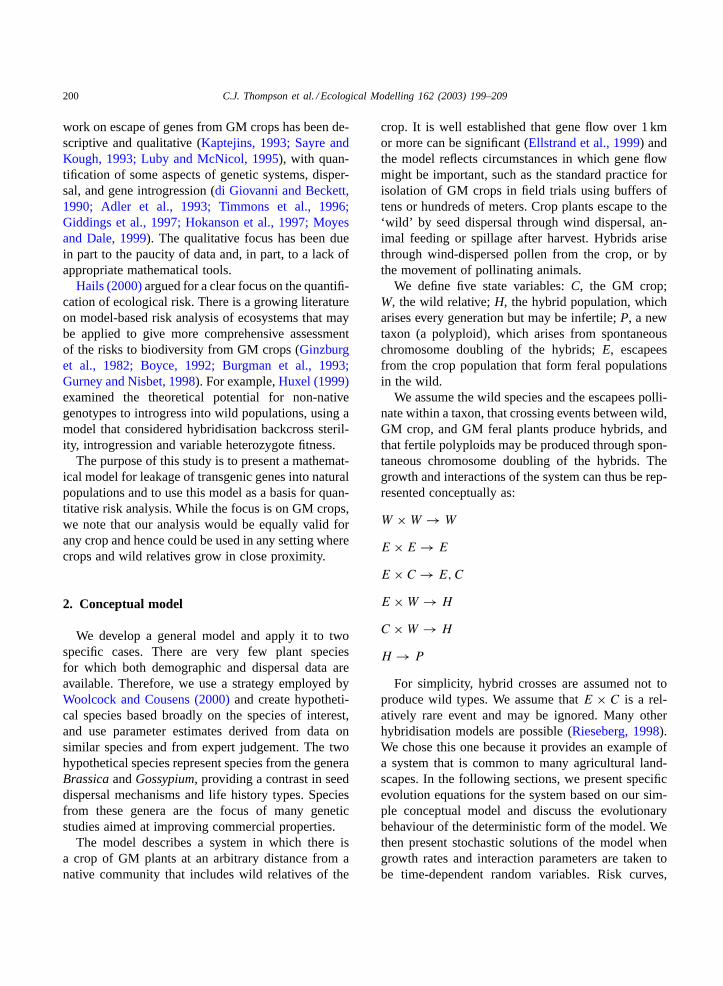
In general it follows from the evolution equationsfor W andH that there are five equilibria (fixed pointsO, A, B, Q, D) in the positive quadrant of theW–Hphase plane shown schematically inFig. 1. Fig. 1alsoshows the phase portrait with separatrices, indicatingwhich equilibria are (locally) stable (O, A, D) andunstable (B, Q).
In generalD = (0, 1) and for A, W + H = 1.Further whensW = sH = s, fW = fH = f andα =β = γ it follows from Eqs. (1), (2), (4), (7), (10), and(11) that the fixed pointQ is given by:
Q =(
(1 − s − α)C
f + s − 1, 0
)(16)
with the requirement that the first component of (16)is non-negative. For the parameter values forBrassica
Fig. 1. Phase portrait of theBrassica model. This is a schematicrepresentation (not to scale). A numerical example of the fixedpoints for particular values of the rates is given inEq. (17). Thetypology of the phase portrait remains the same irrespective of thevalues chosen, but the locations of the fixed points change.

204 C.J. Thompson et al. / Ecological Modelling 162 (2003) 199–209
Table 1Parameter values for the two models
Brassica Gossypium
sW = sE = sH Adult survivorship 0.85 0.9fW = fE Wild and escapee fecundity 0.25 0.2C′ Escape rate of seeds to the patch 0 0a = b = g = a = b Hybridization rates 0.01 0.01fP Polyploid fecundity 0 0.2fH Hybrid fertility 0.25 0C Escape rate of pollen to the patch 0.02 0.02d Spontaneous doubling rate 0 0.0001
These values are indicative examples of a broad range of possibilities. They are chosen merely to illustrate the performance of the model.Different values could reflect a range of different ecological and management conditions.
in Table 1this requirement is satisfied and we find,
A = (0.9991, 0.0009); B = (0.0314, 0.00092);Q = (0.028, 0) (17)
In reality the evolution of the model system on theW-axis(H0 = 0) where(Wt, Ht) → A for W0 ≥ 0.03while for smaller values ofW0, both wild and hybridspecies become extinct((Wt, Ht) → (0, 0)).
The above results depend critically on the assump-tion of zero escape rate of seeds from the crop(C′ =0). For (arbitrarily) small positiveC′ we will havenon-zero escapees(Et > 0) and hence a more com-plicated three-dimensional phase portrait. WithC′ =0.001, W0 = 0.1, E0 = H0 = 0, for example, wefind,
(Wt, Ht, Et) → (0.9945, 0.0012, 0.0042) (18)
while for W0 = 0.01, E0 = H0 = 0, we find
(Wt, Ht, Et) → (0, 0, 1) (19)
The interested reader may wish to explore otherregions of phase and parameter space. We note fi-nally from Fig. 1 that the interesting equilibriumD = (0, 1), where hybrids completely dominate thepatch, cannot be reached deterministically from initialvaluesW0 > 0 andH0 = 0. In the stochastic versionof the model however, where it is possible to “jump”the separatrix joiningB to Q, hybrids may dominatethe patch after some sequence of environmental (pa-rameter) variation. We will have more to say aboutthis stochastic phenomenon in later sections.
3.2. Gossypium
For the cotton model withC′ = 0, we again de-duce from (6) thatE0 = 0 implies Et = 0 for allt ≥ 0. In this model, however, fertile polyploids arisefrom spontaneous doubling of infertile hybrids so thatwe have a genuine three-dimensional (W, H, P) phasespace, even whenC′ = 0. In this case it is not difficultto show that the origin is a locally stable equilibriumand that other equilibria in the positive quadrant allhave a hybrid value of:
H = αC
f(20)
when survival rates (s) are equal and fecunditiesfW =fP = f , (fH = 0).
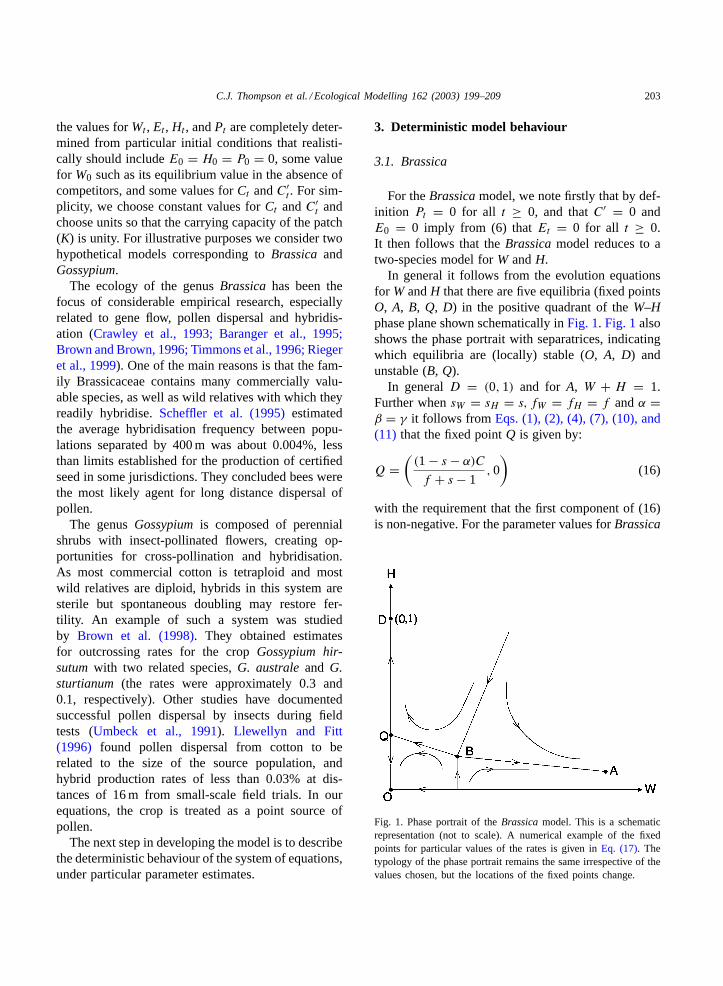
For the parameter values forGossypium in Table 1it follows that equilibriumP-values are either 0 or2.38×10−8, so effectively we have a two-dimensionalphase portrait shown schematically inFig. 2with twostable equilibriaA andO and one unstable equilibriumB. In this situation hybrids or polyploids can neverdominate the patch.
For the parameter values inTable 1,
A = (0.999, 0.001); B = (0.021, 0.001) (21)
Again when one iterates fromW0 > 0 andH0 = 0one either approachesA whereW dominates(W0 ≥0.02) or both W and H are driven to extinction(W0 ≤ 0.02).
As it turns out, the above situation only holds incertain regions of parameter and phase space. Forexample, with fixeds, α, C andd � 1, one obtains
C.J. Thompson et al. / Ecological Modelling 162 (2003) 199–209 205
Fig. 2. Phase portrait of theGossypium model. This is a schematicrepresentation (not to scale). A numerical example of the fixedpoints for particular values of the rates is given inEq. (21). Thetypology of the phase portrait remains the same irrespective of thevalues chosen, but the locations of the fixed points change.
equilibria with non-trivial positiveP-values when
f > 2(1 + C)(1 − s) + αC (22)
(Coincidentally the right hand side of (22) is 0.2042for parameter values (17).) As an example withf =0.25 and other parameter values given inTable 1, oneobtains in addition to the trivial fixed pointW = H =P = 0, the equilibria (fixed points)
H = αC
f= 0.0008, W = 2(H + C)
3= 0.0139,
P ≈ 0
H = 0.0008, W = P = 2(H + C) = 0.0416
(23)
andH = 0.0008, W = 1 − H = 0.9992, P = 0
H = 0.0008, W = P = 1 − H
2= 0.4996
(24)
Numerical iteration of the deterministic evolutionequations for ourGossypium model with the realis-tic values ofH0 = P0 = 0 show, however, that thenon-trivial (positive) P equilibria above are neverreached. In other words one finds, as before, that oneeither converges to the dominant wild equilibrium (A)or to the trivial extinction equilibrium (0).
For non-zero rates (C′) of seeds escaping from thecrop, one has a non-zero population of escapees inthe patch and a more complicated four-dimensionalphase portrait. Again, the interested reader is encour-aged to explore the higher dimension phase portrait.In all cases, however, since our models are of ceilingtype the (possibly) many equilibria will be either (lo-cally) stable or unstable with no exotic aperiodic orchaotic trajectories.
Finally, we note that as for theBrassica model it isagain possible to approach equilibria with non-trivialP-values for particular sequences of stochastic envi-ronmental (parameter) variation.
4. Stochastic models and risk curves
Many if not all of the parameters in the equationsabove are subject to seasonal variation and the va-garies of the environment. To model these variations,we assume the parameters are random variables gov-erned by specified probability distributions. At eachstep of the iteration process of our dynamical systemwe choose values for the parameters by samplingfrom the appropriate distribution. In the stochasticversions of the model, coefficients of variation of15% are added to the parameter values for the speciesconcerned. This level of variation reflects the levelsof variation in vital rates determined empirically fora range of species (e.g.Klemow and Raynal, 1983;Mack and Pyke, 1983; Menges, 1990; Bradstocket al., 1996; Nantel et al., 1996; Oostermeijer et al.,1996). With the exception of survival rates that weassume to have a beta distribution, all parameters areassumed to have a lognormal distribution. In all cases,we takef + s = 1.1 to determine the fecundities.
The results of stochastic simulations may be viewedfrom a number of different perspectives. One of themost common is to specify an adverse event, andthen calculate the probability that the event will occurwithin a specified time. As time increases, the proba-bility of observing the event increases: the risk curveis a cumulative probability distribution representingthe chance that the unwanted event will occur at leastonce up until the current time. It turns out that forboth species, there is a risk of more than 50% that theGM-free portion of a wild stand adjacent to a cropwill fall below 20% of its initial size within the next
206 C.J. Thompson et al. / Ecological Modelling 162 (2003) 199–209
100 years, given 1% seed rain, a hybridization rate of20%, and pollen rain from the crop making up 1% ofthe pollen in the adjacent stand. The model assumesthat the crop is the only external source of pollen andseeds. A more likely outcome is that there will be gra-dients of gene frequencies decreasing with distancefrom the crop, and that these gradients may pose a riskto species with limited distributions close to the crop.
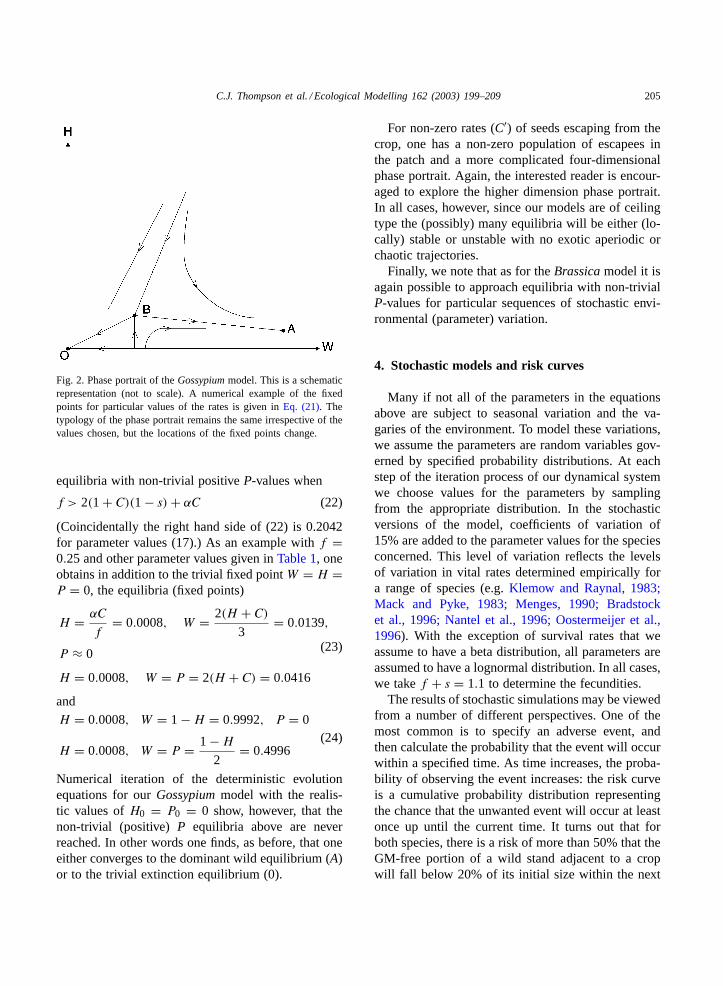
The analysis may focus on other kinds of thresh-olds, depending on the social, agricultural or ecologi-cal context of the problem at hand. In some instances,it is important to know the likelihood that gene fre-quencies will exceed lower bounds. For the purposesof establishing ‘organic’ or ‘GM-free’ status, or to as-sess legal or economic liability associated with mar-ket perceptions, it may be necessary to calculate thechance that the gene from the crop will exceed say1% of the adjacent stand.Fig. 3 shows the probabil-ities that GM plants will exceed 1% of the adjacentstand at least once before the time specified, for theBrassica andGossypium models.
In both cases, there is an appreciable chance that thethreshold will be exceeded. Of course, it is possible toargue that the parameters used in these simulations arenot representative of field conditions, although theymay be theoretically plausible. To answer questionsthat relate to the plausibility of parameters, it is pos-sible to recast the simulations and look at the resultsfrom a different perspective. The risks of exceeding a
Fig. 3. The probability that more than 1% of the population in the adjacent stand will have the modified gene during the time specified,using the parameter values specified inTable 1.
threshold depend sensitively on the hybridization ratesand on the parameterC, the percentage of the pollen inthe adjacent stand that is derived from the crop. Thisis a function of distance, wind direction, synchronisa-tion of flowering, pollinator behaviour, the presence ofbarriers, and so on. It is possible to model these pro-cesses in detail, making assumptions and estimatingparameters for each species, for a set of specific sce-narios (e.g.Giddings, 2000). But in the present con-text, it is more useful to rephrase the question. We canask, what percentage of local pollen derived from thecrop population will result in a greater than 1% chancethat the gene pool in the local stand will be composedof more than 0.1% crop genes? This is equivalent (inAustralia) to asking how high the pollen rain may bebefore there is an appreciable risk that the claim canno longer be made that an adjacent crop is GM-free.Within the constraints of the assumptions in the model,this question may be answered using the equationsabove, by back-calculation (trial-and-error simulation;Table 2).
In the Brassica example, the risk is calculated forspecies that are adjacent to a population from whichgene flow is relatively unrestricted. TheGossypiummodel is constrained by the need for polyploids toarise. Any circumstances in which pollen rain exceedsthe threshold inTable 2will mean a risk of greaterthan 1% that the threshold of 0.1% will be exceeded.For example, forBrassica, if the percent of pollen

C.J. Thompson et al. / Ecological Modelling 162 (2003) 199–209 207
Table 2The percentage of pollen in the local stand derived from the cropthat gives a probability of just less than 1% of exceeding 0.1% ofthe local stand
Species Percentage of pollenderived from the crop
Brassica 0.000085Gossypium 0.014
derived from the crop exceeds 0.000085% of the totalpollen, there is a greater than 1% chance that the GMcomponent of an adjacent population will exceed 0.1%of the total population, at least once in the next 100years. It is worth noting that these pollen levels aresmaller than the relative pollen concentrations detectedby Llewellyn and Fitt (1996). IOGTR (2000)assessedthe risks of gene flow fromGossypium to adjacentcrops to be ‘remote’, based on a qualitative assessmentof empirical information. This interpretation may onlybe supported under conditions in which the proportionof pollen in adjacent crops is smaller than about thevalues forBrassica (Table 2). Such rates would bevery difficult to detect without very large samples.
5. Discussion
Debates about the benefits and costs of GM cropscontinue among scientists. Many of the debates con-cern the role of science in the public debate (e.g.Conway, 2000; Peterson et al., 2000; Walker andLonsdale, 2000; Walton, 2000). None of the debatescritically assess the ability of science and scientists toprovide the evidence necessary for rational decisions.The need for model-based risk assessments to providerelatively unambiguous, transparent, and internallyconsistent analysis of empirical data has been reiter-ated many times (e.g.Levin, 1992; Beringer, 2000).Yet almost all published risk assessments are quali-tative (e.g.Pascher and Gollman, 1999) or empirical(St. Amand et al., 2000).
This study illustrates the imperative for the routineapplication of model-based risk analysis. Our modelembodies a range of assumptions for a limited setof life history types, and parameters that reflect justone set of ecological circumstances such as an adja-cent stand that is isolated so that the crop is the onlyexternal source of pollen and seed. We did not ex-
plore the consequences of management alternatives,such as growing crops in rotation, although such ex-tensions are entirely possible. These results are notindicative of the general probabilities of gene transferfor Gossypium or Brassica. Rather, the work demon-strates the utility of making explicit models to assessrisks in a transparent and repeatable way, leading tobetter informed debates about the management of risksassociated with GM crops. For example, the utility ofbuffers of different widths may be explored by adjust-ing model parameters (in this case, the rates of seedand pollen dispersal).
The models developed here make many simplifyingassumptions. They include; all plants produce equiva-lent amounts of seed, there are no maternal or paternaleffects, mating is random, pollen is completely mixed,and there is no seed bank. Each assumption may haveimportant implications, depending on context. Somewill lead to underestimation of hybridisation and in-trogression, some will lead to overestimation, andsome may lead to either over- or underestimation.The model will be more sensitive to departures fromsome assumptions than from others. The purpose ofbuilding the model is to make assumptions plain, andin doing so, make the logic of the problem trans-parent. The model provides a platform for formalsensitivity analysis that allows the user to explore theimportance of departures from assumptions that maybe relevant in a particular context.
The most critical empirical assumptions supportingthe results above relate to pollen dispersal, which iscontext dependent. But the general conclusion is thateven very small amounts of dispersing pollen may leadto surprisingly high risks of unwanted events, when theevents are integrated over reasonable time frames, andwhen they account for some of the kinds of uncertain-ties that are present in all ecological systems. The intu-ition that flows from analyses such as those above arevery difficult to achieve by subjective interrogation ofempirical data.Huxel (1999)explored the importanceof assumptions regarding hybridisation processes forgene introgression using a single-locus, two-allelemodel. More general packages for model-based riskassessment of GM plants are becoming available(Colbach et al., 2001). They provide a basis for gener-ating answers to questions such as the effect of fitnessof transgenes and differences in pollen ability on therate of gene introgression, to add maternal effects,

208 C.J. Thompson et al. / Ecological Modelling 162 (2003) 199–209
or to relax any of the other assumptions made in themodels here. The consequences for risk and biosafetyassessments are that assessments made without theassistance of a model are likely to be relatively freeof semantic uncertainties and inconsistent logic.
Acknowledgements
We wish to thank Sarah Bekessy for creating thefigures and Heather Anderson for finding importantreferences. Comments from two referees improved themanuscript.
References
AAS, 1999. Gene Technology and Food. National Science andIndustry Forum Report, Australian Academy of Science, April.
Adler, L.S., Wikler, K., Wyndham, F.S., Linder, C.R., Schmitt,J., 1993. Potential for the persistence of genes escaped fromcanola: germination cues in crop, wild and crop-wild hybridBrassica rapa. Functional Ecol. 7, 736–745.
Baranger, A., Chevre, A.M., Eber, F., Renard, M., 1995. Effectof oilseed rape genotype on the spontaneous hybridizationrate with weedy species: an assessment of transgene dispersal.Theoretical Appl. Genet. 91, 956–963.
Beringer, J., 2000. Reply from Sir John Beringer. Bull. Br. Ecol.Soc. 31, 16.
Boyce, M.S., 1992. Population viability analysis. Ann. Rev. Ecol.Systematics 23, 481–506.
Bradstock, R.A., Bedward, M., Scott, J., Keith, D.A., 1996.Simulation of the effect of spatial and temporal variation infire regimes on the population viability of aBanksia species.Conservation Biol. 10, 776–784.
Brown, A.H.D., Hurka, H., Craven, L.A., Grace, J.P., 1998. Riskof escape of transgenes from cotton into natural populationsof endemic Gossypium. In: Paper Presented to the Society forConservation Biology Meeting, Sydney, July.
Brown, J., Brown, A.P., 1996. Gene transfer between canola(Brassica napus L. and B. campestris L.) and related weeds.Annal. Appl. Biol. 129, 513–522.
Burgman, M.A., Ferson, S., Akçakaya, H.R., 1993. RiskAssessment in Conservation Biology. Chapman & Hall, London.
Colbach, N., Clermont-Dauphin, C., Meynard, J.M., 2001.GeneSys: a model of the influence of cropping system on geneescape from herbicide tolerant rapeseed crops to rape volunteers.II. Genetic exchanges among volunteer and cropped populationsin a small region. Agriculture, Ecosyst. Environ. 83, 255–270.
Conway, G., 2000. Genetically modified crops: risks and promise.Conserv. Ecol. 4 (1) 2 (online) URL:http://www.consecol.org/vol4/iss1/art2.
Crawley, M.J., Hails, R.S., Rees, M., Kohn, D., Buxton, J., 1993.Ecology of transgenic oilseed rape in natural habitats. Nature363, 620–623.
Ellstrand, N.C., Prentice, H.C., Hancock, J.F., 1999. Gene flow andintrogression from domesticated plants to their wild relatives.Annu. Rev. Ecol. Systematics 539–563.
Giddings, G.D., Sackville-Hamilton, N.R., Hayward, M.D., 1997.The release of genetically modified grasses. II. The influenceof wind direction on pollen dispersal. Theoretical Appl. Genet.94, 1007–1014.
Giddings, G., 2000. Modelling the spread of pollen from Loliumperenne: the implications for the release of wind-pollinatedtransgenics. Theoretical Appl. Genet. 100, 971–974.
Ginzburg, L.V., Slobodkin, L.B., Johnson, K., Bindman, A.G.,1982. Quasi-extinction probabilities as a measure of impact onpopulation growth. Risk Anal. 2, 171–181.
di Giovanni, F., Beckett, P.M., 1990. On the mathematicalmodelling of pollen dispersal and deposition. J. Appl. Meteorol.29, 1352–1357.
Gurney, W.S.C., Nisbet, R.M., 1998. Ecological Dynamics. OxfordUniversity Press, New York.
Hails, R.S., 2000. Genetically modified plants—the debatecontinues. Trends Ecol. Evolut. 15, 14–18.
Hokanson, S.C., Hancock, J.F., Grumet, R., 1997. Directcomparison of pollen-mediated movement of native andengineered genes. Euphytica 96, 397–403.
Huxel, G.R., 1999. Rapid displacement of native species byinvasive species: effects of hybridization. Biol. Conserv. 89,143–152.
IOGTR, 2000. Draft Risk Analysis of Proposal for CommercialRelease of Roundup Ready Cotton. Interim Office of the GeneTechnology Regulator. Canberra, p. 73.
James, C., 2000. Global Review of Commercialized Transgeniccrops. ISAAA Briefs 21. (online) URL:http://www.isaaa.org/Pub1.htm.
Kaptejins, A.J.A.M., 1993. Risk assessment of genetically modifiedcrops: potential of crops to hybridise with wild flora. Euphytica66, 145–149.
Klemow, K.M., Raynal, D.J., 1983. Population biology of anannual plant in a temporally variable environment. J. Ecol. 71,691–703.
Levin, B.R., 1992. DNA technology and the release ofgenetically engineered organisms: some implications for theconservation of genetic resources. In: Sandlund, O.T., Hindar,K., Brown, A.H.D. (Eds.), Conservation of Biodiversity forSustainable Development. Scandinavian University Press, Oslo,pp. 245–259.
Llewellyn, D., Fitt, G., 1996. Pollen dispersal from two field trialsof transgenic cotton in the Namoi Valley. Aust. Molec. Breeding2, 157–166.
Luby, J.J., McNicol, R.R., 1995. Gene flow from cultivated to wildraspberries in Scotland: developing a basis for risk assessmentfor testing and deployment of transgenic cultivars. TheoreticalAppl. Genet. 90, 1133–1137.
Lutman, P. (Ed.), 1999. Gene flow and agriculture: relevance fortransgenic crops. BCPC Symp. Proc. 72.
Mack, R.N., Pyke, D.A., 1983. The demography ofBromustectorum: variation in time and space. J. Ecol. 71, 69–93.
Menges, E.S., 1990. Population viability analysis for an endangeredplant. Conserv. Biol. 4, 52–62.
C.J. Thompson et al. / Ecological Modelling 162 (2003) 199–209 209
Moyes, C.L., Dale, P.J., 1999. Organic farming and gene transferfrom genetically modified crops. Report to the Ministry ofAgriculture, UK, 1999, project no. 0157.
Nantel, P., Gagnon, D., Nault, A., 1996. Population viabilityanalysis of American ginseng and wild leek harvested instochastic environments. Conserv. Biol. 10, 608–621.
Oostermeijer, J.G.B., Brugman, M.L., Boer, E.R., den Nijs,H.C.M., 1996. Temporal and spatial variation in the demographyof Gentiana pneumonanthe, a rare perennial herb. J. Ecol. 84,153–166.
Pascher, K., Gollman, G., 1999. Ecological risk assessment oftransgenic plant releases: an Australian perspective. BiodiversityConserv. 8, 1139–1158.
Peterson, G., Cunningham, S., Deutsch, L., Erickson, J., Quinlan,A., Raez-Luna, E., Tinch, R., Troell, M., Woodbury, P., Zens,S., 2000. The risks and benefits of genetically modified crops:a multidisciplinary perspective. Conserv. Ecol. 4 (1) 13 (online)URL: http://www.consecol.org/vol4/iss1/art13.
Rieger, M.A., Preston, C., Powles, S.B., 1999. Risks of gene flowfrom transgenic herbicide-resistant canola (Brassica napus) toweedy relatives in southern Australian cropping systems. Aust.J. Agric. Res. 50, 115–128.
Rieseberg, L.H., 1998. Plant hybridization. New Phytologist 140,599–624.
Sayre, P.G., Kough, J.L., 1993. Assessment of geneticallyengineered micro-organisms under TSCA: considerations prior
to use in fermentors or small-scale field release. Environ.Toxicol. Risk Assessment ASTM STP 1179, 65–79.
Scheffler, J.A., Parkinson, R., Dale, P.J., 1995. Evaluating the effectof isolation distances for field plots of oilseed rape (Brassicanapus) using a herbicide-resistance transgene as a selectablemarker. Plant Breeding 114, 317–321.
St Amand, P.C., Skinner, D.Z., Peaden, R.N., 2000. Risk of alfalfatransgene dissemination and scale. Theoretical Appl. Genet.101, 107–114.
Timmons, A.M., Charters, Y.M., Crawford, J.W., Burn, D., Scott,S.E., Dubbels, S.J., Wilson, N.J., Robertson, A., O’Brien, E.T.,Squire, G.R., Wilkinson, M.J., 1996. Risks from transgeniccrops. Nature 380, 487.
Umbeck, P.F., Barton, K.A., Nordheim, E.V., McCarty, J.C.,Parrott, W.L., Jenkins, J.N., 1991. Degree of pollen dispersalby insects from a field test of genetically engineered cotton. J.Econ. Entomol. 84, 1943–1950.
Walker, B., Lonsdale, M., 2000. Genetically modified organismsat the crossroads: comments on genetically modified crops:risks and promise by Gordon Conway. Conserv. Ecol. 4 (1) 12(online) URL: http://www.consecol.org/vol4/iss1/art12.
Walton, D., 2000. Genetically modified futures. Bull. Br. Ecol.Soc. 31, 14–16.
Woolcock, J.L., Cousens, R., 2000. A mathematical analysis offactors affecting the rate of spread of patches of annual weedsin an arable field. Weed Sci. 48, 27–34.