mobilizing energy efficiency in the manufactured housing sector
TRANSCRIPT

Mobilizing Energy Efficiency in the Manufactured Housing Sector
July 2012
Jacob Talbot
Report Number A124
© American Council for an Energy-Efficient Economy 529 14th Street, N.W., Suite 600, Washington, D.C. 20045 (202) 507-4000 phone, (202) 507-429-2248 fax, aceee.org


Mobilizing Energy Efficiency in the Manufactured Housing Sector, © ACEEE
i
Contents Acknowledgments ....................................................................................................................... ii Executive Summary ................................................................................................................... iii Introduction ................................................................................................................................ 1 Market Analysis .......................................................................................................................... 1
What Are Manufactured Homes? .................................................................................... 1 Housing Stock ................................................................................................................ 3 Building Quality and Energy Standards .......................................................................... 5 Manufactured Housing Placements ................................................................................ 6 Demographics of Manufactured Home Residents ........................................................... 7 The Cost of Home Ownership ........................................................................................ 7 Financing a Manufactured Home .................................................................................... 8 Manufactured Homes Sales: The Boom of the 1990s and Bust of Aughts ...................... 9
Energy and Manufactured Homes .............................................................................................10
The Fuel Mix in Manufactured Homes ...........................................................................10 Energy Consumption in Manufactured Homes ...............................................................11
Energy Efficiency Program Experience in Manufactured Homes ...............................................12
High-Efficiency Labeling Programs for New Construction ..............................................13 ENERGY STAR .............................................................................................................14 Building America ...........................................................................................................15 Weatherization ..............................................................................................................16 Utility Ratepayer Funded Programs ...............................................................................17 Home Replacement .......................................................................................................18
The Potential for Energy Efficiency Improvements in Manufactured Homes ..............................18
Electricity Savings Potential ...........................................................................................20 Natural Gas Savings ......................................................................................................22 Building Shell Measures ................................................................................................23 HVAC Equipment ..........................................................................................................23 Water Heating ...............................................................................................................24 Lighting ..........................................................................................................................25 Other Electric Measures ................................................................................................25 New Construction ..........................................................................................................25
Recommendations for Improving Manufactured Homes ............................................................26
Energy Efficiency Programs ..........................................................................................26 Code Development ........................................................................................................27 Improving the Appliance Baseline ..................................................................................27 New Construction Opportunities ....................................................................................28

Mobilizing Energy Efficiency in the Manufactured Housing Sector, © ACEEE
ii
Structural Insulated Panels (SIPs) .................................................................................28 Ductless Heat Pumps ....................................................................................................29 Manufactured Home Financing ......................................................................................30
Final Thoughts ..........................................................................................................................30 References ...............................................................................................................................31 Appendix ...................................................................................................................................35
Electricity Savings Potential Analysis ............................................................................35 Residential Efficiency Measure References ..............................................................................52
Acknowledgments I thank the many experts whose extensive work in the field of manufactured housing laid the foundation for this report, including, but not limited to: Francis Conlin, Bob Davis, Russell Duncan, Ken Ecklund, Tom Eckman, Sandy Fazeli, Jeff Genzer, Charlie Harack, Michael Lubliner, Brian Ng, Linda Sandahl, David Terry, Lowell Ungar, John Van Alst, and Ellen Vaughn. I also thank my friends and colleagues: Jennifer Amann, Patrick Kiker, Glee Murray, Steven Nadel, Renee Nida, Harvey Sachs, and Eric Schwass for their invaluable assistance in the research, development, and production of this report.
Mobilizing Energy Efficiency in the Manufactured Housing Sector, © ACEEE
iii
Executive Summary Manufactured homes are an important source of affordable housing for nearly 19 million Americans, particularly low-income residents. Unfortunately, energy efficiency in manufactured homes lags behind that of site-built homes for two primary reasons: first, the HUD code, which governs energy efficiency standards manufactured homes, is outdated; and second, emphasis on low cost has resulted in many homes with poor energy performance. As with all energy-consuming products, manufactured home affordability includes all expenses during the lifetime of the home, not just initial cost. For residents of energy-inefficient manufactured homes, energy costs are substantial and comprise a disproportionate amount of income relative to residents of site-built homes. In fact, residents of manufactured homes spend nearly twice as much on energy per square foot of living space as residents of site-built homes. Increasing energy efficiency in the manufactured housing sector will not only save energy, but also improve the comfort and financial stability of residents of manufactured homes. We estimate that cost-effective energy efficiency improvements can save 40 percent of total projected electricity consumption and 33 percent of total projected natural gas consumption during the period of analysis in this study, 2011 through 2030 (see Figures ES-1 and ES-2). This level of savings is higher than that which we have found for the site-built housing market (our assessments of the residential buildings sector as a whole have typically found about 25-30 percent cost-effective energy efficiency potential). However, we calculate that the cumulative cost of saved energy for energy efficiency measures in manufactured housing is higher than similar measures for site-built homes. Additionally, some measures that are cost-effective in site-built homes are not in manufactured homes. Reduced cost-effectiveness results from the fact that manufactured homes are smaller than site-built homes on average and measure costs do not always scale down in proportion to home size. Twenty-five percent of the electricity savings potential and 28 percent of the natural gas savings potential are attributable to new construction. This proportion is higher than that which we have found for site-built homes due to the large potential for improvements to energy codes and the shorter average lifetimes for manufactured homes relative to site built. With higher turnover, new construction will comprise a larger percent of the housing stock in 2030. We estimate that manufactured homes built during the period of analysis will account for about a third of all energy consumption in the manufactured housing sector in 2030. The majority of electricity savings in existing manufactured homes derive from upgrades to the building shell, including insulation, air sealing, duct sealing. High-efficiency HVAC equipment and water heaters can also save significant amounts of energy, especially heat pumps and heat pump water heaters (see Figure ES-1).

Mobilizing Energy Efficiency in the Manufactured Housing Sector, © ACEEE
iv
Figure ES-1: Electricity Consumption and Savings in 2030 Relative to Total Projected Demand of 88,700 GWh
As with electricity, improvements to the building shell offer the largest portion of the natural gas savings potential in existing homes, followed by HVAC equipment. Measures to reduce the water heating load, such as low-flow showerheads and faucet aerators, can also save substantial amounts of energy (see figure ES-2). We found that high performance gas-fired water heaters, such as condensing storage units and tankless water heaters, were not cost-effective for most residents of manufactured homes, due to low natural gas prices, high product costs, and lower average use relative to residents of site-built homes. Still, manufactured homes with large families or residents in areas with higher gas prices may find that energy-efficient water heaters are cost-effective.
Electricity Consumption: 52,900GWh
HVAC Shell Savings: 12,200 GWh
Water Heating Savings: 5,500 GWh
Lighting Savings: 2,100 GWh
Refrigeration Savings: 400 GWh
Appliance Savings: 200 GWh
Plug Load Savings: 1,400 GWh
New Homes Savings: 8,800 GWh
Electricity Savings 35,900 GWh, 40%

Mobilizing Energy Efficiency in the Manufactured Housing Sector, © ACEEE
v
Figure ES-2: Natural Gas Consumption and Savings in 2030 Relative to Total Projected Demand of 97,700 GWh
First-cost is a very large barrier to energy efficiency in the manufactured housing sector. In the market for new homes, personal property loans (also called chattel loans) are the most common type of loan available to potential buyers. These loans feature high interest rates and short amortization schedules, which makes investments in high efficiency more expensive than with conventional mortgages (Salzberg et al. 2012). Not only do chattel loans create a financial barrier to higher efficiency, they can in fact reduce and prevent cost-effectiveness for energy efficiency investments in new construction (Salzberg et al. 2012). Addressing this barrier to investment will be critical to increasing market penetration of energy-efficient manufactured homes. Updating energy standards in the HUD code is another important step toward improving energy efficiency in the manufactured housing sector. Energy standards have not been updated since 1994 and are much lower than those in site-built homes. The U.S. Department of Energy (DOE) is currently engaged in a rulemaking to establish new energy efficiency standards for manufactured homes but it has not yet released a proposed rule. The Energy Independence and Security Act stipulates that DOE should establish energy standards based on the most recent standards from the International Energy Code Council (IECC), which governs energy efficiency in site-built homes and is adopted by most states. We expect DOE to release the proposed rule before the end of 2012. Conventional construction improvements, such as higher insulation values, energy-efficient windows, and improved duct sealing, should allow manufactured homes to meet the IECC code, but there are other practices that offer the potential for bigger savings in the future. Structural insulated panels (SIPs) and ductless heat pumps are two such promising opportunities that have demonstrated success in the site-built housing market. In addition to high insulation value, SIPs improve lateral rigidity, which can reduce damage to manufactured homes during transit and installation. Ductless heat pumps are much more efficient than the electric furnaces commonly installed in manufactured homes and eliminate the energy losses in ductwork.
Natural Gas Consumption: 65,800 BBtu
Space Heating Savings: 21,100 BBtu
Water Heating Savings: 2,000 BBtu
New Homes Savings: 8,800 BBtu
Total Natural Gas Savings 31,900 BBtu, 33%

Mobilizing Energy Efficiency in the Manufactured Housing Sector, © ACEEE
vi
Program experience in the Pacific Northwest, such as the current partnership between Northwest Energy-Efficient Manufactured Housing Program (NEEM) and ENERGY STAR, has demonstrated the potential to build and market high-efficiency manufactured homes. In part, this success is made possible by demand for high-end manufactured homes in the Northwest. Additionally, manufactured housing competes with the custom site-built housing market to a greater degree than in other areas of the country and double-wide homes represent a larger share of the market. Still, NEEM’s effective marketing strategy, which dates back to the 1980s, has created sustained demand for high performance manufactured homes. Upstream and downstream incentives have also helped reduce incremental costs. It would be optimistic to expect the same degree of success in other parts of the country in the near future. However, program experience from the Northwest can help encourage and inform program efforts elsewhere. In existing manufactured homes, incremental costs again pose a substantial barrier to energy efficiency. On average, residents of manufactured homes have incomes less than two-thirds those of residents of site-built homes. Many residents of manufactured homes are low-income, living below the poverty line, and/or living on a fixed-income. For these residents, even very cost-effective efficiency improvements are infrequently undertaken. For this reason, one expert has referred to manufactured homes that are designed and built to a low standard of energy performance as “lost opportunities,” because once a home is inhabited it is both expensive to retrofit and less commonly done (Lubliner 2011). Additionally, research has demonstrated that improving home energy performance during construction is more cost-effective and achieves greater energy savings than retrofitting homes in the field (Salzberg et al. 2012). Still there are some programs dedicated to improving energy performance in existing manufactured homes. The federally-funded Weatherization Assistance Program (WAP) is the largest program retrofitting manufactured homes. WAP aids financially constrained residents by improving energy performance, comfort, and safety through cost-effective home retrofits. WAP concentrates on insulating and sealing the building envelope and ductwork of low-income homeowners, and sometimes upgrades furnaces and other appliances. These measures help to extend the life of homes and can achieve energy savings of about 20 percent (Taylor 2009). Federal funding for WAP has fallen dramatically in the last several years and its lowest level since the 1970s. Restoring WAP funding to 2009 levels will help serve vulnerable residents of manufactured homes. There are few utility programs designed specifically for manufactured homes. However, one such program run by Puget Sound Energy (PSE) in Washington State offers duct testing and sealing, efficient light bulbs, and efficient showerheads to residents of manufactured homes at no cost to the customer. These measures save an annual average of 800 kWh per home at a cost of $375. PSE has run this program for five years and found the measures cost-effective. The success of this program is particularly noteworthy because utility rates in PSE’s service territory are below the national average, and the manufactured housing building stock in the Northwest is among the most energy efficient in the country. As such, this program model should prove cost-effective for other utilities in areas with higher utility rates. Both WAP and PSE’s duct sealing program address the “incremental cost hurdle” by eliminating costs to the resident. We recommend further research to explore the potential for expanding PSE’s program model to include other measures as well as exploring other program models to increase the market penetration of high-efficiency appliances and construction techniques in manufactured homes. We hope that this analysis of the potential for cost-effective energy savings encourages innovation in program design to capture this salient energy resource.

Mobilizing Energy Efficiency in the Manufactured Housing Sector, © ACEEE
1
Introduction This report highlights the potential for and benefits of energy efficiency in manufactured homes. We assess the current housing market, characterize energy use, and analyze the cost-effective potential for energy efficiency improvements throughout the manufactured housing sector. We are inspired by many experts in the energy efficiency field who have worked for years to improve the energy performance and construction quality of manufactured housing and hope that this study inspires others to initiate similar efforts.
Market Analysis What Are Manufactured Homes? For many, the term “mobile home” conjures images of either rural trailer parks or the unpopular emergency houses delivered to the Gulf Coast following Hurricanes Katrina and Rita. These stereotypes reinforce the commonly held belief that manufactured homes are substantively different and inferior to site-built homes. While there are differences in design and the construction process, manufactured and site-built homes actually share many techniques and materials. There are two primary distinctions between site-built and manufactured homes: first, manufactured homes feature a permanent chassis underneath the house; and second, manufactured homes are constructed in a factory facility and transported to an installation site as a complete structure (multi-section homes are transported as separate sections and assembled on-site). Wheels are attached to the chassis for transportation from the factory and then removed during installation, but the chassis stays in place. The chassis allows the owner to relocate the home if desired, although in practice this happens infrequently. In fact, 67 percent of occupied homes are located on their original foundation (Census 2011). Modular homes, also built in a factory, do not include the chassis. During its approximately fifty-year history, the manufactured housing industry has changed dramatically. The house-on-wheels designs of the 1950s have disappeared from showrooms, replaced by homes that in many ways more closely resemble their site-built counterparts than the freewheeling structures of the past. Even the term mobile home has largely become passé in the industry, which has adopted manufactured housing as the preferred nomenclature.1 This deliberate shift in semantics alludes to the changes in building design, construction, and installation that have occurred in the past half-century. That is, modern manufactured homes are built to last many decades and rarely move from their initial installation sites (see Figure 1). In fact, today the manufactured housing industry competes directly with the site-built industry, particularly among first-time, retired, and low-income home buyers seeking an affordable route to homeownership.
1 Despite manufacturers’ usage of the term “manufactured housing,” surveys conducted by the Manufactured Housing Institute, the trade group for the manufactured housing industry, suggested that most manufactured home owners still refer to their homes as “mobile homes” (MHI 2011).

Mobilizing Energy Efficiency in the Manufactured Housing Sector, © ACEEE
2
Figure 1: Manufactured Homes Then… and Now
Image sources: www.mobilehomeliving.org
The building envelopes of manufactured and site-built homes have many similarities, but also some notable differences. Both use wood framing with bat or blown-in insulation to create the thermal barrier. Manufactured homes usually use 2”x4” framing,2 while site-built homes may use 2”x4” or 2”x6”. Vaulted roofs are common for both types of homes, but the height and width of manufactured homes are limited by transportation regulations. Attics in manufactured homes are usually inaccessible and at least partly filled with insulation. On average, windows represent 12 percent of total floor space in manufactured homes, compared to about 15 percent for site-built (Lucas et al. 2007, Ecotope 2001). This is a nominal difference, but windows are often inefficient in manufactured homes, so the smaller footprint helps reduce heat loss. Manufactured homes feature a crawlspace beneath the house where a soft thermal barrier is constructed using insulation and durable paper, creating an area known as the “belly.” Water and sewer lines, electrical wires, and ductwork are typically located in the belly, within the thermal barrier. Central heating and air conditioning systems are standard amenities in both manufactured and site-built homes, but distribution architecture differs. Site-built homes usually feature separate supply and return duct systems. Manufactured homes have no return ducts, instead drawing return air directly to HVAC equipment through vents in the closet door where equipment is located. This system design may reduce static pressure in ductwork, which in turn lowers electric loads from furnace fans. In manufactured homes, the air conditioner and furnace supply one central duct line via the plenum. The duct line runs the length of the home and delivers conditioned air to each room. In double-wide homes, a crossover duct delivers conditioned air to the adjacent section of the home. Crossover ducts are notoriously leaky sections of the HVAC system (Manclark and Davis 1996). Siting also differs between site-built and manufactured homes. The majority (60 percent) of manufactured homes are installed on concrete blocks. Another 18 percent of homes are installed on a permanent foundation, and 17 percent are on a concrete pad (Census 2011). Even for homeowners who plan never to move their home, the preference for concrete blocks makes some financial sense, as site preparation and home installation may comprise 14 percent or more of total home costs and siting a home on concrete blocks costs less than
2 Some high performance manufactured homes, particularly in the Northwest, use 2”x6” framing.

Mobilizing Energy Efficiency in the Manufactured Housing Sector, © ACEEE
3
concrete pads and permanent foundations (WSDOC 2012). On the other hand, siting a manufactured home on a permanent foundation makes it easier for a homeowner to qualify for a conventional mortgage, which can reduce interest rates and monthly payments on loans (Lubliner and Eckman 2012). We will discuss manufactured home financing more thoroughly below. By contrast, the most common foundations for site-built homes are slab-on-grade and basements. Figure 2 shows a cross-section of a typical double-wide manufactured home. In this diagram, you can see the furnace (labeled FAU, or Forced Air Unit) located in a closet adjacent the bathroom and a crossover ductwork running beneath the home connecting the two main ducts. The house is sited on concrete blocks and there is an exhaust vent running through the attic.
Figure 2: Cross-Section of a Double-Wide Manufactured Home
Image source: 2004 Northwest Energy Efficient Manufactured Home Program
In-Plant Inspection Manual Housing Stock Manufactured homes comprise a significant share of the housing stock. There are over 6.9 million occupied manufactured homes across America, representing 6.1 percent of the housing stock and providing homes for nearly 19 million residents (Census 2011). Another 1.2 million manufactured homes are currently unoccupied, typically because they are for rent, sale, or only occupied seasonally (Census 2011). However, these national statistics do not paint a complete picture of the manufactured housing market, which varies significantly from region to region, state to state, and county to county. The majority of manufactured homes are located in the South (57 percent), followed by the West (18 percent), Midwest (17 percent), and Northeast (7 percent) (Census 2011). The vast majority (92 percent) of manufactured homes are located in either suburban or rural areas, outside of central cities. Figure 3 depicts the percentages and total numbers of manufactured homes located in each state in the United States.

Mobilizing Energy Efficiency in the Manufactured Housing Sector, © ACEEE
4
Figure 3: Distribution of Manufactured Housing Stock by State
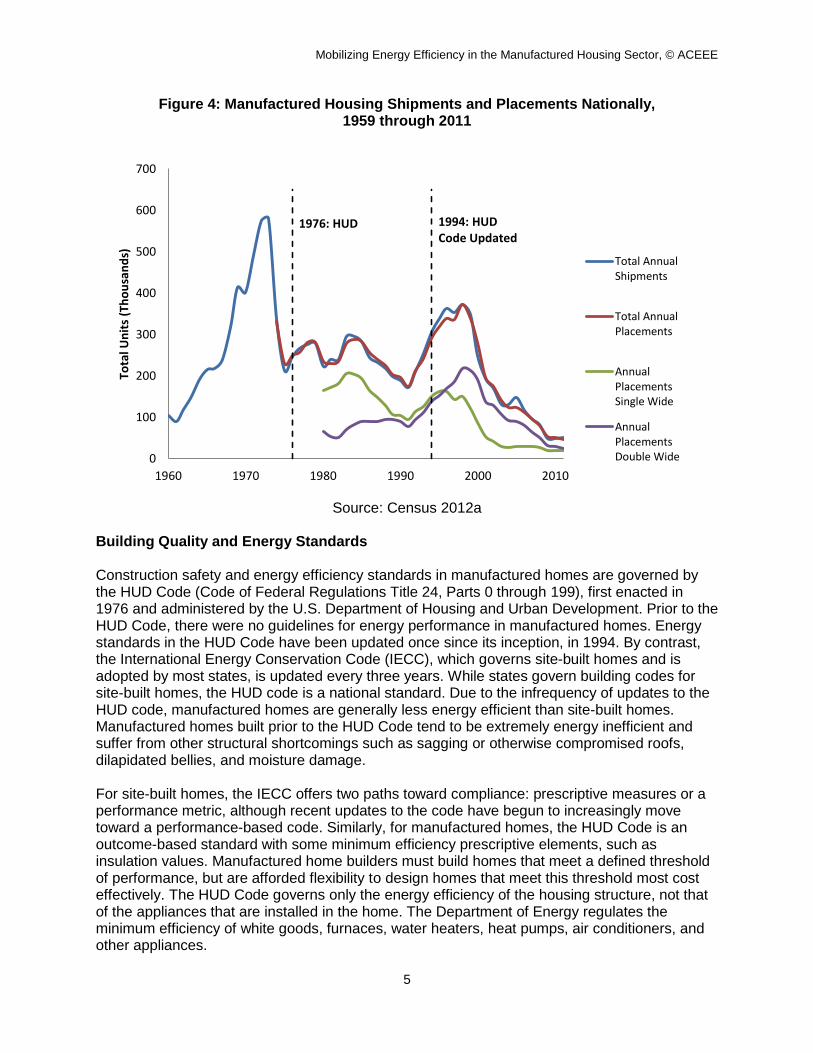
Source: Moody’s Economy.com Manufactured homes are typically sold as either single-wide or double-wide models, but about 1 percent are for triple-wide homes or larger. Single-, double-, and triple- refer to the number of conjoined housing sections. Consumer preference has oscillated between single- and double-wide units during the past several decades. Until the 1990’s, single-wide homes dominated sales and still comprise a majority (61 percent) of the housing stock (Census 2012a). From the mid-nineties and through the 2000s, double-wide sales outpaced single-wides and now account for 38 percent of installed homes. And while in the early 2000s double-wides outsold single-wides by a 3 to 1 margin, in the last few years the gap in sales has narrowed, with the market roughly split between the two configurations in 2011 (Census 2012a). This recent shift is likely a result of the recession, during which financing was difficult to obtain and low first cost was of heightened importance to consumers. Figure 4 illustrates manufactured housing shipments and placements over the past half-century. Given its relatively brief history, the manufactured housing stock is younger than that of site-built homes, but not by as much as one might imagine. The median manufactured home was built in 1988, compared to 1974 for the housing stock as a whole. Industry experts estimate that manufactured homes last around 50 years (Salzberg et al. 2012). As a testament to this longevity, 22 percent of the occupied manufactured housing stock predates the HUD Code, and 66 percent was built before the 1994 HUD Code update, which marked a substantial increase in energy efficiency (Census 2011). As we will discuss later, these homes offer a significant potential for energy efficiency savings.
Mobilizing Energy Efficiency in the Manufactured Housing Sector, © ACEEE
5
Figure 4: Manufactured Housing Shipments and Placements Nationally, 1959 through 2011
Source: Census 2012a
Building Quality and Energy Standards Construction safety and energy efficiency standards in manufactured homes are governed by the HUD Code (Code of Federal Regulations Title 24, Parts 0 through 199), first enacted in 1976 and administered by the U.S. Department of Housing and Urban Development. Prior to the HUD Code, there were no guidelines for energy performance in manufactured homes. Energy standards in the HUD Code have been updated once since its inception, in 1994. By contrast, the International Energy Conservation Code (IECC), which governs site-built homes and is adopted by most states, is updated every three years. While states govern building codes for site-built homes, the HUD code is a national standard. Due to the infrequency of updates to the HUD code, manufactured homes are generally less energy efficient than site-built homes. Manufactured homes built prior to the HUD Code tend to be extremely energy inefficient and suffer from other structural shortcomings such as sagging or otherwise compromised roofs, dilapidated bellies, and moisture damage. For site-built homes, the IECC offers two paths toward compliance: prescriptive measures or a performance metric, although recent updates to the code have begun to increasingly move toward a performance-based code. Similarly, for manufactured homes, the HUD Code is an outcome-based standard with some minimum efficiency prescriptive elements, such as insulation values. Manufactured home builders must build homes that meet a defined threshold of performance, but are afforded flexibility to design homes that meet this threshold most cost effectively. The HUD Code governs only the energy efficiency of the housing structure, not that of the appliances that are installed in the home. The Department of Energy regulates the minimum efficiency of white goods, furnaces, water heaters, heat pumps, air conditioners, and other appliances.
0
100
200
300
400
500
600
700
1960 1970 1980 1990 2000 2010
Tota
l Un
its
(Th
ou
san
ds)
Total AnnualShipments
Total AnnualPlacements
AnnualPlacementsSingle Wide
AnnualPlacementsDouble Wide
1976: HUD 1994: HUD Code Updated

Mobilizing Energy Efficiency in the Manufactured Housing Sector, © ACEEE
6
To be sure, many manufactured homes today are built for higher energy performance than required by HUD Code. However, sales of inefficient, single-wide homes have increased in recent years. Market surveys have revealed homes with code-minimum insulation, poor quality windows and doors, and other construction shortcuts sold as “Super Saver” packages (Eklund et al. 2012). Such packages might appeal to homebuyers with tight budgets, who are most vulnerable to high energy costs during the summer and winter or in the event of unexpected spikes in energy prices. In response to HUD’s inaction with regard to updating energy standards in the HUD code, in 2007 Congress gave the U.S. Department in the Energy (DOE) authority through the Energy Independence and Security Act of 2007 (EISA) to establish new energy standards for manufactured housing. EISA required that DOE issue a final rule by December 2011. As of July 2012, only an Advance Notice of Proposed Rulemaking has been issued, which was released on February 22, 2010. The next step, a proposed rule, has been sent from DOE to the Office of Management and Budget (OMB), which must approve it before it is released to the public. We expect this release before the end of 2012. EISA instructs DOE that “[t]he energy conservation standards established under this section shall be based on the most recent version of the International Energy Conservation Code (including supplements), except in cases in which the Secretary finds that the code is not cost effective, or a more stringent standard would be more cost effective, based on the impact of the code on the purchase price of manufactured housing and on total life-cycle construction and operating costs” (Pub. Law 110-140). At the time that the proposed rule was sent to OMB, the 2009 IECC was the most recent version, although the 2012 IECC is now released. It is not currently known whether DOE will base the final rule on the 2009 or 2012 IECC. EISA also instructs DOE to base the standard on the climate zones established by HUD rather than those in the IECC and permits DOE flexibility to consider the differences between building homes in a factory and building them on site. Finally, DOE may deviate from IECC in instances in which “alternative practices [would] result in net estimated energy consumption equal to or less than [IECC]” (Pub. Law 110-140). Manufactured Housing Placements Manufactured homes are commonly associated with trailer parks, but manufactured housing communities contain only 26 percent of installations. The rest of manufactured homes are installed on private property (Census 2012a). Communities provide the benefits of infrastructure such as access to utilities and sewer systems without the capital required to purchase and develop land. However, lease costs can be very high, sometimes reaching $650 per month and exceeding mortgage costs for landownership (Salzberg et al. 2012). Additionally, tenants in parks lack the rights to their land, and it’s not uncommon for park owners to sell the property, forcing lessees to relocate. In addition to the disruption, moving a manufactured home can be expensive and cause structural damage to the home during transport. Transportation and installation are not regulated by HUD Code. Installation standards are regulated by some states and municipalities, while others refer installers to manufactured home buyer’s manuals. As a result, there is little oversight of the installation process and qualified installers may be hard to find. Though data is limited, there is good reason to believe that improper transportation and installation procedures can have an adverse effect on the structural integrity and energy performance of manufactured homes.
Mobilizing Energy Efficiency in the Manufactured Housing Sector, © ACEEE
7
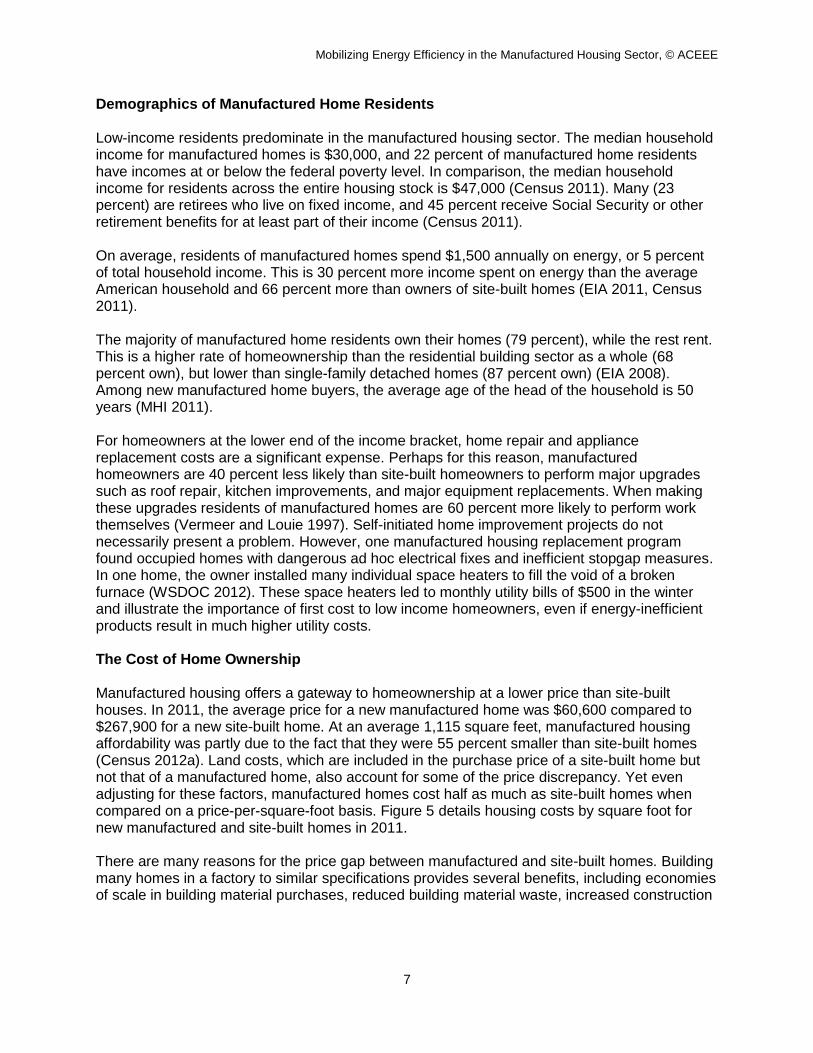
Demographics of Manufactured Home Residents Low-income residents predominate in the manufactured housing sector. The median household income for manufactured homes is $30,000, and 22 percent of manufactured home residents have incomes at or below the federal poverty level. In comparison, the median household income for residents across the entire housing stock is $47,000 (Census 2011). Many (23 percent) are retirees who live on fixed income, and 45 percent receive Social Security or other retirement benefits for at least part of their income (Census 2011). On average, residents of manufactured homes spend $1,500 annually on energy, or 5 percent of total household income. This is 30 percent more income spent on energy than the average American household and 66 percent more than owners of site-built homes (EIA 2011, Census 2011). The majority of manufactured home residents own their homes (79 percent), while the rest rent. This is a higher rate of homeownership than the residential building sector as a whole (68 percent own), but lower than single-family detached homes (87 percent own) (EIA 2008). Among new manufactured home buyers, the average age of the head of the household is 50 years (MHI 2011). For homeowners at the lower end of the income bracket, home repair and appliance replacement costs are a significant expense. Perhaps for this reason, manufactured homeowners are 40 percent less likely than site-built homeowners to perform major upgrades such as roof repair, kitchen improvements, and major equipment replacements. When making these upgrades residents of manufactured homes are 60 percent more likely to perform work themselves (Vermeer and Louie 1997). Self-initiated home improvement projects do not necessarily present a problem. However, one manufactured housing replacement program found occupied homes with dangerous ad hoc electrical fixes and inefficient stopgap measures. In one home, the owner installed many individual space heaters to fill the void of a broken furnace (WSDOC 2012). These space heaters led to monthly utility bills of $500 in the winter and illustrate the importance of first cost to low income homeowners, even if energy-inefficient products result in much higher utility costs. The Cost of Home Ownership Manufactured housing offers a gateway to homeownership at a lower price than site-built houses. In 2011, the average price for a new manufactured home was $60,600 compared to $267,900 for a new site-built home. At an average 1,115 square feet, manufactured housing affordability was partly due to the fact that they were 55 percent smaller than site-built homes (Census 2012a). Land costs, which are included in the purchase price of a site-built home but not that of a manufactured home, also account for some of the price discrepancy. Yet even adjusting for these factors, manufactured homes cost half as much as site-built homes when compared on a price-per-square-foot basis. Figure 5 details housing costs by square foot for new manufactured and site-built homes in 2011. There are many reasons for the price gap between manufactured and site-built homes. Building many homes in a factory to similar specifications provides several benefits, including economies of scale in building material purchases, reduced building material waste, increased construction

Mobilizing Energy Efficiency in the Manufactured Housing Sector, © ACEEE
8
efficiency from divisions of labor, and learned experience through repetition.3 In theory, these advantages should also make it easier to incorporate improvements to building construction, once the factory has adjusted to new practices and materials. Outdated energy standards in the HUD Code also lead to reduced purchase costs. Because site-built home buyers are typically higher income, site-built homes include greater amenities and more expensive finishes than manufactured homes, although manufactured homes sometimes include popular accoutrements such as marble countertops. Finally, home builders working in a factory do not have to contend with unpredictable and destructive weather that can delay construction time and increase costs.
Figure 5: Comparison of Housing Costs for New Manufactured and Site-Built Homes in 2011
Source: Census 2012a
Financing a Manufactured Home Even though most manufactured homes are located on private land, the vast majority (74 percent) of manufactured homes are financed with personal property loans, often called “chattel” loans, while only 22 percent are titled as real estate (Census 2011). Although manufactured homes are usually installed on private land, homes are typically financed separately from the land (Vermeer and Louie 1997). The chattel mortgage system has far-reaching ramifications for the industry. Personal property loans carry higher interest rates and shorter amortization schedules. Historically, a typical mortgage rate is about 7 percent interest over 30 years, although interest rates at present (mid-2012) are usually much lower, while a typical chattel mortgage rate is 15 percent over 15 years. As a result, relatively small increases in purchase price can lead to significant increases in loan payments. For low- and fixed-income home buyers, this can make the difference between buying a minimum efficiency and an ENERGY STAR-labeled manufactured house.
3 Large-scale site-built home builders can also capitalize on economies of scale, while custom firms will pay a premium for building materials and appliances.
$-
$10.00
$20.00
$30.00
$40.00
$50.00
$60.00
$70.00
$80.00
$90.00
Single Wide Double Wide All ManufacturedHomes
Site-Built Homes
Avg. Price: $40,600 Avg. Sq. Ft.: 1,115 Cost Per Sq. Ft.: $36.41
Avg. Price: $74,200 Avg. Sq. Ft.: 1,715 Cost Per Sq. Ft.: $43.27
Avg. Price: $60,600 Avg. Sq. Ft.: 1,470 Cost Per Sq. Ft.: $41.22
Avg. Price: $267,900 Avg. Land Price: $59,950 Avg. Sq. Ft.: 2,494 Cost Per Sq. Ft.: $83.38*
*Excluding land cost. Land cost is derived by US Census Bureau.

Mobilizing Energy Efficiency in the Manufactured Housing Sector, © ACEEE
9
A study conducted by researchers in Washington State found that interest rates can have a market impact on the cost-effectiveness of an energy efficiency upgrade. The study evaluated three high-efficiency new construction scenarios and three hypothetical mortgage terms. With mortgage rates of either 0 percent interest over 30 years or 7 percent interest over 30 years, new energy-efficient manufactured homes with incremental costs ranging from $2,500 to $10,000 that save 30-50 percent of energy use relative to current the HUD Code, resulted in a net positive monthly cash flow. With 15 percent interest over 15 years, a home that would meet the 2012 IECC energy code (~30 percent savings relative to current HUD code) would provide a small net positive monthly cash flow, but scenarios with energy savings beyond the 2012 IECC resulted in negative monthly cash flows (Salzberg et al. 2012). This study reveals two important findings. First, while higher sticker prices can dissuade homebuyers from selecting efficient manufactured homes, they may well realize net savings immediately.4 Manufactured home dealers could capitalize on this finding immediately and encourage prospective homebuyers to consider ENERGY STAR-rated homes, which feature energy performance on par with the 2012 IECC code used in the study. Second, the chattel mortgage system will likely prove a significant obstacle to purchasing very high performance homes. While the most motivated home buyers may still chose to invest in high-efficiency manufactured homes, upfront costs will likely dissuade the average customer, particularly under the present (2012) economic conditions. We note that manufacturers and retailers can narrow the price gap between low and high efficiency homes by defaulting to high-efficiency building techniques and appliances. By maximizing economies of scale and building experience with energy-efficient construction techniques, incremental costs will decline. Manufactured Homes Sales: The Boom of the 1990s and Bust of Aughts In the early-to-mid 1990s, loans were plentiful and manufactured home sales reached over 350,000 units annually for the first time in 30 years (Census 2012a). Not only did sales volume increase, but homebuyers flocked to larger, more expensive double-wides, which eclipsed sales of single-wides for the first time. What happened next might sound like déjà vu to those familiar with the site-built housing crash in the late 2000s: manufactured housing retailers and financial institutions stoked sales by offering loans to prospective homebuyers with subpar credit and little money down, then repackaged the loans as securities and sold them to investors. In the late 1990s when homebuyers defaulted on their loans, the securities tanked, a glut of used homes entered the market, and the market for new homes plummeted (Berenson 2001). Manufactured housing sales have not yet recovered, although at least one industry expert predicts that annual sales will rebound to about 160,000 units by 2016 (Grissom 2012). Due to the current slump in the site-built housing market, manufactured homes comprised 10 percent of all home sales in 2010, despite lagging sales. Figure 6 details national shipments of manufactured homes relative to construction starts for site-built housing. The site-built housing statistics include all housing units, not just the number of buildings, which allows for a direct comparison between the total numbers of dwellings attributable to each type of housing, including those in multifamily buildings. Note that although manufactured housing shipments began to decline six years before site-built construction starts, the average sales price continued to rise in accordance for site-built homes. When site-built home prices slipped in
4 This study evaluated cost effectiveness relative to the climate in the Pacific Northwest. As a result, modeled heating loads exceed those of average manufactured homes, but cooling loads are lower. Due to these off-setting differences, and the fact that electricity costs in the Northwest are below the national average, we think that this study still offers a valuable insight into national cost effectiveness despite its limited geographical scope.

Mobilizing Energy Efficiency in the Manufactured Housing Sector, © ACEEE
10
2007, so did manufactured housing prices. These data suggest that the price of manufactured homes follows the market for site-built homes and the overall strength of the economy. Figure 6: Comparison of Sales and Sale Prices of Manufactured and Site-Built Homes
Source: Census 2012a
Energy and Manufactured Homes The Fuel Mix in Manufactured Homes Electricity is the most common fuel source in manufactured homes. Nearly half (47 percent) of homes are run entirely on electricity. Another 48 percent use some natural gas (primarily for space heating), 4 percent use fuel oil, 4 percent use another liquid fuel, and 2 percent use some wood for heating. While nearly half of manufactured homes have access to natural gas, it comprises only 23 percent of energy consumption. 53 percent of manufactured homes use electricity as the main heat source, 61 percent cook with electricity, 73 percent heat water with electricity, 74 percent use electricity for clothes drying, and 62 percent have a central air conditioner (EIA 2008). Significantly, it’s not uncommon for homes with access to natural gas to have electric water heaters simply because they are cheaper (Salzberg et al. 2012). These electric appliances tend to be of low efficiency, which presents a large opportunity for utility- and government-sponsored incentive programs to encourage greater adoption of energy-efficient equipment. Electricity and liquefied petroleum gas comprise a larger percentage of total use in manufactured homes than single-family detached site-built homes. Manufactured homes use
$-
$50,000
$100,000
$150,000
$200,000
$250,000
$300,000
$350,000
-
300
600
900
1,200
1,500
1,800
2,100
1995 2000 2005 2010
Ne
w H
om
e C
on
stru
ctio
n (
Tho
usa
nd
s)
Site-Built HomeStarts(Thousands)
ManufacturedHome Shipments(Thousands)
Average SalesPrice Site-BuiltHome (Dollars)
Average SalesPriceManufacturedHome (Dollars)
1999: Manufactured home sales start to decline
2006: Site-built housing collapse begins

Mobilizing Energy Efficiency in the Manufactured Housing Sector, © ACEEE
11
more than twice as much electricity5 as natural gas (54 percent compared to 23 percent), while single-family site-built homes use slightly more natural gas than electricity (43 percent compare to thirty-nine percent) (EIA 2008). The large percentage of electricity use is partially attributable to the concentration of manufactured homes in the south, where electricity accounts for 61 percent of total energy use across all residential buildings (EIA 2008). Manufactured homes are also concentrated in rural areas that often lack access to piped natural gas. The tendency toward electricity and LPG in manufactured homes is also noteworthy because these fuels are more expensive than piped natural gas, resulting in higher utility bills.
Figure 7: National Fuel Mix in Manufactured and Single-Family Detached Homes: Total Consumption
Source: EIA (2005)
Energy Consumption in Manufactured Homes On average, manufactured homes use 11,787 kWh of electricity. Homes that use natural gas consume an average of 69.1 MMbtu, primarily for space heating. End-use consumption in manufactured homes is divided in similar proportions to that of site-built homes: space heating and cooling consume the lion’s share of energy, followed by water heating, lighting, and other appliances. Space cooling loads are a bit higher in manufactured homes than site-built homes, likely because of the concentration of manufactured homes in the southern United States. As in site-built housing, televisions, set-top boxes, computers, and related electronic equipment comprise a growing percentage of total household electricity use, at nearly 6 percent of total consumption in 2011 (EIA 2012). Figures 8 and 9 detail energy consumption in U.S. homes by end-use.
5 Electricity consumption based on site use.
0.00%
10.00%
20.00%
30.00%
40.00%
50.00%
60.00%
70.00%
80.00%
90.00%
100.00%
Manufactured Homes Single-FamilyDetached Homes
Wood
Liquified Petroleum Gas
Kerosene
Fuel Oil
Natural Gas
Electricity (Site)

Mobilizing Energy Efficiency in the Manufactured Housing Sector, © ACEEE
12
Figure 8: Average Manufactured Home Energy Figure 9: Average Site-Built Home Energy Consumption by End-Use Energy Consumption by End -Use (Single-Family Detached) 70.4 MMbtu/Year (All Fuels) 108.4 MMbtu/Year (All Fuels)
Source: EIA (2005)
Per capita, manufactured homes use an average of 35 percent less energy than detached single-family homes. However, after accounting for their smaller size, residents of manufactured homes spend nearly twice as much on energy per square foot of home ($1.38/s.f. each year vs. $0.74/s.f. for site-built) (EIA 2008). These disproportionate energy costs are particularly notable given that many residents of manufactured homes have lower incomes than residents of site-built homes. In extreme climates and during summer and winter utility peak periods, utility bills for residents of manufactured homes can reach $500 or more, which comprises a majority of income for some residents (Frontier 2012).
Energy Efficiency Program Experience in Manufactured Homes Energy efficiency programs targeting the manufactured housing sector have generally fallen into three categories: weatherization, home replacement, and incentives for high-efficiency new construction. Weatherization and home replacement programs target low-income homeowners living in energy-inefficient homes. Weatherization programs focus on retrofitting the building envelope to improve comfort and reduce energy costs for economically vulnerable residents. Programs in colder climates have also included upgrading furnaces to condensing models. Home replacement programs seek to replace homes that are too dilapidated to weatherize. Home replacement programs focus on pre-1976 manufactured homes, although other homes may also be eligible if weatherization is not cost-effective. New construction programs provide incentives to manufacturers and consumers to build and purchase high-efficiency homes, respectively. Particularly in the manufactured housing sector, these program approaches present a problem. A substantial portion of manufactured home residents do not qualify for low-income weatherization programs or home replacement programs, but lack the capital to invest in high-efficiency homes. This gap represents an “income sandwich” that not only disadvantages sandwiched residents, but also overlooks ample cost-effective energy savings potential. The
37%
13% 19%
6%
30%
Space Heating
Air-Conditioning
Water Heating
Refrigerators
OtherAppliances andLighting
41%
10% 20%
5%
27%
Space Heating
Air-Conditioning
Water Heating
Refrigerators
Other Appliancesand Lighting

Mobilizing Energy Efficiency in the Manufactured Housing Sector, © ACEEE
13
analysis of energy efficiency potential in this study seeks to quantify this largely untapped energy resource. There are currently three utilities offering ratepayer-funded programs tailored to residents of manufactured homes: Progress Energy Florida (PEF), Central Lincoln People’s Utility District (CLPUD) in Oregon, and Puget Sound Energy (PSE) in Washington. The programs offered by CLPUD and PEF have specific funding levels for manufactured homes but use the same measures as programs for site-built homes (insulation and cool roofs, respectively). PSE runs an innovative program that provides duct testing and sealing for manufactured homes at no cost to the resident. We will discuss these programs further below. High-efficiency Labeling Programs for New Construction For decades, the Northwest has led the nation in successful market transformation activities for manufactured homes. In the mid-1980’s, Bonneville Power Administration (BPA) funded a pilot project called the Residential Conservation Demonstration Program, which led to the creation of the Super Good Cents (SGC) program for electrically heated homes in 1988. Through funding provided by BPA, the state energy offices of Washington, Oregon, Idaho, and Montana offered customer incentives of $2,000-3,000 for purchases of high-efficiency homes built to Super Good Cents specifications, which were over fifty percent more efficient than 1976 HUD Code and over thirty percent more efficient than 1994 HUD Code (Eklund et al. 1996, IEE 1996). In 1992, BPA extended SGC to include upstream incentives, offering regional manufacturers $2,500 to build their homes to Super Good Cents specifications in an effort called the Manufactured Home (Resource) Acquisition Program (MAP) (Pratt and Smith 2002). MAP reduced the incentive to $1,500 after the 1994 update to the HUD Code. Even without adjusting for inflation, the incentives provided to both customers and manufacturers were high by today’s standards. These two programs were great successes, leading to widespread adoption of higher insulation, lower air infiltration, better ventilation, and high-efficiency windows, among other improved construction techniques (Eklund et al. 1996). Despite its success, MAP was discontinued in the summer of 1995 due to funding constraints. In 1995 SGC homes represented the vast majority of new manufactured home sales in the northwest (Eklund et al. 1996). Manufacturers had retooled their construction facilities to build homes meeting SGC standards and manufactured home retailers relied on the SGC label to market their homes. In order to preserve the progress made by SGC, the Oregon Department of Energy bought the rights to SGC and leveraged the popularity of the program to transition into a market-based structure in which manufacturers paid a $30 fee for each home labeled as an SGC home. Also at this juncture, the Oregon Department of Energy expanded the program to include homes heated with natural gas, under the moniker Natural Choice. Together, SGC and Natural Choice comprised the Northwest Energy Efficient Manufactured Home (NEEM) program. Unfortunately, the fee structure developed by the Oregon Department of Energy was only successful in Oregon, in which most of the regional manufacturers were located. In an effort to improve uptake in other states in the region, the Northwest Energy Efficiency Alliance (NEEA) began funding a similar fee-based program known as the Super Good Cents Venture program, which lasted from 1997 until 2001. During this five year period, market share of SGC homes began to slip, coinciding with the sales bust of the late 1990’s (Pratt and Smith 2002). Yet even at its lowest point in the 1990s, market share of NEEM homes was still over 35 percent, and in the early 2000’s when the Super Good Cents Venture program disbanded, market share had rebounded to about 70 percent. NEEM now uses ENERGY STAR as the high performance label

Mobilizing Energy Efficiency in the Manufactured Housing Sector, © ACEEE
14
for manufactured homes in the northwest. The NEEM program and its precursors demonstrated both the potential to build high performance manufactured homes and for those homes to sell. Since 1989, 68 percent of new manufactured homes in the northwest have been built to high-efficiency standards (Lubliner and Eckman 2012). ENERGY STAR In 1995 ENERGY STAR launched a program for new site-built homes, and in 1997 extended it to include manufactured homes. In order to qualify for ENERGY STAR recognition, a manufactured home builder must design the home in accordance with ENERGY STAR specifications, have it inspected in the plant after construction, and have it inspected in the field after installation according to a prescribed installation checklist. Manufacturers have the option to build homes based on set pre-qualified construction packages that are tailored to the four HUD climate zones, or use computer modeling software to design a home that meets energy performance criteria through other means. Through this latter method, a home builder could, for example, install less efficient appliances in exchange for tightening up the building envelope (EPA 2012). ENERGY STAR-labeled manufactured homes use about 30 percent less energy relative to 1994 HUD Code homes and have represented 9-10 percent of the market in the past several years (Gold and Nadel 2011). Until the end of 2011, manufactured homebuilders could receive a $1,000 tax credit in exchange for building a manufactured home that used thirty percent less energy for heating and cooling than required by the 2004 IECC or that qualified for ENERGY STAR recognition. This tax credit has not been renewed as of July 2012. Kentucky currently offers a $400 tax credit to a Kentucky taxpayer who sells an ENERGY STAR-qualified manufactured home (DSIRE 2012). In South Carolina, residents who purchase an ENERGY STAR-qualified manufactured home can receive a sales tax credit up to $300 and a personal tax credit up to $750 (DSIRE 2012). Additionally, many utility companies and cooperatives, predominantly those located in the northwest and southeast, offer financial incentives to consumers who purchase ENERGY STAR-qualified manufactured homes. These incentives can range from a few hundred dollars to over one thousand dollars and may be coupled with an incentive to the sales representative who brokers the deal. Some utilities also offer incentives to consumers who purchase heat pumps for manufactured homes at the time of sale (DSIRE 2012). These incentives may either augment or supplant incentives for ENERGY STAR-labeled homes. Heat pump incentives range from about $150-$500, depending on the utility company (DSIRE 2012). Though the program has expired, North Carolina previously offered a $1,500 incentive to residents who upgraded their electric furnaces to heat pumps in homes purchased after 2003 (Eldridge et al. 2010). The NEEM program was well established in the northwest prior to creation of the ENERGY STAR program for manufactured homes. In an effort to maintain the existing demand for high-efficiency homes created by NEEM and avoid the burden of competing program criteria for homebuilders, NEEM partners worked with ENERGY STAR to develop a co-branding strategy that was implemented in 2001. Under this program, ENERGY STAR serves as the brand and NEEM serves as the program administrator in the northwest. Since then, market share of NEEM/ENERGY STAR-qualified manufactured homes in the northwest has been as high as 80 percent, and is currently about 50 percent (Lubliner and Eckman 2012). Market emphasis on low purchase price has likely driven the recent decline in sales of NEEM homes (Eklund et al. 2012). Heat pump programs take advantage of the fact that homes are typically shipped with the furnace installed “heat pump ready,” so this appliance decision can be made at the point of sale.
Mobilizing Energy Efficiency in the Manufactured Housing Sector, © ACEEE
15
Heat pump ready construction requires that the closet housing the furnace is sized to adequately contain the “A-frame” condenser unit of the heat pump and that a two-stage (heat pump applicable) thermostat is installed at the plant. The heat pump’s “A-frame” condenser unit, outdoor compressor cabinet and appropriate connections are added when the home is sold and sited (Duncan 2012). Building America Building America is a research and development program sponsored by the Department of Energy and designed to demonstrate the potential to build housing with very high energy performance. The program is comprised of ten competitively-selected teams led by and including members from building science researchers in both the public and private sectors. Among these teams, the Advanced Integrated Energy Solutions group (ARIES) and the Building America Partnership for Improved Residential Construction (BA-PIRC) include work targeting the manufactured housing industry. The Manufactured Housing Institute (MHI) is a member of the ARIES team, whose goal is to “[a]ccelerate the development and commercialization of innovative and cost-effective approaches for dramatically reducing energy use of the nation's affordable housing, both existing and new (DOE 2012a).” The BA-PIRC team grew out of another team, the Building American Industrialized Housing Partnership (BAIHP), which concentrated entirely on researching the potential for improvements to the manufactured and modular housing sectors. Previous work has included demonstrating the potential to reach deep energy reductions in retrofits and build net-zero manufactured homes. Building America’s work is particularly significant because teams have the flexibility to undertake projects that go beyond cost-effective measures and demonstrate very high energy performance. Case studies produced by Building America teams serve as the beginning of the market transformation lifecycle curve (see “Innovators” in Figure 10), demonstrating energy saving potential, from which utility- and government-sponsored energy efficiency programs can select emerging technologies and practices for incorporation in mainstream programs. Ideally, these technologies and practices will eventually gain market acceptance and become mainstream.

Mobilizing Energy Efficiency in the Manufactured Housing Sector, © ACEEE
16
Figure 10: Lifecycle of Market Transformation6
Weatherization The Weatherization Assistance Program (WAP) is a DOE-sponsored national retrofit program for low income households created by the Energy Conservation and Production Act of 1976 (DOE 2012b). Through WAP, DOE distributes funds to states, who administer programs locally via their internal networks of contractors, non-profits, municipalities, and more. WAP retrofit projects implement cost-effective measures to improve both the building envelope and equipment systems. WAP projects for manufactured housing have tended to focus on ceiling, wall and belly insulation, air sealing, and duct sealing. These measures are most often cost-effective and provide substantial energy savings while improving indoor comfort and air quality. Appliances are rarely upgraded through WAP, although weatherization teams will inspect furnaces and air conditioners, cleaning or replacing the air filters if needed. If an appliance poses a safety hazard, such as a leaking water heater, this can also be replaced through weatherization funds (Opp 2012). Federal appropriations for WAP have fallen in recent years from a 2009 peak of $450 million down to $68 million for FY 2012. This is the lowest funding level since 1978, shortly after the program’s inception (Gaston 2012). Additional WAP funding may also come from the Low Income Home Energy Assistance Program (LIHEAP) and state and utility programs, although LIHEAP has also received budget cuts in recent years. Over the past several years, the American Recovery and Reinvestment Act (ARRA) provided an additional $4.98 billion for WAP activities, resulting in over 600,000 retrofits through the end of 2011 and exceeding program goals. Though originally scheduled to expire in March 2012, WAP is authorized to use ARRA funds until depleted.
6 ET = emerging technology, EE = energy efficiency
Mobilizing Energy Efficiency in the Manufactured Housing Sector, © ACEEE
17
Federal WAP appropriations are apportioned to states by both a base allocation and an additional allocation derived from the state’s low income population, climate, and energy expenditures per capita among low income households (DOE 2012b). Gross spending, spending per capita, and energy savings achieved in the manufactured housing sector varies by state. In North Carolina, about 30 percent of all WAP funds are allocated to manufactured homes, resulting in about 20 percent energy savings from an average investment of $3,000 (Eldridge et al. 2010). Utility Ratepayer Funded Programs Residents of manufactured homes are eligible for standard utility incentives to upgrade appliances and retrofit homes. Yet participation rates for manufactured home residents are unknown. Based on data regarding the frequency of home repairs and major appliance upgrades, we expect that participation rates are lower than among residents of site-built homes (Vermeer and Louie 1997). We know of only three utility programs that tailor incentive programs to manufactured homes. Progress Energy Florida (PEF) offers a $40 flat rate incentive to residents of manufactured homes who install a reflective roof coating. This compares to $0.15/sq. ft. (up to a maximum of $150) to residents of site-built homes. Other relevant incentives available to all residential customers include: covering 50% of $60 duct test and up to $150 for costs of duct repair; $75 for attic insulation plus $0.07/sq. ft. for every square foot of living space above 1,500 sq. ft.; up to $350 for purchase of a new heat pump; up to $250 for new windows and 50% of cost up to $100 for solar window screens or window film; and $0.20/sq. ft. up to $300 for wall insulation (DSIRE 2012). Central Lincoln People’s Utility District (CLPUD) in Oregon offers $0.18-0.20/sq. ft. up to 70 percent of the total project cost for attic and floor insulation improvements in manufactured homes, compared to $0.40-0.70/sq. ft. for site built homes. CLPUD also offers $750 for the purchase of a new ENERGY STAR-compliant manufactured home and incentives for ENERGY STAR appliances, windows, and lighting. Finally, CLPUD offers $500-1,400 for purchases of ductless heat pumps (DSIRE 2012). Puget Sound Energy (PSE) in Washington runs a unique program that provides duct testing and sealing for manufactured homes at no cost to the resident. The program offers three-levels of duct sealing based on home size and HVAC system architecture (number of vents, presence of crossover vent, etc.). Based on a 20-year measure lifetime and deemed savings averaging 800 kWh/year for a home in a moderate climate zone, both derived by the Northwest Power and Conservation Council Regional Technical Forum, PSE spends an average of $375 per home (NWPCC 2012). In an effort to maximize market penetration and reduce program costs, PSE program administrators have worked with managers of mobile home parks in order to conduct work on an entire community at one time (working on many homes in one location lowers project costs by decreasing travel time for work crews). Through this method, PSE tests and seals ducts in approximately 400 homes per month (Dodson 2012). Now in its fifth year, the program has been such a remarkable success that PSE is expanding the program’s reach. While the program has predominantly served electricity customers, it has recently expanded to include some gas customer as well (Dodson 2012). Market penetration in mobile home communities is so high that program administrators must also look beyond parks. In addition to duct sealing, work crews survey lighting and shower fixtures. PSE provides an

Mobilizing Energy Efficiency in the Manufactured Housing Sector, © ACEEE
18
average of 1-2 efficient showerheads and 18-20 compact fluorescent light bulbs to customers with inefficient fixtures and lighting, again at no cost to the resident (Dodson 2012). Home Replacement While there are no permanent programs in the U.S. devoted to manufactured home replacement, a number of pilot programs have either been administered or are currently being administered in various regions of the country, including in Maine, Montana, Tennessee, and Washington. Qualifications for participation vary, but generally require that participants fall below a certain income threshold and live in a home suffering from significant degradation that prohibits cost-effective weatherization. Programs target residents of homes built prior to 1976 but may accept applicants with homes built later if the home’s condition is very poor (some programs limit eligibility to pre-HUD Code homes). All pilot programs require replacing existing homes with an ENERGY STAR-labeled home. To assist buyers, home replacement programs provide low or no interest loans that may be forgivable after a predetermined period of time (WSDOC 2012, MaineHousing 2012). Even with a zero percent interest loan, program experience has shown that the mortgage costs for a new ENERGY STAR home can be a significant hurdle for prospective home buyers, including those with very high energy costs (WSDOC 2012). While field data detailing energy savings from these programs are unavailable, modeled energy savings suggest that participants can realize a net monthly savings of $25-40 when accounting for the cost of the mortgage with an interest rate of 0 percent or 7 percent over 30 years (Salzberg et al. 2012). Over the lifetime of the home, this could add up to over $10,000 in savings.7 Compared to weatherization programs, home replacement programs serve relatively few households on account of high program costs. Excluding administrative costs, purchasing and installing a new ENERGY STAR manufactured home can cost around $60,000 relative to several thousand dollars for weatherization (WSDOC 2012). While loan costs may be recouped, home replacement programs will still cost more per participant than weatherization programs. At the same time, energy savings are also much larger in replacement programs, and a new home will provide greater amenity to the resident over a longer period of time.
The Potential for Energy Efficiency Improvements in Manufactured Homes8 To assess the potential for energy efficiency savings in manufactured homes, we first developed a baseline projection for energy consumption by end use sector for the 20-year period, 2011 through 2030. We apportioned the projection for total energy consumption in the residential buildings sector from the EIA Annual Energy Outlook 2012 to manufactured housing based on current energy consumption by fuel for the manufactured housing sector as reported by RECS 2005 (EIA 2008, 2012). We adjusted annual energy growth rates from AEO 2012 according to
7 Assumes 30-year lifetime. 8 This analysis is not intended as a prescriptive suite of measures for program implementation. Rather, it
aims to capture the overall potential for energy efficiency improvements with a wide net. Programs directed at manufactured housing may choose to focus on HVAC load and equipment measures because these offer the greatest energy savings potential while improving the comfort of residents’ homes. Still, capturing the cost-effective measures across end use sectors serves to highlight the significant potential for energy efficiency that exists in manufactured homes.
Mobilizing Energy Efficiency in the Manufactured Housing Sector, © ACEEE
19
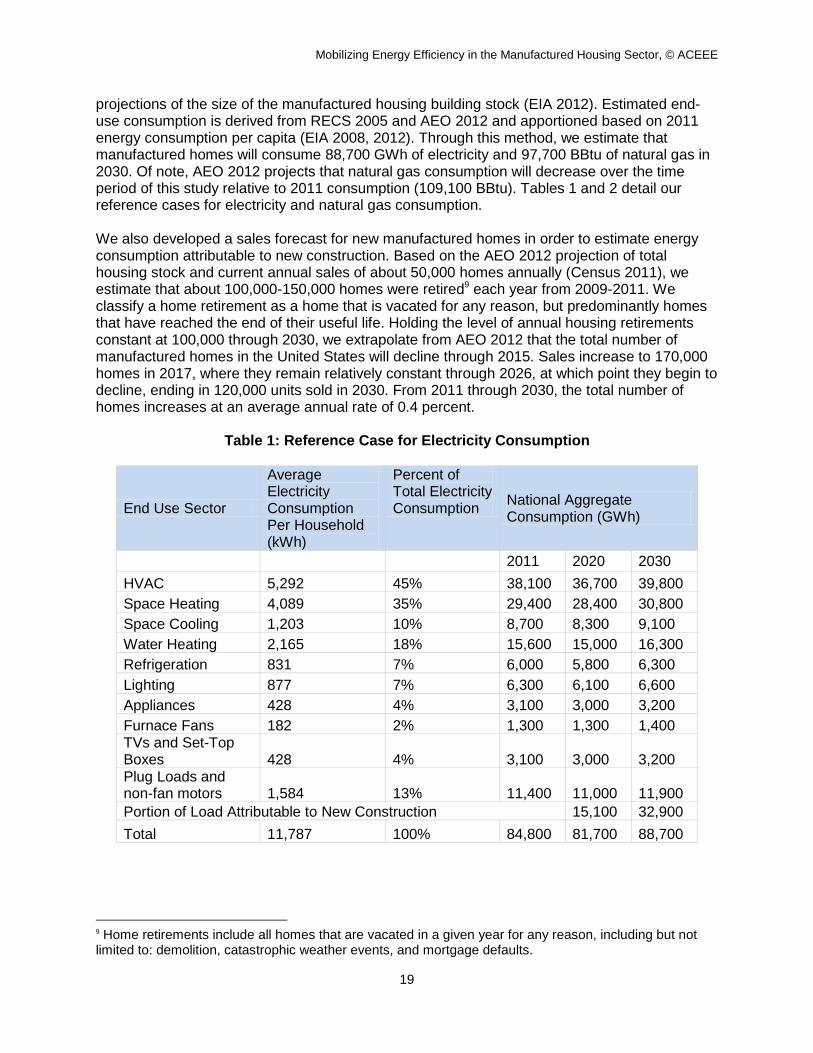
projections of the size of the manufactured housing building stock (EIA 2012). Estimated end-use consumption is derived from RECS 2005 and AEO 2012 and apportioned based on 2011 energy consumption per capita (EIA 2008, 2012). Through this method, we estimate that manufactured homes will consume 88,700 GWh of electricity and 97,700 BBtu of natural gas in 2030. Of note, AEO 2012 projects that natural gas consumption will decrease over the time period of this study relative to 2011 consumption (109,100 BBtu). Tables 1 and 2 detail our reference cases for electricity and natural gas consumption. We also developed a sales forecast for new manufactured homes in order to estimate energy consumption attributable to new construction. Based on the AEO 2012 projection of total housing stock and current annual sales of about 50,000 homes annually (Census 2011), we estimate that about 100,000-150,000 homes were retired9 each year from 2009-2011. We classify a home retirement as a home that is vacated for any reason, but predominantly homes that have reached the end of their useful life. Holding the level of annual housing retirements constant at 100,000 through 2030, we extrapolate from AEO 2012 that the total number of manufactured homes in the United States will decline through 2015. Sales increase to 170,000 homes in 2017, where they remain relatively constant through 2026, at which point they begin to decline, ending in 120,000 units sold in 2030. From 2011 through 2030, the total number of homes increases at an average annual rate of 0.4 percent.
Table 1: Reference Case for Electricity Consumption
End Use Sector
Average Electricity Consumption Per Household (kWh)
Percent of Total Electricity Consumption
National Aggregate Consumption (GWh)
2011 2020 2030
HVAC 5,292 45% 38,100 36,700 39,800
Space Heating 4,089 35% 29,400 28,400 30,800
Space Cooling 1,203 10% 8,700 8,300 9,100
Water Heating 2,165 18% 15,600 15,000 16,300
Refrigeration 831 7% 6,000 5,800 6,300
Lighting 877 7% 6,300 6,100 6,600
Appliances 428 4% 3,100 3,000 3,200
Furnace Fans 182 2% 1,300 1,300 1,400 TVs and Set-Top Boxes 428 4% 3,100 3,000 3,200 Plug Loads and non-fan motors 1,584 13% 11,400 11,000 11,900
Portion of Load Attributable to New Construction 15,100 32,900
Total 11,787 100% 84,800 81,700 88,700
9 Home retirements include all homes that are vacated in a given year for any reason, including but not limited to: demolition, catastrophic weather events, and mortgage defaults.
Mobilizing Energy Efficiency in the Manufactured Housing Sector, © ACEEE
20
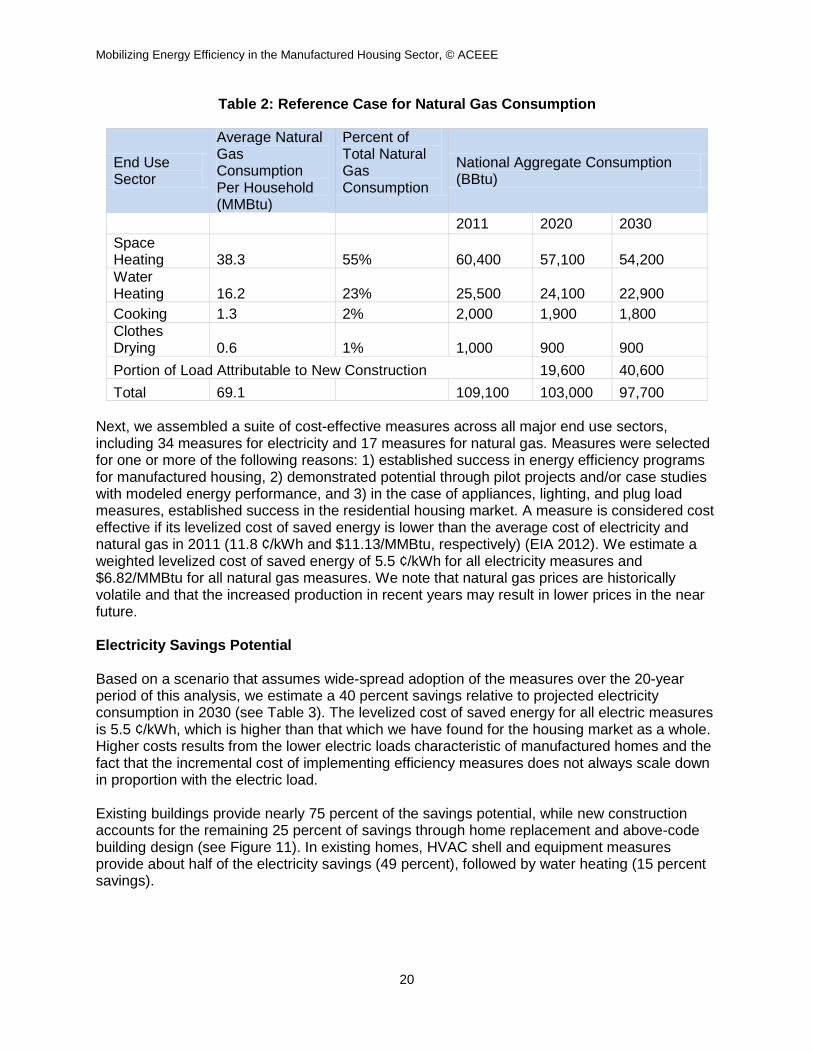
Table 2: Reference Case for Natural Gas Consumption
End Use Sector
Average Natural Gas Consumption Per Household (MMBtu)
Percent of Total Natural Gas Consumption
National Aggregate Consumption (BBtu)
2011 2020 2030
Space Heating 38.3 55% 60,400 57,100 54,200
Water Heating 16.2 23% 25,500 24,100 22,900
Cooking 1.3 2% 2,000 1,900 1,800
Clothes Drying 0.6 1% 1,000 900 900
Portion of Load Attributable to New Construction 19,600 40,600
Total 69.1 109,100 103,000 97,700 Next, we assembled a suite of cost-effective measures across all major end use sectors, including 34 measures for electricity and 17 measures for natural gas. Measures were selected for one or more of the following reasons: 1) established success in energy efficiency programs for manufactured housing, 2) demonstrated potential through pilot projects and/or case studies with modeled energy performance, and 3) in the case of appliances, lighting, and plug load measures, established success in the residential housing market. A measure is considered cost effective if its levelized cost of saved energy is lower than the average cost of electricity and natural gas in 2011 (11.8 ¢/kWh and $11.13/MMBtu, respectively) (EIA 2012). We estimate a weighted levelized cost of saved energy of 5.5 ¢/kWh for all electricity measures and $6.82/MMBtu for all natural gas measures. We note that natural gas prices are historically volatile and that the increased production in recent years may result in lower prices in the near future. Electricity Savings Potential Based on a scenario that assumes wide-spread adoption of the measures over the 20-year period of this analysis, we estimate a 40 percent savings relative to projected electricity consumption in 2030 (see Table 3). The levelized cost of saved energy for all electric measures is 5.5 ¢/kWh, which is higher than that which we have found for the housing market as a whole. Higher costs results from the lower electric loads characteristic of manufactured homes and the fact that the incremental cost of implementing efficiency measures does not always scale down in proportion with the electric load. Existing buildings provide nearly 75 percent of the savings potential, while new construction accounts for the remaining 25 percent of savings through home replacement and above-code building design (see Figure 11). In existing homes, HVAC shell and equipment measures provide about half of the electricity savings (49 percent), followed by water heating (15 percent savings).

Mobilizing Energy Efficiency in the Manufactured Housing Sector, © ACEEE
21
Table 3: 2030 Energy Efficiency Potential for Electricity
End Use Sector
Savings (GWh)
Savings (%)
% End-Use Savings
% of Efficiency Potential
Levelized Cost of Saved Energy ($/kWh Saved)
HVAC Shell 12,200 14% 31% 34% $ 0.048
HVAC Equipment 5,200 6% 13% 15% $ 0.007
Water Heating 5,500 6% 12% 15% $ 0.016
Lighting 2,100 2% 53% 6% $ (0.003)
Refrigeration 400 1% 7% 1% $ 0.016
Appliances 200 0% 5% 0% $ 0.070
Plug Loads 1,400 2% 15% 4% $ 0.023 Existing Homes Subtotal 27,000 30% 30% 75% $ 0.053
New Homes 8,800 10% 10% 25% $ 0.060 All Electricity Measures 35,900 40% 40% 100% $ 0.055

Mobilizing Energy Efficiency in the Manufactured Housing Sector, © ACEEE
22
Figure 11: Energy Efficiency Potential for Electricity by End Use Sector as a Percentage of Total Savings
Natural Gas Savings We estimate a cost-effective energy efficiency potential of 32 percent relative to projected natural gas demand in 2030 (see Table 4). We evaluated measures for four end use sectors: space heating, water heating, cooking, and clothes drying. High-efficiency ovens and clothes dryers were not cost effective in our analysis. As a result, we have omitted these measures from our analysis. The levelized cost of saved energy, $7.69/MMBtu, is higher than that which we have found in previous studies for the housing sector as a whole. As with electricity measures, this results from the fact that the incremental cost of implementation does not scale down in proportion with natural gas loads in manufactured homes relative to site-built homes. As with electricity, existing buildings comprise the majority of the natural gas savings potential (72 percent), and new construction accounts for the remainder. Space heating measures account for the greatest share of the energy efficiency potential, with 66 percent of savings. We estimate that water heating load reduction measures can save an additional 6 percent relative to consumption in the reference case.
HVAC Shell 34%
HVAC Equipment 15% Water Heating
15%
Lighting 6%
Refrigeration 1%
Appliances 0%
Plug Loads 4%
New Homes
25%

Mobilizing Energy Efficiency in the Manufactured Housing Sector, © ACEEE
23
Table 4: 2030 Energy Efficiency Potential for Natural Gas
End-use category
Savings (Bbtu)
Savings (%)
% End-Use Savings
% of Efficiency Potential
Levelized Cost of Saved Energy ($/MMbtu Saved)
Space Heating 21,100 22% 38% 66% $ 6.66
Water Heating 2,000 2% 8% 6% $ 1.79 Existing Homes 23,100 24% 24% 72% $ 6.24
New Homes 8,800 9% 9% 28% $ 8.34
All Natural Gas Measures: 31,900 33% 33% 100% $ 6.82
Building Shell Measures Building shell measures provide the largest portion of electricity and natural gas savings in our analysis. We estimate that existing homes can save 12,200 GWh of electricity and 21,100 BBtu of natural gas by 2030. Among these measures, duct sealing, air infiltration reduction, and insulation upgrades are commonly included in weatherization programs because they provide large reductions in energy consumption and improve indoor comfort. Additionally, performance contractors have found that most manufactured homes can benefit from duct sealing (using mastic as a sealant), even relatively new homes (Manclark and Davis 1996). Blown-in insulation is typically used for ceiling and belly insulation while fiberglass bats are most commonly used in walls. Due to the large number of manufactured homes located in the south with summer utility peak periods, we examined the potential for cool roofs to reduce space cooling loads. Our measure assumes a variety of cool roof materials, both dark and light colored, for which we derived an average incremental cost of $0.31/sq. ft. from Urban and Roth (2010). Experience with cool roofs has demonstrated savings of about 10% (CRCC 2012). Windows and doors, though expensive, are worth the incremental cost for a high-efficiency model when they need replacing. Aging homes may benefit from new doors as existing doors can be very leaky and offer little insulation value. Windows are often inefficient in manufactured homes, with 62 percent of homes outfitted with single pane windows (EIA 2011). For homes with intact but inefficient windows, internal storm windows can provide moderate insulation value and reduce air infiltration (LBNL 2006). HVAC Equipment We evaluated the potential for electricity savings from five space conditioning appliances: high-efficiency central air conditioners, room air conditioners, ducted heat pumps, ductless heat pumps, and ceiling fans. 54 percent of manufactured homes use central air conditioning systems to cool their homes and 32 percent use room air conditioners (EIA 2011). Of the homes with central air conditioning systems, 16 percent use heat pumps to assist with the cooling load.

Mobilizing Energy Efficiency in the Manufactured Housing Sector, © ACEEE
24
Although electric furnaces are the most common means of space heating, we did not include a measure for high-efficiency electric furnaces because efficiency is assumed to be nearly 100 percent for all units, leaving little room for energy savings. Altogether, we estimate that HVAC equipment can save 5,200 GWh relative to projected electricity consumption in 2030. Ducted heat pump systems have gained popularity in the southeast and northwest thanks in part to financial incentives offered by utilities and state energy offices (NEEM and DSIRE). Heat pumps are usually installed in new homes at the point of sale, but many homes built after the 1994 HUD Code update are also good candidates for central heat pumps. These homes still have a long life ahead of them, making the investment worthwhile. Ductless heat pumps are well established in other countries but are seldom seen in the United States. Also called mini-splits, ductless heat pumps cool and heat the entire home using one air handler, although a larger home could install more than one ductless heat pump if necessary. Ductless heat pumps make sense in manufactured homes because HVAC systems already rely on a centrally located air intake, so ductless heat pumps should not substantially affect air pressure within the home. For space heating, we included two condensing furnace measures to correspond with upcoming regional standards for space conditioning equipment. We used an efficiency level of 90 percent AFUE for southern climates and 95 percent AFUE for northern climates. Combined, we estimate that high-efficiency furnaces can save 2,400 BBtu through 2030. We screened high-efficiency furnace fans with electrically commutated motors (ECMs), but found that with the low electric loads attributable to furnace fans in manufactured homes, this measure was not cost effective. In part, the low loads are a result of the fact that manufactured homes usually do not feature return duct systems. As a result, static pressure is lower in manufactured home ductwork than in site-built homes, resulting in less power consumption by furnace fans. Our analysis was based on minimum HUD Code requirements of 0.30 external static pressure in ductwork (ESP) for space cooling. Field experience with manufactured homes suggests that ESP is higher than 0.30 in much of the country, which could make high-efficiency furnace fans cost-effective for some residents (Lubliner and Eckman 2012). Water Heating 76 percent of water heaters in manufactured homes are electric, whereas the market share of natural gas and electric water heaters in site-built homes is roughly split (EIA 2011). Nearly all electric water heaters in use are conventional electric resistance models with efficiencies around 0.90 EF. Primarily through upgrading to heat pump water heaters and reducing water heating loads through efficient fixtures, water heating presents a large opportunity for energy savings, comprising 15 percent of total electricity savings potential in our analysis. Heat pump water heaters, the only electric water heaters that qualify for ENERGY STAR recognition, account for the largest portion of water heating energy savings in our analysis. Though expensive, with incremental costs over $1,000 (Sachs et al. 2011), heat pump water heaters use about half as much energy as conventional electric models. In humid, southern climates, heat pump water heaters offer the auxiliary benefits of dehumidification and space cooling. For households without capital to invest in a heat pump water heater, 0.95 EF-rated water heaters will provide 5 percent savings with a smaller incremental cost of $100 (Talbot 2012). Many electric utilities offer financial incentives to further reduce costs. We also examined water heating load reduction measures, including high-efficiency clothes washers and dishwashers with low water consumption, efficient showerheads, and faucet

Mobilizing Energy Efficiency in the Manufactured Housing Sector, © ACEEE
25
aerators. While clothes washers and dishwashers are significant appliance purchases, showerheads and aerators have low incremental costs ($23 and $7 respectively) and are very cost-effective. Hot water load reduction measures account for 32 percent of water heating electricity savings in our analysis. Of note, our analysis of cost-effectiveness does not incorporate monetary savings from reduced water use. For homes using natural gas for water heating, we examined the potential for energy savings through load reduction (low flow showerheads and faucet aerators), pipe insulation, and hot water savings from efficient dishwashers. We screened three high-efficiency water heaters (ENERGY STAR labeled water heaters rated EF 0.67, condensing storage water heaters, and ENERGY STAR labeled tankless water heaters rated 0.82 EF), but none of them were cost-effective due to the current low natural gas prices and high product costs. This finding is consistent with recent ACEEE studies examining emerging technologies for water heating (Sachs et al. 2010, Talbot 2011). Water heating load reduction measures contribute 6 percent of the total energy efficiency potential in our natural gas analysis. Lighting In our analysis, we examined the potential for energy savings from compact fluorescent lighting (CFL). Residential lighting standards propagated by EISA 2007 mandate higher levels of energy efficiency that take effect in 2013 and 2020. Our CFL measure integrates reduced energy savings in accordance with EISA standards, using the updated standard levels as a baseline in 2013. Lighting accounts for 6 percent of total energy savings in our analysis, or 2,100 GWh. Other Electric Measures ENERGY STAR-rated appliances (refrigerators, clothes washers, dishwashers, and televisions) and plug load devices (low-power set top boxes and 1-watt standby power for consumer electronics) comprise the rest of the electricity savings in existing buildings. Combined, these measures can save 1,600 GWh, or 4% of our total projected savings. New Construction10 We examined three opportunities for energy savings in new construction: replacement of pre-1976 homes with ENERGY STAR-rated homes, purchase of ENERGY STAR-rated homes by new buyers, and purchase of homes using best practices available today. These measures account for a significant portion of the total energy savings in our potential analysis, 25 percent of the electricity potential and 28 percent of the natural gas potential. In our reference case, we calculate homes built during the period of analysis will account for over a third of all energy consumption in 2030. This substantial portion of new construction underscores the importance of improving energy codes for manufactured housing to lock in savings over the coming decades. For each of the new construction measures, we used the average annual energy consumption for all manufactured homes as a baseline for energy savings (11,787 kWh/year for electricity and 69.1 MMBtu for natural gas). We expect that these levels of energy consumption are reasonable estimates for annual energy consumption in both pre-1976 homes and modern HUD
10
Due to the current downturn in the market for manufactured homes and uncertain future sales, it is difficult to estimate energy savings for new construction. Our baseline uses the best-available data on energy consumption and sales projections. Still, there are many unknowns about where the manufactured housing market is heading, so the reader should view these energy savings projections as an estimate.

Mobilizing Energy Efficiency in the Manufactured Housing Sector, © ACEEE
26
Code-compliant homes. While pre-1976 homes are less efficient than modern homes, they are also smaller and lack some modern amenities. Likewise, newer homes are larger on average, but incorporate amenities such as central heating and cooling. For electricity, we calculated a cost of saved energy of $0.05/kWh for new ENERGY STAR-rated homes and replacement of pre-1976 homes, making them very cost-effective. For natural gas, we calculated $8.58/MMBtu and $7.79/MMBtu for new ENERGY STAR-rated homes and replacement of pre-1976 homes, respectively. While all of these measures are cost effective, first-cost is still a palpable hurdle in the manufactured housing market. Financial incentives and effective marketing of energy savings and non-energy benefits may be necessary to realize market uptake of high performance homes. For electricity, “best practices” homes are narrowly cost-effective in our analysis, but in areas of the country with high electricity costs, such as California, very high-efficiency homes can make good financial sense. Still, an incremental cost of nearly $6,000 may prove a large hurdle in the market. “Best practices” homes were not cost effective in our natural gas analysis and are therefore not included as a measure.
Recommendations for Improving Manufactured Homes Capturing the energy efficiency potential in manufactured homes will require efforts on several fronts: energy efficiency program implementation, building codes, and further research and development. The following section discusses some of the most salient opportunities, but it is not an exhaustive list. Energy Efficiency Programs WAP has served as the primary program for manufactured housing retrofits in the United States. For low-income homeowners it serves as an important avenue for improved home energy performance. We would like to see federal WAP funding return to 2009 levels to continue serving this financially vulnerable population. Our survey of utility programs found only one that offered a substantively tailored approach to reaching residents of manufactured homes, the PSE duct testing and sealing program. PSE’s program is particularly noteworthy because by offering duct sealing at no charge to the homeowner it addresses the primary barrier to increasing efficiency in manufacture homes: incremental cost. While this is an admittedly limited sample, this program’s five years of success suggest that this model could work in other areas of the country. Deemed savings used by program administrators are based on a moderate climate zone and electricity rates in the northwest are below the national average (EIA 2012). In areas of the country with more extreme climates and/or higher utility rates, duct sealing should prove even more cost-effective. We recommend that utilities in other areas of the country, particularly the south, conduct their own cost-effectiveness tests to determine whether PSE’s program model could offer cost-effective savings in their service territories. Utility incentive programs usually structure appliance rebates for equipment designed for site-built homes. Incentive levels are designed based on the total resource cost (TRC) test and utility cost test (UCT) that assume energy loads consistent with site-built homes. However, manufactured homes have lower loads and as a result, high-efficiency equipment tends to have longer payback periods. Our analysis in this paper illustrated this reduced cost-effectiveness with levelized costs of saved energy about twice as high for the manufactured housing sector as those found for the residential buildings sector as a whole.

Mobilizing Energy Efficiency in the Manufactured Housing Sector, © ACEEE
27
Addressing this reduced cost-effectiveness may require a more comprehensive cost-effectiveness test. In recent years, researchers have highlighted the shortcomings of the TRC test (Neme and Kushler 2010). Simultaneously, state public utility commissions in Vermont and California have begun to explore opportunities for including non-energy benefits (such as reduced strain on the electricity distribution system during peak hours of use) and benefits of reaching low-income residents (larger energy savings from very energy-inefficient) into energy efficiency resource cost tests (PSB 2012). Broadening the TRC UCT tests to include these and other secondary effects will strengthen the business case for energy efficiency in manufactured homes and may help pave the way toward broader program implementation and deeper savings. We recommend that utilities and utility commissions consider the unique building characteristics and energy loads of the manufactured housing sector during analysis of program cost-effectiveness. Code Development The energy efficiency requirements in DOE’s upcoming rulemaking are still unknown. However, research demonstrates that 30 percent savings above current HUD Code is both achievable and cost-effective (Salzberg et al. 2012, McGinley et al. 2004, Conner et al. 2004). During the current rulemaking, DOE should develop a set schedule for future code updates. The IECC’s schedule of every three years may not be feasible for the manufactured housing sector due to the costs associated with retooling factories to meet new standards. Nevertheless, new energy codes should be adopted more frequently than every two decades. There are currently no national guidelines for manufactured home installation. There is also insufficient data studying the impacts of transportation and installation on structural integrity and energy performance of manufactured homes. However, case studies suggest that homes can be compromised during these routine stages of a manufactured home purchase (WSDOC 2012, Eklund et al. 2012). Further research is needed to better characterize the impact of “typical” transportation and installation practices on manufactured homes. Following this study, DOE or HUD should develop “best practice” guidelines for transportation and installation of manufactured homes. These guidelines should include a checklist that is transparent, verifiable, and repeatable. Simultaneously, it may be necessary to implement a national certification program to train contractors, HUD quality assurance staff, Design Approval Primary Inspection Agency (DAPIA), In-Plant Inspection Agency (IPIA), and the Institute for Building Technology and safety (IBTS) to follow these best practices. Each of these parties represents an important part of the manufactured home design, construction, and installation process. By developing a mutual understanding of the impacts of transportation and siting on manufactured homes, these parties can work toward a harmonized effort improving industry practices. Improving the Appliance Baseline In theory, manufactured home builders should be able to incorporate ENERGY STAR-rated appliances for less than custom-designed site-built home builders. Designing many homes with similar specifications can allow manufacturers to purchase appliances in bulk at reduced costs. However, presently homes are built to order, preventing such economies of scale. While we know of no modern data quantifying the market penetration of ENERGY STAR appliances in manufactured homes, field experience suggests that ENERGY STAR appliance saturation in manufactured homes is probably low (Salzberg et al. 2012). A study from the 1990s found that appliances in manufactured homes were near minimum energy efficiency standards (Sandahl et al. 1996). In part, this results from the fact that although manufacturers must offer ENERGY
Mobilizing Energy Efficiency in the Manufactured Housing Sector, © ACEEE
28
STAR appliances in their literature in order to qualify for ENERGY STAR recognition, manufactured homes need not include ENERGY STAR appliances to achieve ENERGY STAR recognition.11 ENERGY STAR criteria for manufactured homes are based on thermal performance relative to HUD Code, not whole-home energy consumption. Market emphasis on low cost also inhibits penetration of high-efficiency equipment. In the late 1990s, an ENERGY STAR pilot program, the ENERGY STAR Program for Manufactured Homes, worked in collaboration with regional non-profit organizations in the northwest to develop strategies to increase market penetration of ENERGY STAR-rated appliances (Sandahl and Odell 1998). The program achieved some successes and identified several best practices for encouraging uptake of ENERGY STAR-rated products in the manufactured housing sector, among them (and paraphrasing):
Make the business case for ENERGY STAR appliances clear to manufactured home builders
Develop a working relationship with a leading manufacturer to demonstrate the potential to other home builders
Stress the non-energy benefits of ENERGY STAR products to consumers
Products need to have demonstrated quality and be readily available These insights and others mentioned in the paper remain relevant to today’s market. Overcoming incremental cost may prove the greatest difficulty in increasing market penetration, particularly in the present economic climate. Financial incentives targeted to manufactured homes should help increase market penetration. Additionally, the manufactured housing market has become greatly consolidated during the current market downturn. With fewer parent companies and larger appliance purchase orders, it may be possible to reduce the incremental cost of ENERGY STAR appliances. We recommend that programs work with regional and national manufacturers to increase availability of ENERGY STAR products at attractive prices whenever possible. New Construction Opportunities There are a number of homebuilding techniques and technologies that may be well suited to manufactured homes, but are not yet widely adopted. Some of these methods are established in the site-built home market but have not yet crossed over to manufactured homes. Others are emerging technologies for which manufactured homes could prove an ideal venue for testing. A recent Washington State University study detailed many opportunities for improved building construction in manufactured homes (Eklund et al. 2012). Below we expound on two particularly promising technologies. Structural Insulated Panels (SIPs) SIPs are prefabricated wall panels constructed of rigid foam sandwiched between two pieces of wood composite (see Figure 12). They have been used in small numbers of site-built homes for decades but have never been incorporated into the mainstream assembly process of manufactured homes. SIPs are more expensive than conventional frame-building techniques used in manufactured homes, but offer some notable advantages. First, SIPs provide an
11 Of note, manufacturers agreed to require inclusion of ENERG STAR-compliant dishwashers in all ENERGY STAR-labeled manufactured homes. ENERGY STAR compliance for other white goods, such as refrigerators, is not required.

Mobilizing Energy Efficiency in the Manufactured Housing Sector, © ACEEE
29
excellent insulation-to-width ratio, which allows homebuilders to maximize square footage in the living space while minimizing the home’s total footprint. Transportation regulations constrain the maximum width and length of manufactured homes, so this benefit is notable for this industry. Second, SIPs expedite the building process. With no framing to build and insulation to install, manufacturers can improve assembly efficiency. Third, because SIPs are prefabricated, they minimize the opportunity for inadvertent mistakes in the homebuilding process. Finally, SIPs reduce air infiltration relative to frame-built construction, providing a tighter home. Still, incremental costs will make SIPs a hard sell in the near-term. In addition to higher material costs, manufacturers will need to adjust their manufacturing processes. Once this transition is made, reduced manufacturing time will help offset incremental costs for materials. It is currently unknown whether a SIPs manufactured home can be cost-effective based on energy savings alone. However, there is reason to believe that the long-term benefits of SIPs warrant additional research and development. To this end, in 2000, as part of the Building America Program, Champion Enterprises built the first manufactured home to use SIPs panels in the construction process. Sadly, this was also the last manufactured home to use SIPs. During this pilot project, researchers found that the SIPs-constructed home was tighter and maintained structural integrity during transport better than conventional frame-built homes (Baechler et al. 2002, Eklund et al. 2012).
Figure 12: Structural Insulated Panel (SIP)
Image Source: Arvola Homes, Inc.
Ductless Heat Pumps Ductless heat pumps, also called ductless mini-splits, are comprised of an air handler installed on an external wall, connected to a condensing unit, like that used for a conventional heat pump (see Figure 13). Instead of distributing air throughout the home via ducts, ductless heat pumps provide all space conditioning from one area. In order to work most effectively, doors in the home need to be left open. Ductless Heat Pumps are a particularly attractive technology for manufactured homes. The majority of manufactured homes are located in the south and other relatively temperate climates where heat pumps excel (Census 2011). Ducts in manufactured homes are notoriously leaky, even in relatively new homes (Manclark and Davis 1996). Resistance electric furnaces are the most common space heating appliance in manufactured homes and they are very energy-inefficient (EIA 2011). Incorporating ductless heat pumps into building designs for manufactured homes will address both of these issues. Bypassing the need for ductwork will eliminate delivery

Mobilizing Energy Efficiency in the Manufactured Housing Sector, © ACEEE
30
losses associated with duct leakage and also reduce construction costs. Using a heat pump will increase space conditioning efficiency by roughly a factor of two. Ductless heat pumps are an emerging technology and costs are currently high, often exceeding those of ducted heat pumps (NEEA 2010). Obviating ducts will help offset some of these costs, and greater market penetration will reduce costs. Still, our analysis in this paper finds ductless heat pumps cost-effective as retrofits in today’s market. With reduced costs in new construction they will be increasingly so. There have been several case studies in the northwest evaluating the potential for ductless heat pumps to reduce space heating loads. We know of no studies examining the potential for ductless heat pumps to offset both space heating and cooling loads. Further field studies in a variety of climates will help quantify the energy efficiency potential for these systems and vet their cost effectiveness.
Figure 13: Ductless Heat Pump Installation
Image source: ductlessdepot.net
Manufactured Home Financing First cost is the largest hurdle to energy efficiency in manufactured homes. The high interest rates and short amortization periods of chattel loans not only make it difficult for manufactured home buyers to afford energy-efficient homes, they can in fact retard cost-effectiveness (Salzberg et al. 2012). For this reason, working with retailers and financial institutions to offer access to traditional mortgage rates for prospective buyers is critical. We do not have the solution to this vexatious issue. Rather, we recommend that all parties with a stake in the manufactured housing sector, including but not limited to trade associations, homeowners associations, financial institutions, regulatory bodies, and advocates from the energy efficiency community work together to try to find an equitable means of providing a more favorable mortgage structure for manufactured home buyers.
Final Thoughts There is great potential to improve the energy efficiency and comfort of manufactured homes. We hope that this study serves to highlight this potential and spurs further study into methods to capture this energy resource. There is still much work to do, but also much to be gained by improving energy performance in this sector of the housing market.

Mobilizing Energy Efficiency in the Manufactured Housing Sector, © ACEEE
31
References Baechler, Michael, Don Hadley, Ronald Sparkman, and Michael Lubliner. 2002. “Pushing the Envelope: A Case Study of Building the First Manufactured Homes Using Structural Insulated Panels.” In Proceedings of the 2002 ACEEE Summer Study on Energy in Buildings. Washington, DC: American Council for an Energy-Efficient Economy. Berenson, A. 2001. A Boom Built Upon Sand, Gone Bust. New York, NY: The New York Times Company. [Census] U.S. Census Bureau. 2012a. Manufactured Homes Survey. Washington, DC: U.S. Department of Commerce. ___. 2011. American Housing Survey for the United States: 2009. Washington, DC: U.S. Department of Commerce. Conner, Craig, Heather Dillon, Robert Lucas, Chris Early, and Michael Lubliner. 2004. “Update of Energy Efficiency Requirements for Manufactured Homes.” In Proceedings of the 2004 ACEEE Summer Study on Energy in Buildings. Washington, DC: American Council for an Energy-Efficient Economy. [DOE] U.S. Department of Energy. 2012a. Building American – Resources for Energy Efficient Homes. http://www1.eere.energy.gov/buildings/building_america/research_teams.html. Accessed June 2012. Washington, DC: U.S. Department of Energy. ___. 2012b. Weatherization and Intergovernmental Program. http://www1.eere.energy.gov/wip/wap_history.html. Accessed June 2012. Washington, DC: U.S. Department of Energy [DSIRE] Database of State Incentives for Renewables and Efficiency. 2012. http://www.dsireusa.org/. Accessed June 2012. Raleigh, N.C.: North Carolina State University. Duncan, R., Alliance to Save Energy. 2012. Personal communication. Ecotope. 2001. Baseline Characteristics of the Residential Sector. Portland. OR.: Northwest Energy Efficiency Alliance. [EIA] U.S. Energy Information Administration. 2012. Annual Energy Outlook 2012. Washington, DC: U.S. Energy Information Administration. ___. 2011. 2009 Residential Energy Consumption Survey. Washington, DC: U.S. Energy Information Administration. ___. 2008. 2005 Residential Energy Consumption Survey. Washington, DC: U.S. Energy Information Administration. ___. 2005. 2001 Residential Energy Consumption Survey. Washington, DC: U.S. Energy Information Administration.

Mobilizing Energy Efficiency in the Manufactured Housing Sector, © ACEEE
32
Eklund, Ken, Tom Hewes, Tom Lineham, and Mike Lubliner. 1996. “Manufactured Housing in the Pacific Northwest: Moving from the Region’s Largest Utility-Sponsored Market Transformation Venture to an Industry Marketing Program.” In Proceedings of the 1996 ACEEE Summer Study on Energy in Buildings. Washington, DC: American Council for an Energy-Efficient Economy. Eklund, K., Gordon, A., and Lubliner, M. 2012. Strategic Recommendations to Improve Energy Efficiency in Manufactured Housing. Olympia, Wash.: Washington State University Extension Energy Program. Eldridge, Maggie, R. Neal Elliott, and Shruti Vaidyanathan. 2010. North Carolina’s Energy Future: Electricity, Water, and Transportation Efficiency. Washington, DC: American Council for an Energy-Efficient Economy. [EPA] U.S. Environmental Protection Agency. 2012. Getting Started with ENERGY STAR Qualified Manufactured Homes. http://www.energystar.gov/index.cfm?c=bldrs_lenders_raters.pt_builder_manufactured. Accessed June 2012. Washington, DC: U.S. Environmental Protection Agency. [Frontier] Frontier Housing. 2012. How To Eliminate the Worst Housing Stock in Appalachia. Morehead, KY: Frontier Housing. Gaston, A. 2012. Cuts Made on the Back of Low-Income Americans. http://www.nascsp.org/Weatherization-News.aspx?id=41. Accessed June 2012. Washignton, DC: National Association of State Community Service Programs. Gold, R. and S. Nadel. 2011. Energy Efficiency Tax Incentives: How Have They Performed? Washington, DC: American Council for an Energy-Efficient Economy. Grissom, J., The Grissom Guides. 2012. Personal Communication. Lubliner, M. 2011. Webinar on Manufactured Housing Energy Efficiency Standards. Washington, DC: American Council for an Energy-Efficient Economy. Lubliner, M. and T. Eckman. 2012. “Revamping the Manufactured Housing Sector.” In Proceedings of the 2012 ACEEE Summer Study on Energy in Buildings. Washington, DC: American Council for an Energy-Efficient Economy. Lucas, R., Fairey, P., Garcia, R. and Lubliner, M. 2007. National Savings Potential in HUD-Code Housing from Thermal Envelope and HVAC Improvements. Atlanta, GA: American Society of Heating, Refrigerating, and Air-Conditioning Engineers. MaineHousing. 2012. Mobile Homes Replacement Program. http://www.mejp.org/Update/14-1/mobilehomes.htm. Accessed June 2012. August, ME: MaineHousing. Manclark, B., and B. Davis. 1996. Duct Improvement in the Northwest Part II: Mobile Homes. Berkeley,CA: Home Energy Magazine. McGinley, M., Jones, A., Turner, C., Chandra, S., Beal, D., and Parker, D. 2004. Optimizing Manufactured Housing Energy Use. Richardson, TX: Fourteenth Symposium on Improving Building Systems in Hot and Humid Climates.

Mobilizing Energy Efficiency in the Manufactured Housing Sector, © ACEEE
33
[MHI] Manufactured Housing Institute. 2011. Trends and Information about the Manufactured Housing Industry. Arlington,VA: Manufactured Housing Institute. Neme, C., and M. Kushler. 2010. Is It Time to Ditch the TRC? Examining Concerns with Current Practice in Benefit-Cost Analysis. Washington, DC: American Council for an Energy-Efficient Economy. Opp, R., Weatherization Assistance Program. 2012. Personal Communication. Pratt, J. and G. Smith. 2002. The Super Good Cents Manufactured Housing Venture Market Progress Evaluation Report #3. Monmouth, OR: Northwest Energy Efficiency Alliance. [PSB] State of Vermont Public Service Board. 2012. Order Re Cost-Effectiveness Screening of Heating and Process-Fuel Efficiency Measures and Modifications to State Cost-Effectiveness Screening Tool. Vermont: State of Vermont Public Service Board. Public Law 110-140. 2007. Energy Independence and Security Act of 2007. Washington, DC: U.S. Congress. Sachs, H., Talbot, J., and Kaufman, N. 2011. Emerging Hot Water Technologies and Practices for Energy Efficiency as of 2011. Washington, DC: American Council for an Energy-Efficient Economy. Salzberg, E., Lubliner, M., Howard, L., Gordon, A., and Eklund, K. 2012. Cost Implications of Retrofit vs. Replacement of Manufactured Housing. Olympia, Wash.: Washington State University Extension Energy Program. Sandahl, L. and Russell, Jim. 1996. A Unique Approach to Promoting Energy- and Resource-Efficient Home Appliances: The E-Rated Appliance Program. Richland, Wash.: Pacific Northwest National Laboratory. Sandahl, L. and T. Odell. 1998. “Northwest Manufactured Homes: A Key Market for ENERGY STAR Products.” In Proceedings of the 1998 ACEEE Summer Study on Energy in Buildings. Washington, DC: American Council for an Energy-Efficient Economy. Vermeer, K., and J. Louie. 1997. The Future of Manufactured Housing. Cambridge, MA: Joint Center for Housing Studies of Harvard University. [WSDOC] Washington State Department of Commerce. 2012. Mobile Home Replacement Program (MHRP) Pilot Project Evaluation. Olympia, WA: Washington State Department of Commerce.

Mobilizing Energy Efficiency in the Manufactured Housing Sector, © ACEEE
34
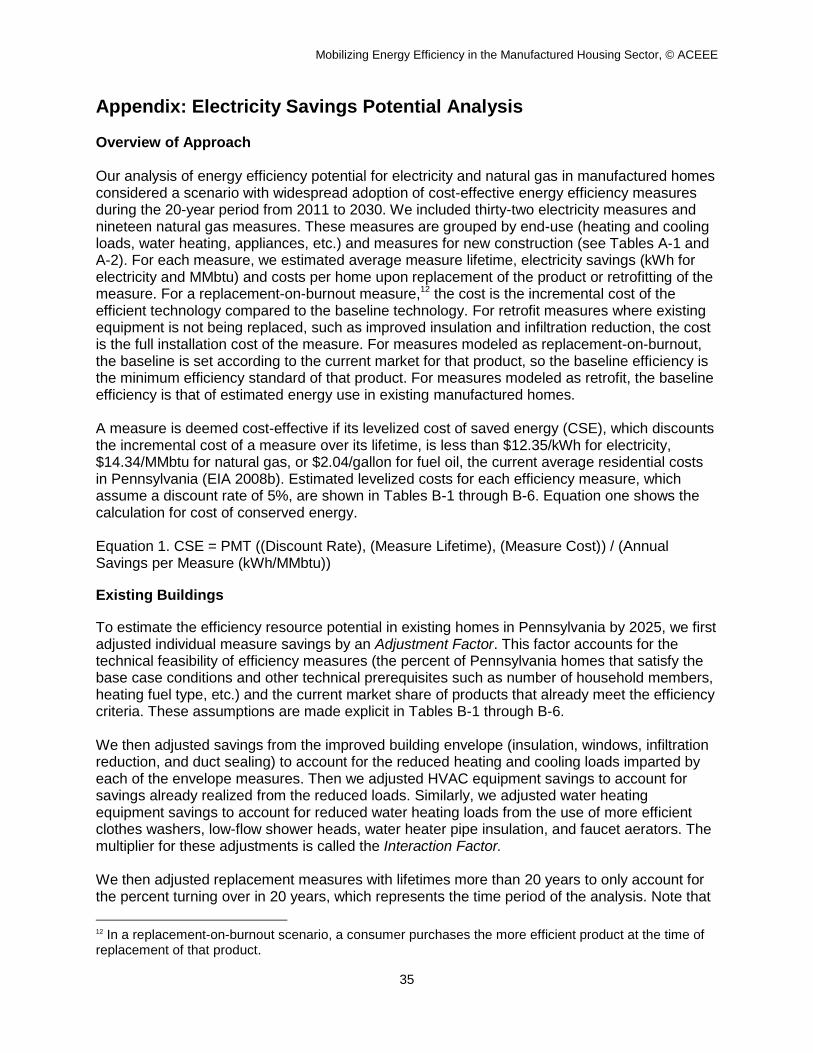
Mobilizing Energy Efficiency in the Manufactured Housing Sector, © ACEEE
35
Appendix: Electricity Savings Potential Analysis Overview of Approach Our analysis of energy efficiency potential for electricity and natural gas in manufactured homes considered a scenario with widespread adoption of cost-effective energy efficiency measures during the 20-year period from 2011 to 2030. We included thirty-two electricity measures and nineteen natural gas measures. These measures are grouped by end-use (heating and cooling loads, water heating, appliances, etc.) and measures for new construction (see Tables A-1 and A-2). For each measure, we estimated average measure lifetime, electricity savings (kWh for electricity and MMbtu) and costs per home upon replacement of the product or retrofitting of the measure. For a replacement-on-burnout measure,12 the cost is the incremental cost of the efficient technology compared to the baseline technology. For retrofit measures where existing equipment is not being replaced, such as improved insulation and infiltration reduction, the cost is the full installation cost of the measure. For measures modeled as replacement-on-burnout, the baseline is set according to the current market for that product, so the baseline efficiency is the minimum efficiency standard of that product. For measures modeled as retrofit, the baseline efficiency is that of estimated energy use in existing manufactured homes. A measure is deemed cost-effective if its levelized cost of saved energy (CSE), which discounts the incremental cost of a measure over its lifetime, is less than $12.35/kWh for electricity, $14.34/MMbtu for natural gas, or $2.04/gallon for fuel oil, the current average residential costs in Pennsylvania (EIA 2008b). Estimated levelized costs for each efficiency measure, which assume a discount rate of 5%, are shown in Tables B-1 through B-6. Equation one shows the calculation for cost of conserved energy. Equation 1. CSE = PMT ((Discount Rate), (Measure Lifetime), (Measure Cost)) / (Annual Savings per Measure (kWh/MMbtu))
Existing Buildings
To estimate the efficiency resource potential in existing homes in Pennsylvania by 2025, we first adjusted individual measure savings by an Adjustment Factor. This factor accounts for the technical feasibility of efficiency measures (the percent of Pennsylvania homes that satisfy the base case conditions and other technical prerequisites such as number of household members, heating fuel type, etc.) and the current market share of products that already meet the efficiency criteria. These assumptions are made explicit in Tables B-1 through B-6. We then adjusted savings from the improved building envelope (insulation, windows, infiltration reduction, and duct sealing) to account for the reduced heating and cooling loads imparted by each of the envelope measures. Then we adjusted HVAC equipment savings to account for savings already realized from the reduced loads. Similarly, we adjusted water heating equipment savings to account for reduced water heating loads from the use of more efficient clothes washers, low-flow shower heads, water heater pipe insulation, and faucet aerators. The multiplier for these adjustments is called the Interaction Factor. We then adjusted replacement measures with lifetimes more than 20 years to only account for the percent turning over in 20 years, which represents the time period of the analysis. Note that
12 In a replacement-on-burnout scenario, a consumer purchases the more efficient product at the time of replacement of that product.

Mobilizing Energy Efficiency in the Manufactured Housing Sector, © ACEEE
36
the multiplier, Percent Turnover, is only applicable to products being replaced upon burnout and not retrofit measures such as insulation and duct sealing and testing. These retrofit measures therefore have 100% of measures “turning over.” Equation 2 shows our calculation for efficiency resource potential, incorporating the three factors discussed above: Equation 2. Efficiency Resource Potential = ∑ (Annual Savings per Measure (kWh/MMbtu)) x (Percent Turnover) x (Adjustment Factor) x (Interaction Factor) To calculate the efficiency resource potential savings by end-use in 2030, we present the savings as a percent of end-use energy consumption (assuming current energy consumption by end-use from AEO 2012). For the non-HVAC savings, we then multiply the “percent savings” by projected residential energy consumption for that end-use in 2020 and 2030 to estimate the total savings potential in that year (see Equation 2). We assume that savings in the residential new construction sector cover projected new HVAC consumption, and therefore multiply the HVAC “percent savings” by 2011 electricity consumption of this end use. See Equation 3 for a summary of how we derive the savings estimate for existing residential buildings. Equation 3. Efficiency Resource Potential by end-use in 2030 (GWh/MMbtu) = (% End-Use Savings) x (Electricity Consumption by sector in 2030* (GWh/MMbtu)) * 2011 for HVAC New Construction We estimate savings from new construction in a similar manner as existing home measures. We looked at two levels of efficiency in new homes: 30 percent and 50 percent better than current HUD Code. 30 percent savings is attributed both to the home-replacement programs and the ENERGY STAR-rated homes measures. In estimating new home energy savings, we use a similar approach as building codes, which address HVAC consumption only. Equation 4. Efficiency Resource Potential in 2030 (GWh/MMbtu) = (% HVAC savings per home) x (Percent Applicable) x (Projected new HVAC consumption between 2011 and 2030 (GWh/MMbtu)).

Mobilizing Energy Efficiency in the Manufactured Housing Sector, © ACEEE
37
Table A-1: Electricity Measures
Existing Building Measures
End-Use Category
Annual savings per house-hold (kWh)
Cost of Saved Energy ($ /kWh)
Pass Cost-Effec-tive Test?
Adjust-ment Factor % Turnover
Adjusted savings (kWh)
Interaction Factor
% End-use Savings
Total Savings (GWh)
2020 2030 2020 2030 2020 2030 2020 2030 2020 2030
HVAC Load Reducing Measures
Seal Ductwork
HVAC (load)
503 $ 0.04 yes 52% 40% 80% 105 210 100% 100% 2.0% 4.0% 728 1,581
New Door (R5)
HVAC (load)
251 $ 0.06 yes 22% 40% 80% 22 44 98% 96% 0.4% 0.8% 150 320
Infiltration reduction
HVAC (load)
628 $ 0.08 yes 55% 40% 80% 138 276 98% 95% 2.5% 5.0% 935 1,981
Insulation, ceiling, R-11 to R-33
HVAC (load)
503 $ 0.05 yes 59% 40% 80% 118 236 95% 90% 2.1% 4.0% 778 1,601
Insulation, floor, R-11 to R-33
HVAC (load)
677 $ 0.08 yes 59% 40% 80% 159 318 95% 90% 2.9% 5.4% 1,049 2,157
Insulation, wall, R-11 to R-22
HVAC (load)
696 $ 0.10 yes 59% 40% 80% 164 327 95% 90% 2.9% 5.6% 1,078 2,217
Cool Roof HVAC (load)
271 $ 0.10 yes 57% 50% 100% 77 153 87% 73% 1.3% 2.1% 460 845
Estar Window (U-0.35) from single pane U-1.20
HVAC (load)
1,032 $ 0.04 yes 25% 33% 67% 87 174 85% 70% 1.4% 2.3% 513 920
Estar Window (U-0.35) from double pane U- 0.59
HVAC (load)
528 $ 0.01 yes 15% 33% 67% 27 54 85% 70% 0.4% 0.7% 160 287
Storm windows
HVAC (load)
423 $ 0.9 yes 14% 67% 100% 39 58 85% 70% 0.6% 0.8% 228 307
HVAC Load Reducing Measures Subtotal
3,951-4,561
17% 31% 6,080 12,217
HVAC Equipment Measures
Central AC (cooling cycle) SEER 14.5; with program-mable thermostat
HVAC (equip-ment)
1,051 $ 0.05 yes 48% 71% 100% 360 504 83% 69% 5.7% 6.6% 2,084 2,632
Efficient window air conditioner (10.8 EER)
HVAC (equip-ment)
123 $ 0.06 yes 19% 44% 100% 10 10 83% 69% 0.2% 0.2% 61 61

Mobilizing Energy Efficiency in the Manufactured Housing Sector, © ACEEE
38
Existing Building Measures
End-Use Category
Annual savings per house-hold (kWh)
Cost of Saved Energy ($ /kWh)
Pass Cost-Effec-tive Test?
Adjust-ment Factor % Turnover
Adjusted savings (kWh)
Interaction Factor
% End-use Savings
Total Savings (GWh)
Efficient window air conditioner (11.3 EER)
HVAC (equip-ment)
43 $ 0.10 yes 19% 56% 100% 5 5 83% 69% 0.1% 0.1% 26 26
Central HP; HSPF 8.2
HVAC (equip-ment)
2,513 $ 0.03 yes 9% 83% 100% 179 215 83% 69% 2.8% 2.8% 1,038 1,124
Ductless heat pump
HVAC (equip-ment)
2,010 $ 0.05 yes 6% 67% 100% 79 118 83% 69% 1.2% 1.5% 456 617
Ceiling Fan HVAC (equip-ment)
225 $ 0.07 yes 66% 100% 100% 148 148 83% 69% 2.3% 1.9% 858 775
HVAC Equipment Measures Subtotal
391- 2,737 12% 13% 4,523 5,235
TOTAL HVAC 4,951-6,688 29% 44% 10,603 17,451
Water Heating Savings
High-efficiency showerhead (2 gpm)
Water Heating 250 $ 0.01 yes 60% 100% 100% 150 150 100% 100% 6.9% 6.9%
1,040 1,129
Faucet aerators (1.5 gpm)
Water Heating 48 $ 0.02 yes 65% 100% 100% 31 31 100% 100% 1.4% 1.4% 216 235
H-axis clothes washer (2.0 MEF) (Water Heating Portion)
Water Heating 24 $ 0.10 yes 58% 45% 100% 6 6 100% 100% 0.3% 0.3% 43 43
Dishwasher (Electric WH) (Water Heating Portion)
Water Heating 200 $ 0.09 yes 58% 45% 100% 52 52 100% 100% 2.4% 2.4% 363 363
Efficient electric water heater (0.95 EF)
Water Heating 210 $ 0.05 yes 29% 77% 100% 47 61 89% 92% 1.9% 2.6% 289 421
Heat pump water heater
Water Heating 1,991 $ 0.05 yes 24% 77% 100% 365 474 89% 92% 15.0% 20.1%
2,250 3,272
Water Heating Savings Subtotal 732-2,513 28% 31% 4,202 5,464
Appliances Savings
H-axis clothes washer (2.0 MEF)
Appli-ances 24 $ 0.10 yes 58% 91% 100% 12 14 100% 100% 2.9% 3.2% 86 103
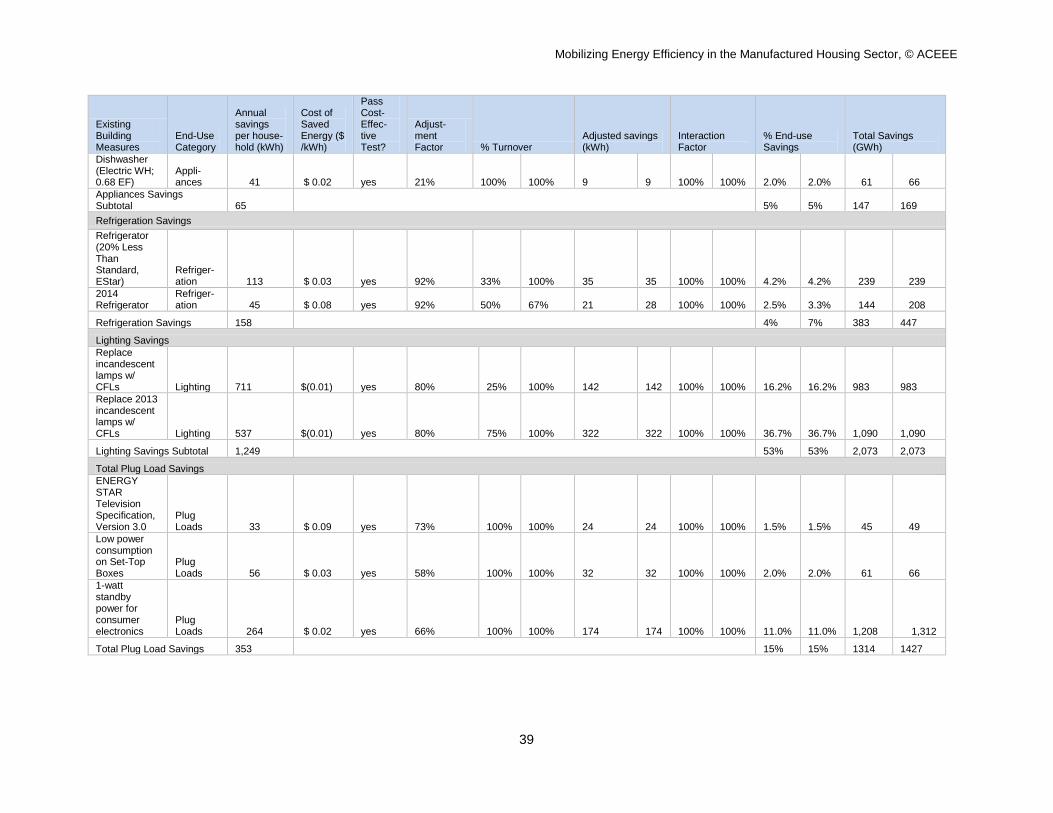
Mobilizing Energy Efficiency in the Manufactured Housing Sector, © ACEEE
39
Existing Building Measures
End-Use Category
Annual savings per house-hold (kWh)
Cost of Saved Energy ($ /kWh)
Pass Cost-Effec-tive Test?
Adjust-ment Factor % Turnover
Adjusted savings (kWh)
Interaction Factor
% End-use Savings
Total Savings (GWh)
Dishwasher (Electric WH; 0.68 EF)
Appli-ances 41 $ 0.02 yes 21% 100% 100% 9 9 100% 100% 2.0% 2.0% 61 66
Appliances Savings Subtotal 65 5% 5% 147 169
Refrigeration Savings
Refrigerator (20% Less Than Standard, EStar)
Refriger-ation 113 $ 0.03 yes 92% 33% 100% 35 35 100% 100% 4.2% 4.2% 239 239
2014 Refrigerator
Refriger-ation 45 $ 0.08 yes 92% 50% 67% 21 28 100% 100% 2.5% 3.3% 144 208
Refrigeration Savings 158 4% 7% 383 447
Lighting Savings
Replace incandescent lamps w/ CFLs Lighting 711 $(0.01) yes 80% 25% 100% 142 142 100% 100% 16.2% 16.2% 983 983
Replace 2013 incandescent lamps w/ CFLs Lighting 537 $(0.01) yes 80% 75% 100% 322 322 100% 100% 36.7% 36.7% 1,090 1,090
Lighting Savings Subtotal 1,249 53% 53% 2,073 2,073
Total Plug Load Savings
ENERGY STAR Television Specification, Version 3.0
Plug Loads 33 $ 0.09 yes 73% 100% 100% 24 24 100% 100% 1.5% 1.5% 45 49
Low power consumption on Set-Top Boxes
Plug Loads 56 $ 0.03 yes 58% 100% 100% 32 32 100% 100% 2.0% 2.0% 61 66
1-watt standby power for consumer electronics
Plug Loads 264 $ 0.02 yes 66% 100% 100% 174 174 100% 100% 11.0% 11.0%
1,208 1,312
Total Plug Load Savings 353 15% 15% 1314 1427

Mobilizing Energy Efficiency in the Manufactured Housing Sector, © ACEEE
40
Existing Building Measures
End-Use Category
Annual savings per house-hold (kWh)
Cost of Saved Energy ($ /kWh)
Pass Cost-Effec-tive Test?
Adjust-ment Factor % Turnover
Adjusted savings (kWh)
Interaction Factor
% End-use Savings
Total Savings (GWh)
New Homes
Replace pre-1976 home with 30% better than code (ENERGY STAR)
New Construction 3,536 $ 0.05 yes 22% 100% 100% 778 778 100% 100% 6.6% 6.6% 995 2,174
New home 30% better than code (ENERGY STAR)
New Construction 3,536 $ 0.05 yes 51% 100% 100%
1789
1,789 100% 100% 15.2% 15.2%
2,289 5,001
New home 50% better than code (Building America-Best Practices)
New Construction 5,894 $ 0.11 yes 10% 100% 100% 589 589 100% 100% 5.0% 5.0% 754 1,647
New Homes Subtotal 27% 27% 4038 8822

Mobilizing Energy Efficiency in the Manufactured Housing Sector, © ACEEE
41
Table A-2: Natural Gas Measures
Existing Building Measures
End-Use Category
Annual savings per household (MMbtu)
Cost of Saved Energy ($/MMBtu)
Pass Cost-Effective Test?
Adjust-ment Factor % Turnover
Adjusted savings (MMBtu)
Interaction Factor
% End-use Savings Total Savings (BBtu)
2020 2030 2020 2030 2020 2030 2020 2030 2020 2030
HVAC Load Reducing Measures
Programmable thermostat
Space Heating (load) 2.9 $ 5.06 yes 50% 80% 100% 1.1 1.4 100% 100% 3.0% 3.7% 1,704 2,020
Seal Ductwork
Space Heating (load) 4.1 $ 5.21 yes 52% 48% 80% 1.0 1.7 97% 96% 2.6% 4.3% 1,480 2,323
New Door (R5)
Space Heating (load) 2.0 $ 7.36 yes 22% 48% 80% 0.2 0.4 94% 92% 0.5% 0.9% 303 466
Infiltration reduction
Space Heating (load) 5.1 $ 10.11 yes 33% 48% 80% 0.8 1.3 94% 91% 2.0% 3.2% 1,130 1,731
Insulation, ceiling, R-11 to R-33
Space Heating (load) 4.1 $ 6.05 yes 59% 48% 80% 1.2 1.9 92% 87% 2.8% 4.4% 1,574 2,371
Insulation, floor, R-11 to R-33
Space Heating (load) 5.5 $ 9.26 yes 59% 48% 80% 1.6 2.6 92% 87% 3.7% 5.9% 2,120 3,195
Insulation, wall, R-11 to R-19
Space Heating (load) 4.1 $ 9.83 yes 59% 48% 80% 1.2 1.9 85% 76% 2.5% 3.8% 1,452 2,052
Estar Window, from single pane
Space Heating (load) 21.8 $ 1.92 yes 25% 40% 67% 2.2 3.7 81% 69% 4.6% 6.6% 2,644 3,597
Estar Window, from double pane
Space Heating (load) 4.3 $ 1.76 yes 15% 40% 67% 0.3 0.4 81% 69% 0.6% 0.8% 317 432
Storm windows
Space Heating (load) 3.4 $ 11.09 yes 14% 80% 100% 0.4 0.5 82% 71% 0.8% 0.9% 458 470
HVAC Load Reducing Measures 31.2-49.5 22% 34% 13,182 18,657
HVAC Equipment Measures
ENERGY STAR Furnace, Condensing, AFUE >= 90
Space Heating (equip) 6.1 $ 8.29 yes 38% 67% 100% 1.6 2.4 78% 66% 3.2% 4.1% 1,817 2,210
ENERGY STAR Furnace, Condensing, AFUE >= 95
Space Heating (equip) 1.5 $ 8.39 yes 16% 67% 100% 0.2 0.2 78% 66% 0.3% 0.4% 179 218

Mobilizing Energy Efficiency in the Manufactured Housing Sector, © ACEEE
42
HVAC Equipment Measures 1.5-6.1 3% 4% 1,997 2,428
TOTAL HVAC 32.6-55.7 26% 38% 15,179 21,085
Water Heating Savings
High-efficiency showerhead
Water Heating 1.6 $ 1.87 yes 50% 100% 100% 0.8 0.8 100% 100% 4.9% 4.9% 1,186 1,125
Faucet aerators
Water Heating 0.3 $ 2.97 yes 50% 100% 100% 0.2 0.2 100% 100% 0.9% 0.9% 228 216
Dishwasher (Gas WH; 0.72 EF) (water heating)
Water Heating 0.4 $ 1.84 yes 85% 100% 100% 0.3 0.3 95% 95% 1.9% 1.9% 458 434
Water Heating Savings 2.3 8% 8% 1,983 1,983
New Homes
Replace pre-1976 home with 30% better than code (ENERGY STAR)
New Construction 21 $ 7.79 yes 22% 100% 100% 4.6 4.6 100% 100% 6.6% 6.6% 1,292 2,679
New home 30% better than code (ENERGY STAR)
New Construction 21 $ 8.58 yes 51% 100% 100% 5.7 5.7 100% 100% 15.2% 15.2% 2,971 6,161
New Homes Subtotal 22% 22% 4,263 8,839

Mobilizing Energy Efficiency in the Manufactured Housing Sector, © ACEEE
43
Measure Descriptions – Electricity and Natural Gas Programmable Thermostat (natural gas only) Measure Description: Installation of a programmable thermostat to regulate indoor temperature, setback by five degrees Fahrenheit. Basecase: Home without a programmable thermostat or temperature setback. Data Explanation: Baseline consumption from RECS 2005 (EIA 2008). Savings (7%), measure life (15 yrs) and incremental cost ($150) from ACEEE 1994, adjusted for inflation. There are no documented savings for electricity from programmable thermostats, so for our study we have limited programmable thermostats to a natural gas savings measure.
Duct Sealing Measure Description: Professional duct-, plenum-, and crossover-sealing service involving testing and either hand-applied or aerosol-based mastic. Basecase: Manufactured home with a forced-air furnace and air conditioner. Data Explanation: Baseline energy use from RECS (EIA 2008) depending on primary fuel use. Savings (10%) in each season (cooling and heating) is derived from 80% reduction in duct leakage (Jump 1996), which comprises half of the 20% of total HVAC energy use that can be associated with duct-related energy losses (the other half being by conduction (Hammarlund et al. 1992; Proctor et al. 1993). A cost of $300 is derived from Salzberg 2012, assuming 60% singlewide and 40% doublewide homes. Measure life is 25 years (RTF 2012).
New Door
Measure Description: Install new door with R-5 insulation value. Basecase: Aging door with R-2.5 insulation value. Data Explanation: Baseline energy use from RECS 2005 (EIA 2008) depending on primary fuel use. Electricity savings (5%) and cost ($211.60) derived from NPCC 2008. Savings from NPCC 2008 discounted to account for national average annual energy use. Percent applicable (22%) is manufactured homes built prior to 1976 (AHS Survey). Useful life is 25 years (RTF 2012).
Infiltration Reduction
Measure Description: Application of foam and/or caulk around leakage areas applied and tested by a professional using a blower-door. Basecase: Home with higher-than average heating and cooling energy use.
Data Explanation: Baseline energy use from RECS (EIA 2008) depending on primary fuel use, plus a 25% adder representing high-use homes. Savings of 10% from MT 2004 Screening Reports. Cost ($727) derived from derived from Salzberg 2012, assuming 60% singlewide and 40%doublewide homes. Useful life of 25 years from RTF 2012. Savings applied to percentage of homes that report drafts (55%), from RECS 2005 (EIA 2008).

Mobilizing Energy Efficiency in the Manufactured Housing Sector, © ACEEE
44
Ceiling Insulation Measure Description: Add insulation in ceiling to R-33. Basecase: R-11 assumed for houses reported to be "well insulated." Data Explanation: Savings (8% for both electricity and natural gas) is an ACEEE estimate based on experience with site-built homes. Total households applicable (75%) from RECS 2005 for houses that are "adequately insulated" and houses that are "not well insulated" (EIA 2008). Baseline energy use from RECS 2005 (EIA 2008) depending on primary fuel use, plus a 25% adder representing high-use homes. Incremental cost of $0.32/sq.ft. from Conner 2004. Assumes 1087 s.f. of insulation needed. Useful measure life of 12 years from RTF 2012.
Wall Insulation (electricity only) Measure Description: Add insulation to wall cavities, R-11 to R-22 Basecase: Average-sized manufactured home built before 1994. Data Explanation: Total households applicable (75%) from RECS 2005 for houses that are "adequately insulated" and houses that are "not well insulated" (EIA 2008). Baseline energy use from RECS 2005 (EIA 2008), depending on primary fuel use, plus a 25% adder representing high-use homes. Electricity and natural gas savings of 11% based on ACEEE interpolation of data from NPCC 2008. Cost ($0.86/sq.ft,) from Conner 2004). Useful measure life of 25 years from RTF 2012.
Wall Insulation (natural gas only) Measure Description: Add insulation to wall cavities, R-11 to R-19 Basecase: Average-sized manufactured home built before 1994. Data Explanation: Total households applicable (75%) from RECS 2005 for houses that are "adequately insulated" and houses that are "not well insulated" (EIA 2008). Baseline energy use from RECS 2005 (EIA 2008), depending on primary fuel use, plus a 25% adder representing high-use homes. Electricity and natural gas savings of 8% based on ACEEE interpolation of data from NPCC 2008. Cost ($0.51/sq.ft,) from Conner 2004. Useful measure life of 25 years from RTF 2012.
Cool Roof (electricity only) Measure Description: Cool roof coating with solar reflectance index rating of at least 64. Basecase: Standard dark colored roof. Data Explanation: Baseline electricity reflects cooling load only, from RECS 2005 (EIA 2008). Savings of 10% of cooling load from CRCC 2012. Cost ($.31/s.f.) is average of costs from Urban and Roth 2010. Percent of homes applicable (77%) are the percent of households located in the southern U.S. (EIA 2011). Measure life (20 years) is from Sanchez et al. 2007.

Mobilizing Energy Efficiency in the Manufactured Housing Sector, © ACEEE
45
ENERGY STAR Windows (from single-pane) Measure Description: Window replacements with U value 0.35. Basecase: Single-pane windows with U value of 1.20. Data Explanation: Baseline energy use from RECS 2005 (EIA 2008). Savings (21%) is calculated from ratio of U-values associated with upgrading from single pane (U-value = 1.20) to U-value = .35) from Leckie et al. 1981. Incremental cost ($643.07) assumes cost of $4.93 per sq. ft. and that window area equals 12% floor area (Conner 2004). Measure life (30) from SWEEP 2002. Percent applicable (27%) is percent of homes with single pane windows built between
1976 and 1994 from RECS 2005 (EIA 2008).
ENERGY STAR Windows (from double-pane) Measure Description: Window replacements with U value 0.35. Basecase: Double-pane windows without low-e coating and U value of 0.59. Data Explanation: Baseline energy use from RECS 2005 (EIA 2008). Savings (12%) is calculated from ratio of U-values associated with upgrading from single pane (U-value = 0.59) to U-value = .35) from Leckie et al. 1981. Incremental cost ($116.09) assumes cost of $0.89 per sq. ft. and that window area equals 12% floor area (Conner 2004). Measure life (30) from SWEEP 2002. Percent applicable (17%) is percent of homes with double pane windows without low-e coating from RECS 2005 multiplied by percent of homes built between 1976 and 1994 (EIA 2008).
Storm Windows Measure Description: Interior storm windows with flexible plastic glazing (HUD 2005). Basecase: Leaky, single-pane windows with U value of 1.20. Data Explanation: Baseline energy use from RECS 2005 (EIA 2008). Savings (8%) assumes 29% reduction in HVAC load attributable to windows (LBNL 2006). Incremental cost ($500) assumes 8 storm windows at cost of $50 each (ACEEE survey of current market for storm windows 2012). Measure life (15 years) from Energetics 2010. Percent applicable (14%) is percent of homes with single-pane windows multiplied by percent of homes built between 1976 and 1994 (EIA 2008).
High-Efficiency Central Air Conditioner with programmable thermostat (cooling only, electricity only) Measure Description: SEER 14.5, 2.5 ton unit Basecase: Current federal standard: SEER 13, 2.5 ton unit Data Explanation: Baseline consumption from RECS 2005 (EIA 2008). Percent savings (25%) and incremental cost ($556) from ENERGY STAR calculator for Central Air Conditioners using Charleston, SC as a proxy. Measure life (14 yrs) from EPA 2012a. Market share (11%, assumed to be half of market share for ENERGY STAR qualified unit with SEER = 14) from

Mobilizing Energy Efficiency in the Manufactured Housing Sector, © ACEEE
46
Sanchez et al. 2008. Percent applicable (54%) equivalent to households with central AC, with and w/o heat pump (EIA 2008).
High-Efficiency Heat Pump (electricity only) Measure Description: HSPF 8.2 Basecase: Current federal standard A/C (SEER 13, 2.5 ton unit) and conventional electric furnace Data Explanation: Baseline consumption from RECS 2005 (EIA 2008). Percent savings (50%) from EnergyWise Technologies 2007. Incremental cost ($643) from EPA 2012b and ACEEE market survey, assuming heat pump replaces both air conditioner and electric furnace. Measure life (12 yrs) from EPA 2012b. Market share (13%) is homes with heat pumps from EIA 2011.
Ductless Heat Pump (electricity only) Measure Description: Ductless mini-split system Basecase: Current federal standard A/C (SEER 13, 2.5 ton unit) and conventional electric furnace Data Explanation: Baseline consumption from RECS 2005 (EIA 2008). Percent savings (40%) from Davis 2010. Incremental cost ($1,143) from EPA 2012b, ACEEE market survey, and NEEA 2010, assuming heat pump replaces both air conditioner and electric furnace. Measure life (15 yrs) from NEEA 2011.
Efficient Furnace (natural gas) Measure Description: AFUE 90% Basecase: AFUE 80% Data Explanation: Baseline consumption and incremental cost ($593) from DOE Technical Support Document (DOE 2011). Baseline assumes 80% AFUE in accordance with upcoming 2016 standard. EPA 2012c input assumes ratio of HDD from Columbia, SC. Savings (15%) and measure life (18 years) from ratio of EPA 2012c. Percent applicable equal to percent of homes in the south (56%) (EIA 2011). Market share (32%) from Sanchez et al. 2008.
Efficient Furnace (natural gas) Measure Description: AFUE 95% Basecase: AFUE 90% Data Explanation: Baseline consumption is derived AFUE 90% energy consumption using EPA 2012c with Cincinnati, OH as a proxy. Savings (6%) from ratio of EF increase (.5/.90). Measure life (18 yrs) from EPA 2012c. Incremental cost ($145) derived from DOE Technical Support Document (DOE 2011). Market share (32%) from Sanchez et al. 2008.

Mobilizing Energy Efficiency in the Manufactured Housing Sector, © ACEEE
47
Efficient Electric Storage Water Heater (electricity only) Measure Description: 40-gallon electric storage water heater, 0.94 EF. We adjust to account for the fact that more-efficient water heaters are typically cost-effective only for households with more than 3 members. Basecase: Current federal standard for typical, 40-gallon electric storage water heater, 0.90 EF Data Explanation: Baseline consumption from RECS 2005 (EIA 2008), increased by ratio (1.5) to account for greater consumption from households with 3 or more members (EIA 2011). Percent applicable (32%) equivalent to houses with electric water heaters multiplied by the number of households with 3 or more members (EIA 2011). Savings (4%) derived from EF increase. Incremental cost ($100) from Talbot 2011. Measure life (13 years) from Sachs et al. 2010. Market share (8%) estimated based on ENERGY STAR market share (Ng 2011).
Heat Pump Water Heater (electricity only) Measure Description: Either add-on or integrated heat-pump that uses the evaporation-compression cycle to extract heat from surrounding air to heat water in a conventional storage tank. COP 2.0 or above. We adjust to account for the fact that more efficient water heaters are typically cost-effective only for households with more than 3 members. Basecase: Current federal standard for typical, 40-gallon electric storage water heater, 0.90 EF Data Explanation: Baseline consumption from RECS 2005 (EIA 2008), increased by ratio (1.5) to account for greater consumption from households with 3 or more members (EIA 2011). Percent applicable (24%) equivalent to houses with electric water heaters multiplied by percent of households in the south and the number of households with 3 or more members (EIA 2011). Savings (50%) and measure life (13 years) are from Sachs et al. 2010. Incremental cost ($1,005) from Talbot 2011.
High-Efficiency Showerheads Measure Description: 2.0 gallons per minute (gpm) showerhead Basecase: Assumes electric and gas water heater meeting current federal standard (see Electric Storage Water heater above). Showerhead meets federal requirements of 2.5 gpm Data Explanation: Baseline consumption from RECS 2005 (EIA 2008). Savings (9%) from Brown et al. 1987. Cost estimate ($23) for a low-cost, basic model from the DEER database (CEC 2005). Measure life (10 yrs) from ACEEE 1994. Percent applicable (100%) is percentage of households with water heating (EIA 2011).
Faucet Aerators Measure Description: 1.5 gallons per minute (gpm) faucet aerator Basecase: Assumes electric and gas water heater meeting current federal standard (see Electric Storage Water heater above). Baseline aerator meets federal requirements of 2.5 gpm

Mobilizing Energy Efficiency in the Manufactured Housing Sector, © ACEEE
48
Data Explanation: Baseline consumption from RECS 205 (EIA 2008). Savings (2%) from Frontier Associates 2006. Cost estimate ($7) for a low-cost, basic model from the DEER database (CEC 2005). Measure life (10 yrs) from ACEEE 1994. Percent applicable (100%) is percentage of households with water heating (EIA 2008).
Efficient Room Air Conditioner (electricity only) Measure Description: ENERGY STAR Room A/C (8000 Btu unit at 10.8 EER). Basecase: Room A/C that meets 2000 federal energy standards (8000 Btu at 9.8 EER) Data Explanation: Baseline and new measure consumption and incremental cost ($50) from ENERGY STAR savings calculator. Savings (9%) calculated from EPA 2012d. Percent homes applicable (32%) based on number of homes with Room A/C unit from RECS 2008 (EIA 2011). Measure life (9 years) from EPA 2012d. Market share (40%) derived from ENERGY STAR 2007 appliance sales data.
2014 Efficient Room Air Conditioner (electricity only)
Measure Description: Room A/C (8000 Btu unit at 11.3 EER) that meets 2013 ENERGY STAR specifications. Basecase: Room A/C that meets 2014 federal energy standards (8000 Btu at 10.9 EER) Data Explanation: Baseline and new measure consumption from ENERGY STAR savings calculator. Savings (4%) calculated from EPA 2012d. Percent homes applicable (32%) based on number of homes with Room A/C unit from RECS 2008 (EIA 2011). Measure life (9 years) from EPA 2012d. Market share (40%) derived from ENERGY STAR 2007 appliance sales data.
Refrigerator (electricity only)
Measure Description: Replacement refrigerator that meets 2012 ENERGY STAR requirements (20% better than federal standard) Basecase: Refrigerator that meets current 2001 federal energy standards. Data Explanation: Baseline consumption from RECS 2005 (EIA 2008). Incremental cost ($30) and measure life (12 years) from EPA 2012e. Market share (8%) derived from ENERGY STAR market share for manufactured homes.
2014 Refrigerator (electricity only)
Measure Description: Replacement refrigerator that is 10% better than 2014 federal energy standards. Basecase: Refrigerator that meets current 2014 federal energy standards. Data Explanation: Baseline consumption from RECS 2005 (EIA 2008), which is discounted to 450 kWh/year to account for 2014 federal energy standards. Incremental cost ($30) and measure life (12 years) from EPA 2012e. Market share (8%) derived from ENERGY STAR market share for manufactured homes.
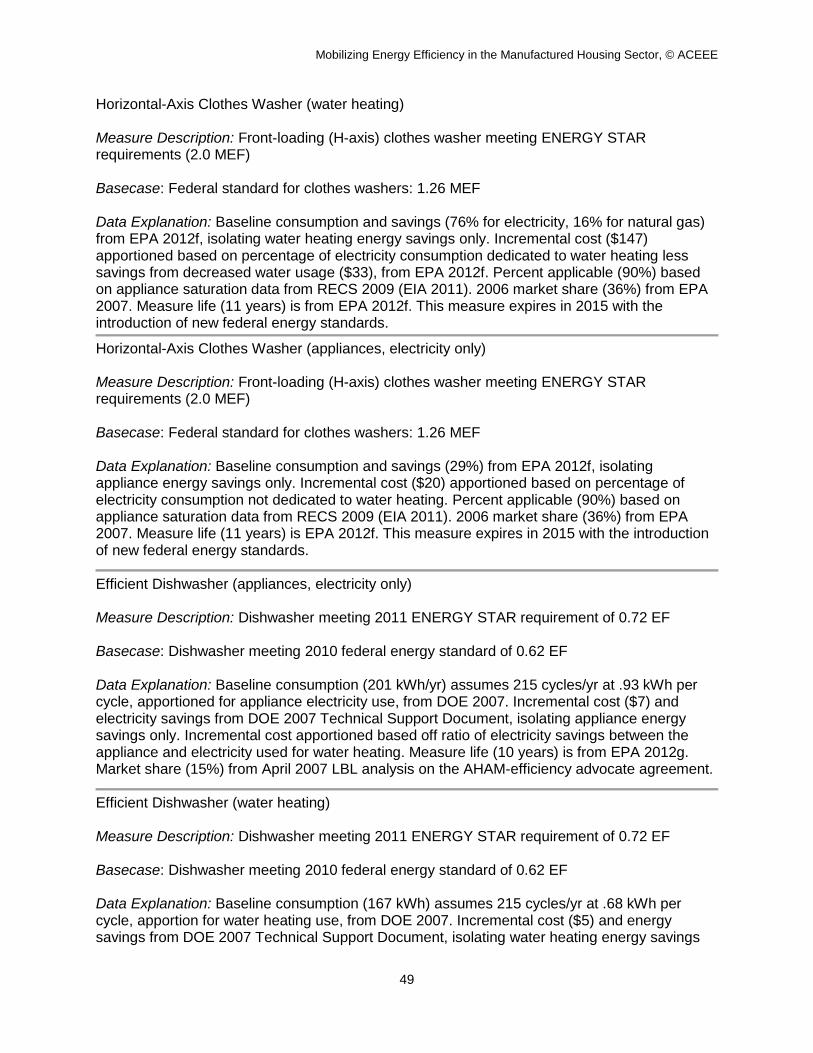
Mobilizing Energy Efficiency in the Manufactured Housing Sector, © ACEEE
49
Horizontal-Axis Clothes Washer (water heating) Measure Description: Front-loading (H-axis) clothes washer meeting ENERGY STAR requirements (2.0 MEF) Basecase: Federal standard for clothes washers: 1.26 MEF Data Explanation: Baseline consumption and savings (76% for electricity, 16% for natural gas) from EPA 2012f, isolating water heating energy savings only. Incremental cost ($147) apportioned based on percentage of electricity consumption dedicated to water heating less savings from decreased water usage ($33), from EPA 2012f. Percent applicable (90%) based on appliance saturation data from RECS 2009 (EIA 2011). 2006 market share (36%) from EPA 2007. Measure life (11 years) is from EPA 2012f. This measure expires in 2015 with the introduction of new federal energy standards.
Horizontal-Axis Clothes Washer (appliances, electricity only) Measure Description: Front-loading (H-axis) clothes washer meeting ENERGY STAR requirements (2.0 MEF) Basecase: Federal standard for clothes washers: 1.26 MEF Data Explanation: Baseline consumption and savings (29%) from EPA 2012f, isolating appliance energy savings only. Incremental cost ($20) apportioned based on percentage of electricity consumption not dedicated to water heating. Percent applicable (90%) based on appliance saturation data from RECS 2009 (EIA 2011). 2006 market share (36%) from EPA 2007. Measure life (11 years) is EPA 2012f. This measure expires in 2015 with the introduction of new federal energy standards.
Efficient Dishwasher (appliances, electricity only) Measure Description: Dishwasher meeting 2011 ENERGY STAR requirement of 0.72 EF Basecase: Dishwasher meeting 2010 federal energy standard of 0.62 EF Data Explanation: Baseline consumption (201 kWh/yr) assumes 215 cycles/yr at .93 kWh per cycle, apportioned for appliance electricity use, from DOE 2007. Incremental cost ($7) and electricity savings from DOE 2007 Technical Support Document, isolating appliance energy savings only. Incremental cost apportioned based off ratio of electricity savings between the appliance and electricity used for water heating. Measure life (10 years) is from EPA 2012g. Market share (15%) from April 2007 LBL analysis on the AHAM-efficiency advocate agreement.
Efficient Dishwasher (water heating) Measure Description: Dishwasher meeting 2011 ENERGY STAR requirement of 0.72 EF Basecase: Dishwasher meeting 2010 federal energy standard of 0.62 EF Data Explanation: Baseline consumption (167 kWh) assumes 215 cycles/yr at .68 kWh per cycle, apportion for water heating use, from DOE 2007. Incremental cost ($5) and energy savings from DOE 2007 Technical Support Document, isolating water heating energy savings

Mobilizing Energy Efficiency in the Manufactured Housing Sector, © ACEEE
50
only. Incremental cost apportioned based off ratio of electricity savings between the appliance and electricity used for water heating. Measure life (10 years) is from EPA 2012g. Market share (15%) from April 2007 LBL analysis on the AHAM-efficiency advocate agreement.
Ceiling Fan (electricity only) Measure Description: ENERGY STAR certified ceiling fan Basecase: Standard ceiling fan as defined by ENERGY STAR Data Explanation: Baseline consumption (462 kWh), new measure consumption (237 kWh), and incremental cost ($135) from EPA 2012h. 1.57 units per household assumed from RECS 2009 (EIA 2011). Percent applicable (100%) equivalent to number of households with a ceiling fan. Measure life (10 years) from EPA 2012h. Market share (34%) from Sanchez et al. 2008.
Compact Fluorescent Lighting (through 2013, electricity only) Measure Description: Savings from the 17-watt equivalent to baseline lamp (72%) applied to 80% of baseline incandescent lamp hours. Basecase: Baseline house uses 1,230 kWh for lighting annually (Salzberg 2012). Data Explanation: Measure of 80% replacement by lamp-hours is ACEEE assumption based on a conservative estimate of feasible applications. Applies to all households. Market share (20%) derived from percent of homes with efficient lighting from RECS 2009 (EIA 2011).
Compact Fluorescent Lighting (through 2020, electricity only) Measure Description: Savings from the 17-watt equivalent to baseline lamp (61%) applied to 80% of baseline incandescent lamp hours. Basecase: Baseline house uses 1,095 kWh for lighting annually, derived from increase in 2013 Federal Standard and Salzberg 2012. Data Explanation: Measure of 80% replacement by lamp-hours is ACEEE assumption based on a conservative estimate of feasible applications. Applies to all households. Market share (20%) derived from percent of homes with efficient lighting from RECS 2009 (EIA 2011).
Active Mode Efficiency for Televisions (electricity only) Measure Description: ENERGY STAR Television Specification, Version 5.3 Basecase: Average CRT screen TV from ECOS 2006. Data Explanation: Baseline consumption (154 kWh) and new measure consumption (121 kWh) from ECOS 2006. Measure life (6 yrs) from CEE 2008.
Low Power Set-Top Boxes (electricity only) Measure Description: Require digital set-top boxes to have a maximum sleep state power level of 10 watts and to automatically enter sleep mode after 4 hours without user input.
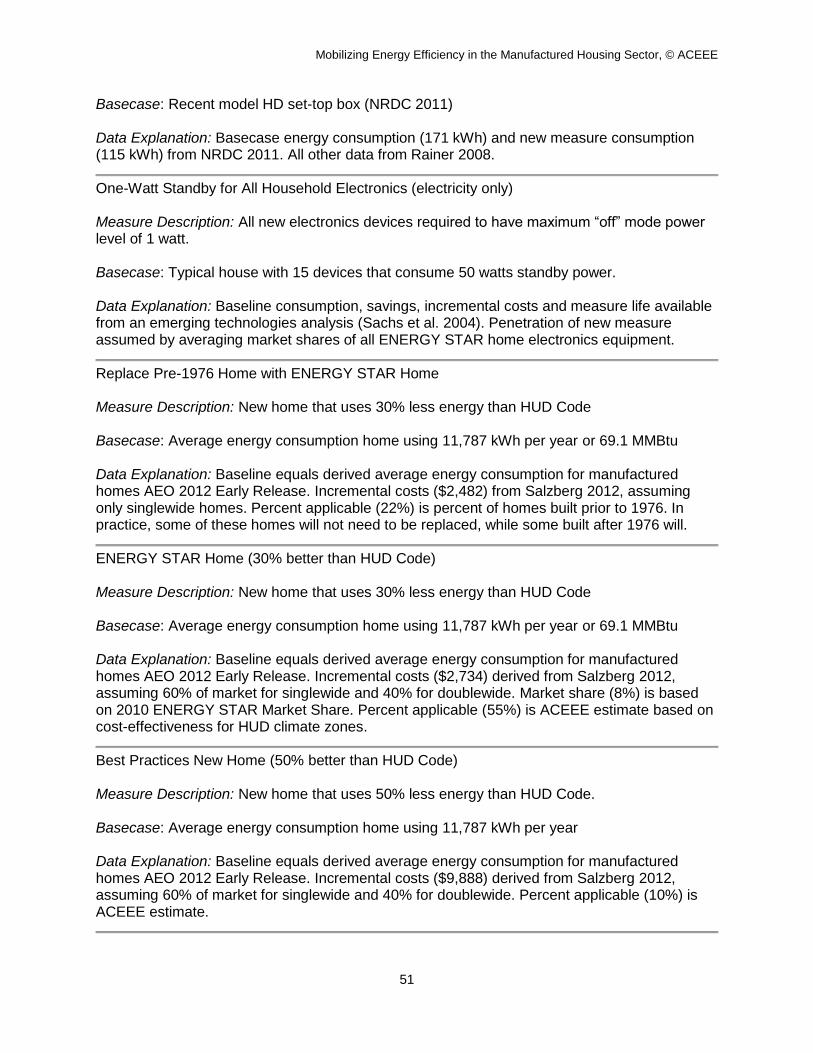
Mobilizing Energy Efficiency in the Manufactured Housing Sector, © ACEEE
51
Basecase: Recent model HD set-top box (NRDC 2011) Data Explanation: Basecase energy consumption (171 kWh) and new measure consumption (115 kWh) from NRDC 2011. All other data from Rainer 2008.
One-Watt Standby for All Household Electronics (electricity only) Measure Description: All new electronics devices required to have maximum “off” mode power level of 1 watt. Basecase: Typical house with 15 devices that consume 50 watts standby power. Data Explanation: Baseline consumption, savings, incremental costs and measure life available from an emerging technologies analysis (Sachs et al. 2004). Penetration of new measure assumed by averaging market shares of all ENERGY STAR home electronics equipment.
Replace Pre-1976 Home with ENERGY STAR Home Measure Description: New home that uses 30% less energy than HUD Code Basecase: Average energy consumption home using 11,787 kWh per year or 69.1 MMBtu Data Explanation: Baseline equals derived average energy consumption for manufactured homes AEO 2012 Early Release. Incremental costs ($2,482) from Salzberg 2012, assuming only singlewide homes. Percent applicable (22%) is percent of homes built prior to 1976. In practice, some of these homes will not need to be replaced, while some built after 1976 will.
ENERGY STAR Home (30% better than HUD Code) Measure Description: New home that uses 30% less energy than HUD Code Basecase: Average energy consumption home using 11,787 kWh per year or 69.1 MMBtu Data Explanation: Baseline equals derived average energy consumption for manufactured homes AEO 2012 Early Release. Incremental costs ($2,734) derived from Salzberg 2012, assuming 60% of market for singlewide and 40% for doublewide. Market share (8%) is based on 2010 ENERGY STAR Market Share. Percent applicable (55%) is ACEEE estimate based on cost-effectiveness for HUD climate zones.
Best Practices New Home (50% better than HUD Code) Measure Description: New home that uses 50% less energy than HUD Code. Basecase: Average energy consumption home using 11,787 kWh per year Data Explanation: Baseline equals derived average energy consumption for manufactured homes AEO 2012 Early Release. Incremental costs ($9,888) derived from Salzberg 2012, assuming 60% of market for singlewide and 40% for doublewide. Percent applicable (10%) is ACEEE estimate.

Mobilizing Energy Efficiency in the Manufactured Housing Sector, © ACEEE
52
Residential Efficiency Measure References [ACEEE] American Council for an Energy-Efficient Economy. 1994. "Gas DSM and Fuel-Switching: Opportunities and Experiences." Prepared for New York State Energy Research and Development Authority. Washington, DC: American Council for an Energy-Efficient Economy Brown, Marilyn, Dennis White, and Steve Purucker. 1987. Impact of the Hood River Conservation Project on Electricity Use for Residential Water Heating. ORNL/CON-238. Oak Ridge, TN: Oak Ridge National Laboratory. [CEC] 2005. Database for Energy Efficiency Resources 2004-05, Version 2.01. http://www.energy.ca.gov/deer/. Sacramento, CA: California Energy Commission. _____. 2007. Technical Support Document: Residential Dishwashers, Dehumidifiers, and Cooking Products and Commercial Clothes Washers. Washington, DC: U.S. Department of Energy. [ECOS] ECOS Consulting. 2006. Final Field Research Report for the California Energy Commission. Durango, CO: ECOS Consulting. ____. 2008. 2005 Residential Energy Consumption Survey. http://www.eia.doe.gov/emeu/recs/contents.html. Washington, DC: U.S. Department of Energy. ___. 2011. 2009 Residential Energy Consumption Survey. Washington, DC: U.S. Energy Information Administration. EnergyWise Technologies. 2007. Air-Source Heat Pump Retrofits in Mid Vancouver Island. Vancouver, B.C.: DC Ministry of Energy Mines and Petroleum Resources. [EPA] Environmental Protection Agency 2007. “2006 Appliance Sale Data – National, State and Regional.” http://www.energystar.gov/ia/partners/manuf_res/2006FullYear.xls. Washington, DC: U.S. Environmental Protection Agency. _____. 2008. "Savings Calculator – Dishwashers." http://www.energystar.gov/index.cfm?c=dishwash.pr_dishwashers. Washington, DC: U.S. Environmental Protection Agency. _____. 2008c. "Savings Calculator – Furnaces." http://www.energystar.gov/index.cfm?c=furnaces.pr_furnaces. Washington, DC: U.S. Environmental Protection Agency. _____. 2012a. “Savings Calculator – Air Conditioning, Central.” http://www.energystar.gov/index.cfm?fuseaction=find_a_product.showProductGroup&pgw_code=CA. Washington, DC: U.S. Environmental Protection Agency. _____. 2012b. “Savings Calculator – Heat Pumps, Air-Source.” http://www.energystar.gov/index.cfm?fuseaction=find_a_product.showProductGroup&pgw_code=EP. Washington, DC: U.S. Environmental Protection Agency.
Mobilizing Energy Efficiency in the Manufactured Housing Sector, © ACEEE
53
_____. 2012c. “Savings Calculator – Furnaces.” http://www.energystar.gov/index.cfm?fuseaction=find_a_product.showProductGroup&pgw_code=FU. Washington, DC: U.S. Environmental Protection Agency. _____. 2012d. “Savings Calculator – Air Conditioning, Room.” http://www.energystar.gov/index.cfm?fuseaction=find_a_product.showProductGroup&pgw_code=AC. Washington, DC: U.S. Environmental Protection Agency. _____. 2012e. “Savings Calculator – Refrigerator.” http://www.energystar.gov/index.cfm?fuseaction=find_a_product.showProductGroup&pgw_code=RF. Washington, DC: U.S. Environmental Protection Agency. _____. 2012f. “Savings Calculator – Clothes Washers.” http://www.energystar.gov/index.cfm?fuseaction=find_a_product.showProductGroup&pgw_code=CW. Washington, DC: U.S. Environmental Protection Agency. _____. 2012g. “Savings Calculator – Dishwasers.” http://www.energystar.gov/index.cfm?fuseaction=find_a_product.showProductGroup&pgw_code=DW. Washington, DC: U.S. Environmental Protection Agency. _____. 2012h. “Savings Calculator – Fans, Ceiling.” http://www.energystar.gov/index.cfm?fuseaction=find_a_product.showProductGroup&pgw_code=CF. Washington, DC: U.S. Environmental Protection Agency. Frontier Associates. 2006. Deemed Savings, Installation and Efficiency Standards: Residential and Small Commercial Standard Offer Program and Hard-To-Reach Standard Offer Program. Prepared for the Public Utility Commission of Texas, Project No. 22241. Austin, TX: Frontier Associates. Hammarlund, J., J. Proctor, G. Kast, and T. Ward. 1992. “Enhancing the Performance of HVAC and Distribution.” In Proceedings of ACEEE Summer Study on Energy Efficiency in Buildings. Washington, DC: American Council for an Energy-Efficient Economy. Jump, D. A., I. S. Walker, and M. P. Modera. 1996. “Field Measurements of Efficiency and Duct Retrofit Effectiveness in Residential Forced Air Distribution Systems.” In Proceedings of the 1996 ACEEE Summer Study on Energy Efficiency in Buildings, 1:147-155. Washington DC; American Council for an Energy-Efficient Economy. Leckie, Jim, Gil Masters, Harry Whitehouse, and Lily Young. 1981. "More Other Homes and Garbage." Sierra Club Books. San Francisco, CA: Sierra Club Books. Ng, B., U.S. Environmental Protection Agency. 2011. Personal Communication. [NRDC] Natural Resources Defense Council. 2011. Better Viewing, Lower Energy Bills, and Less Pollution: Improving the Efficiency of Television Set-Top Boxes. San Francisco, CA: Natural Resources Defense Council. Proctor, J., M. Blasnik, B. Davis,T. Downey, M. Modera, G. Nelson, and J. Tooley. 1993. Diagnosing Ducts Finding the Energy Culprits Leak Detectors: Experts Explain the Techniques. Home Energy Magazine Online.

Mobilizing Energy Efficiency in the Manufactured Housing Sector, © ACEEE
54
Rainer, Leo. 2008. Proposal Information Template for: Digital Set-Top Boxes. Submitted to California Energy Commission in consideration for the 2008 Rulemaking Proceeding on Appliance Efficiency Regulations, Docket number 07-AAER-3. Sacramento, Calif.: California Energy Commission [RTF] Regional Technical Forum. 2012. Residential: Weatherization – Manufactured Home UES Measures. Portland, OR: Northwest Power and Conservation Council. Sachs, Harvey, S. Nadel, J. Thorne Amann, M. Tuazon, E. Mendelsohn, L. Rainer, G. Todesco, D. Shipley, and M. Adelaar. 2004. Emerging Energy-Savings Technologies and Practices for the Buildings Sector as of 2004. Washington, DC: American Council for an Energy-Efficient Economy. Sanchez, Marla, Richard E. Brown, Gregory K. Homan, and Carrie A. Webber. 2007. 2008 Status Report: Savings Estimates for the ENERGY STAR Voluntary Labeling Program. Berkeley, CA: Lawrence Berkeley National Laboratory. [SWEEP] Southwest Energy Efficiency Project. 2002. The New Mother Lode: The Potential for More Efficient Electricity Use in the Southwest. Boulder, CO.: Southwest Energy Efficiency Project.