mobility and urban development in são paulo: an overvie · chucri zaidan ave. urban mobility is a...
TRANSCRIPT
Mobility and Urban Development in São
Paulo: An overview
Professor Miguel Bucalem
Escola Politécnica da USP
Director USP Cidades
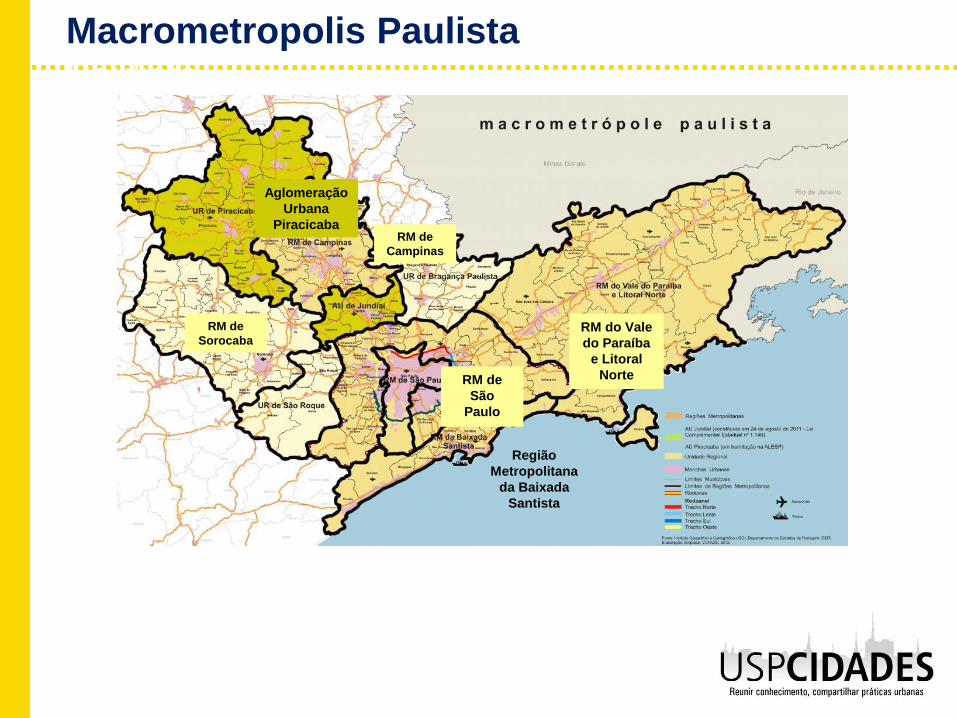
Macrometropolis PaulistaMacrometrópole
Paulista
Aglomeração
Urbana
Piracicaba
RM de
São
Paulo
RM de
Campinas
Região
Metropolitana
da Baixada
Santista
RM do Vale
do Paraíba
e Litoral
Norte
RM de
Sorocaba
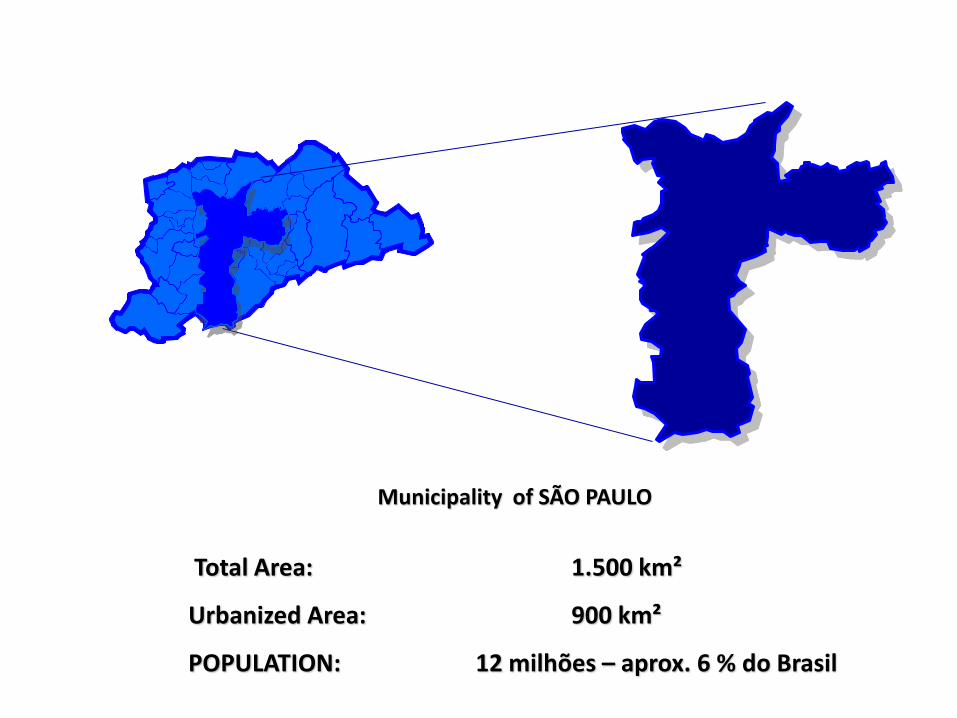
Municipality of SÃO PAULO
Total Area: 1.500 km²
Urbanized Area: 900 km²
POPULATION: 12 milhões – aprox. 6 % do Brasil
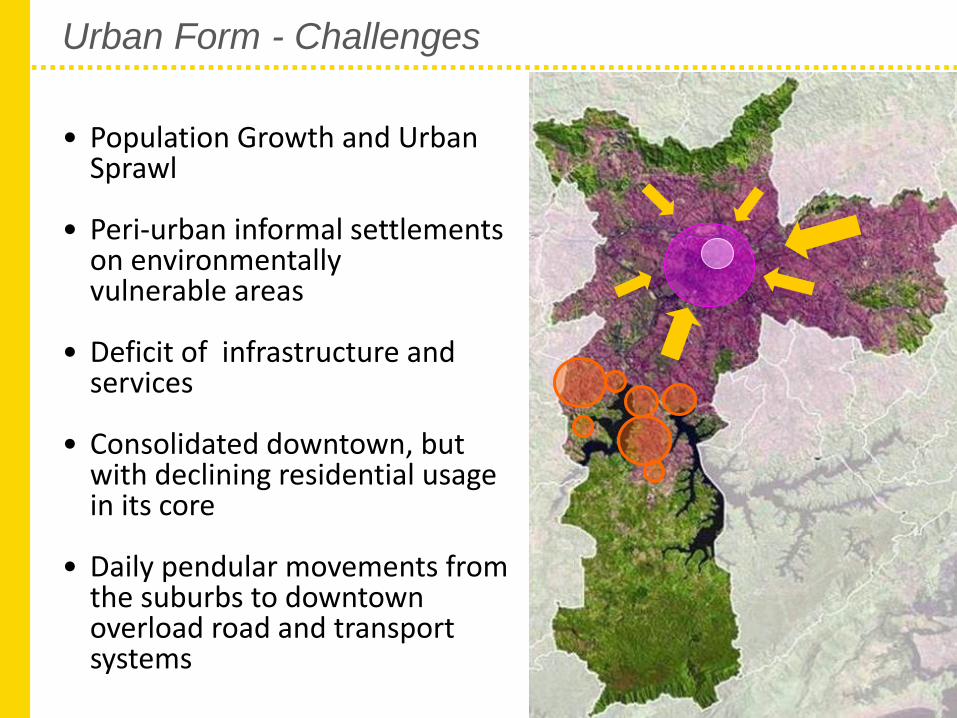
• Population Growth and Urban Sprawl
• Peri-urban informal settlements on environmentally vulnerable areas
• Deficit of infrastructure and services
• Consolidated downtown, but with declining residential usage in its core
• Daily pendular movements from the suburbs to downtown overload road and transport systems
Urban Form - Challenges
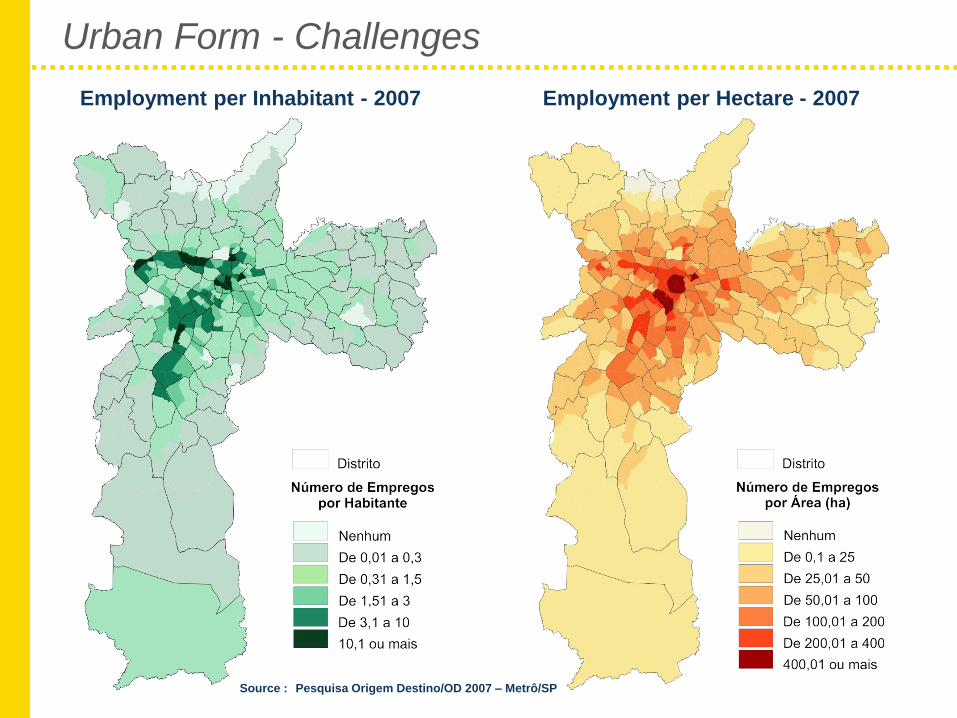
Employment per Hectare - 2007
Source : Pesquisa Origem Destino/OD 2007 – Metrô/SP
Employment per Inhabitant - 2007
Urban Form - Challenges

RINGROAD
Fonte: Secretaria de Estado dos Transportes 2000
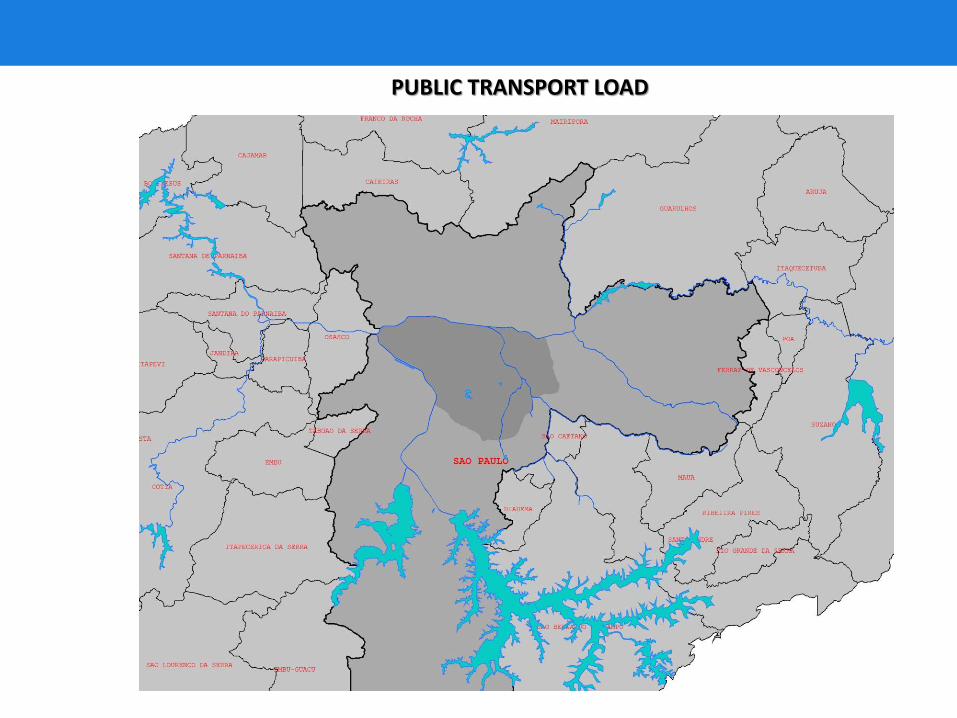
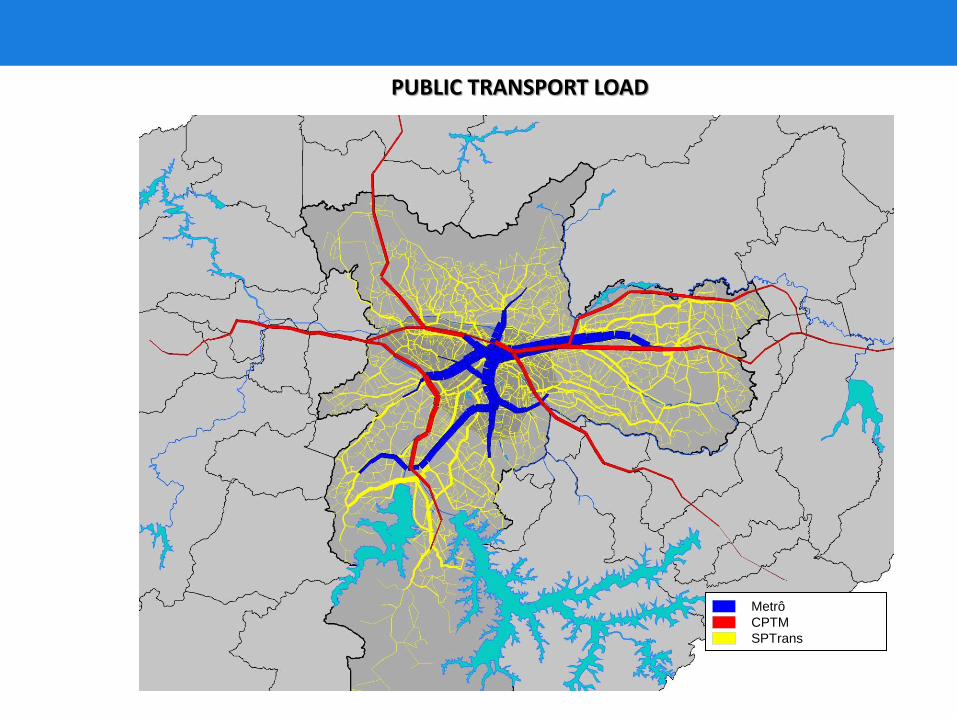
PUBLIC TRANSPORT LOAD
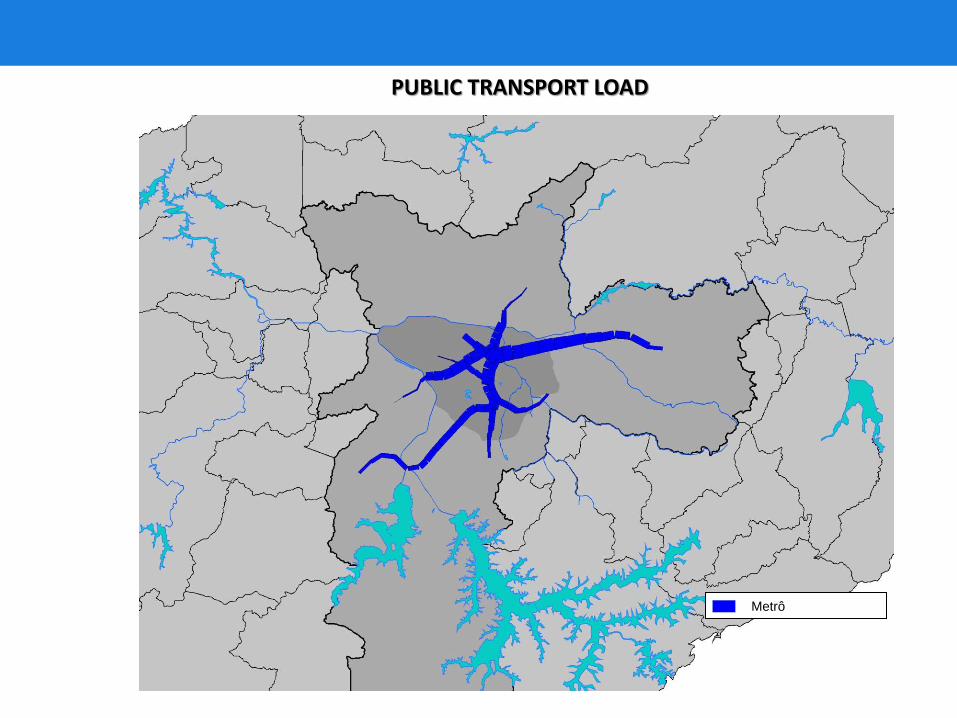
PUBLIC TRANSPORT LOAD
Metrô
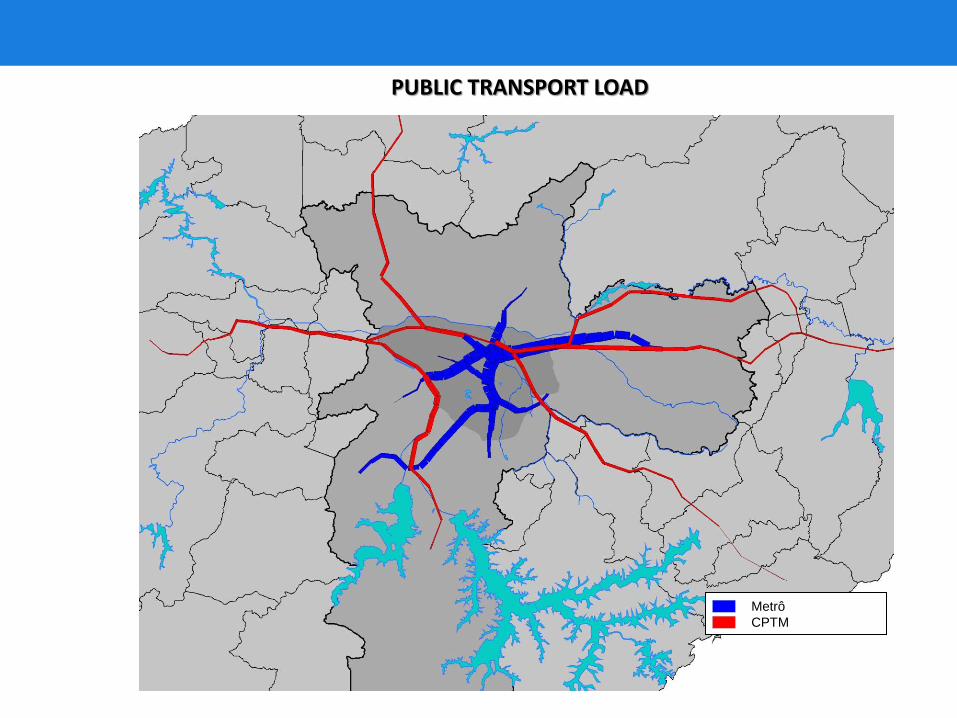
PUBLIC TRANSPORT LOAD
Metrô
CPTM
PUBLIC TRANSPORT LOAD
Metrô
CPTM
SPTrans
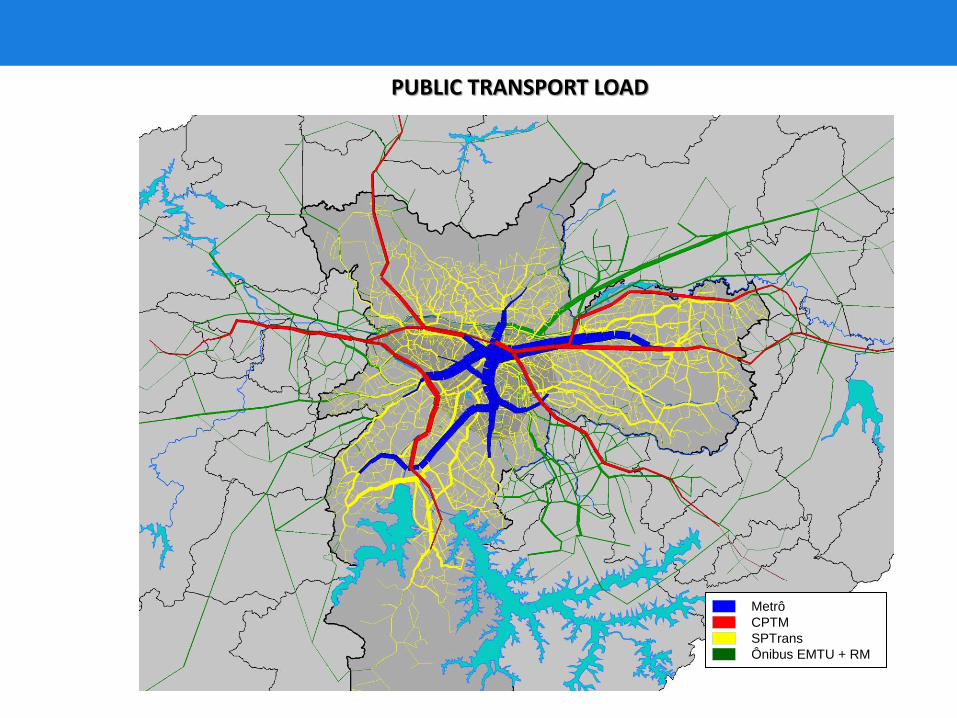
PUBLIC TRANSPORT LOAD
Metrô
CPTM
SPTrans
Ônibus EMTU + RM

LAST URBAN MOBILITY SURVEY AVAILABLE, 2007 WITH UPDATING FOR 2012
The 2017 is under way.
PERCENTAGE OF PUBLIC TRANSPORT TRIPS WITH RESEPCT TO THE TOTAL
MOTORIZED TRIP BY MONTHLY INCOME
* outubro/2012
Viagens por modo coletivo e renda familiar * -
RMSP
URBAN MOBILITY SURVEY
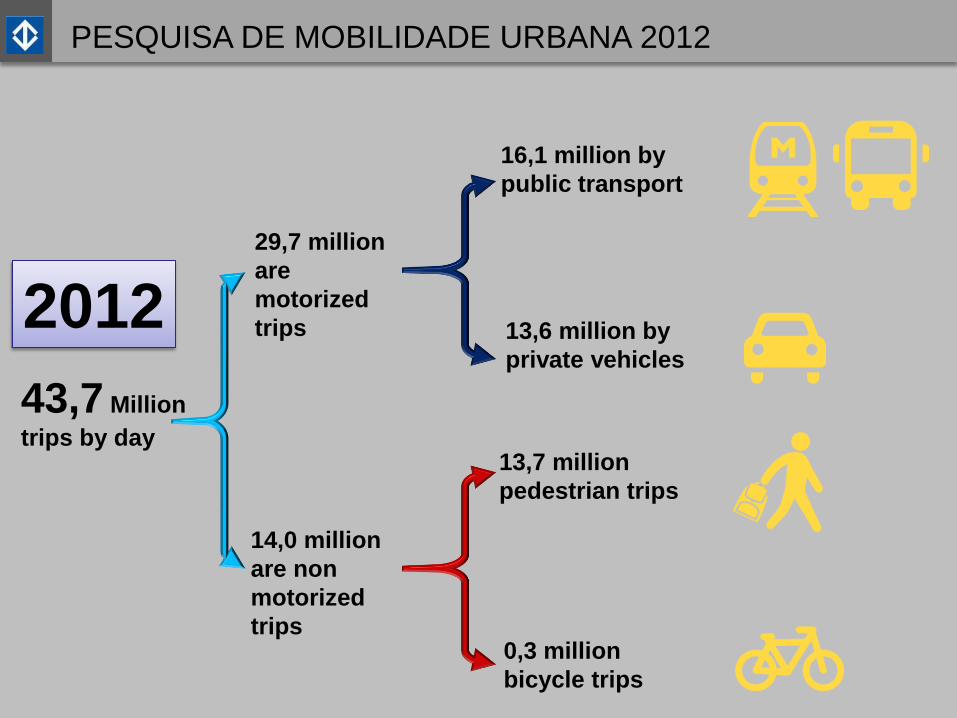
43,7 Million
trips by day
29,7 million
are
motorized
trips
14,0 million
are non
motorized
trips
2012
16,1 million by
public transport
13,6 million by
private vehicles
13,7 million
pedestrian trips
0,3 million
bicycle trips
PESQUISA DE MOBILIDADE URBANA 2012
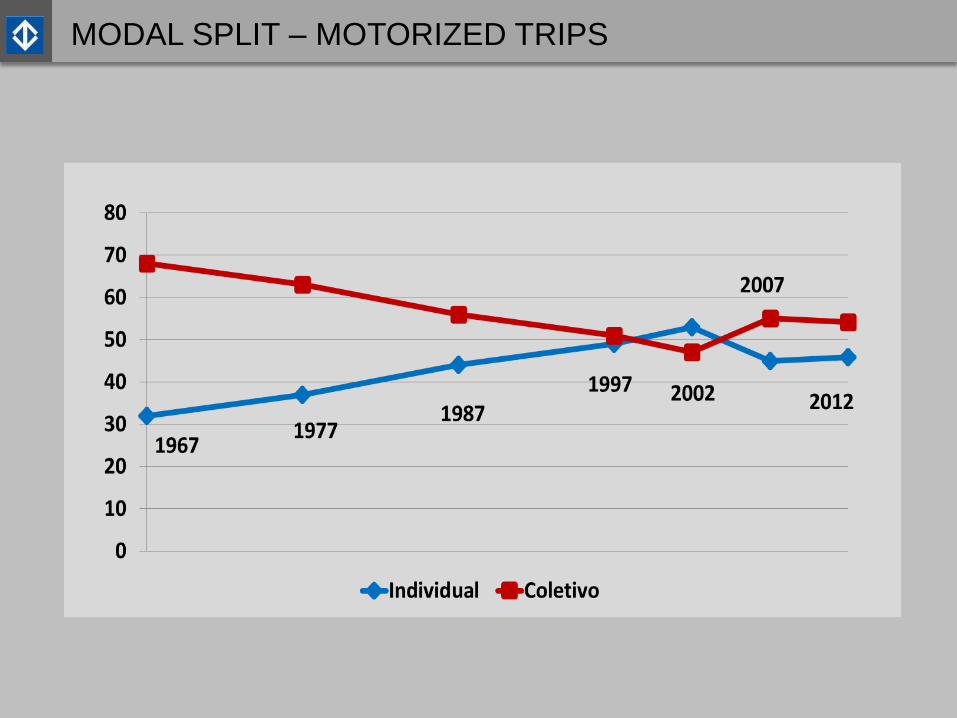
MODAL SPLIT – MOTORIZED TRIPS
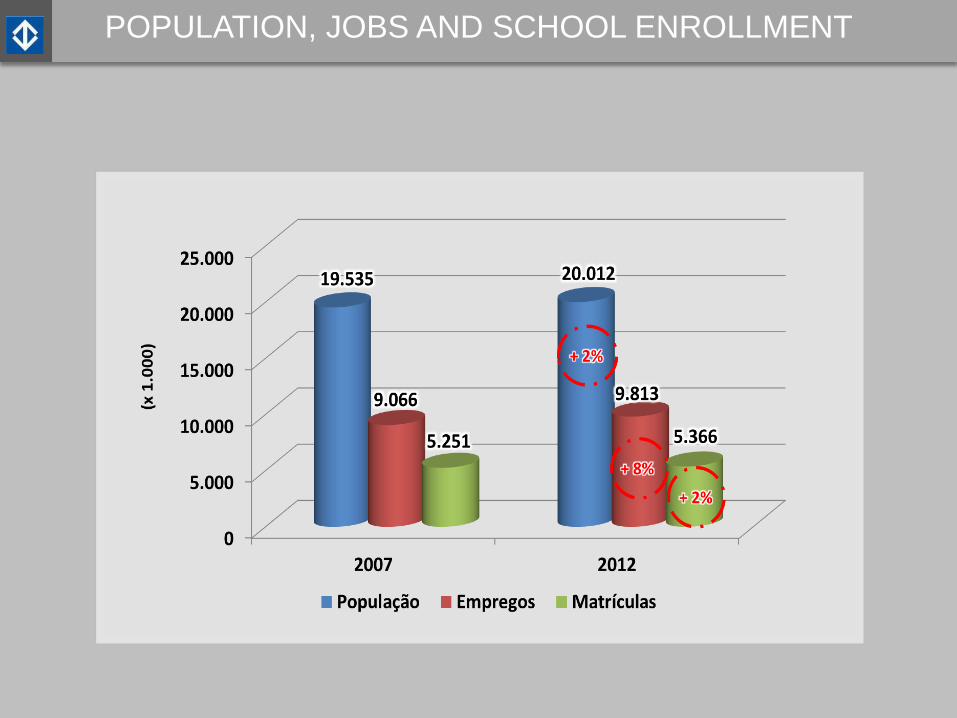
POPULATION, JOBS AND SCHOOL ENROLLMENT
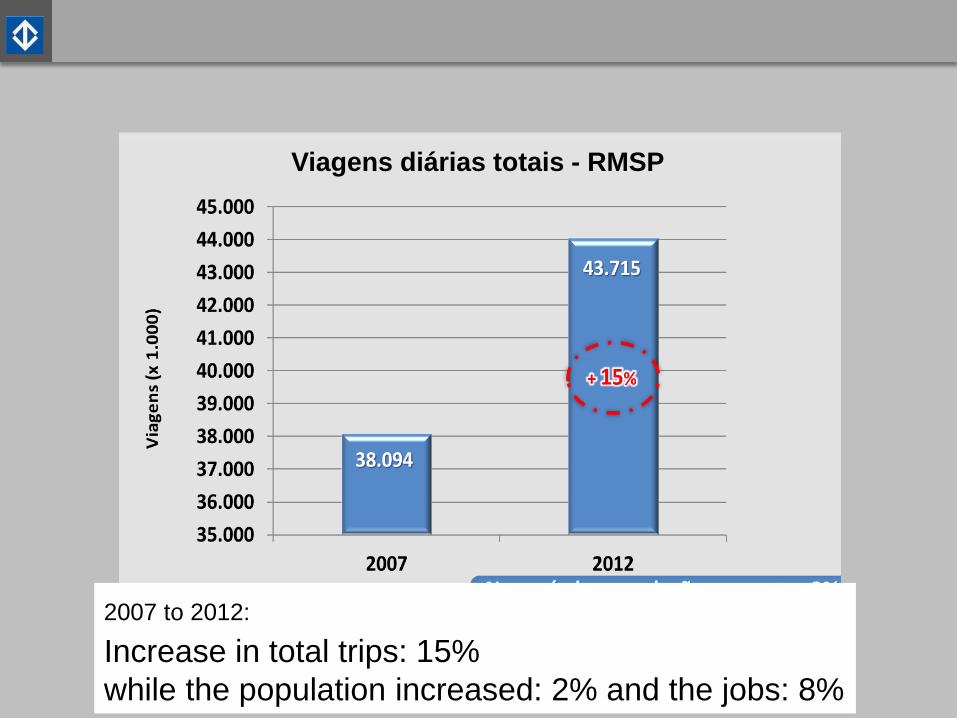
Viagens diárias totais - RMSP
2007 to 2012:
Increase in total trips: 15%
while the population increased: 2% and the jobs: 8%
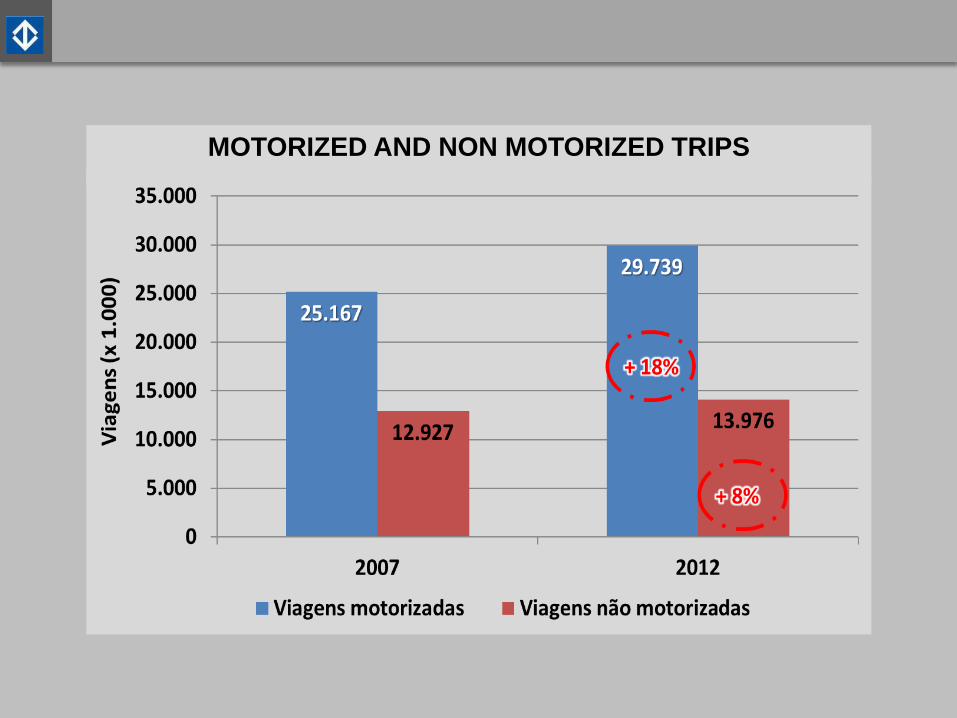
MOTORIZED AND NON MOTORIZED TRIPS
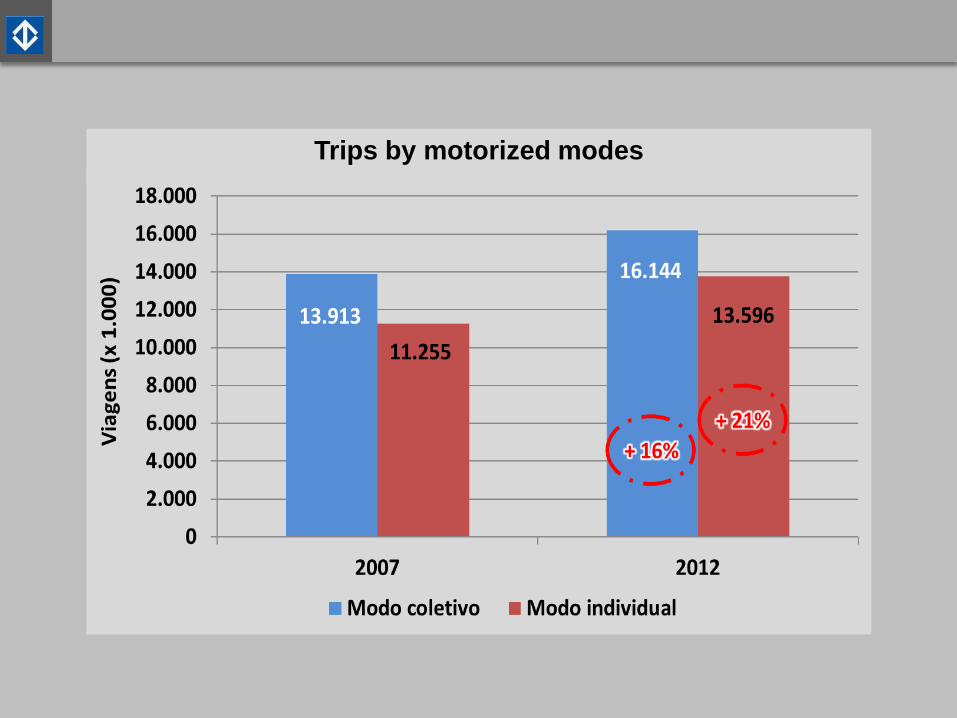
Trips by motorized modes
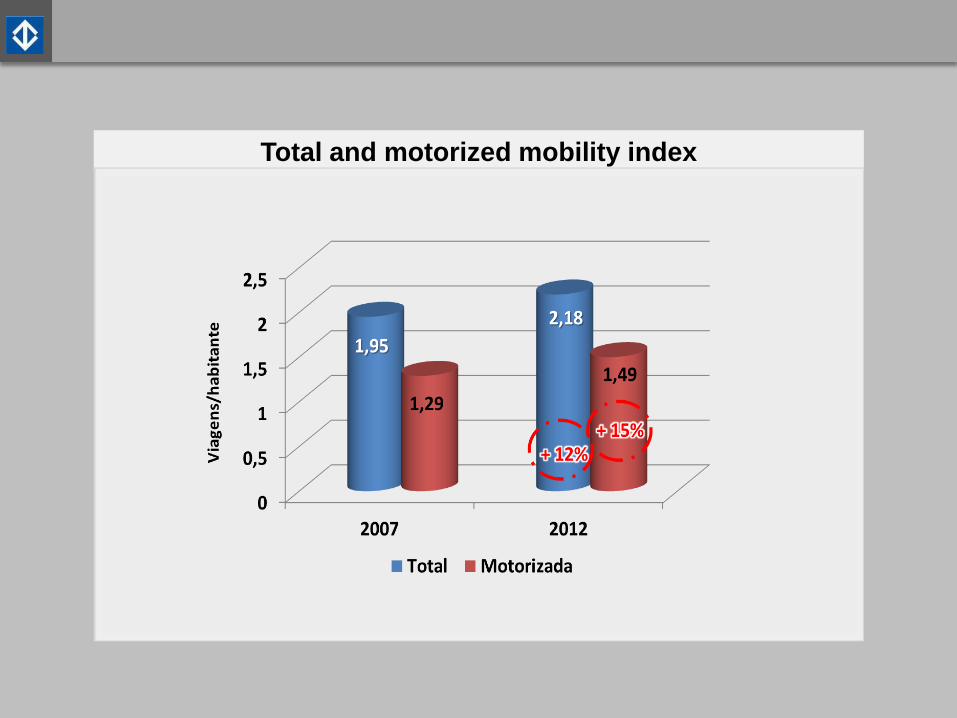
Total and motorized mobility index

TOTAL MOTORIZED TRIPS BY MODE
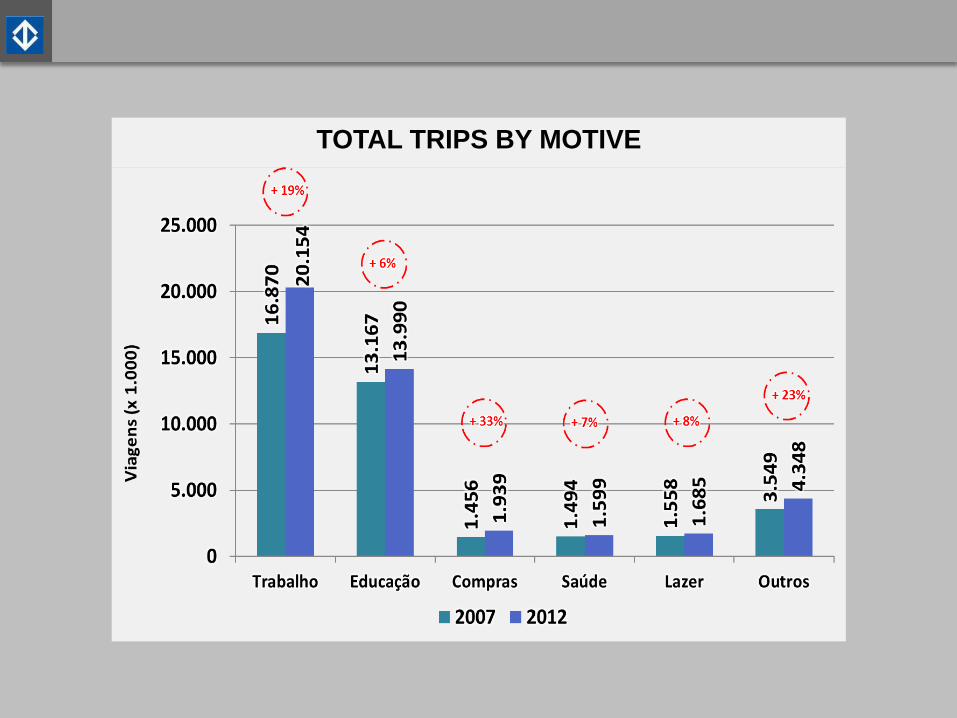
TOTAL TRIPS BY MOTIVE

An integrated land use and transport
approach is required
Latest land use regulation and initiatives
• Masterplan - 2002
• Land use law - 2004
• SP2040 long term strategic plan – 2012
• Masterplan revision – 2014
• Land use law revision – 2016
• Urban Operation Laws – Latest is Agua Branca - 2013
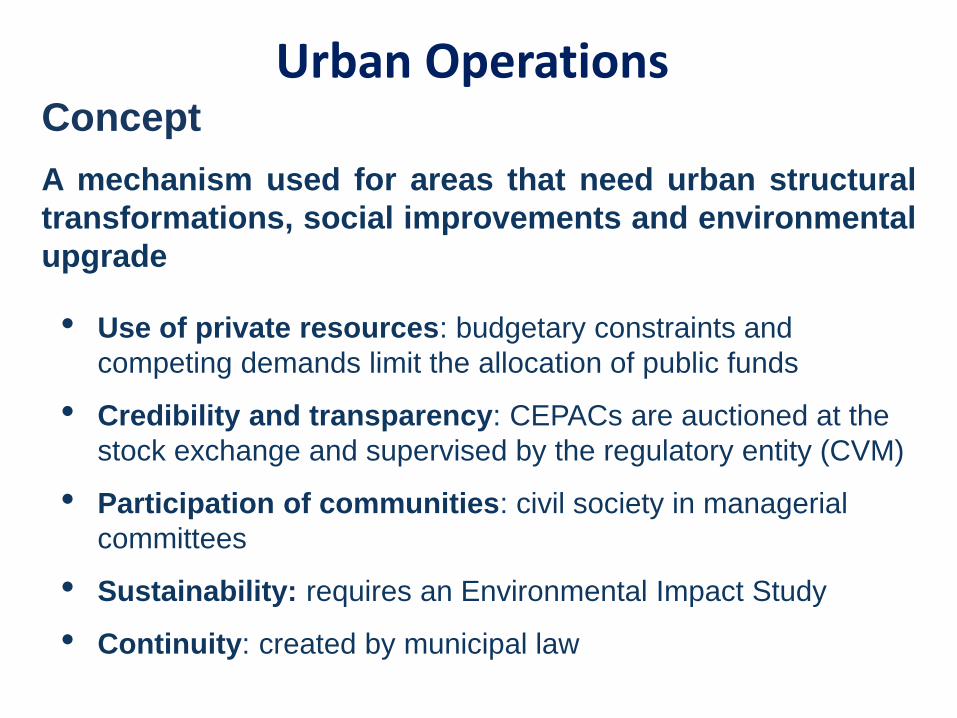
Concept
A mechanism used for areas that need urban structural
transformations, social improvements and environmental
upgrade
• Use of private resources: budgetary constraints and
competing demands limit the allocation of public funds
• Credibility and transparency: CEPACs are auctioned at the
stock exchange and supervised by the regulatory entity (CVM)
• Participation of communities: civil society in managerial
committees
• Sustainability: requires an Environmental Impact Study
• Continuity: created by municipal law
Urban Operations

CITY
compact . polycentric . equivalent
SP2040
• mixed-use
• mixed-income
• parks
• living with water and rivers
• pedestrianism and cycling
• leisure, culture and public services
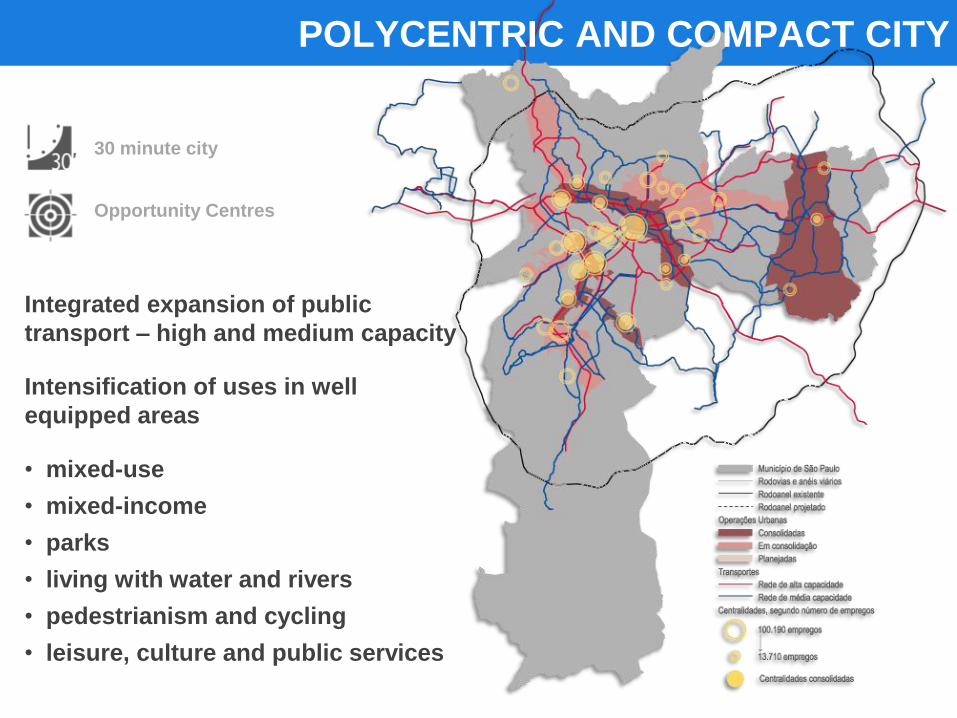
Integrated expansion of public
transport – high and medium capacity
Intensification of uses in well
equipped areas
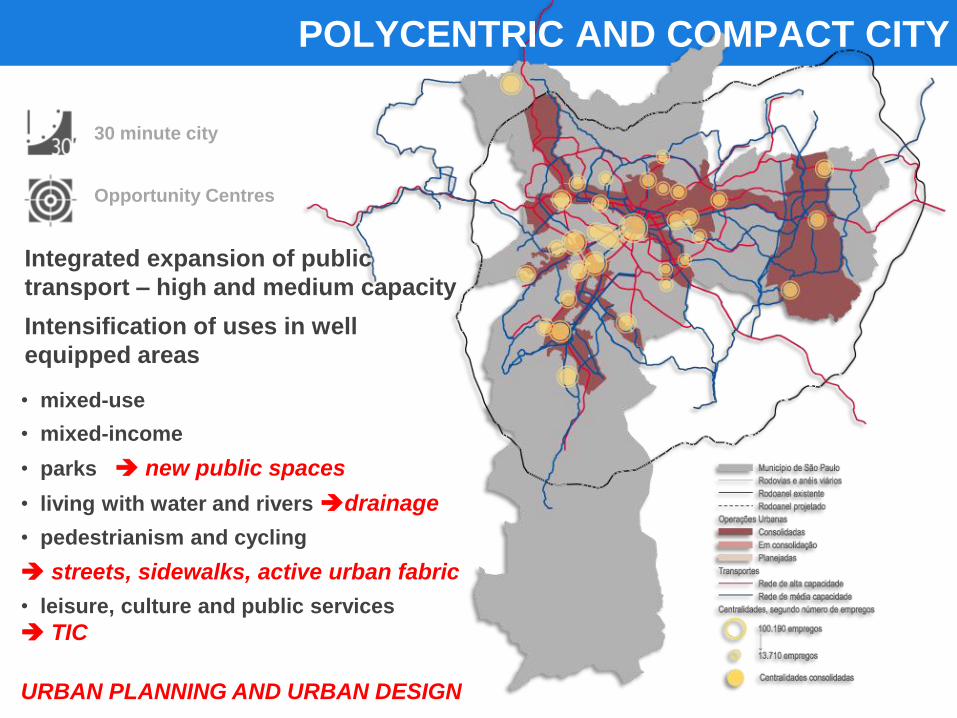
30 minute city
Opportunity Centres
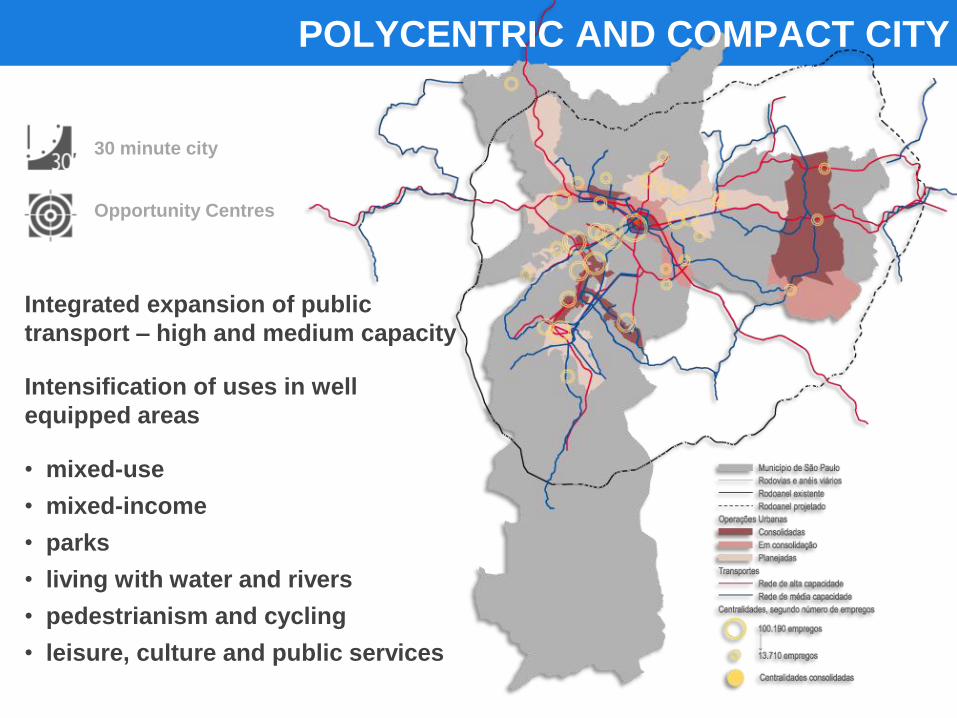
POLYCENTRIC AND COMPACT CITY
30 minute city
Opportunity Centres
• mixed-use
• mixed-income
• parks
• living with water and rivers
• pedestrianism and cycling
• leisure, culture and public services
Integrated expansion of public
transport – high and medium capacity
Intensification of uses in well
equipped areas
POLYCENTRIC AND COMPACT CITY
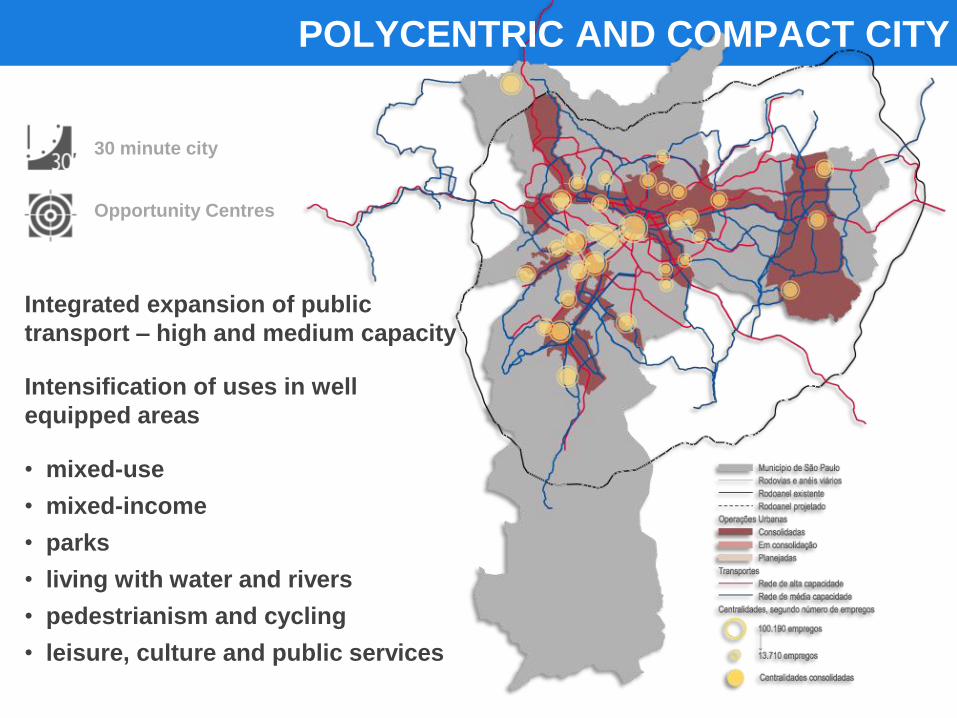
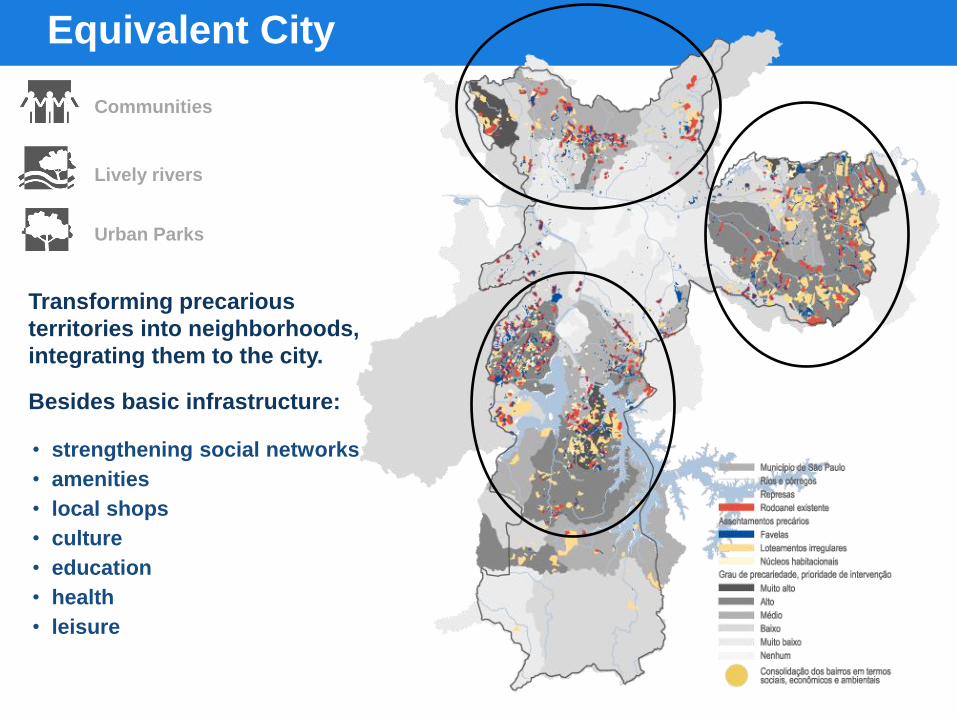
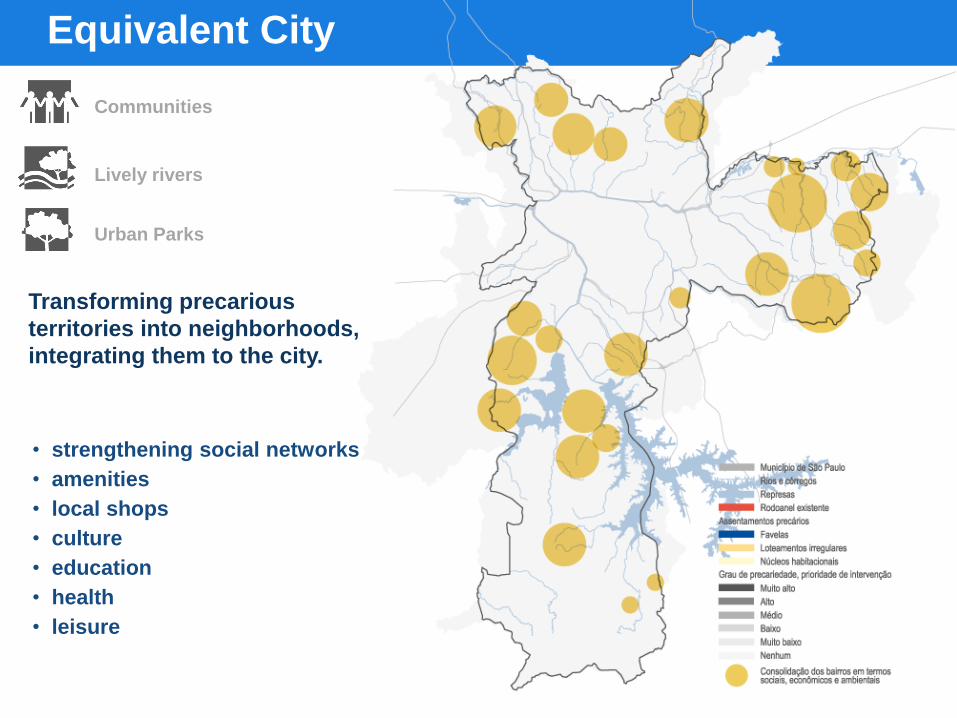
Urban Parks
Lively rivers
Communities
• strengthening social networks
• amenities
• local shops
• culture
• education
• health
• leisure
Transforming precarious
territories into neighborhoods,
integrating them to the city.
Besides basic infrastructure:
Equivalent City
Equivalent City
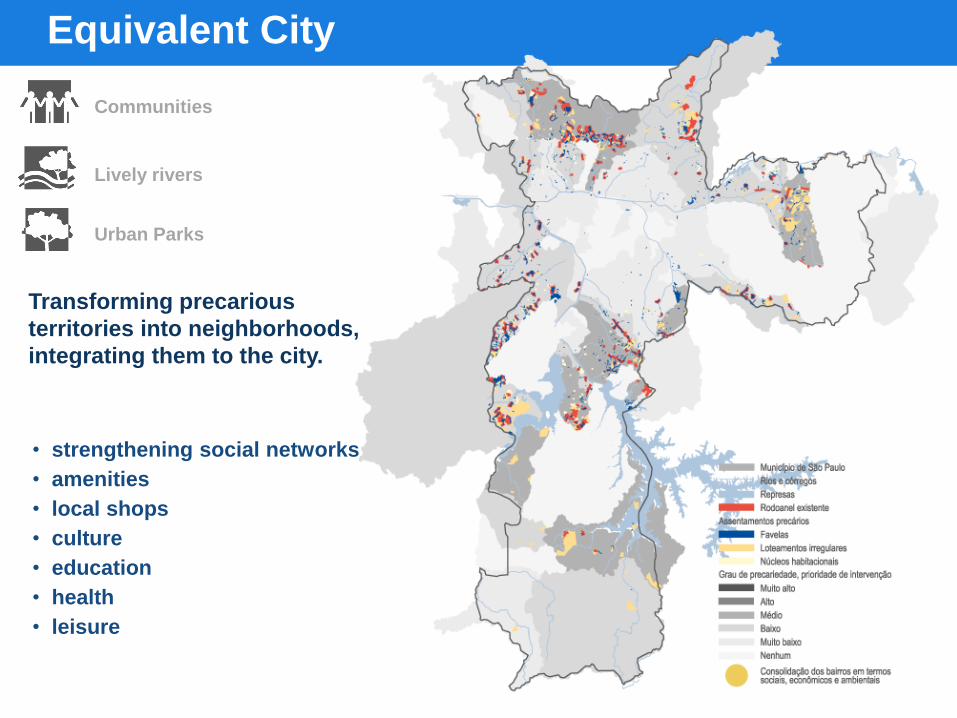
Urban Parks
Lively rivers
Communities
• strengthening social networks
• amenities
• local shops
• culture
• education
• health
• leisure
Transforming precarious
territories into neighborhoods,
integrating them to the city.
Equivalent City
Urban Parks
Lively rivers
Communities
• strengthening social networks
• amenities
• local shops
• culture
• education
• health
• leisure
Transforming precarious
territories into neighborhoods,
integrating them to the city.
30 minute city
Opportunity Centres
POLYCENTRIC AND COMPACT CITY
• mixed-use
• mixed-income
• parks new public spaces
• living with water and rivers drainage
• pedestrianism and cycling
streets, sidewalks, active urban fabric
• leisure, culture and public services
TIC
URBAN PLANNING AND URBAN DESIGN
Integrated expansion of public
transport – high and medium capacity
Intensification of uses in well
equipped areas

SP2040 (2012)
Master plan (2014)
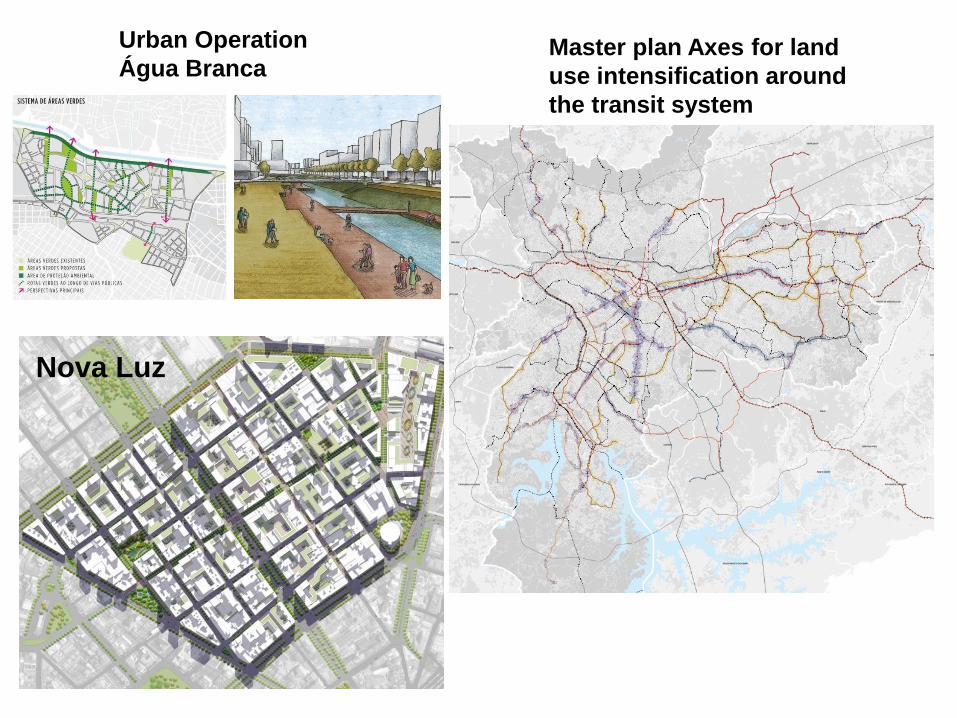
Nova Luz
Urban Operation
Água Branca Master plan Axes for land
use intensification around
the transit system
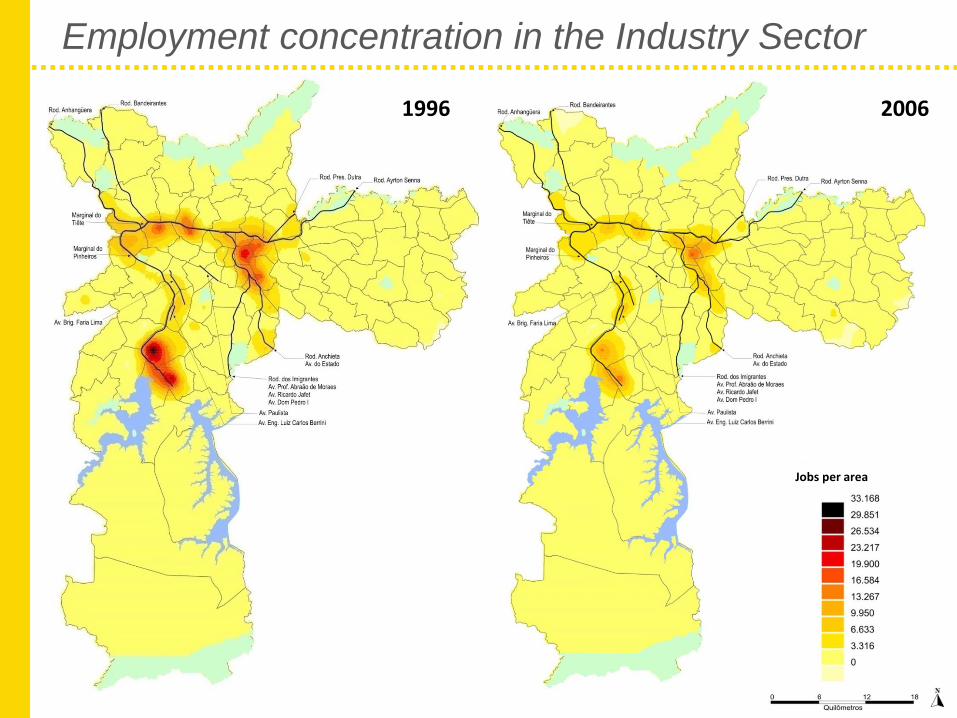
1996 2006
Employment concentration in the Industry Sector
Jobs per area
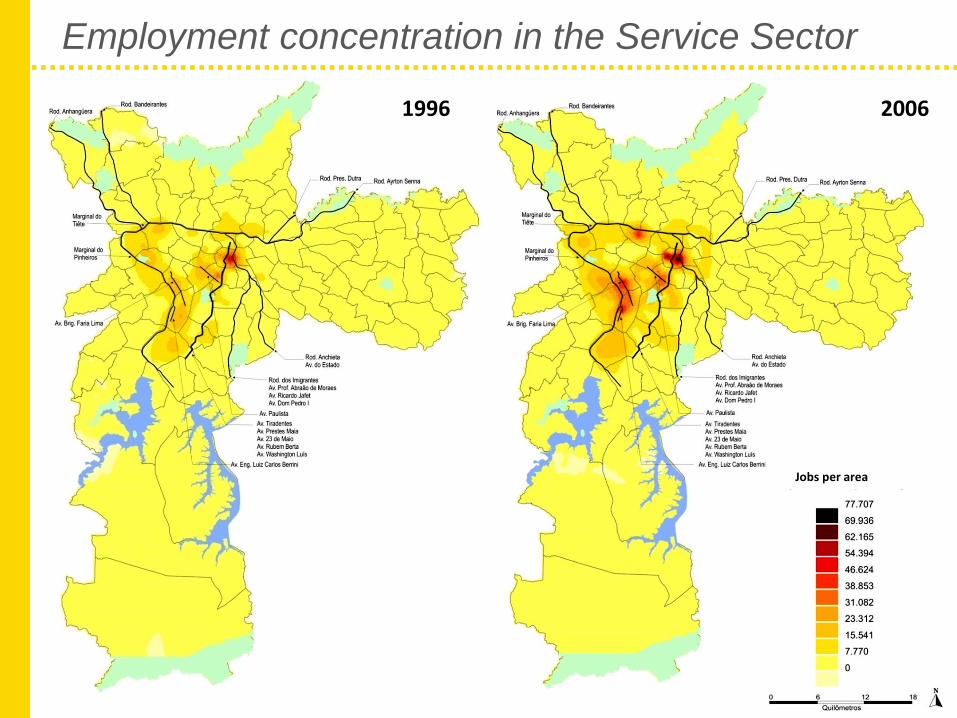
1996 2006
Jobs per area
Employment concentration in the Service Sector
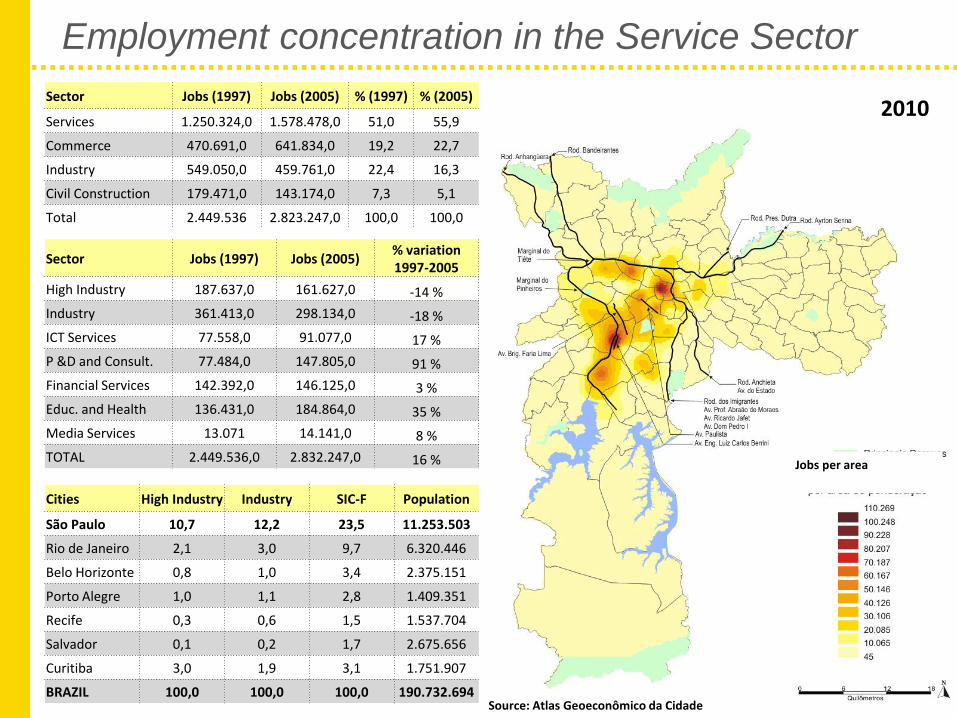
2010
Jobs per area
Employment concentration in the Service Sector
Source: Atlas Geoeconômico da Cidade
Cities High Industry Industry SIC-F Population
São Paulo 10,7 12,2 23,5 11.253.503
Rio de Janeiro 2,1 3,0 9,7 6.320.446
Belo Horizonte 0,8 1,0 3,4 2.375.151
Porto Alegre 1,0 1,1 2,8 1.409.351
Recife 0,3 0,6 1,5 1.537.704
Salvador 0,1 0,2 1,7 2.675.656
Curitiba 3,0 1,9 3,1 1.751.907
BRAZIL 100,0 100,0 100,0 190.732.694
Sector Jobs (1997) Jobs (2005) % (1997) % (2005)
Services 1.250.324,0 1.578.478,0 51,0 55,9
Commerce 470.691,0 641.834,0 19,2 22,7
Industry 549.050,0 459.761,0 22,4 16,3
Civil Construction 179.471,0 143.174,0 7,3 5,1
Total 2.449.536 2.823.247,0 100,0 100,0
Sector Jobs (1997) Jobs (2005) % variation 1997-2005
High Industry 187.637,0 161.627,0 -14 %
Industry 361.413,0 298.134,0 -18 %
ICT Services 77.558,0 91.077,0 17 %
P &D and Consult. 77.484,0 147.805,0 91 %
Financial Services 142.392,0 146.125,0 3 %
Educ. and Health 136.431,0 184.864,0 35 %
Media Services 13.071 14.141,0 8 %
TOTAL 2.449.536,0 2.832.247,0 16 %
Urban Operation 1995| new land use regulation
Urban Operation 2001| new land use regulation
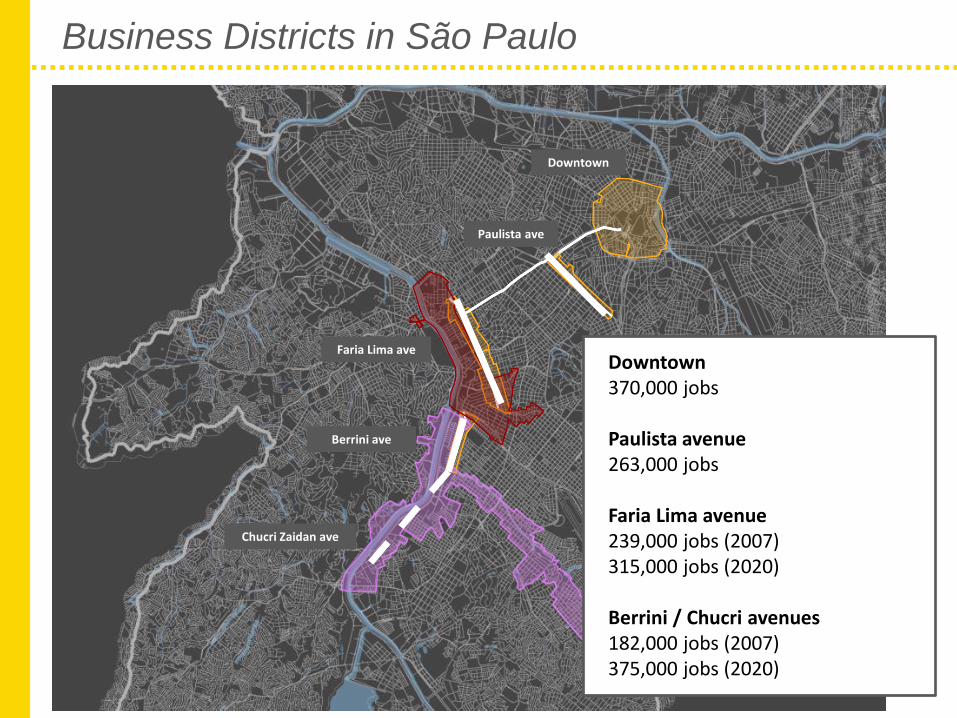
Business Districts in São Paulo
Downtown 370,000 jobs Paulista avenue 263,000 jobs Faria Lima avenue 239,000 jobs (2007) 315,000 jobs (2020) Berrini / Chucri avenues 182,000 jobs (2007) 375,000 jobs (2020)
Downtown
Paulista ave
Faria Lima ave
Berrini ave
Chucri Zaidan ave
Urban Mobility is a crucial challenge for São
Paulo
An integrated approach is required
Combine new transport infrastructure with land
use regulation and value capture mechanisms
There is room for improving intelligent transport
systems
Governance is fragmented and relies on
cooperation between different levels of
government
CONCLUDING REMARKS