mobile wireless system interworking with 3g and packet ... · 2.3.3 wlanprotocolarchitecture ........
TRANSCRIPT

Mobile Wireless System Interworking with 3G andPacket Aggregation for Wireless LAN
J. Scot Ransbottom
submitted to the Faculty of the
Virginia Polytechnic Institute and State University
in partial fulfillment of the requirements for the degree of
Doctor of Philosophy
in
Computer Engineering
Nathaniel J. Davis IV, Chairman
Y. Thomas Hou
Scott F. Midkiff
Srinidhi Varadarajan
Brian D. Woerner
April 22, 2004
Blacksburg, Virginia
Keywords: WLAN, Aggregation, 3G, Protocol
Copyright 2004, J. Scot Ransbottom
Mobile Wireless System Interworking with 3G andPacket Aggregation for Wireless LAN
J. Scot Ransbottom
(ABSTRACT)
This research considered the efficient transmission of data within a wireless local area
network (WLAN) system. A simulation model was developed to study the performance
of our protocol, AGG-MAC (aggregated medium access control). AGG-MAC is a simple
and elegant medium access control (MAC) protocol designed to improve performance by
transmitting a maximal quantity of data with minimal overhead. Our enhancement to IEEE
802.11, AGG-MAC yields dramatic improvements in both local and global throughput. It
furthermore reduces jitter in support of real time communications requirements such as
voice over IP (VoIP). In support of heterogeneous roaming between Third Generation (3G)
Wideband CDMA (WCDMA), specifically Universal Mobile Telecommunications System
(UMTS) and WLAN systems, we constructed a simulation environment which allowed the
evaluation of AGG-MAC in such a system. We further demonstrated the suitability of
AGG-MAC throughout a range of infrastructure and ad hoc based WLAN scenarios. The
AGG-MAC protocol enhancement provides significant performance improvements across a
range of wireless applications, while interoperating with standard IEEE 802.11 stations.
Performance is commensurate to original WLAN MAC performance for applications that do
not benefit from packet level aggregation.
The key contributions of this research were two-fold. First was the development of
an OPNETTM simulation environment suitable for evaluation of future protocols supporting
tightly coupled, heterogeneous WLAN and 3G systems. Secondly was the implementation
and testing of the AGG-MAC protocol which aggregates suboptimal size packets together
into a single frame, thereby amortizing the overhead.

Dedication
This work is dedicated to my wife, Valerie and my two children, Brittany and David.
The sacrifices you all have made during the past three years in support of this work are
greatly appreciated. You made it possible for me to complete this arduous task and there
is no way I would ever be able to have done it without you. Your understanding, love, and
support brought me through the challenges and the long nights and provided the support
necessary to finish this project and maintain what was left of my sanity. I love you all,
always and forever. Thanks for being there for me, now let me be there for you.
iii

Acknowledgments
I would like to acknowledge the many people without whom I could not have com-
pleted this dissertation. First, I thank my advisor, Dr. Nathaniel J. Davis, IV. His guidance
throughout the research and editorial help throughout the writing were invaluable. I would
like to thank my committee members Scott Midkiff, Tom Hou, Brian Woerner, and Srinidhi
Varadarajan for their support of this research. I would especially like to thank Tracy Mann
for his superb effort in the development of the initial models, and to Grant Jacoby, Tracy
Mann, Mike Brownfield and the scores of others for providing a sounding board for the many
varied ideas and approaches and for the occasional loaned simulation platform. I would like
to thank the United States Army and the United States Military Academy for their fund-
ing support and for allowing me this opportunity. Finally, I would like to thank my wife,
Valerie, and children, Brittany and David for their love and support throughout three long
years of researching and writing.
iv

Contents
1 Introduction 1
1.1 Problem Statement . . . . . . . . . . . . . . . . . . . . . . . . . . . . . . . . 2
1.2 Background . . . . . . . . . . . . . . . . . . . . . . . . . . . . . . . . . . . . 2
1.3 Motivation . . . . . . . . . . . . . . . . . . . . . . . . . . . . . . . . . . . . . 3
1.4 Research Questions . . . . . . . . . . . . . . . . . . . . . . . . . . . . . . . . 5
1.5 Purpose . . . . . . . . . . . . . . . . . . . . . . . . . . . . . . . . . . . . . . 6
1.6 Summary . . . . . . . . . . . . . . . . . . . . . . . . . . . . . . . . . . . . . 6
2 Background 8
2.1 Wireless Networks . . . . . . . . . . . . . . . . . . . . . . . . . . . . . . . . 8
2.1.1 Cellular Communications Systems . . . . . . . . . . . . . . . . . . . . 9
2.2 UMTS . . . . . . . . . . . . . . . . . . . . . . . . . . . . . . . . . . . . . . . 13
2.2.1 UMTS Air Interface . . . . . . . . . . . . . . . . . . . . . . . . . . . 15
2.2.2 GPRS — UMTS Packet Domain Architecture . . . . . . . . . . . . . . 15
2.2.3 UMTS Protocol Stack (Control and User Plane) . . . . . . . . . . . . 17
2.2.4 GPRS Mobility Management and Session Management . . . . . . . . 22
v

2.2.5 Radio Resource Management . . . . . . . . . . . . . . . . . . . . . . 25
2.2.6 UMTS Protocol Interaction Diagrams . . . . . . . . . . . . . . . . . . 26
2.2.7 UMTS Summary . . . . . . . . . . . . . . . . . . . . . . . . . . . . . 31
2.3 IEEE 802.11 Wireless Local Area Networks . . . . . . . . . . . . . . . . . . . 32
2.3.1 System Architecture . . . . . . . . . . . . . . . . . . . . . . . . . . . 34
2.3.2 WLAN Frame Structure . . . . . . . . . . . . . . . . . . . . . . . . . 37
2.3.3 WLAN Protocol Architecture . . . . . . . . . . . . . . . . . . . . . . 41
2.3.4 WLAN Physical Layer (PHY) . . . . . . . . . . . . . . . . . . . . . . 42
2.3.5 WLAN Medium Access Control (MAC) . . . . . . . . . . . . . . . . . 43
2.3.6 Interframe Spacing . . . . . . . . . . . . . . . . . . . . . . . . . . . . 44
2.3.7 Distributed Coordination Function (DCF) . . . . . . . . . . . . . . . 45
2.3.8 Point Coordination Function (PCF) . . . . . . . . . . . . . . . . . . . 47
2.3.9 Fragmentation Threshold . . . . . . . . . . . . . . . . . . . . . . . . . 48
2.4 Mobile IP . . . . . . . . . . . . . . . . . . . . . . . . . . . . . . . . . . . . . 49
2.5 Aggregation . . . . . . . . . . . . . . . . . . . . . . . . . . . . . . . . . . . . 52
2.6 Summary . . . . . . . . . . . . . . . . . . . . . . . . . . . . . . . . . . . . . 52
3 Related Work 53
3.1 Interworked Wireless Systems . . . . . . . . . . . . . . . . . . . . . . . . . . 53
3.1.1 3GPP Feasibility Study . . . . . . . . . . . . . . . . . . . . . . . . . 54
3.1.2 Wireless IP Network as a Generic Platform for Location Aware Service
Support (WINE GLASS) . . . . . . . . . . . . . . . . . . . . . . . . . 55
vi

3.1.3 Broadband Radio Access for IP-based Networks (BRAIN) . . . . . . 55
3.1.4 Broadband Radio Access Network (BRAN) . . . . . . . . . . . . . . . 56
3.1.5 Vriendt et. al. . . . . . . . . . . . . . . . . . . . . . . . . . . . . . . . 56
3.1.6 Tsao and Lin . . . . . . . . . . . . . . . . . . . . . . . . . . . . . . . 57
3.2 WLAN Performance . . . . . . . . . . . . . . . . . . . . . . . . . . . . . . . 58
3.2.1 Adaptive Fragmentation . . . . . . . . . . . . . . . . . . . . . . . . . 60
3.2.2 Lettieri and Srivastava . . . . . . . . . . . . . . . . . . . . . . . . . . 61
3.2.3 Reduction of Fixed Overhead . . . . . . . . . . . . . . . . . . . . . . 62
3.3 Summary . . . . . . . . . . . . . . . . . . . . . . . . . . . . . . . . . . . . . 63
4 UMTS-WLAN Design and Methodology 64
4.1 System Definition and Assumptions . . . . . . . . . . . . . . . . . . . . . . . 66
4.1.1 UMTS Model Assumptions . . . . . . . . . . . . . . . . . . . . . . . 66
4.1.2 WLAN Model Assumptions . . . . . . . . . . . . . . . . . . . . . . . 69
4.1.3 UMTS-WLAN Interworking Assumptions . . . . . . . . . . . . . . . 71
4.2 System Services and Outcomes . . . . . . . . . . . . . . . . . . . . . . . . . 72
4.3 Performance Metrics . . . . . . . . . . . . . . . . . . . . . . . . . . . . . . . 73
4.3.1 Protocol Interaction . . . . . . . . . . . . . . . . . . . . . . . . . . . 73
4.3.2 DCH Utilization . . . . . . . . . . . . . . . . . . . . . . . . . . . . . 73
4.3.3 Data Session Setup Delay . . . . . . . . . . . . . . . . . . . . . . . . 73
4.3.4 Application Response Time . . . . . . . . . . . . . . . . . . . . . . . 74
4.4 Simulation Parameters . . . . . . . . . . . . . . . . . . . . . . . . . . . . . . 75
vii
4.4.1 WLAN PCF Functionality . . . . . . . . . . . . . . . . . . . . . . . . 75
4.4.2 WLAN Access Point Functionality . . . . . . . . . . . . . . . . . . . 75
4.4.3 WLAN Physical Layer Characteristics . . . . . . . . . . . . . . . . . 76
4.4.4 WLAN Data Rate . . . . . . . . . . . . . . . . . . . . . . . . . . . . 76
4.4.5 CFP and Beacon Intervals . . . . . . . . . . . . . . . . . . . . . . . . 76
4.4.6 UMTS Cell State . . . . . . . . . . . . . . . . . . . . . . . . . . . . . 78
4.5 Simulation Factors . . . . . . . . . . . . . . . . . . . . . . . . . . . . . . . . 78
4.5.1 Application Profile . . . . . . . . . . . . . . . . . . . . . . . . . . . . 78
4.5.2 FTP File Size . . . . . . . . . . . . . . . . . . . . . . . . . . . . . . . 79
4.5.3 Client Access Mode . . . . . . . . . . . . . . . . . . . . . . . . . . . . 79
4.5.4 Number of Clients . . . . . . . . . . . . . . . . . . . . . . . . . . . . 79
4.6 Evaluation Technique . . . . . . . . . . . . . . . . . . . . . . . . . . . . . . . 80
4.7 Traffic Models . . . . . . . . . . . . . . . . . . . . . . . . . . . . . . . . . . . 80
4.7.1 Wireless Client Traffic Model . . . . . . . . . . . . . . . . . . . . . . 81
4.7.2 File Transfer Protocol (FTP) Application . . . . . . . . . . . . . . . . 81
4.7.3 E-mail Application . . . . . . . . . . . . . . . . . . . . . . . . . . . . 82
4.7.4 HTTP (Web) Application . . . . . . . . . . . . . . . . . . . . . . . . 82
4.8 Simulation Scenarios . . . . . . . . . . . . . . . . . . . . . . . . . . . . . . . 83
4.8.1 Existing WLAN vs UMTS-WLAN Scenario . . . . . . . . . . . . . . 84
4.8.2 Existing UMTS vs UMTS-WLAN Scenario . . . . . . . . . . . . . . . 84
4.8.3 Mixed Client Access WLAN–UMTS Scenario . . . . . . . . . . . . . 85
viii

4.9 UMTS-WLAN Interworked System Design . . . . . . . . . . . . . . . . . . . 86
4.9.1 Network Level . . . . . . . . . . . . . . . . . . . . . . . . . . . . . . . 87
4.9.2 Enhanced WLAN Access Point Node (UWLAN_AP) . . . . . . . . . 88
4.9.3 UWLAN_AP_Control Process Module . . . . . . . . . . . . . . . . . 88
4.9.4 Enhanced User Equipment Node (UW) . . . . . . . . . . . . . . . . . 94
4.9.5 Core Network (CN) . . . . . . . . . . . . . . . . . . . . . . . . . . . . 97
4.9.6 Serving GPRS Support Node (SGSN) Process Module . . . . . . . . 97
4.10 Summary . . . . . . . . . . . . . . . . . . . . . . . . . . . . . . . . . . . . . 99
5 UMTS-WLAN Results 102
5.1 Statistical Accuracy . . . . . . . . . . . . . . . . . . . . . . . . . . . . . . . . 103
5.2 Model Verification and Validation . . . . . . . . . . . . . . . . . . . . . . . . 105
5.2.1 Model Verification . . . . . . . . . . . . . . . . . . . . . . . . . . . . 105
5.2.2 Model Validation . . . . . . . . . . . . . . . . . . . . . . . . . . . . . 106
5.3 Benefits of Interworking UMTS-WLAN . . . . . . . . . . . . . . . . . . . . . 111
5.4 Summary . . . . . . . . . . . . . . . . . . . . . . . . . . . . . . . . . . . . . 113
6 AGG-MAC Design and Methodology 115
6.1 AGG-MAC Protocol Design . . . . . . . . . . . . . . . . . . . . . . . . . . . 116
6.1.1 When to perform aggregation operation . . . . . . . . . . . . . . . . . 118
6.1.2 What is the upper limit for aggregate frame size . . . . . . . . . . . . 118
6.1.3 Which packets selected as candidates for aggregation . . . . . . . . . 119
ix
6.2 AGG-MAC Definition and Assumptions . . . . . . . . . . . . . . . . . . . . 120
6.2.1 AGG-MAC Association . . . . . . . . . . . . . . . . . . . . . . . . . . 120
6.2.2 AGG-MAC Frame Format . . . . . . . . . . . . . . . . . . . . . . . . 120
6.3 Performance Metrics . . . . . . . . . . . . . . . . . . . . . . . . . . . . . . . 122
6.3.1 Throughput . . . . . . . . . . . . . . . . . . . . . . . . . . . . . . . . 122
6.3.2 End-to-End Delay . . . . . . . . . . . . . . . . . . . . . . . . . . . . . 122
6.3.3 Data Dropped . . . . . . . . . . . . . . . . . . . . . . . . . . . . . . . 123
6.3.4 Voice Packet Delay Variation (Jitter) . . . . . . . . . . . . . . . . . . 123
6.3.5 Application Response Time . . . . . . . . . . . . . . . . . . . . . . . 123
6.3.6 Amount of Aggregation . . . . . . . . . . . . . . . . . . . . . . . . . . 124
6.4 Simulation Parameters . . . . . . . . . . . . . . . . . . . . . . . . . . . . . . 124
6.5 Simulation Factors . . . . . . . . . . . . . . . . . . . . . . . . . . . . . . . . 125
6.5.1 Packet Size . . . . . . . . . . . . . . . . . . . . . . . . . . . . . . . . 125
6.5.2 Number of Transmitting Stations . . . . . . . . . . . . . . . . . . . . 126
6.5.3 BER . . . . . . . . . . . . . . . . . . . . . . . . . . . . . . . . . . . . 126
6.5.4 Fragmentation threshold . . . . . . . . . . . . . . . . . . . . . . . . . 127
6.5.5 Traffic models . . . . . . . . . . . . . . . . . . . . . . . . . . . . . . . 128
6.6 Evaluation Techniques . . . . . . . . . . . . . . . . . . . . . . . . . . . . . . 129
6.7 Simulation Design . . . . . . . . . . . . . . . . . . . . . . . . . . . . . . . . . 129
6.7.1 Effect of Errors on the Channel . . . . . . . . . . . . . . . . . . . . . 130
6.7.2 AGG-MAC Infrastructure Mode . . . . . . . . . . . . . . . . . . . . . 133
x

6.7.3 Trace Traffic . . . . . . . . . . . . . . . . . . . . . . . . . . . . . . . . 135
6.7.4 Land Warrior Trace Traffic . . . . . . . . . . . . . . . . . . . . . . . . 136
6.7.5 ACM SIGCOMM’01 Trace Traffic . . . . . . . . . . . . . . . . . . . . 139
6.7.6 UMTS-WLAN w/AGG-MAC . . . . . . . . . . . . . . . . . . . . . . 142
6.8 Summary . . . . . . . . . . . . . . . . . . . . . . . . . . . . . . . . . . . . . 143
7 AGG-MAC Results 144
7.1 Model Verification . . . . . . . . . . . . . . . . . . . . . . . . . . . . . . . . 144
7.2 Model Validation . . . . . . . . . . . . . . . . . . . . . . . . . . . . . . . . . 146
7.3 Results for Effect of Errors on the Channel . . . . . . . . . . . . . . . . . . 148
7.3.1 Single Transmitting Station . . . . . . . . . . . . . . . . . . . . . . . 148
7.3.2 Multiple Transmitting Stations . . . . . . . . . . . . . . . . . . . . . 151
7.3.3 Burstiness of the Noise . . . . . . . . . . . . . . . . . . . . . . . . . . 154
7.4 AGG-MAC Infrastructure Mode . . . . . . . . . . . . . . . . . . . . . . . . . 155
7.5 Land Warrior Trace Results . . . . . . . . . . . . . . . . . . . . . . . . . . . 159
7.6 ACM SIGCOMM’01 Trace Results . . . . . . . . . . . . . . . . . . . . . . . 161
7.7 UMTS-WLAN with AGG-MAC Results . . . . . . . . . . . . . . . . . . . . 164
7.8 Summary . . . . . . . . . . . . . . . . . . . . . . . . . . . . . . . . . . . . . 168
8 Conclusions 172
8.1 Significant Results . . . . . . . . . . . . . . . . . . . . . . . . . . . . . . . . 173
8.2 UMTS-WLAN System Significant Results . . . . . . . . . . . . . . . . . . . 173
xi

8.2.1 Benefits to a tightly-coupled UMTS-WLAN interworked system . . . 174
8.2.2 UMTS-WLAN System Performance . . . . . . . . . . . . . . . . . . . 175
8.3 AGG-MAC Protocol Enhancement Significant Results . . . . . . . . . . . . . 176
8.3.1 Design of the WLAN Packet Aggregation MAC protocol (AGG-MAC) 177
8.3.2 Baseline Performance . . . . . . . . . . . . . . . . . . . . . . . . . . . 177
8.3.3 AGG-MAC Performance Over a Range of Scenarios . . . . . . . . . . 178
8.3.4 AGG-MAC Performance Incorporated in a UMTS-WLAN System . . 180
8.4 Recommendations for Future Research . . . . . . . . . . . . . . . . . . . . . 180
8.4.1 Loose Coupled Design . . . . . . . . . . . . . . . . . . . . . . . . . . 181
8.4.2 QoS or Alternative Queuing over the WLAN Access Network . . . . 181
8.4.3 Adaptive Fragmentation Threshold . . . . . . . . . . . . . . . . . . . 182
8.5 Summary . . . . . . . . . . . . . . . . . . . . . . . . . . . . . . . . . . . . . 183
A Simulation Data Tables 190
xii

List of Figures
2.1 UMTS System Overview . . . . . . . . . . . . . . . . . . . . . . . . . . . . . 14
2.2 UMTS Packet Domain Architecture [1] . . . . . . . . . . . . . . . . . . . . . 16
2.3 UMTS User Plane [2] . . . . . . . . . . . . . . . . . . . . . . . . . . . . . . . 17
2.4 UMTS Control Plane [2] . . . . . . . . . . . . . . . . . . . . . . . . . . . . . 18
2.5 Relationship Between the RRC, RANAP, Signaling Connection and RAB . . 20
2.6 Packet Mobility Management (PMM) States [1] . . . . . . . . . . . . . . . . 22
2.7 Session Management (SM) States . . . . . . . . . . . . . . . . . . . . . . . . 23
2.8 RRC Connection Setup . . . . . . . . . . . . . . . . . . . . . . . . . . . . . 27
2.9 Transaction Reasoning . . . . . . . . . . . . . . . . . . . . . . . . . . . . . . 28
2.10 GMM Attach Procedure . . . . . . . . . . . . . . . . . . . . . . . . . . . . . 29
2.11 PDP Activation and RAB Assignment Procedures . . . . . . . . . . . . . . . 30
2.12 Service Request . . . . . . . . . . . . . . . . . . . . . . . . . . . . . . . . . . 32
2.13 WLAN Infrastructure Basic Sevice Set (IBSS) . . . . . . . . . . . . . . . . . 35
2.14 WLAN Infrastructure Mode . . . . . . . . . . . . . . . . . . . . . . . . . . . 36
2.15 IEEE 802.11 Frame Structure [3] . . . . . . . . . . . . . . . . . . . . . . . . 37
xiii

2.16 IEEE 802.11 Frame Control Field [3] . . . . . . . . . . . . . . . . . . . . . . 38
2.17 IEEE 802.11 Protocol Reference Model [3] . . . . . . . . . . . . . . . . . . . 42
2.18 Medium Access and Interframe Spacing [3] . . . . . . . . . . . . . . . . . . . 43
2.19 Interframe Spacing in IEEE 802.11 [3] . . . . . . . . . . . . . . . . . . . . . 44
2.20 MAC Reference Model [3] . . . . . . . . . . . . . . . . . . . . . . . . . . . . 46
2.21 Contention-Free Period using SuperFrames [3] . . . . . . . . . . . . . . . . . 47
2.22 PCF Data Transfer with 4 Stations [3] . . . . . . . . . . . . . . . . . . . . . 48
2.23 Mobile IP Tunneling [4]. . . . . . . . . . . . . . . . . . . . . . . . . . . . . . 50
3.1 WLAN Goodput vs. MSDU for various BER . . . . . . . . . . . . . . . . . . 61
4.1 UMTS-WLAN Network System Level Simulation . . . . . . . . . . . . . . . 67
4.2 Enhanced WLAN AP (UWLAN_AP) Node Model . . . . . . . . . . . . . . 89
4.3 UWLAN_AP Control Process Model . . . . . . . . . . . . . . . . . . . . . . 90
4.4 UWLAN_AP Access Control Table Entry . . . . . . . . . . . . . . . . . . . 91
4.5 Modified GMM Attach Procedure . . . . . . . . . . . . . . . . . . . . . . . . 92
4.6 Modified GMM Attach Request Message Format . . . . . . . . . . . . . . . . 93
4.7 PDP Context Activation and Modified RAB Assignment Procedures . . . . . 94
4.8 Enhanced User Equipment (UW) Node Model . . . . . . . . . . . . . . . . . 95
4.9 UMTS Core Network (CN) Node Model . . . . . . . . . . . . . . . . . . . . 98
4.10 Serving GPRS Support Node (SGSN) Process Module . . . . . . . . . . . . . 99
5.1 Simplified Analytical Model . . . . . . . . . . . . . . . . . . . . . . . . . . . 107
xiv
5.2 CFP Timing and MAC/PHY Overhead . . . . . . . . . . . . . . . . . . . . . 109
5.3 Simulated vs Theoretical Results . . . . . . . . . . . . . . . . . . . . . . . . 111
5.4 Reserved DCH Channels (DCH Count vs Time (min)) . . . . . . . . . . . . 112
5.5 Queued Requests for DCH Channels (Delayed or Denied Service) . . . . . . 113
6.1 AGG-MAC Protocol Overview . . . . . . . . . . . . . . . . . . . . . . . . . . 117
6.2 WLAN Capabilities Info Field [3] . . . . . . . . . . . . . . . . . . . . . . . . 121
6.3 MAC-layer model parameters for BER . . . . . . . . . . . . . . . . . . . . . 132
6.4 Baseline 50 Station AGG-MAC Network . . . . . . . . . . . . . . . . . . . . 133
6.5 Network Configuration . . . . . . . . . . . . . . . . . . . . . . . . . . . . . . 134
6.6 Land Warrior Network Heirarchy . . . . . . . . . . . . . . . . . . . . . . . . 137
6.7 SIGCOMM’01 Network Configuration [5] . . . . . . . . . . . . . . . . . . . . 141
6.8 UMTS-WLAN with AGG-MAC Network Diagram . . . . . . . . . . . . . . . 143
7.1 Aggregation Baseline Network . . . . . . . . . . . . . . . . . . . . . . . . . . 145
7.2 Avg. Throughput (Constant 2Mbps Source) . . . . . . . . . . . . . . . . . . 146
7.3 Avg. Dropped Data (Constant 2Mbps Source) . . . . . . . . . . . . . . . . . 147
7.4 Avg. WLAN Delay (Constant 2Mbps Source) . . . . . . . . . . . . . . . . . 147
7.5 Original WLAN Throughput vs. Packet Size under varied BER . . . . . . . 149
7.6 AGG-MAC WLAN Throughput vs. Packet Size under varied BER . . . . . . 150
7.7 WLAN Throughput for BER = 10−4 . . . . . . . . . . . . . . . . . . . . . . 151
7.8 WLAN Throughput, Multiple Stations, Error Free . . . . . . . . . . . . . . . 152
xv

7.9 Original WLAN Throughput vs. Packet Size under varied BER (50 stations) 153
7.10 AGG-MACWLAN Throughput vs. Packet Size under varied BER (50 stations)153
7.11 Multiple Station Total WLAN Throughput for BER=10−4 . . . . . . . . . . 154
7.12 WLAN Throughput vs. Packet Size under varied length burst errors (BER =
10−4) . . . . . . . . . . . . . . . . . . . . . . . . . . . . . . . . . . . . . . . . 155
7.13 Average Throughput vs. Time . . . . . . . . . . . . . . . . . . . . . . . . . . 156
7.14 Voice End-to-End Delay vs. Time . . . . . . . . . . . . . . . . . . . . . . . . 156
7.15 Voice Delay Variation vs. Time . . . . . . . . . . . . . . . . . . . . . . . . . 157
7.16 Avg. HTTP Page Response . . . . . . . . . . . . . . . . . . . . . . . . . . . 158
7.17 Avg. FTP Upload Reponse . . . . . . . . . . . . . . . . . . . . . . . . . . . 158
7.18 Avg. Aggregation (Packets per Frame) . . . . . . . . . . . . . . . . . . . . . 159
7.19 SIGCOMM’01 Network Simulation Layout . . . . . . . . . . . . . . . . . . . 161
7.20 SIGCOMM’01 Client Data Exchange (52 hour Trace) . . . . . . . . . . . . . 162
7.21 SIGCOMM’01 Client Data Exchange (11:00 - 11:10 Trace) . . . . . . . . . . 163
7.22 UMTS-WLAN with AGG-MAC: WLAN Average Total Throughput (Mbps) 165
7.23 UMTS-WLAN with AGG-MAC: Email Download Response Time . . . . . . 167
7.24 UMTS-WLAN with AGG-MAC: HTTP Page Response Time . . . . . . . . . 168
7.25 UMTS-WLAN with AGG-MAC: FTP Download Response Time . . . . . . . 169
7.26 UMTS-WLAN with AGG-MAC: FTP Download Response Time . . . . . . . 169
xvi

List of Tables
2.1 Comparison of IEEE 802.11 WLAN Standards . . . . . . . . . . . . . . . . . 33
2.2 IEEE 802.11 Valid Type and Subtype Combinations . . . . . . . . . . . . . . 38
3.1 3GPP Scenarios for Interworking WLAN . . . . . . . . . . . . . . . . . . . . 54
4.1 UMTS-WLAN Simulation Parameters . . . . . . . . . . . . . . . . . . . . . 75
4.2 UMTS-WLAN Simulation Factors . . . . . . . . . . . . . . . . . . . . . . . . 78
4.3 UMTS-WLAN FTP Application Attributes . . . . . . . . . . . . . . . . . . 82
4.4 UMTS-WLAN E-mail Application Attributes . . . . . . . . . . . . . . . . . 82
4.5 UMTS-WLAN HTTP (Web) Application Attributes . . . . . . . . . . . . . . 83
5.1 FTP Download Response Time (sec) for a UW in WLAN Client Access Mode 104
5.2 HTTP Response Time (sec) for UWs in UMTS Client Access Mode . . . . . 104
6.1 AGG-MAC Simulation Parameters . . . . . . . . . . . . . . . . . . . . . . . 125
6.2 AGG-MAC Simulation Factors . . . . . . . . . . . . . . . . . . . . . . . . . . 125
6.3 AGG-MAC VoIP Application Attributes . . . . . . . . . . . . . . . . . . . . 128
6.4 AGG-MAC Simulation Factors for BER . . . . . . . . . . . . . . . . . . . . 131
xvii
6.5 Overall Statistics for SIGCOMM’01 Traffic Trace . . . . . . . . . . . . . . . 140
7.1 Top 5 Land Warrior Senders AGG-MAC Improvment . . . . . . . . . . . . . 160
7.2 SIGCOMM’01 AGG-MAC Performance Improvement Results) . . . . . . . . 164
A.1 FTP Download Response Time vs. FTP Filesize (1UE vs. 1UW) . . . . . . 190
A.2 SIGCOMM 2001 AGG-MAC Performance Results . . . . . . . . . . . . . . . 191
A.3 WLAN Throughput (bps) vs. Number of Clients . . . . . . . . . . . . . . . . 191
A.4 Email Download Response Time (sec) vs. Number of Clients . . . . . . . . . 192
A.5 HTTP Page Response Time (sec) vs. Number of Clients . . . . . . . . . . . 193
A.6 FTP Download Response Time (sec) vs. Number of Clients . . . . . . . . . . 194
A.7 FTP Upload Response Time (sec) vs. Number of Clients . . . . . . . . . . . 195
A.8 Amount of Aggregation (packets per frame) vs. Number of Clients . . . . . . 196
xviii

Chapter 1
Introduction
The continued growth of wireless communications networks and their increased ubiq-
uity have transformed our society. The exponential growth of the Internet and the prolif-
eration of cellular mobile systems and WLAN systems throughout both home and business
applications generated both competition and cooperation among the different systems. Aca-
demic researchers and service providers have both sought ways to integrate the WLAN
systems with mobile cellular systems. The desire was to gain the increased capacity and
indoor service quality provided by WLAN working together with the mobility provided by
cellular systems. This research effort focused first on interworking high capacity WLAN
"hot spots" with the emerging 3G, specifically Universal Mobile Telecommunications System
(UMTS), cellular networks and subsequently on a WLAN MAC protocol enhancement to
improve performance for small packets.
This chapter defines the problem investigated by this research. The remainder of this
chapter is organized as follows. Section 1.1 states the research problem investigated. A brief
background is provided in Section 1.2 with motivation for this work provided in Section 1.3.
Section 1.4 presents the research questions addressed by this work and a Section 1.5 describes
the intended purpose of this research. Finally, Section 1.6 summarizes the significant results.
1
J. Scot Ransbottom Chapter 1. Introduction 2
1.1 Problem Statement
This research was two-fold in its focus and efforts. The initial phase of work focused
on the design, implementation and testing of a tightly coupled network level system designed
to provide WLAN "hot spots" interworked with 3G cellular mobile communications system,
specifically UMTS networks. The resultant network level simulation tools provided a foun-
dation for future research into the issues and trade-offs associated with protocol design and
parameterization in this type of system. The second phase of this work was the design of a
AGG-MAC, a WLANMAC layer, protocol designed to significantly improve throughput and
reduce latency for data traffic consisting of packets of less than maximal size. The identifica-
tion of the bottleneck associated with the transmission of small frame sizes and its severity
was identified as the result of UMTS-WLAN interworked system simulations. The utility of
AGG-MAC is not restricted to interworked UMTS-WLAN systems or even to infrastructure
based systems, but AGG-MAC benefits quite a wide range of WLAN configurations.
The primary contributions of this research were two-fold. The first contribution was
the design and implementation in OPNETTM of a network level simulation tool to support
future research in tightly coupled interworked system consisting of WLAN "hot spots" and
UMTS cellular systems. The second significant contribution was the design, implementation
and testing of AGG-MAC, a WLAN MAC layer protocol enhancement designed to improve
performance for a broad range of wireless LAN configurations and traffic patterns.
1.2 Background
Cellular telephone systems were originally analog systems designed to provide voice
communications to the outdoor, traveling user. Cellular systems have evolved significantly
based on technological advancements. The coverage and the quality of the service have both
increased dramatically, but as it was not within the original scope of the design of cellular

J. Scot Ransbottom Chapter 1. Introduction 3
networks, indoor coverage and data capacity are still significantly limited. WLAN systems
were designed for indoor, data traffic and have demonstrated their ability support the needs of
limited mobility indoor clients. For these reasons, many supported the eventual convergence
of the two communications networks to provide better service and improved coverage for
their users [6]. The standards developing bodies attempted to define standards for the
interoperation of the two systems [7] and several researchers sought to determine the best
methods to interwork the two systems.
Capacity of a WLAN system is dependent on many factors. One factor, which became
increasingly apparent during our early research, was the overhead associated with small
packet sizes. Under traffic conditions commonly found in current cellular data traffic, we
observed that the throughput on an 11Mbps WLAN with 35 users was significantly less
than expected. The per frame overhead in the IEEE 802.11 WLAN standard [3] significantly
limits capacity for all users on the WLAN network for collections of small data packets.
Much work has been done to improve WLAN performance by selecting an appropriate size
for a data frame based upon limiting the largest allowable frame size, but little work has
been done to improve performance for smaller data objects. Much of the conducted WLAN
research avoided this issue by selecting a fixed (relatively large) packet size for all data
on the WLAN network. We sought to address the issue of overhead for small frame sizes
and proposed a solution that improved performance and was applicable for a wide range of
network situations.
1.3 Motivation
The first phase of this work was motivated by the need to have a network level
simulation tool capable of testing, evaluating and refining protocols and standards for the
interworking of tightly integrated UMTS and WLAN systems. The potential benefits of a
tightly integrated system are not yet fully understood. While some believed that using

J. Scot Ransbottom Chapter 1. Introduction 4
current cellular authentication, authorization and accounting (AAA), roaming, security and
other subsystems may yield significant benefit, it was not yet clear and warranted further
study. The trade-offs and best design decisions associated with an interworked system were
not yet known.
The 3rd Generation Partnership Project (3GPP) was one of the primary sources of
standardization efforts for 3G cellular systems. Much of their work focused on the convergence
of voice and data communications. WLAN is capable of providing significantly higher
capacity for indoor environments albeit of limited range. For this reason, the 3GPP Services
and Systems Aspects (SA1) working group published a feasibility study and further sought
to develop standards for the interworking of 3GPP systems with WLAN systems [7]. Their
study identified six scenarios ranging in amount of interoperability between the two systems.
These scenarios are presented in Section 3.1.1. We sought to provide a robust network level
simulation environment capable of supporting future research on UMTS-WLAN interworked
systems.
The second phase of this research was motivated by the desire to improve the realizable
capacity over a WLAN channel for commonly occurring traffic patterns. While it is possible
that some equipment vendors are researching aggregation, it is equally likely that commercial
interests will prevent the timely publication of their results. This research was conducted
after simulation of a heterogeneous wireless system consisting of hosts accessing via either
UMTS cellular system or WLAN system indicated that performance over an 11MbpsWLAN
was less than expected. Upon observing that the fixed overhead associated with the WLAN
protocols was the primary contributor to the lower performance, we sought to reduce the
per packet overhead. We further realized that, for our target system, all traffic from a client
station was routed through the Access Point (AP). Because the design was for a public access
"hot spot," the probability of traffic among stations on the WLAN was near zero. In such
systems, all of the traffic was routed directly from the client station (STA) to the AP, and
that in such a case, the routing problem is trivial. Based on these criterion, we designed

J. Scot Ransbottom Chapter 1. Introduction 5
the AGG-MAC protocol and found that its benefits went far beyond our original, limited
scenario.
1.4 Research Questions
This research addressed the following questions regarding wireless network perfor-
mance. In each case, the performance metrics were either throughput, end-to-end delay or
they were compared to previously designed metrics for an existing network level simulation.
We compared our enhancements to original, baseline system performance where possible.
1. What are the benefits associated with a tightly-coupled UMTS-WLAN interworked
system?
2. How does a tightly-coupled, interworked UMTS-WLAN system perform?
3. What is the design for an aggregated WLAN MAC (AGG-MAC) protocol?
4. How does AGG-MAC performance compare with original WLAN MAC protocol for a
single deterministic source with point-to-point, WLAN communications pair?
5. How does AGG-MAC performance compare with original WLANMAC protocol across
a wide range of traffic loads and higher layer protocols?
6. Can AGG-MAC improve WLAN performance when carrying traffic loads designed for
UMTS systems?
7. What are some potentially useful system configurations for incorporating AGG-MAC?
J. Scot Ransbottom Chapter 1. Introduction 6
1.5 Purpose
The purpose of this research was two-fold. We first defined, implemented and tested a
UMTS-WLAN network level simulation tool which could be used for testing future potential
standards and protocols. The second phase of our work was to develop an extension to the
existing WLAN protocol set that limits protocol overhead and improves performance while
providing support for quality of service (QoS) dependent applications. The original impetus
of this research was to design a mechanism that ensured that performance was not reduced
when wireless systems operated with traffic patterns optimized for UMTS channels via the
much higher capacity, albeit shared, channel of a WLAN.
1.6 Summary
This research effort focused on tools to evaluate and test wireless communications
networks designed to support the convergence of two complementary access layers. The
specific problem being addressed was two-fold. First, we created a simulation tools set
for UMTS-WLAN interworked network systems, and finally, we designed, implemented and
tested AGG-MAC, a WLAN protocol enhancement designed to improve performance for
commonly occurring traffic patterns in which the frame size is suboptimal. The research
questions presented in Section 1.4 are answered by the design of simulations which can be
analytically confirmed and through comparison of simulation results with analytical results.
For cases of more complex, stochastic simulations, a comparison with existing work from
other researchers or from performance of the un-enhanced system simulation was performed.
This chapter defined the research problems addressed in the remainder of the docu-
ment. The rest of the document is organized as follows. Chapter 2 presents the theoretical
background. Chapter 3 presents a review of relevant literature for both UMTS-WLAN in-
terworking and packet level aggregation in the context of WLAN. Chapter 4 describes the

J. Scot Ransbottom Chapter 1. Introduction 7
methodology while Chapter 5 presents results specific to the UMTS-WLAN interworking
simulation tools. Chapter 6 describes the design and methodology used to develop and test
the WLAN packet aggregation protocol enhancement and provides an overview of the simu-
lation design with results specific to AGG-MAC. Results for AGG-MAC testing are provided
in Chapter 7. Finally, Chapter 8 discusses the results and their significance in the form of a
conclusion.

Chapter 2
Background
This chapter provides the theoretical background for this work in the area of wireless
networks, aggregation, and traffic patterns and sources.
2.1 Wireless Networks
This section provides the theoretical background in both the area of Wireless Local
Area Networks (WLANs) and in data networks in Third Generation (3G) wireless networks.
A basic theoretical background in 3G wireless networks and theWLAN family of technologies
is required to address the topic of this research effort. Section 2.1.1 provides an introduction
to 3G mobile communications and concludes with an overview of the evolution in the mobile
communications. Section 2.2 provides an introduction to the Universal Mobile Telecom-
munications System (UMTS), which includes a detailed description of the UMTS 3GPP
standards, specifically in the UMTS packet switch (PS) domain. The UMTS-WLAN inter-
working research was conducted in conjunction with masters student Tracy Mann. Most of
the UMTS-WLAN simulation work was presented in [8]. Section 2.3 presents an introduction
to the WLAN family of technologies that includes a detailed discussion of the IEEE 802.11
8

J. Scot Ransbottom Chapter 2. Background 9
standards, theWLAN system architecture, and protocol architecture, focusing on theWLAN
medium access control (MAC) layer. Current related work in the areas of UMTS-WLAN
interworking and in WLAN MAC protocol enhancements are presented later in Chapter 3.
2.1.1 Cellular Communications Systems
3G wireless refers to the developing technology standards for the next generation of
mobile communications systems. One of the main goals of the standardization efforts of 3G
is to create a universal infrastructure that is able to support existing and future services.
This requires that the infrastructure be designed so that it can evolve as technology changes,
without compromising the existing services on the existing networks. Separation of access
technology, transport technology, service technology and user applications from each other
make this demanding requirement possible [9].
Mobile Communications Technology Evolution
Mobile communications technology evolution is typically classified in terms of gen-
erations of the technology. First Generation (1G) is the term used for the analog mobile
systems that were deployed in the mid 1980s. Second Generation (2G) cellular systems refer
to the systems deployed in the early 1990s that utilized digital communications techniques
like TDMA and CDMA. The 1G and 2G cellular systems were initially designed to provide
circuit-switched voice service, and were later modified to provide low bit rate data service.
Current Second Generation (2G) cellular systems are primarily voice systems, with data
rates up to 19.2kbps [10]. These include Global System for Mobile Communications (GSM),
IS-136 (TDMA) and IS-95 (CDMA). Efforts aimed at increasing the data rates provided
by 2G systems, typically through the use of higher order modulation, are termed 2.5G sys-
tems. Emerging 3G cellular standards will replace the 2G radio interface to provide higher
data rates and provide inherent support for packet data, while leaving the 2G core network
J. Scot Ransbottom Chapter 2. Background 10
basically unchanged. GSM’s General Packet Radio Service (GPRS) is the leading packet
data network proposal for Third Generation (3G) wireless systems. The goal of 3G systems
is to offer data rates up to 2Mbps to support wireless packet data. The focus of Fourth
Generation (4G) systems is on future modifications to the core network, possibly moving to
an IP-based infrastructure. 4G system standards have not yet been defined at this time.
First Generation (1G)
During the early 1980s, analog cellular telephone systems were deployed. At that
time, each country developed its own system, limiting usage to within country boundaries [6].
In North America, the Advanced Mobile Phone System (AMPS) was the first commercial
cellular system to be deployed. It was a frequency modulated (FM) analog mobile radio
system using frequency division multiple access (FDMA) with 30kHz channels occupying
the 824MHz − 894MHz frequency band [10]. Analog cellular systems were limited in both
system capacity, and in support for data traffic. In 1993, Cellular Digital Packet Data
(CDPD) added support for data traffic in the AMPS frequency band. CDPD was a packet
switched network that used a 30kHz AMPS channel to provide mobile access to packet
data networks at a rate of 19.2kbps [10]. Mobile data users were able to transmit on idle
AMPS voice channels, but were required to hop to a different channel when a voice user
began to transmit. CDPD was termed a packet overlay network since it utilized the existing
base station equipment of cellular network, and required no additional frequency spectrum.
The core network of CDPD consisted of packet switches, separate from the AMPS Mobile
Switching Center (MSC), which provided connectivity to public data networks. CDPD was
also utilized as a packet overlay network for 2G digital voice systems.

J. Scot Ransbottom Chapter 2. Background 11
Second Generation (2G)
The digital cellular systems deployed in the early 1990s are called 2G wireless systems.
2G systems use digital modulation schemes, as well as digital multiple access schemes such
as time division multiple access (TDMA) and code division multiple access (CDMA). The
three primary 2G systems are TDMA (IS-136), CDMA (IS-95), and GSM.
The United States Digital Cellular (USDC/IS-54) system was deployed in North
America in 1991. It had a digital TDMA data channel, but utilized the AMPS analog control
channel. In 1993, IS-136 added a digital control channel for a completely digital system.
These TDMA 2G systems operated in the AMPS frequency band of 824MHz − 894MHz
[10]. CDMA (IS-95) systems using Direct Sequence Spread Spectrum (DSSS) were deployed
in the United States in 1993. They also operated in the AMPS frequency band. Additional
spectrum was added in the 1850-1990 MHz frequency band to support CDMA carriers. This
spectrum is commonly called Personal Communications Services (PCS) [11].
GSM was introduced in Europe in 1990. The goal of GSM was to replace the various
European 1G analog systems with a single digital system. GSM operates in the 890MHz−960MHz frequency band, and a PCS version termed Digital Cellular System (DCS) 1800
operated in the 1.8GHz − 2.0GHz band [10]. GSM used slow frequency hopping, and
a 200kHz carrier bandwidth. Its frame structure supported eight users per carrier at a
maximum data rate of 24.7kbps [10]. GSM is the most widely used 2G standard, accounting
for about 66 percent of the world market [6]. Standards were developed to provide both
data service, and increase the data rate in GSM networks. General Packet Radio Service
(GPRS) was a packet overlay network designed to provide data services in a GSM network.
GPRS utilized the same frame structure as GSM, and supported a maximum data rate
of 21.4kbps [12]. The GPRS infrastructure added two new nodes to the GSM network,
the Gateway GPRS Support Node (GGSN) and the Serving GPRS Support Node (SGSN).
The GGSN served as a gateway to external data networks and tunneled data traffic to the

J. Scot Ransbottom Chapter 2. Background 12
appropriate SGSN. The SGSN was responsible for delivering data packets to the mobile
user. The 3G GPRS architecture is discussed later in Section 2.2.2 . Enhanced Data rates
for GSM Evolution (EDGE) was an ongoing effort to increase the data rate of GSM. EDGE
will provide data rates up to 384kbps over the basic GSM 200kHz channel by using higher
order modulation schemes. Both GPRS and EDGE brought the capabilities of GSM closer
to the stated goals of 3G, and they were often referred to as 2.5G standards. In order to
be commercially feasible, 3G systems must exceed the capabilities of these enhanced 2G
systems.
Third Generation (3G)
3G was a term coined by the global cellular community to indicate the next generation
of mobile service capabilities, including higher capacity and enhanced network functionali-
ties. The goal of 3G wireless systems was to provide wireless data service with data rates of
144kbps to 384kbps in wide coverage areas, and 2Mbps in local coverage areas [13][14]. Possi-
ble applications included wireless web-based access, E-mail, as well as video teleconferencing
and multimedia services consisting of mixed voice and data streams. 3G wireless standards
were being designed with the intent to support a variety of services and applications.
IMT-2000 (International Mobile Telecommunications-2000) is the International Telecom-
munication Union (ITU) globally coordinated definition of 3G wireless systems covering key
issues such as frequency spectrum use and technical standards. The ITU IMT-2000 stan-
dards are being developed with input from regional standards organizations, including the
European Telecommunications Standards Institute (ETSI) in Europe, the Telecommunica-
tions Industry Association (TIA) in the United States, the Association of Radio Industry
and Business (ARIB) in Japan, and the Telecommunications Technology Association (TTA)
in Korea. These regional organizations together have proposed IMT-2000 standards that
take into account regional concerns such as evolution from existing 2G systems, and current

J. Scot Ransbottom Chapter 2. Background 13
allocation of frequency spectrum [14].
Two international bodies were established to resolve the differences between these re-
gional proposals. The Third Generation Partnership Proposal (3GPP) worked to standardize
the proposals from ETSI, ARIB, and TTA into a single standard termed WCDMA (Wide-
band Code Division Multiple Access). The European proposal for IMT-2000 was UMTS
(Universal Mobile Telecommunications System). UMTS was an evolutionary system based
upon the currently fielded GSM. UMTS packet data services (PS) are based on the 2.5G
GSM General Packet Radio Service (GPRS) framework. The 3GPP2 was likewise standard-
izing the proposals from TIA and TTA into a single standard called CDMA2000. The North
American CDMA2000 proposal was strongly influenced both by compatibility issues with
the current IS-95 CDMA systems, and existing frequency allocations.
2.2 UMTS
Universal Mobile Telecommunications System (UMTS) is a Third Generation (3G)
wireless protocol that is part of the ITU’s IMT-2000 vision of a global family of 3G mobile
telecommunications systems. Its specifications were created by the 3GPP and the ETSI.
It is an evolutionary system based upon GSM with its packet domain based on the 2.5G
General Packet Radio Services (GPRS) framework. UMTS is expected to deliver low-cost,
high-capacity mobile communications with data rates up to 2Mbps. This research effort
focused on the 3GPP Release 1999 standards.
The following sections provide an overview of UMTS and its signaling protocols. The
intent of these sections is to provide the necessary background information on the UMTS
signaling protocols to understand the simulation design. The GPRS Mobility Management
and Session Management protocols that were used to realize the primary design goal of
interworking WLAN with UMTS in accordance with the 3GPP scenario 2 are covered in

J. Scot Ransbottom Chapter 2. Background 14
detail in Sections 2.2.4 and 2.2.6.
The main system components of the UMTS network architecture are the user equip-
ment (UE), the UMTS Terrestrial Radio Access Network (UTRAN) and the core network
(CN) as shown in Figure 2.1.
Figure 2.1: UMTS System Overview
The user equipment (UE) consists of the mobile terminal (MT), the terminal equip-
ment (TE), and the Subscriber Identity Module (SIM). The UTRAN is comprised of the
Node-B and the Radio Network Controller (RNC). The RNC is in charge of the overall
control of logical resources provided by the Node-Bs. The RNC manages the air interface
resources between its Node-Bs and their associated UEs. The Node-B provides logical re-
sources, corresponding to the resources of one or more cells, to the RNC. It is responsible for
the radio transmission and reception in the cells it controls. A Node-B can control several
cells, managing the network air interface for its associated UEs. It is responsible for relaying
packets between the UEs and its controlling RNC. The Node-B is also responsible for as-
sisting the RNC with radio resource management through the Node-B Application Protocol
(NBAP) signaling messages. The Serving GPRS support node (SGSN) keeps track of the
location of individual UEs and performs security functions and access control. The Gateway
GPRS support node encapsulates packets received from external packet networks (IP) and
routes them to the SGSN.

J. Scot Ransbottom Chapter 2. Background 15
2.2.1 UMTS Air Interface
3GPP TS 25.302 defines the access scheme for UMTS as Wideband Code Division
Multiple Access (WCDMA) with a chip rate of 3.84Mcps and a 5MHz carrier for both the
uplink and downlink. The standard supports both Frequency Division Duplex (FDD) and
Time Division Duplex (TDD) with FDD mode considered to be the main technology for
UMTS. In the FDD mode, the uplink and downlink transmissions use different frequency
bands. A radio frame has a length of 10ms and is divided into 15 slots. The spreading factors
vary from 4 to 256 for the uplink and up to 512 for the downlink. Under limited coverage
and mobility, data rates up to 2Mbps are achievable using these spreading factors. The TDD
mode defined is Time Division-Synchronous Code Division Multiple Access (TD-SCDMA).
It operates on a low-chip rate carrier, with a 1.6MHz carrier instead of a 5MHz. It can
also offer the end user data rates up to 2Mbps under optimal conditions [6].
2.2.2 GPRS — UMTS Packet Domain Architecture
3GPP TS 23.060 defines the packet domain architecture for both GSM and UMTS
using Figure 2.2 [1]. The shaded elements highlight the key elements of the UMTS packet
domain. The standard provides a specification for each of the key elements of the architec-
ture, as well as a detailed specification for the interfaces that connect these key elements to
ensure interoperability between multiple vendor implementations.
UMTS packet data services are based on the 2.5G GSMGeneral Packet Radio Service
(GPRS). GPRS uses packet switched technology to transfer high and low-speed data and
signaling in an efficient manner. The packet overlay architecture maintains a strict separation
between the radio subsystem and the network subsystem, allowing the reuse of other radio
access technologies. GPRS optimizes the use of network and radio resources and defines the
protocols for interworking with external IP networks (represented generically as a packet
data network (PDN) on the reference diagram) through the Gi interface.

J. Scot Ransbottom Chapter 2. Background 16
MT UTRAN SGSN GGSN PDNUu Iu Gn Gi
MSC/VLR HLR
Iu Gs Gr
D
TE
TE MT
R
R UmBSS
Gb
A
CGF
EIRGf
GaGa
BillingSystem
Signalling and Data Transfer InterfaceSignalling Interface
UMTS
GSM
Radio Access Network Core Network
UE
Figure 2.2: UMTS Packet Domain Architecture [1]
Both GSM and UMTS use a common packet domain Core Network (CN) to provide
packet switched (PS) services. The packet domain is designed to support several quality
of service levels to allow efficient data transfer of application traffic ranging from non-real-
time, intermittent and bursty data to real-time voice and video. The Serving GPRS Support
Node (SGSN) is the node that is serving the UE. It supports GPRS for UMTS via the Iu
interface. The SGSN performs location management, security, and access control functions
for the UEs. The GGSN provides interworking with external packet switched networks, and
is connected with SGSNs via the ATM (Asynchronous Transfer Mode)-based interface, Gn.
It contains routing information for PS-attached users. This routing information is used to
tunnel data to the UEs current point of attachment (i.e., the SGSN).
The common circuit switched (CS) CN elements include the Mobile Switching Cen-
ter/Visitor Location Register (MSC/VLR), the Home Location Register (HLR), the Charg-
ing Gateway Functionality (CGF), and the Equipment Identity Register (EIR). TheMSC/VLR
is used to provide efficient coordination of PS and CS services (i.e., combined GPRS and
non-GPRS location updates). The HLR contains GSM and UMTS subscriber information.
The CGF collects charging records from the SGSNs and GGSNs. The EIR stores information
about user equipment identity.
In order to access the PS services, a UE must make its presence known to the network

J. Scot Ransbottom Chapter 2. Background 17
by performing a GPRS attach. This makes the UE available via the SGSN for notification
of incoming PS data. In order to send and receive PS data, the UE must activate the Packet
Data Protocol (PDP) context that it wants to use. This operation makes the UE known to
its GGSN and to the external data networks through this gateway. User data is transferred
transparently between the UE and the external data networks with a method known as en-
capsulation and tunneling. Data packets are equipped with PS-specific protocol information
and transferred between the UE and the GGSN. This transparent transfer method enables
easy introduction of additional interworking protocols in the future.
2.2.3 UMTS Protocol Stack (Control and User Plane)
3GPP TS 23.060 defines the layered protocol structure for both the user and control
planes in Figure 2.3 and Figure 2.4, respectively [2]. The protocols of both the user and
control planes can be grouped into one of three more general UMTS internetwork protocol
layers: transport network layer, radio network layer, and the system network layer. The
protocols within each of these network layers extend across multiple interfaces and work
together in the execution of many common system-wide functions [9].
L1
RLC
PDCP
MAC
E.g., IP, PPP
Application
L1
RLC
PDCP
MAC
ATM
UDP/IP
GTP-U
AAL5
Relay
L1
UDP/IP
L2
GTP-U
E.g., IP,PPP
SGSN UTRAN UE Iu-PS Uu Gn Gi
GGSN
ATM
UDP/IP
GTP-U
AAL5
L1
UDP/IP
GTP-U
L2
Relay
Transport Network Protocols
Radio Network Protocols
System Network Protocols
UMTS Internetwork Layers
Figure 2.3: UMTS User Plane [2]

J. Scot Ransbottom Chapter 2. Background 18
RLC
RRC
L1
GMM / SM
RRC
MAC
ATM
RANAP
AAL5
Relay
ATM
AAL5
SGSNUTRANUEIu-PsUu
RLC SCCP
SignalingBearer
MAC
L1
SignalingBearer
RANAP
SCCP
GMM / SM
Transport Network Protocols
Radio Network Protocols
System Network Protocols
UMTS Internetwork Layers
RLC
RRC
L1
GMM / SM
RRC
MAC
ATM
RANAP
AAL5
Relay
ATM
AAL5
SGSNUTRANUEIu-PsUu
RLC SCCP
SignalingBearer
MAC
L1
SignalingBearer
RANAP
SCCP
GMM / SM
Transport Network Protocols
Radio Network Protocols
System Network Protocols
UMTS Internetwork Layers
Figure 2.4: UMTS Control Plane [2]
Transport Network Protocols
The UMTS transport network protocols are responsible for providing a general-
purpose transport service to both the user and control planes. It is actually a network
within the UMTS network. The logical end-to-end transport network is composed of: the
Medium Access Control (MAC), the Reliable Link Control (RLC), the physical layer (PHY),
as well as the Asynchronous Transfer Mode (ATM) and ATM Adaptation Layer 5 (AAL5)
[9].
The PHY protocol, specified in 3G TS 25.302, controls the use of the WCDMA
physical channels on the Uu interface. It is responsible for mapping the logical transport
channels to the physical channels.
The MAC protocol, specified in 3G TS 25.321, controls the access signaling procedures
(request and grant) for the radio channel. It provides its service as a set of logical channels,
which are characterized by the type of data that they transport. The MAC has the overall
responsibility of controlling the communications over WCDMA transport channels provided
by the PHY layer. In order for multiple users to share the capacity of the transport channels,
the MAC uses transport blocks as units of transmission. It multiplexes and de-multiplexes

J. Scot Ransbottom Chapter 2. Background 19
protocol data units (PDUs) from the RLC into these transport blocks that are delivered
to and from the physical layer. In the user plane, the MAC handles the real-time protocol
issues associated with priority handling between data flows of a single UE [9].
The RLC protocol, specified in 3G TS 25.322, provides logical link control over the
radio interface in both the user and control planes. There may be several simultaneous
RLC links per UE with each link being identified by it own radio bearer (RB) ID. The
standard supports transfer of user data in three modes: transparent, unacknowledged, and
acknowledged modes. The transparent mode supports segmentation and reassembly (SAR)
of higher layer PDUs into/from smaller RLC payload units (PUs) and forwarding to/from
the MAC. The unacknowledged mode supports SAR, concatenation, padding, forwarding
to/from the MAC, as well as ciphering and sequence number checking. The acknowledged
mode supports all of the functionality of the unacknowledged mode plus error correction, in
sequence delivery of higher-layer PDUs, duplicate detection, and flow control [1][9].
The ATM protocol, specified in [15], divides the information from the higher layer
into fixed-size cells (53 octets), multiplexes, and forwards the cells to the next node. The
AAL5 protocol, specified in [16], provides support for variable bit rate connection-oriented
or connectionless data services to the ATM protocol.
Radio Network Protocols
The radio network protocols form the layer on top of the general-purpose transport
network protocols discussed in the previous section. These protocols are needed to control
the establishment, maintenance and release of radio access bearers (RABs) and to transfer
user data between the UE and the CN using the RABs. The RAB represents a logical
channel between the SGSN and the UE. The protocols of the radio network extend from
the UE across the UTRAN to the SGSN and create this logical channel association. The
radio network protocols in the control plane are the Radio Access Network Application

J. Scot Ransbottom Chapter 2. Background 20
Part (RANAP) and the Radio Resources Control (RRC) protocols. See Figure 2.5 for the
relationship between the RRC, RANAP, signaling connection and RAB.
Figure 2.5: Relationship Between the RRC, RANAP, Signaling Connection and RAB
The RANAP protocol, specified in 3G TS 25.413, controls the resources in the Iu
interface, between the SGSN and the RNC. It has the main responsibility for overall RAB
management, providing the SGSN with the control mechanisms for the establishment, mod-
ification and release of RABs between the UE.
The RRC protocol, specified in 3G TS 25.331, is the key radio resource control pro-
tocol in the UTRAN. It supports the Radio Resource Management (RRM) functionality by
coordinating the execution of resource control requests. RRM is covered in greater detail in
Section 2.2.5 . It also has the responsibility to transport RANAP messages as their payload
between the RNC and UEs. The major function of the RRC is to control the radio bearers,
transport channels and physical channels. The RRC provides a logical connection between
the UE and the RNC.
As stated earlier, the RAB represents the logical channel connection between a UE
and the SGSN. It is the RNCs responsibility to provide the RAB connection, creating an
illusion for the SGSN of a fixed radio bearer (connection) to the UE. The RNC analyzes
the RAB requests, evaluates radio resources needed to support the requests, reconfigures

J. Scot Ransbottom Chapter 2. Background 21
the radio channels, called radio bearers (RB) and maps the requested RAB to the RBs. As
shown in Figure 2.5, the RAB is carried within the RRC connection between the RNC and
UE over the radio interface and within the RANAP connection between the RNC and the
SGSN. In this association, the RNC acts as a protocol converter between the UTRAN and
the SGSN [17].
In the user plane, the radio network protocols are: the Packet Data Convergence
Protocol (PDCP) and the GPRS Tunneling Protocol-User (GTP-U). The PDCP layer han-
dles transmission and reception of PDUs using the services provided by the RLC. Its main
functionality is to compress and decompress the headers of the higher layer protocol data
units in order to save valuable radio link resources. The most common user to user packet
data protocol is TCP/IP. The IP header compression specified for the 3GPP is RFC2507
defined by the Internet Engineering Task Force (IETF) [9].
The GTP-Us, specified by 3G TS 29.060, main functions are data packet transfer
between the UTRAN and SGSN, as well as between the SGSN and GGSN. On both of
these interfaces the GTP-U operates on top of UDP (User Datagram Protocol). It uses
encapsulation and tunneling to provide a connectionless data transfer service to the higher
layers. Since its main purpose is to transfer user data, it has been optimized for that specific
task, leaving the signaling messages required to set up the GTP endpoints to the control
plane.
System Network Protocols
The radio network protocols make it possible for the UE to communicate across the
UTRAN subnetwork by maintaining the communications path between the UE and the
SGSN, forming a radio access network. The system network protocols operate on top of
the radio network protocols and allow the UMTS SGSN to provide communications services
to the UE. This group of control plane protocols is carried transparently through the radio

J. Scot Ransbottom Chapter 2. Background 22
access network, allowing the radio access network to be interchanged seamlessly without
affecting the communications services that the SGSN provides to the UEs. The main system
network protocols in the UMTS control plane are the GPRS Mobility Management (GMM)
and the Session Management (SM). The GMM protocol, which is covered in more detail
in Section 2.2.5 , operates between the UE and the SGSN. The GMM protocol provides
the basic signaling mechanisms for controlling mobility management and authentication
functions for the UEs in the UMTS PS domain. The SM protocol, which is covered in more
detail in Section 2.2.4 , is responsible for establishing and releasing packet data sessions,
called packet data protocol (PDP) contexts with the UMTS network.
2.2.4 GPRS Mobility Management and Session Management
GPRS Mobility Management
As stated in Section 2.2.2 , in order for a UE to utilize the resources provided by the
UMTS GPRS PS domain, it must first register into the GPRS network. The GMM protocol
provides the signaling mechanisms for controlling this mobility management registration
process, termed a GMM context. Figure 2.6 shows the Packet Mobility Management (PMM)
States of the GMM context [1].
PMM-Detached
PMM-Idle PMM-Connected
PS Detach PS Attach PS Detach
PS Signaling Connection Release
PS Signaling Connection Establish
PMM-Detached
PMM-Idle PMM-Connected
PS Detach PS Attach PS Detach
PS Signaling Connection Release
PS Signaling Connection Establish
Figure 2.6: Packet Mobility Management (PMM) States [1]

J. Scot Ransbottom Chapter 2. Background 23
The procedures for the establishment and release of the GMM context are: GPRS
Attach and the GPRS Detach. The signaling mechanisms for realizing a GPRS Attach are
covered in more detail in Section 2.2.6 . Prior to registering into the GPRS network, a UE is
in the Packet Mobility Management Detached (PMM-Detached) state as shown in Figure 2.6.
In that state, a GMM context does not exist and subsequently, the SGSN cannot reach the
UE because it does not have any valid location or routing information about the UE. After
successful completion of a GPRS Attach procedure, the UE will be in the PMM-Connected
state, is authorized into the network, and has established a PS signaling channel with the
SGSN. As shown in Figure 2.4, the signaling connection consists of an RRC connection
between the UE and the UTRAN and RANAP connection between the UTRAN and the
SGSN. If the PS signaling connection is released, the UE will move to the PMM-Idle state
[2].
Session Management
In the PS domain the packet connections are called sessions–they are established
and managed by the SM protocol. Its main function is to establish and release packet data
sessions by providing support for Packet Data Protocol (PDP) context handling between the
SGSN and the UE. The SM has two logical states: inactive and active, as depicted in Figure
2.7.
-
Deactivate PDP Context or
PMM changes to IDLE
-INACTIVE ACTIVE
Activate PDP Context
Figure 2.7: Session Management (SM) States
When the UE is in the Session Management Active (SM-Active) state, a PDP context
exists and contains the necessary information for routing user data packet from the GGSN

J. Scot Ransbottom Chapter 2. Background 24
(i.e., the gateway) to the UE and vice versa. When a UE is in the SM-Inactive state, the
PDP context does not exist and therefore, there is not any valid routing information for it.
The basic SM procedures are: PDP context activation, modification, and deactivation. The
signaling mechanisms for realizing a PDP context activation are covered in more detail in
Section 2.2.6 .
The goal of the SM protocol is to create the illusion of an “always on” type of
connection between the UE and the SGSN–this must be accomplished in an effective way
in order to conserve network resources whenever possible. Section 2.2.5 discusses how the
SM and RRC protocols interact to accomplish this.
Referring back to Figure 2.6, once in the PMM-Connected state, the UE is authen-
ticated into the network and can request to transfer data using the UMTS PS domain. In
order to exchange packet data with external data networks, the UEmust be in the SM-Active
state, meaning that the UE has a PDP address in the Packet Data Network (PDN). The UE
accomplishes this by requesting a PDP context activation. The PDP context characterizes
a data transfer session and includes information like: the PDP type (i.e., IPv4 or IPv6),
the PDP address, and the requested Quality of Service (QoS). With an active PDP context,
the UE is known to external packet data networks (PDN) and can send and receive PDP
protocol data units (PDUs) with the external PDN through its gateway (i.e., the GGSN).
When a UE transitions to the PMM-Idle state, it remains attached to the GPRS
network and has a GMM context, but data transmission and reception are not possible,
because there is not a PS signaling connection between the UE and the SGSN; therefore,
there is no PDP context (i.e., the UE transitions to the SM-Inactive state). In order to
reestablish the PS signaling connection between the UE and the SGSN, the UE must perform
a Service Request procedure [1][2]. The signaling mechanisms for realizing a Service Request
procedure are covered in more detail in Section 2.2.2 . Upon successful reestablishment of
the PS signaling connection, the UE moves back to the PMM-Connected state and has the

J. Scot Ransbottom Chapter 2. Background 25
resources necessary to initiate a PDP context activation.
2.2.5 Radio Resource Management
UMTS uses the RRC procedures to allocate radio resources to the UE in a very
flexible manner depending on the state of the UE (both PMM context and PDP context)
and the amount data that it needs to send. Each physical channel in UMTS is called a
transport channel. The following are uplink transport channels:
• Physical Random Access Channel (PRACH): A Slotted Aloha contention-based
uplink channel used for transmission of small amounts of data and control from UE.
• Physical Common Packet Channel (PCPCH): A contention-based uplink chan-nel for data.
• Dedicated Physical Dedicated Channel (DPDCH): Physical channel dedicatedto UE and is used to transmit large amounts of data.
For small amounts of data, the PRACH is normally used. For small to medium
amounts of data, the PCPCH is preferred and for large amounts of data, the DPDCH can
be used [1].
On receipt of data packets from the higher layers (i.e. IP), the UE begins the Radio
Access Bearer (RAB) assignment procedure in order to establish a Radio Bearer (RB) be-
tween the UE and the UTRAN. The signaling mechanisms for realizing a RAB assignment
are discussed in greater detail in Section 2.2.6 .
RRM Interaction with SM and GMM
If these PDUs belong to a QoS for which a PDP context does not exist (i.e., SM-
Inactive), the UE will first initiate a PDP context activation. If the PDP context already
J. Scot Ransbottom Chapter 2. Background 26
exists, the UE will initiate the Radio Access Bearer (RAB) assignment process by sending
a service request to its SGSN. The Service Request procedure, discussed in greater detail in
Section 2.2.6 , is used to set up a PS connection to the SGSN if the UE is in the PMM-Idle
state or is used to request resource reservation, if the UE is in the PMM-Connected state. To
initiate the RAB assignment process, the SGSN sends a RAB Assignment Request message
to the UTRAN to establish a RAB. If there is sufficient uplink and downlink capacity to
support the request, the UTRAN will establish a RB by sending a RB Setup message to the
UE. Once the RB is established the UE can begin sending and receiving PDUs on the uplink
and downlink. Section 2.2.6 discusses the RB Setup procedure in greater detail.
2.2.6 UMTS Protocol Interaction Diagrams
This section details how the UMTS control protocols work together to realize com-
mon management functions. The common management functions described are: the RRC
Connection Setup, the GPRS Attach procedure, the PDP Activation procedure, the RAB
Assignment procedure, and the RB Setup procedure.
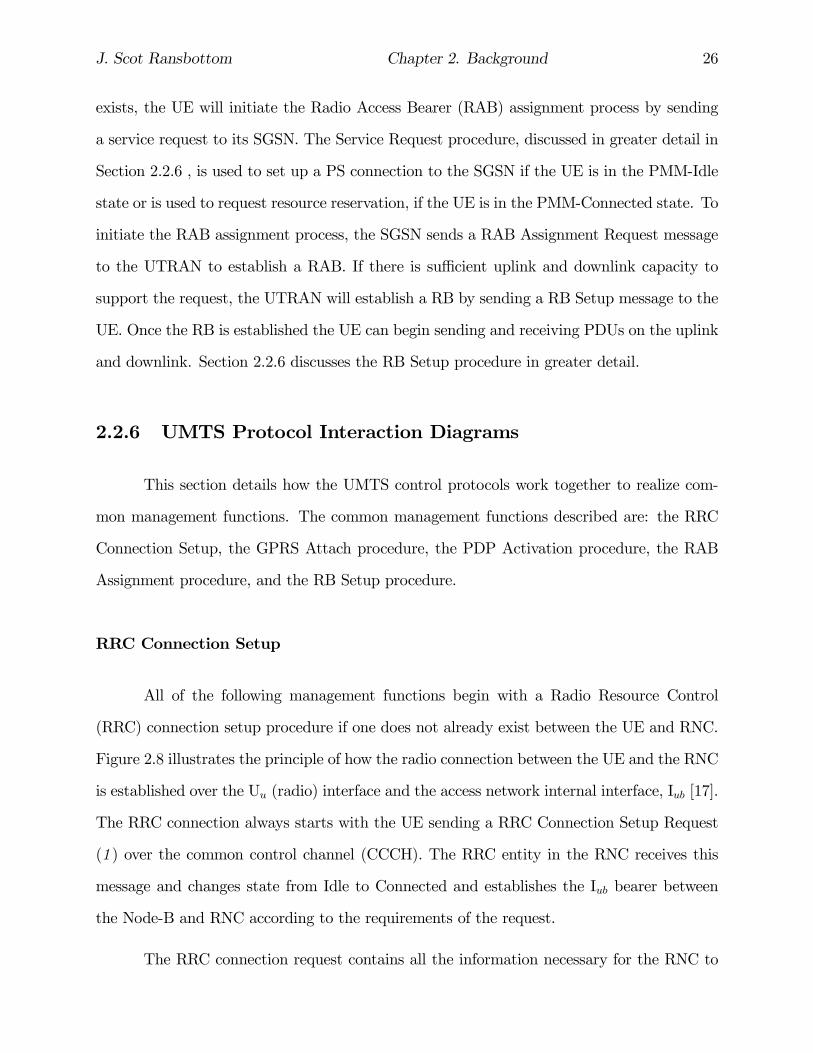
RRC Connection Setup
All of the following management functions begin with a Radio Resource Control
(RRC) connection setup procedure if one does not already exist between the UE and RNC.
Figure 2.8 illustrates the principle of how the radio connection between the UE and the RNC
is established over the Uu (radio) interface and the access network internal interface, Iub [17].
The RRC connection always starts with the UE sending a RRC Connection Setup Request
(1 ) over the common control channel (CCCH). The RRC entity in the RNC receives this
message and changes state from Idle to Connected and establishes the Iub bearer between
the Node-B and RNC according to the requirements of the request.
The RRC connection request contains all the information necessary for the RNC to

J. Scot Ransbottom Chapter 2. Background 27
coordinate the setup of the radio connection between the UE and the RNC. The message
contains the UE identity, its location and routing information, and the requested QoS. De-
pending on the requested QoS, the RNC makes the decision whether to allocate dedicated
or common resources to the request. The RNC will negotiate a Iub bearer with the Node-B.
When the Iub communication is ready, the RNC sends the RRC Connection Setup (2 )
message to the UE with the appropriate information to establish the radio channel with the
Node-B. The message informs the UE of the transport format, power control, and channel
codes so that it can configure it RLC with the appropriate settings. The UE confirms that
the RRC connection is established by sending the RRC Connection Setup Complete message
(3 ) [17].
Figure 2.8: RRC Connection Setup
Once the RRC connection has been established, the UE can proceed with its subse-
quent management function. The RNC provides the protocol translation for the RRC and
the RANAP protocols giving the UE a virtual PS signaling connection shown in Figure 2.5.
Figure 2.9 illustrates how this virtual PS signaling connection is actually realized. The UE
sends the message RRC: Initial Direct Transfer to the RNC. It carries as its payload the
first system network message corresponding to the management function task from the UE
to the network. Upon receiving this message the RNC prepends a header with additional
control information and forwards it to the SGSN as a RANAP: UE Initial Message. This

J. Scot Ransbottom Chapter 2. Background 28
message contains as it payload the original RRC direct transfer message with the first system
network message generated by the UE [17]. The following figures will use the notation RRC
DT (payload) and RANAP DT (payload) to illustrate a network management message being
transferred as payload in a RRC and RANAP direct transfer, respectively.
Figure 2.9: Transaction Reasoning
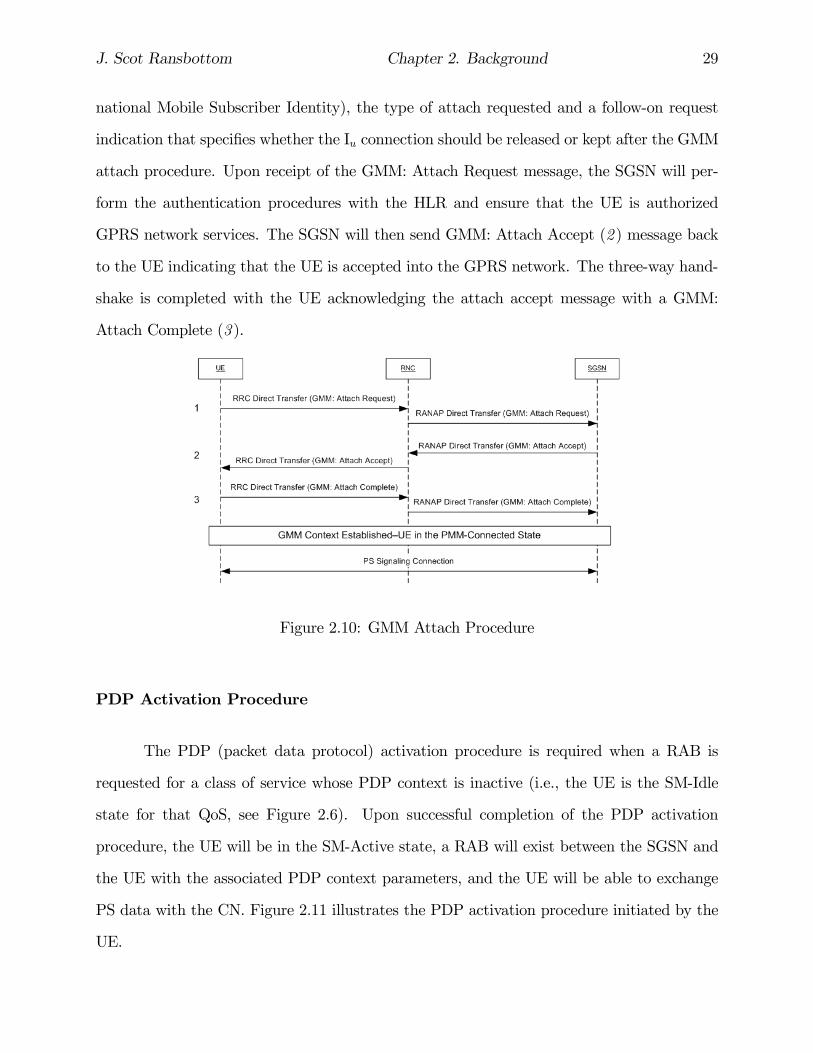
GMM Attach Procedure
The GPRS Mobility Management (GMM) Attach procedure is performed to regis-
ter the UE for the GPRS network services by notifying the SGSN of its location and by
establishing a PS signaling connection between the UE and the SGSN. After successfully
executing the GMM Attach procedure the UE is in the PMM-Connected state, Figure 2.6,
and GMM context is established in both the UE and the SGSN. The UE may then activate
PDP contexts as described below. The GMM protocol makes use of the signaling connection
provided by the radio network layer protocols shown in Figure 2.5. This signaling connection,
referred as the radio resource (RR) connection, consists of the RRC protocol connection over
the signaling radio bearer and the RANAP connection over the Iu signaling bearer.
The three-way handshake signaling mechanism for the GMM Attach procedure is il-
lustrated in Figure 2.10. The UE initiates the GMM Attach procedure by sending a GMM:
Attach Request (1) message to the SGSN. This message includes the UE’s IMSI (Inter-
J. Scot Ransbottom Chapter 2. Background 29
national Mobile Subscriber Identity), the type of attach requested and a follow-on request
indication that specifies whether the Iu connection should be released or kept after the GMM
attach procedure. Upon receipt of the GMM: Attach Request message, the SGSN will per-
form the authentication procedures with the HLR and ensure that the UE is authorized
GPRS network services. The SGSN will then send GMM: Attach Accept (2) message back
to the UE indicating that the UE is accepted into the GPRS network. The three-way hand-
shake is completed with the UE acknowledging the attach accept message with a GMM:
Attach Complete (3 ).
Figure 2.10: GMM Attach Procedure
PDP Activation Procedure
The PDP (packet data protocol) activation procedure is required when a RAB is
requested for a class of service whose PDP context is inactive (i.e., the UE is the SM-Idle
state for that QoS, see Figure 2.6). Upon successful completion of the PDP activation
procedure, the UE will be in the SM-Active state, a RAB will exist between the SGSN and
the UE with the associated PDP context parameters, and the UE will be able to exchange
PS data with the CN. Figure 2.11 illustrates the PDP activation procedure initiated by the
UE.

J. Scot Ransbottom Chapter 2. Background 30
When the UE receives PDUs from the higher layers for a QoS that does not have an
activated PDP context, the UE initiates PDP context activation by sending a SM: Activate
PDP Context Request (1 ) message to the SGSN. Upon receipt of this message, the SGSN
will initiate the RAB assignment procedure (2 ) described in the next section. On receipt
of the RANAP: RAB Assignment Response (2.4 ) message, the SGSN will request that the
GGSN create a PDP context with the negotiated parameters. The GGSN will add the UE’s
PDP address–IP address pair to its routing table, and advertise the UE’s IP address to the
external IP network. After the RAB has been established the SGSN confirms the packet
session establishment by sending a SM: Activate PDP Context Accept (3) message to the
UE.
Figure 2.11: PDP Activation and RAB Assignment Procedures
RAB Assignment Procedure
The RAB Assignment procedure is illustrated in step 2 of Figure 2.11. The RAB
assignment procedure can be initiated by either a PDP activation, when a PDP context has
not yet been established for the requested QoS or by a service request, as in Figure 2.12,

J. Scot Ransbottom Chapter 2. Background 31
when a PDP context is already active, but no RAB exists.
Upon receiving either a PDP activation or a service request, the SGSN initiates RAB
assignment activities. First, the SGSN ensures that the UE under its current subscription has
the rights to perform the operation, and then begins RAB allocation by assigning a unique
RAB ID and requests a RAB for the given QoS by sending a RANAP: RAB Assignment
Request (2.1 ) message to the RNC. The RNC performs an admission control procedure
checking the availability of uplink and downlink capacity. If sufficient capacity is available,
the RNC establishes the appropriate radio bearer (RB) by sending the UE a RRC: RB Setup
Request (2.2) message. The UE establishes the appropriate RB as specified by the RNC
and sends a RRC: RB Setup Complete (2.3 ) message to the RNC. The RNC completes the
transaction by notifying the SGSN of the established RAB-RB mapping with a RANAP:
RAB Assignment Response (2.4 ) message.
Service Request Procedure
When a UE requires a RAB for a PDP context that is already active, it initiates the
RAB assignment procedure with a SM: Service Request (1 ) message to the SGSN as shown
in Figure 2.12. First, the SGSN notifies the UE that the request is granted by sending a
SM: Service Accept (2 ) message. It then initiates a RAB assignment in step 3 as specified
in detail in the previous section.
2.2.7 UMTS Summary
The previous sections provided an overview of UMTS and its signaling protocols.
Section 2.2.1 discussed the standards of the WCDMA air interface. GPRS, the backbone of
the UMTS packet domain architecture was discussed in Section 2.2.2 . Section 2.2.3 gave an
overview of the UMTS protocol stack, with Section 2.2.4 covering the details of the GMM
and Session Management protocols.
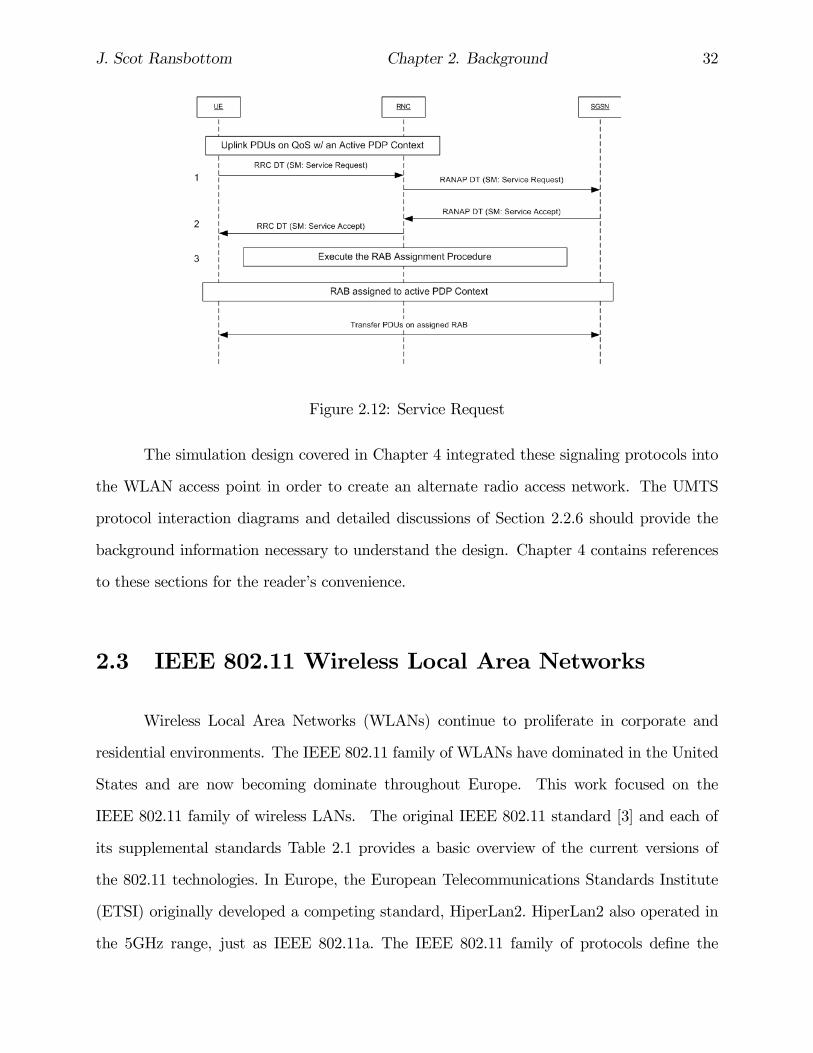
J. Scot Ransbottom Chapter 2. Background 32
Figure 2.12: Service Request
The simulation design covered in Chapter 4 integrated these signaling protocols into
the WLAN access point in order to create an alternate radio access network. The UMTS
protocol interaction diagrams and detailed discussions of Section 2.2.6 should provide the
background information necessary to understand the design. Chapter 4 contains references
to these sections for the reader’s convenience.
2.3 IEEE 802.11 Wireless Local Area Networks
Wireless Local Area Networks (WLANs) continue to proliferate in corporate and
residential environments. The IEEE 802.11 family of WLANs have dominated in the United
States and are now becoming dominate throughout Europe. This work focused on the
IEEE 802.11 family of wireless LANs. The original IEEE 802.11 standard [3] and each of
its supplemental standards Table 2.1 provides a basic overview of the current versions of
the 802.11 technologies. In Europe, the European Telecommunications Standards Institute
(ETSI) originally developed a competing standard, HiperLan2. HiperLan2 also operated in
the 5GHz range, just as IEEE 802.11a. The IEEE 802.11 family of protocols define the

J. Scot Ransbottom Chapter 2. Background 33
Medium Access (MAC) layer and physical (PHY) layer protocols required to deliver MSDUs
(MAC Service Data Units) between peer LLCs (Logical Link Controls). An overview of the
IEEE 802.11 system architecture is presented in Section 2.3.1. Section 2.3.2 defines the frame
structure of an IEEE 802.11 frame and Section 2.3.3 presents the protocol architecture. The
latter sections present more specific information about the operation of IEEE 802.11. Section
2.3.4 and 2.3.5 present information about the operation of the physical (PHY) layer and the
MAC layer of the protocol. The WLAN modes of operation are presented in Section 2.3.7
and 2.3.8. One key issue for the second phase of our research was the per frame overhead
associated with the protocol. In IEEE 802.11 networks, it is not possible to both transmit
and receive on the same channel using a single radio transceiver. The 802.11 standard
uses CSMA/CA (carrier sense multiple access with collision avoidance); whereas, standard
Ethernet uses CSMA/CD (carrier sense multiple access with collision detection). Another
way to say this is that an 802.11 wireless LAN only takes measures to avoid collisions, not to
detect them. CSMA/CA requires somewhat extensive periods of inactivity called interframe
spaces (IFS) to occur between transmission. IFS will be discussed further in Section 2.3.6.
A method to amortize these periods of inactivity to improve performance is one of the key
aims of AGG-MAC. This work is presented in Chapters 6 and 7.
Table 2.1: Comparison of IEEE 802.11 WLAN Standards802.11 802.11b 802.11a 802.11g
Raw Data Rate 1,2 1,2,5.5,116, 9, 12, 18,24, 36, 48, 54
1, 2, 5.5, 6, 9,11, 12, 22, 24,33, 36, 54
Frequency 2.4GHz 2.4Ghz 5GHz 2.4GHzAvailable Spectrum 83.5MHz 83.5MHz 300MHz 83.5MHz
Modulation EncodingFHSS/FSKDSSS/PSKIR/PPM
DSSS/CCK OFDM DSSS/OFDM
# Channels/nonoverlapping 11 / 3 11 / 3 12 / 8 11 / 3maxMSDU 2304 2304

J. Scot Ransbottom Chapter 2. Background 34
2.3.1 System Architecture
The IEEE 802.11 architecture is comprised of several components and services that
interact to provide station mobility transparent to the higher layers of the network stack.
The Wireless LAN station (STA) is the most basic component of the wireless network.
A station is any device that contains the functionality of the 802.11 protocol, consisting of
MAC, PHY, and a connection to the wireless media. Typically the 802.11 functions are
implemented in the hardware and software of a network interface card (NIC). A station
could be a laptop PC, handheld device, or an Access Point (AP). Stations may be mobile,
portable, or stationary and all stations support the 802.11 station services of authentication,
de-authentication, privacy, and data delivery.
802.11 defines the Basic Service Set (BSS) as the basic building block of an 802.11
wireless LAN. The BSS consists of a group of any number of stations. The BSS is not a very
interesting topic until we take the topology of the WLAN into consideration.
Topology
The IEEE 802.11 topology consists of components, interacting to provide a wireless
LAN that enables station mobility transparent to higher protocol layers, such as the LLC.
The 802.11 standard supports the following two topologies: ad hoc mode and infrastructure
mode.
The most basic wireless LAN topology is a set of stations which have recognized
each other and are connected via the wireless media in a peer-to-peer fashion. This form of
network topology is referred to as an Independent Basic Service Set (IBSS) (see Figure 2.13)
or an Ad hoc network. Ad hoc mode (also called peer-to-peer mode or an Independent Basic
Service Set, or IBSS) is simply a set of 802.11 wireless stations that communicate directly
with one another without using an access point or any connection to a wired network. This
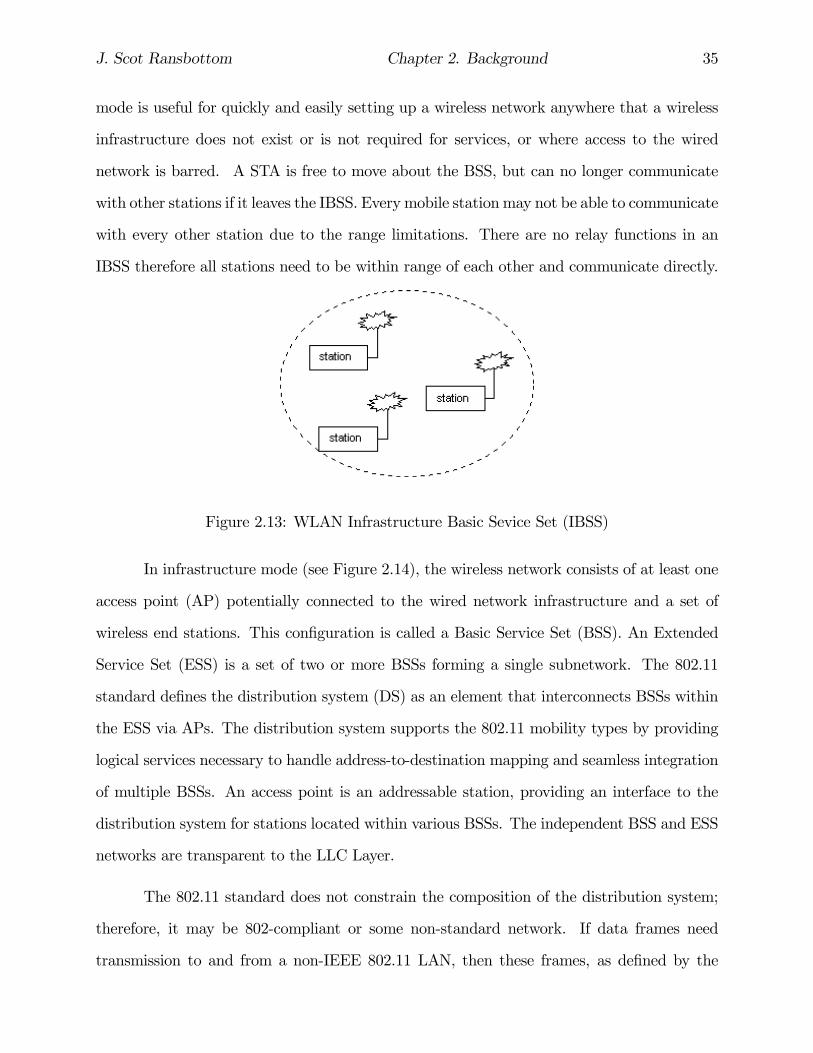
J. Scot Ransbottom Chapter 2. Background 35
mode is useful for quickly and easily setting up a wireless network anywhere that a wireless
infrastructure does not exist or is not required for services, or where access to the wired
network is barred. A STA is free to move about the BSS, but can no longer communicate
with other stations if it leaves the IBSS. Every mobile station may not be able to communicate
with every other station due to the range limitations. There are no relay functions in an
IBSS therefore all stations need to be within range of each other and communicate directly.
Figure 2.13: WLAN Infrastructure Basic Sevice Set (IBSS)
In infrastructure mode (see Figure 2.14), the wireless network consists of at least one
access point (AP) potentially connected to the wired network infrastructure and a set of
wireless end stations. This configuration is called a Basic Service Set (BSS). An Extended
Service Set (ESS) is a set of two or more BSSs forming a single subnetwork. The 802.11
standard defines the distribution system (DS) as an element that interconnects BSSs within
the ESS via APs. The distribution system supports the 802.11 mobility types by providing
logical services necessary to handle address-to-destination mapping and seamless integration
of multiple BSSs. An access point is an addressable station, providing an interface to the
distribution system for stations located within various BSSs. The independent BSS and ESS
networks are transparent to the LLC Layer.
The 802.11 standard does not constrain the composition of the distribution system;
therefore, it may be 802-compliant or some non-standard network. If data frames need
transmission to and from a non-IEEE 802.11 LAN, then these frames, as defined by the

J. Scot Ransbottom Chapter 2. Background 36
Figure 2.14: WLAN Infrastructure Mode
802.11 standard, enter and exit through a logical point called a portal. The portal provides
logical integration between existing wired LANs and 802.11 LANs. When the distribution
system is constructed with 802-type components, such as 802.3 (Ethernet) or 802.5 (Token
Ring), then the portal and the access point become one and the same.
Logical Architecture
A topology provides a means of explaining necessary physical components of a net-
work, but the logical architecture defines the network’s operation. The logical architecture
of the 802.11 standard that applies to each station consists of a single MAC and one of
multiple PHYs: frequency hopping spread spectrum, direct sequence spread spectrum, and
infrared light.
The goal of the MAC Layer is to provide access control functions (such as addressing,
access coordination, frame check sequence generation and checking, and LLC PDU delimit-
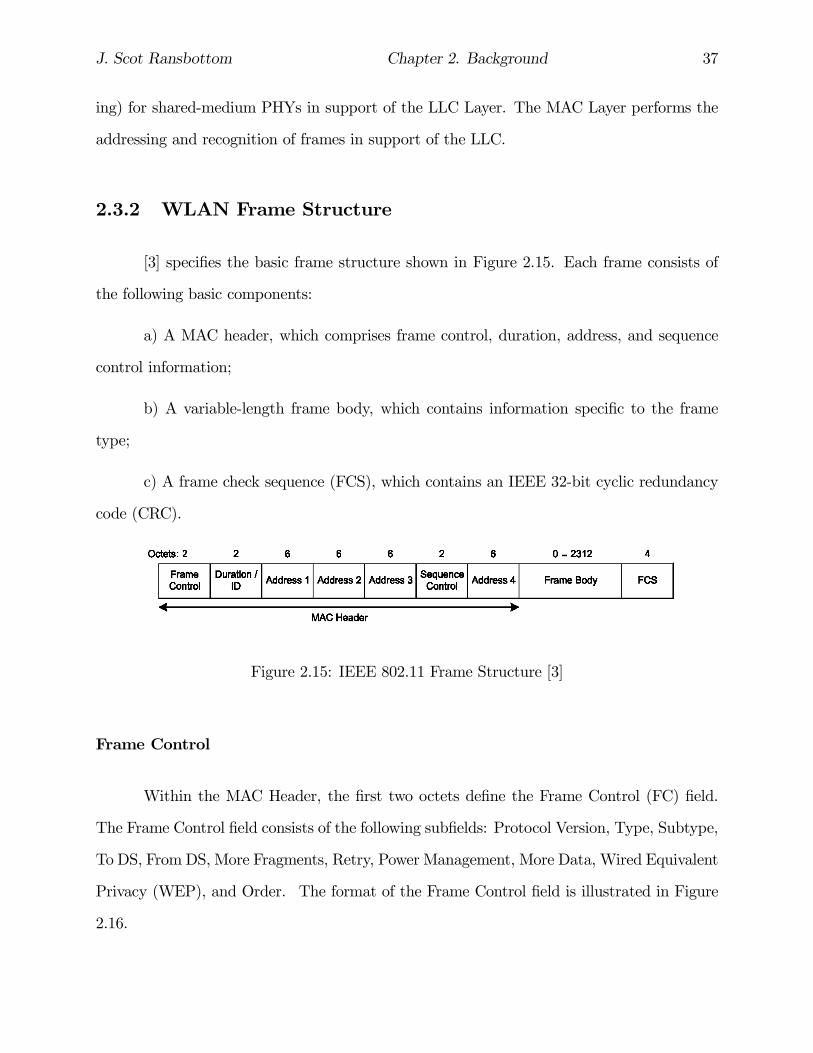
J. Scot Ransbottom Chapter 2. Background 37
ing) for shared-medium PHYs in support of the LLC Layer. The MAC Layer performs the
addressing and recognition of frames in support of the LLC.
2.3.2 WLAN Frame Structure
[3] specifies the basic frame structure shown in Figure 2.15. Each frame consists of
the following basic components:
a) A MAC header, which comprises frame control, duration, address, and sequence
control information;
b) A variable-length frame body, which contains information specific to the frame
type;
c) A frame check sequence (FCS), which contains an IEEE 32-bit cyclic redundancy
code (CRC).
Figure 2.15: IEEE 802.11 Frame Structure [3]
Frame Control
Within the MAC Header, the first two octets define the Frame Control (FC) field.
The Frame Control field consists of the following subfields: Protocol Version, Type, Subtype,
To DS, From DS, More Fragments, Retry, Power Management, More Data, Wired Equivalent
Privacy (WEP), and Order. The format of the Frame Control field is illustrated in Figure
2.16.

J. Scot Ransbottom Chapter 2. Background 38
Figure 2.16: IEEE 802.11 Frame Control Field [3]
Protocol Version subfield The Protocol Version field is 2 bits in length and is invariant
in size and placement across all revisions of this standard. For this standard, the value of the
protocol version is 0. All other values are reserved. The revision level will be incremented
only when a fundamental incompatibility exists between a new revision and the prior edition
of the standard. A device that receives a frame with a higher revision level than it supports
will discard the frame without indication to the sending station or to LLC.
Type and Subtype subfields The Type field is 2 bits in length, and the Subtype field
is 4 bits in length. The Type and Subtype fields together identify the function of the frame.
There are three frame types: control, data, and management. Each of the frame types have
several defined subtypes. Table 2.2 defines the valid combinations of type and subtype.
Table 2.2: IEEE 802.11 Valid Type and Subtype CombinationsType valueb3 b2
Typedescription
Subtypeb7 b6 b5 b4 Subtype description
00 Management xxxx (Management Frames)01 Control xxxx (Control Frames)10 Data 0000 Data10 Data 0001 Data + CF-Ack10 Data 0010 Data + CF-Poll10 Data 0011 Data + CF-Ack + CF-Poll10 Data 0100 Null function (No Data)10 Data 0101 CF-Ack (No Data)10 Data 0110 CF-Poll (No Data)10 Data 0111 CF-Ack + CF-Poll (No Data)10 Data 1000-1111 Reserved (see [18])11 Reserved 0000-1111 Reserved

J. Scot Ransbottom Chapter 2. Background 39
To DS subfield The To DS field is 1 bit in length and is set to 1 in data type frames
destined for the DS. This includes all data type frames sent by STAs associated with an AP.
The To DS field is set to 0 in all other frames.
From DS subfield The From DS field is 1 bit in length and is set to 1 in data type frames
exiting the DS. It is set to 0 in all other frames..
More Fragments subfield The More Fragments field is 1 bit in length and is set to 1 in
all data or management type frames that have another fragment of the current MSDU or
current MMPDU to follow. It is set to 0 in all other frames.
Retry subfield The Retry field is 1 bit in length and is set to 1 in any data or management
type frame that is a retransmission of an earlier frame. It is set to 0 in all other frames. A
receiving station uses this indication to aid in the process of eliminating duplicate frames.
Power Management subfield The Power Management field is 1 bit in length and is used
to indicate the power management mode of a STA. The value of this field remains constant
in each frame from a particular STA within a frame exchange sequence defined in [3]. The
value indicates the mode in which the station will be after the successful completion of the
frame exchange sequence. A value of 1 indicates that the STA will be in power-save mode.
A value of 0 indicates that the STA will be in active mode. This field is always set to 0 in
frames transmitted by an AP.
More Data subfield The More Data field is 1 bit in length and is used to indicate to a
STA in power-save mode that more MSDUs, or MMPDUs are buffered for that STA at the
AP. The More Data field is valid in directed data or management type frames transmitted
by an AP to an STA in power-save mode. A value of 1 indicates that at least one additional
J. Scot Ransbottom Chapter 2. Background 40
buffered MSDU, or MMPDU, is present for the same STA. The More Data field may be set
to 1 in directed data type frames transmitted by a contention-free (CF)-Pollable STA to the
point coordinator (PC) in response to a CF-Poll to indicate that the STA has at least one
additional buffered MSDU available for transmission in response to a subsequent CF-Poll.
The More Data field is set to 0 in all other directed frames. The More Data field is set to 1
in broadcast/multicast frames transmitted by the AP, when additional broadcast/multicast
MSDUs, or MMPDUs, remain to be transmitted by the AP during this beacon interval.
The More Data field is set to 0 in broadcast/multicast frames transmitted by the AP when
no more broadcast/multicast MSDUs, or MMPDUs, remain to be transmitted by the AP
during this beacon interval and in all broadcast/multicast frames transmitted by non-AP
stations.
WEP subfield The WEP field is 1 bit in length. It is set to 1 if the Frame Body field
contains information that has been processed by the WEP algorithm. The WEP field is only
set to 1 within frames of type Data and frames of type Management, subtype Authentication.
The WEP field is set to 0 in all other frames. When the WEP bit is set to 1, the Frame
Body field is expanded as defined in [3]. The future of WEP appears to be limited at this
point. The security provided by WEP is limited and new solutions are currently in progress.
IEEE 802.1x is currently replacing most WEP solutions and is the security solution of the
foreseeable future.
Order subfield The Order field is 1 bit in length and is set to 1 in any data type frame that
contains an MSDU, or fragment thereof, which is being transferred using the StrictlyOrdered
service class. This field is set to 0 in all other frames.

J. Scot Ransbottom Chapter 2. Background 41
Duration/ID field
Immediately following the Frame Control field in the IEEE 802.11 header is the
Duration/ID field. The Duration/ID field is 16 bits in length. The contents of this field are
as follows:
1. In control type frames of subtype Power Save (PS)-Poll, the Duration/ID field carries
the association identity (AID) of the station that transmitted the frame in the 14 least
significant bits (lsb), with the 2 most significant bits (msb) both set to 1. The value
of the AID is in the range 1—2007.
2. In all other frames, the Duration/ID field contains a duration value as defined for each
frame type in section 7.2 of [3]. For frames transmitted during the contention-free
period (CFP), the duration field is set to 32 768.
Whenever the contents of the Duration/ID field are less than 32 768, the duration
value is used to update the network allocation vector (NAV).
2.3.3 WLAN Protocol Architecture
As indicated by the standard number, IEEE 802.11 fits seamlessly into the other
802.x standards for wired LANs. Applications should not notice any difference apart from a
lower bandwidth and possible a higher access time from the WLAN. Therefore, the higher
layers (application, TCP/IP, etc.) in a wireless node look the same as the wired node [17].
The IEEE 802.11 standard only covers the medium access (MAC) and physical (PHY)
layers like the other 802.x LAN standards. Figure 2.17 is the basic reference protocol refer-
ence model from [3].
The physical layer is subdivided into a physical layer convergence protocol (PLCP)
and the physical medium dependent (PMD) sublayers. The basic tasks of the MAC layer are
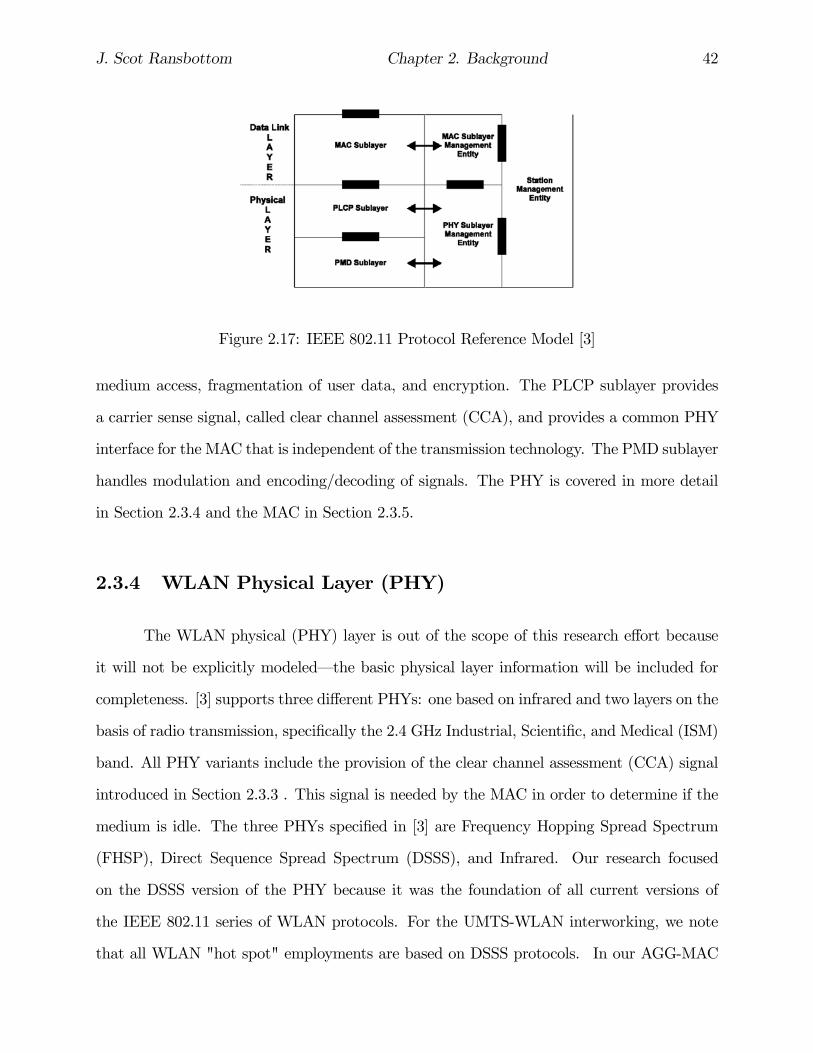
J. Scot Ransbottom Chapter 2. Background 42
Figure 2.17: IEEE 802.11 Protocol Reference Model [3]
medium access, fragmentation of user data, and encryption. The PLCP sublayer provides
a carrier sense signal, called clear channel assessment (CCA), and provides a common PHY
interface for the MAC that is independent of the transmission technology. The PMD sublayer
handles modulation and encoding/decoding of signals. The PHY is covered in more detail
in Section 2.3.4 and the MAC in Section 2.3.5.
2.3.4 WLAN Physical Layer (PHY)
The WLAN physical (PHY) layer is out of the scope of this research effort because
it will not be explicitly modeled–the basic physical layer information will be included for
completeness. [3] supports three different PHYs: one based on infrared and two layers on the
basis of radio transmission, specifically the 2.4 GHz Industrial, Scientific, and Medical (ISM)
band. All PHY variants include the provision of the clear channel assessment (CCA) signal
introduced in Section 2.3.3 . This signal is needed by the MAC in order to determine if the
medium is idle. The three PHYs specified in [3] are Frequency Hopping Spread Spectrum
(FHSP), Direct Sequence Spread Spectrum (DSSS), and Infrared. Our research focused
on the DSSS version of the PHY because it was the foundation of all current versions of
the IEEE 802.11 series of WLAN protocols. For the UMTS-WLAN interworking, we note
that all WLAN "hot spot" employments are based on DSSS protocols. In our AGG-MAC

J. Scot Ransbottom Chapter 2. Background 43
protocol work, we note that our MAC layer enhancements will function properly on any of
the PHY layers as defined in all of the IEEE 802.11 standards versions.
2.3.5 WLAN Medium Access Control (MAC)
The primary responsibility of the WLAN MAC is to control medium access, but
it can also provide optional support for roaming, authentication, and power conservation.
The basic services provided by the MAC layer are the mandatory asynchronous data ser-
vice and an optional time-bounded service. The standard specifies that 802.11 only offer
the asynchronous service in the ad hoc network mode, while both services work together
in an infrastructure based network with an access point coordinating medium access and
defines the following three basic access mechanisms: the mandatory basic method based on
a version of carrier sense multiple access with collision avoidance (CSMA/CA), an optional
method avoiding the hidden terminal problem, and a contention-free polling method for
time-bounded service. The first two methods are termed the distribution coordination func-
tion (DCF), and the third is the point coordination function (PCF). Figure 2.18 [3] shows
the interaction of the waiting time between frames, termed interframe spaces (IFS), used for
controlling the waiting time before accessing the medium.
Figure 2.18: Medium Access and Interframe Spacing [3]
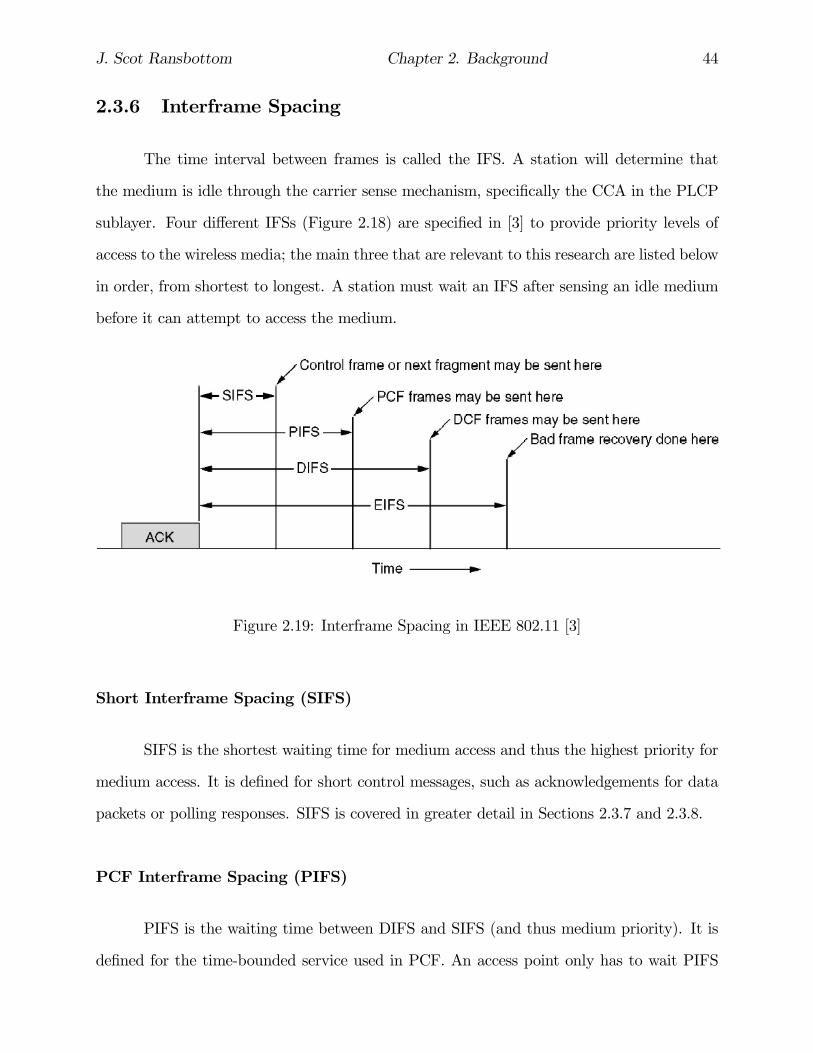
J. Scot Ransbottom Chapter 2. Background 44
2.3.6 Interframe Spacing
The time interval between frames is called the IFS. A station will determine that
the medium is idle through the carrier sense mechanism, specifically the CCA in the PLCP
sublayer. Four different IFSs (Figure 2.18) are specified in [3] to provide priority levels of
access to the wireless media; the main three that are relevant to this research are listed below
in order, from shortest to longest. A station must wait an IFS after sensing an idle medium
before it can attempt to access the medium.
Figure 2.19: Interframe Spacing in IEEE 802.11 [3]
Short Interframe Spacing (SIFS)
SIFS is the shortest waiting time for medium access and thus the highest priority for
medium access. It is defined for short control messages, such as acknowledgements for data
packets or polling responses. SIFS is covered in greater detail in Sections 2.3.7 and 2.3.8.
PCF Interframe Spacing (PIFS)
PIFS is the waiting time between DIFS and SIFS (and thus medium priority). It is
defined for the time-bounded service used in PCF. An access point only has to wait PIFS

J. Scot Ransbottom Chapter 2. Background 45
after sensing an idle medium in order to access. Both PCF and PIFS are covered in greater
detail in Section 2.3.8.
DCF Interframe Spacing (DIFS)
DIFS is the longest waiting time (and thus the lowest priority). This IFS is defined
for the asynchronous data service within a contention period used in the DCF. Both DCF
and DIFS are covered in greater detail in Section 2.3.7.
2.3.7 Distributed Coordination Function (DCF)
[3] defines the basic medium access protocol as the distributed coordination function
(DCF). It allows stations in the same BSS to share the medium using CSMA/CA and a
random back-off time following a busy medium. It also specifies that a receiving station
will respond with an immediate positive acknowledgement (ACK frame) following successful
receipt of a frame, while the sender schedules immediate retransmission if the ACK is not
received.
CSMA/CA
CSMA/CA with binary exponential backoff is the basic access mechanism specified
by the DCF. Using the physical carrier sense mechanism provided by the CCA, a station
will listen to the medium before beginning a transmission. If the medium is already carrying
a transmission, the station will not begin its own transmission. This is the CSMA portion
of the access mechanism. If two or more stations sense an idle medium and begin their
transmission at the same time then there will be a collision, which may result in one or more
frames being corrupted.
The IEEE 802.11 MAC uses collision avoidance rather than collision detection in order

J. Scot Ransbottom Chapter 2. Background 46
to transmit and receive simultaneously. For this reason, the IEEE 802.11 MAC implements
a virtual sensing mechanism termed the network allocation vector (NAV). The NAV is a
value that indicates to a station the amount of time that remains before the medium will
become available. The NAV is kept current through duration values that are transmitted in
all frames. By combining this virtual sensing mechanism (using the NAV) with the physical
sensing mechanism (using the CCA), the MAC implements the collision avoidance portion
of the CSMA/CA access mechanism.
In order to avoid collision, a station listens to the medium before beginning its own
transmission. If it detects an existing transmission then it will enter into a deferral period
determined by binary exponential backoff algorithm.
DCF and DIFS
The DCF uses the physical and virtual carrier sense mechanisms to determine if the
medium is idle. If both mechanisms indicate that medium in not in use for an interval of
DIFS then the station will begin to transmit the frame. However, if the medium is busy
then the random backoff algorithm is applied to prevent access collisions. The transmission
is considered to be unsuccessful if an ACK is not received, resulting in the retransmission of
the frame.
Figure 2.20: MAC Reference Model [3]
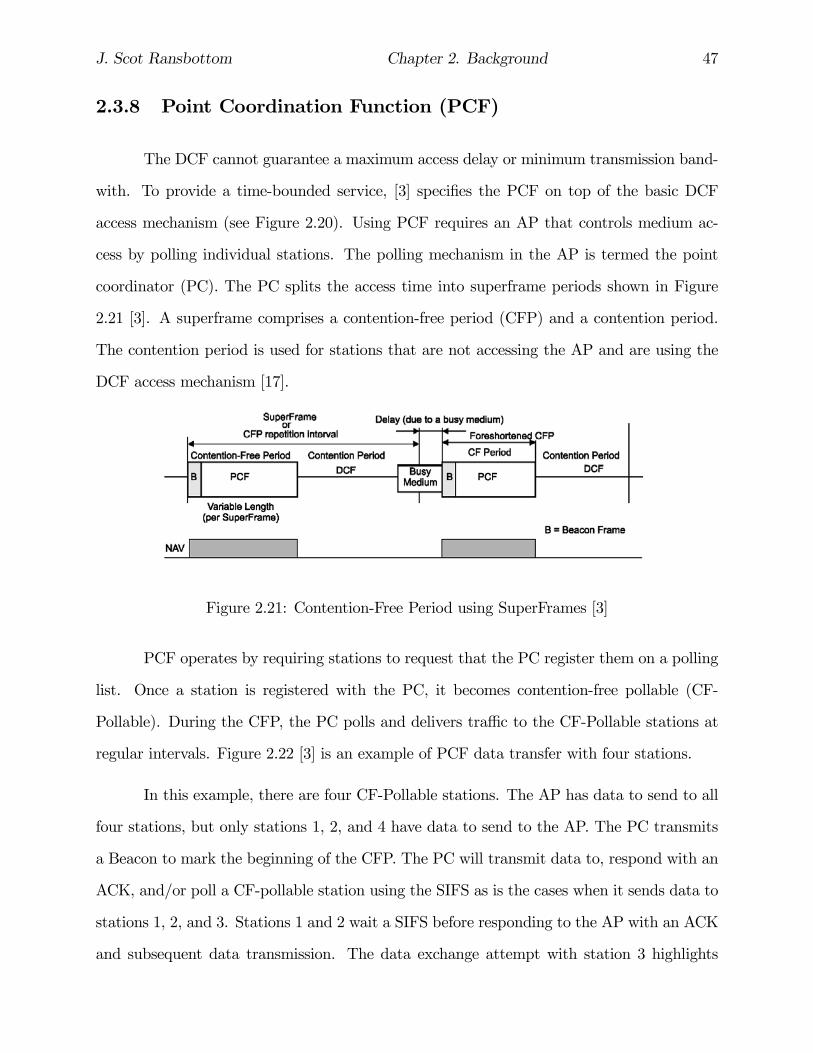
J. Scot Ransbottom Chapter 2. Background 47
2.3.8 Point Coordination Function (PCF)
The DCF cannot guarantee a maximum access delay or minimum transmission band-
with. To provide a time-bounded service, [3] specifies the PCF on top of the basic DCF
access mechanism (see Figure 2.20). Using PCF requires an AP that controls medium ac-
cess by polling individual stations. The polling mechanism in the AP is termed the point
coordinator (PC). The PC splits the access time into superframe periods shown in Figure
2.21 [3]. A superframe comprises a contention-free period (CFP) and a contention period.
The contention period is used for stations that are not accessing the AP and are using the
DCF access mechanism [17].
Figure 2.21: Contention-Free Period using SuperFrames [3]
PCF operates by requiring stations to request that the PC register them on a polling
list. Once a station is registered with the PC, it becomes contention-free pollable (CF-
Pollable). During the CFP, the PC polls and delivers traffic to the CF-Pollable stations at
regular intervals. Figure 2.22 [3] is an example of PCF data transfer with four stations.
In this example, there are four CF-Pollable stations. The AP has data to send to all
four stations, but only stations 1, 2, and 4 have data to send to the AP. The PC transmits
a Beacon to mark the beginning of the CFP. The PC will transmit data to, respond with an
ACK, and/or poll a CF-pollable station using the SIFS as is the cases when it sends data to
stations 1, 2, and 3. Stations 1 and 2 wait a SIFS before responding to the AP with an ACK
and subsequent data transmission. The data exchange attempt with station 3 highlights

J. Scot Ransbottom Chapter 2. Background 48
Figure 2.22: PCF Data Transfer with 4 Stations [3]
what happens when a CF-Pollable station does not respond to its poll. The PC expects
station 3 to respond with an ACK and transmit any data it might have after waiting a SIFS.
When a SIFS period elapses without the receipt of the expected transmission, the PC may
send its next pending transmission as soon as one PIFS after the end of its last transmission.
This permits the PC to retain control of the medium in the presence of an overlapping BSS.
The PC ends the CFP with a CF-End Beacon.
WLAN "hot spots" provide access to the Internet for clients in public locations. This
is accomplished by use of an AP providing PCF WLAN service.
2.3.9 Fragmentation Threshold
The MAC may fragment and reassemble directed, but not multicast or broadcast,
MSDUs or MMPDUs. The length of a fragment shall never be larger than aFragmenta-
tionThreshold unless the application of WEP creates a fragment exceeding the threshold
size. Once a fragmented MSDU is transmitted for the first time, its frame body content and
length will remain fixed, regardless of any required retransmission or intermediate relays.
The size of each fragment, with the possible exception of the final fragment, in a fragmented
MSDU or MMPDU will be set to the value aFragmentationThreshold. The size of the final
fragment will vary based on the amount of data remaining to send, but will not be larger

J. Scot Ransbottom Chapter 2. Background 49
than aFragmentationThreshold. The More Fragments subfield of the Frame Control field
will be set to 0 for the last (or only) fragment of the MSDU or MMPDU. Both source and
destination will establish a timer to limit the lifetime of each fragmented MSDU. If the
source timer expires before successful transmission of all fragments, the STA will discard
remaining segments and make no further attempts to transmit the MSDU. The destination
will maintain timers for at least three fragmented MSDUs (more is permitted). Destination
is permitted to discard fragments for fragments for which the STA is not maintaining a
receive timer and for all fragments received for an expired timer.
2.4 Mobile IP
Providing seamless, transparent data services to the applications running on mobile
devices is one of the key issues with integrating WLAN into 3G. Mobile IP is a proposed
standard protocol that builds on the Internet Protocol by making mobility transparent to
applications and higher level protocols like TCP. Perkins’, “Mobile IP,” [19] is the seminal
paper for this body of research.
This article describes some of the technical obstacles that must be overcome before
mobile networking can become widespread. The author says that the most fundamental
technical issue is the way that IP routes packets to their destination according to IP address.
The main problem being that IP addresses are associated with a fixed network location.
When a packet’s destination is a mobile node then, as the mobile moves, each new point of
attachment is associated with a new network number and, hence, a new IP address, making
transparent mobility impossible.
The author presents, Mobile IP (RFC 2002 [4]), a standard proposed by a IETF
working group, that was designed to solve this problem by allowing the mobile node to use
two IP addresses: a fixed home address and a care-of address that changes at each new
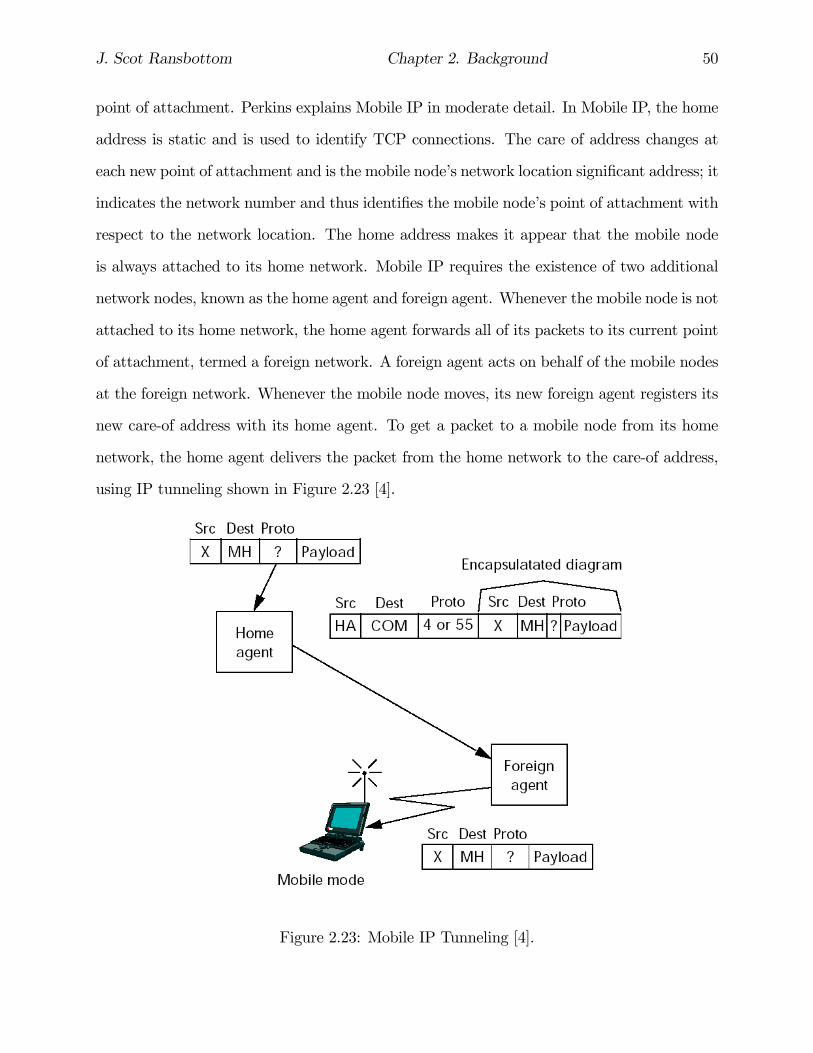
J. Scot Ransbottom Chapter 2. Background 50
point of attachment. Perkins explains Mobile IP in moderate detail. In Mobile IP, the home
address is static and is used to identify TCP connections. The care of address changes at
each new point of attachment and is the mobile node’s network location significant address; it
indicates the network number and thus identifies the mobile node’s point of attachment with
respect to the network location. The home address makes it appear that the mobile node
is always attached to its home network. Mobile IP requires the existence of two additional
network nodes, known as the home agent and foreign agent. Whenever the mobile node is not
attached to its home network, the home agent forwards all of its packets to its current point
of attachment, termed a foreign network. A foreign agent acts on behalf of the mobile nodes
at the foreign network. Whenever the mobile node moves, its new foreign agent registers its
new care-of address with its home agent. To get a packet to a mobile node from its home
network, the home agent delivers the packet from the home network to the care-of address,
using IP tunneling shown in Figure 2.23 [4].
Figure 2.23: Mobile IP Tunneling [4].

J. Scot Ransbottom Chapter 2. Background 51
The home agent constructs a new IP header that contains the mobile node’s care-
of address as the destination IP address. This new header then encapsulates the original
packet, causing the mobile node’s home address to have no effect on the encapsulated packet’s
routing until it arrives at the care-of address. Its new header is stripped off revealing the
original packet, that is forward to the mobile node.
In the IEEE Communications Magazine, 50th Anniversary Commemorative Issue
[20], Perkins gives an author’s introduction, “Mobile IP–Updated,” to his original article
[19] that was being recognized as one of the Ten Landmark Articles for the previous decade.
Perkins highlights the successes and the existing shortcomings of Mobile IP for both Mobile
IPv4 and IPv6 [21]. The author highlights the existing shortcomings as: routing efficiencies
caused by triangle routing; security issues caused by Mobile IP traffic being blocked by
firewalls; egress router filtering issues that caused IP packets without a source address of an
internal network to be blocked by border routers; and a slow growth in the WLAN market
that he does not provide a reason for. The existing work on Mobile IPv6 is focused on
solutions to all of these problems. The problem with IPv6 is that it is having difficulties
spreading with a highly deployed IPv4 infrastructure in place.
The design approach presented in Chapter 4 does not require Mobile IP in order
to make mobility transparent to applications and higher layer protocols. It uses the PDP
context address functionality for the UMTS GPRS in order to provide this transparent data
service. In the future, as UMTS transitions to an all IP framework, Mobile IP will certainly
be key protocol to allow this transition to happen. The simulation framework presented
in this research was designed with an open architecture so that future investigators will be
able to easily modify the models in order to incorporate Mobile IP and allow seamless data
transfer over an all IP backbone.
J. Scot Ransbottom Chapter 2. Background 52
2.5 Aggregation
Aggregation is not a new concept. It has been used primarily in the core network to
reduce overhead, primarily computational overhead, in routers. Aggregation can be employed
in a number of cases to amortize the cost associated with network, in our case protocol,
overhead. The IEEE 802.11e working group considered the inclusion of an aggregation or
container frame to improve performance [22]. This approach differs from our work in that
every packet is first encapsulated in its own individual WLAN frame and then the collection
of frames is subsequently encapsulated into a container frame. This approach reduces the
amount of interframe spacing incurred, but not the MAC layer frame overhead. The 802.11e
approach was deemed to be overly complex due to issues arising from how to respond to
both container and interior frame protocol responses and has subsequently been removed
from consideration in the standard [18][23]. AGG-MAC avoids the issues encountered by
the 802.11e working group by aggregating multiple packets into a single WLAN frame. In
our case, there is only one frame and the handling requirements of that frame merely follows
existing 802.11 specifications [3].
2.6 Summary
This chapter presents the theoretical background and foundation necessary to fully
understand this research work. We started with the presentation of a historical perspective of
the evolution of wireless cellular networks in Section 2.1. Section 2.2 provided details on the
UMTS system. An overview of WLAN, specifically IEEE 802.11, systems was presented in
Section 2.3. As it represents the most likely network methodology to employ loosely-coupled
interworked cellular and WLAN systems, an overview of Mobile IP was presented in Section
2.4. And finally, Section 2.5 contained a basic introduction to the concept of aggregation.
Chapter 3
Related Work
3.1 Interworked Wireless Systems
The convergence of different wireless network systems and the increased desire for
flexible access mechanisms and increased capabilities of handsets and associated terminal
devices continued to generate significant research interest. While mobile IP mechanisms
seemed to hold the most favor, Mobile IP was not without its issues. Much research continued
in providing differing levels of interoperability in mobile systems. Although cellular systems
best support mobility, those systems were limited in capacity. For this reason, work was
continued to attempt to determine the best methods of interworking high-capacity broadband
systems with high-mobility cellular systems.
The initial framework defined by the 3GPP systems architecture (SA) working group
for interworking WLAN and UMTS systems is discussed in Section 3.1.1. This framework
defines six levels of interoperability between the two systems. In order to achieve the highest
levels of interworking, a tightly coupled system would be necessary. Two research activities
supported by the European Information Society Technologies (IST) program focus on various
aspects of cellular and WLAN interworking. These initiatives will be discussed further in
53

J. Scot Ransbottom Chapter 3. Related Work 54
Section 3.1.2 and Section 3.1.3. An integral assumption of these projects was that cellular
systems consist of a pure IP core network. This appeared to be the trend, but was not yet
realizable at the time of this work or for the foreseeable future.
3.1.1 3GPP Feasibility Study
3GPP standards continue to evolve. One of the 3GPP stated goals is to support data
rates of up to 2Mbps in the indoor environment [24]. This requirement is stated for the
3GPP system and is not based upon the integration of WLAN. The 3GPP realized that
mobile cellular systems remain limited in their ability to provide consistent quality coverage
inside buildings. They understand that high quality, indoor coverage would allow them to
directly compete with infrastructure based systems, and that WLAN systems are currently
much better suited to provide such service.
Table 3.1: 3GPP Scenarios for Interworking WLAN
The 3GPP SA1, TR 22.934 [7], presented their initial work defining standards for
the integration of 3G and WLAN systems. The most significant result of this initial work
was the definition of potential levels of Interworking requirements for UMTS and WLAN
systems. Table 3.1 presents 6 scenarios exactly as stated in [7]. The scenarios range in
Interworking from two completely disparate systems connected only through offline billing

J. Scot Ransbottom Chapter 3. Related Work 55
and support services and subsequently progress to a completely seamless integration of the
two systems. There is very limited information presented beyond the basic taxonomy for
any of the scenarios with the exception of scenario #2. Scenario #2 defines Interworking
to consist of sharing the 3GPP provided mechanisms for access control (authentication and
authorization) and for the charging or billing functionality.
3.1.2 Wireless IP Network as a Generic Platform for Location
Aware Service Support (WINE GLASS)
The stated purpose of the WINE GLASS project was "to exploit enhanced and/or
new IP-based techniques to support mobility and soft-guaranteed QoS in a wireless Internet
architecture based on UMTS and incorporating WLANs, and to explore their potential in
enabling location- and QoS-aware application services for wireless mobile users." [25] As
IST was a European Union affiliated activity, their WLAN focus was on HiperLan2 which
was initially more prevalent in Europe than other WLAN solutions. Although IEEE 802.11
systems were becoming increasingly common in Europe and are expected to emerge. The
research developed a testbed, based on system emulation, designed to support protocol design
and validation in support of location-aware applications and soft QoS application services.
3.1.3 Broadband Radio Access for IP-based Networks (BRAIN)
The BRAIN project aimed at providing a broadband extension of up to 20Mbps for
hot spot applications into a cellular system. Their cellular target was GSM/GPRS/EDGE
and UMTS. Like WINE GLASS, their research focused on an all IP realization of the
cellular network. As this research was also conducted in Europe, HiperLan2 was again the
broadband system employed with this work. BRAIN research sought to define and influence
standard definitions for IP cellular systems and HiperLan2 hot spots support for "piconets."
J. Scot Ransbottom Chapter 3. Related Work 56
Handover management, path updates and support to idle mobile hosts were the focus of
their work.
3.1.4 Broadband Radio Access Network (BRAN)
The ETSI Broadband Radio Access Network (BRAN) standardization body [26] in-
vestigated, for HiperLan2, two approaches for interconnection of WLAN and UMTS net-
works. The first was a tight coupling scheme, to offer a seamless handover and the same
level of security in WLAN and UMTS networks. This approach would require a simplified
Iu interface for interconnection of WLAN network to UMTS core network. The second ap-
proach was a loose coupling scheme, which would rely on IP protocols to organize mobility
and roaming between access networks. Interworking between WLAN and the core network is
performed between the authentication, authorization, and accounting server (AAA) and the
home location register (HLR). A major conclusion was Mobile IP and the home agent/foreign
agent concept will extend mobility to any network while preserving seamless operation.
3.1.5 Vriendt et. al.
Vriendt et. al. were some of the early advocates for convergence of cellular and
WLAN technologies. In [6], the authors present the evolution of mobile communications.
They focus on the evolution of various radio technologies, and the evolution toward pure
IP-based networks, and the interworking of varied wireless access technologies. The authors
make the case that WLAN should not be perceived as a competitor or replacement for mobile
cellular systems, but rather a complementing component of the network. They state that
close interworking will provide the necessary mechanisms to ensure proper handling of traffic
based upon the most appropriate available access network.
The authors delineate the goals of 3G cellular systems to provide more capacity, new

J. Scot Ransbottom Chapter 3. Related Work 57
frequencies and higher bit rates within a single global wireless architecture and how the
efforts of 3GPP seek to accomplish those goals. The article provides good insight into the
evolution of GSM, to include GPRS, EDGE and how it will evolve to UMTS and finally to
an all IP-based network infrastructure.
Vriendt et. al. present the interworked network as three layers: the cellular layer, the
hot spot layer and the personal network layer. They identify the need for a new medium
access layer to interconnect the three layers and ensure transparent delivery across this
architecture.
The authors, like many others, define a two level taxonomy for interworking UMTS
and WLAN. These approaches are labeled a tight coupling scheme and a loose coupling
scheme. The tight coupling scheme offers seamless handover and common level of security
in either the WLAN or the UMTS network. This approach requires interconnection of the
WLAN to the core network. The loosely coupled scheme would provide integration at the
IP layer and would rely on IP layer protocols to facilitate mobility and roaming within such
a network. The current trend is toward the loosely coupled scheme and the IP protocols
currently supporting those efforts are mobile IP which will be discussed further in section
2.4.
The UMTS-WLAN simulator presented in this work was based upon the tightly
coupled approach, and the WLAN AGG-MAC protocol could be incorporated into either
type of system. The design of the interworking simulation tool was done to fully support
the more complex tight coupling while remaining adaptable to support loose coupling work
as well with limited modification.
3.1.6 Tsao and Lin
Tsao and Lin evaluated possible UMTS-WLAN interworking strategies in [27]. Like
[6], they follow the tightly coupled and loosely coupled taxonomy, but their work employs

J. Scot Ransbottom Chapter 3. Related Work 58
three UMTS-WLAN interworking strategies. The authors term their strategies mobile IP
approach, gateway approach, and emulator approach. The loosely coupled strategy is to
employ mobile IP, and they use mobile IPv4 without route optimization for consideration of
this system. The authors point out the need for mobile IP client software in every device,
and the need for home agents and foreign agents in each type of network for this strategy.
The authors point out the additional cost for handoff operations for this approach.
The other strategies more tightly couple the two networks. The gateway approach
employs a gateway between the two networks to handle routing for users who roam from one
network to another. The final and most tightly coupled approach is the emulator, in which
the WLAN is merely an access stratum into the UMTS network. In this case, the authors
connect a WLAN access point to an RNC emulator to access the network. The emulator
approach most closely resembles our approach in that our UMTS_aware AP includes the
functionality of a UMTS RNC node. The authors’ simulation results and conclusions favor
the emulation approach for having the least overhead during internetwork handover.
3.2 WLAN Performance
The onslaught, growth and subsequent successes of WLAN stimulated a significant
amount of research in the technology. Much of this research focused on mitigating the
negative affects of the wireless transmission medium. Because available bandwidth and
maximum transmission power levels are constrained, many researchers have worked to limit
the size of a frame in order to reduce the probability of error during the transmission of that
frame. It has been shown that there is benefit, especially under noisy conditions, to limiting
the size of a frame on a WLAN channel. But as in most engineering problems, trade-offs
exist. Just as a frame that is too large wastes resources when retransmitted, small frames
waste resources due to protocol overhead.

J. Scot Ransbottom Chapter 3. Related Work 59
Wireless LAN in our work was based upon IEEE 802.11 protocol standards. This is
actually a family of standards and comes in many different flavors. The original IEEE 802.11
[3] supported 1Mbps and 2Mbps data rates with frequency hopping spread spectrum. IEEE
802.11b [28] was backward compatible with the original and added support for 5.5Mbps and
11Mbps using DSSS. 802.11b is the focus of our current work. The newest variants, 802.11a
[29] and 802.11g, increase the maximum data rates to 54Mbps. The MAC layer for all ver-
sions of the 802.11 standard is based upon the well-known Ethernet paradigm. Unlike wired
Ethernet, a WLAN station is unable to listen during transmission to determine whether or
not a frame transmission was successful. For this reason, a collision avoidance mechanism
is employed by the protocol, CSMA/CA. The protocol utilizes interframe spacing (IFS) to
provide a required period of inactivity between frames in order to avoid collisions. This
IFS must be considered a part of the protocol overhead as it occupies the channel and re-
duces capacity available for data transmission. This increases the per frame communications
overhead incurred by a transmitted frame.
Several researchers have conducted work to improve WLAN MAC layer performance.
Research in WLAN MAC layer performance improvements can be classified into basically
three areas of interest: higher-layer protocols, backoff or contention algorithms, and frame
sizes. Most accepted work in the area of higher layer protocols has focused primarily on
improving TCP performance for a wireless system in which generally bursty transmission
errors rather than congestion cause frame loss. [30] compared end-to-end solutions, link-layer
solutions, and split protocol solutions and recommended enhancements to the link layer to
improve TCP performance. Research in [31] attempts to address bidirectional flow of packets
between a source and destination. This work modified the contention based DCF mechanism
to support embedding the reservation of the next transmission slot in the MAC layer ACK.
Their argument was that this would support TCP ACKs, but it would seem that insufficient
time would occur following reception of a frame to immediately respond with an ACK. This
would hold more promise in a bidirectional traffic flow type of scenario.

J. Scot Ransbottom Chapter 3. Related Work 60
Several researchers have looked at mechanisms to improve performance under con-
tention. One of the first was [32]; the authors proposed a dynamic Adaptive Contention
Window based upon estimated number of stations to dynamically control the size of the
backoff window.
It is well understood that frame size affects network performance. As discussed in
2.3.9, the original IEEE 802.11 specification defines a fragmentation threshold which es-
tablishes an upper limit on the size of a frame transmitted over the WLAN. In [3], the
fragmentation threshold is a static parameter. Because channel conditions such as noise and
interference are chiefly responsible for packet loss in WLAN systems, a number of researchers
are working to establish mechanisms to dynamically adjust frame size based upon current
channel conditions [33][34]. Most of the available research seeks to reduce the maximum
allowable frame size in order to improve the probability of successful transmission. Any
of these works are a good compliment to our research, but the focus of this research is to
increase frame size in order to limit wasted potential caused by protocol overhead. This
work recognizes that an appropriate value of fragmentation threshold should be the upper
bound on frame size, but that the MAC layer should increase the frame size up to such a
limit where possible.
3.2.1 Adaptive Fragmentation
As previously identified, fragmentation of WLAN frames that are too large for a rea-
sonable probability of successful transmission has been widely recognized as an important
performance consideration. Fragmentation mechanisms, albeit static, are included in the
original 802.11 IEEE standard [3]. The standard defines a “Fragmentation Threshold” para-
meter, ranging in size from 256Bytes up to the maximum allowable size of the MAC Service
Data Unit (MSDU), currently 2, 304Bytes. The fragmentation threshold as defined in the
IEEE standard is a fixed parameter to be set at system configuration. Additional research is

J. Scot Ransbottom Chapter 3. Related Work 61
ongoing to support the dynamic sizing of WLAN fragments and respond to changing channel
characteristics.
3.2.2 Lettieri and Srivastava
One work that is especially relevant to our initial idea for AGG-MAC was [33]. This
work provided the initial impetus for us to consider aggregation of smaller packets to generate
the optimal or near optimal frame size to balance the negative effects of protocol overhead
and error rates. In [33], goodput is defined to be “the throughput the user will see.” Although
the authors argued for the need to limit the size of large frames, they provided the foundation
for our contention that frames sizes too small are also problematic. The focus in [33] was
to reduce the size of a frame, causing the operating point to the right of the elbow of the
curve in Figure 3.1 [33], to be reduced down to a smaller, more optimal frame size through
fragmentation. Our work sought to move the operating point from the left of the elbow of
the curves in Figure 3.1 to a larger, more optimal frame size through packet aggregation.
0 100 200 300 400 500 750 1000 15000
0.1
0.2
0.3
0.4
0.5
0.6
0.7
0.8
0.9
1
Goo
dput
(nor
mal
ized
to ra
w b
it ra
te)
MTU (bytes)
Goodput vs. Frame Size for various BER
5×10⁻³
10-3
5×10⁻⁴
10-4
10-5
10-8
0 100 200 300 400 500 750 1000 15000
0.1
0.2
0.3
0.4
0.5
0.6
0.7
0.8
0.9
1
Goo
dput
(nor
mal
ized
to ra
w b
it ra
te)
MTU (bytes)
Goodput vs. Frame Size for various BER
5×10⁻³
10-3
5×10⁻⁴
10-4
10-5
10-8
0 100 200 300 400 500 750 1000 15000
0.1
0.2
0.3
0.4
0.5
0.6
0.7
0.8
0.9
1
Goo
dput
(nor
mal
ized
to ra
w b
it ra
te)
MTU (bytes)
Goodput vs. Frame Size for various BER
5×10⁻³
10-3
5×10⁻⁴
10-4
10-5
10-8
Figure 3.1: WLAN Goodput vs. MSDU for various BER

J. Scot Ransbottom Chapter 3. Related Work 62
3.2.3 Reduction of Fixed Overhead
Tourrilhes
Jean Tourrilhes was a researcher at Hewlett-Packard and maintained the LINUX
driver set for wireless LANs. [35] presented a scheme to concatenate a sequence of frames
into a frame burst. The basic concept was to permit only a SIFs between frames of a frame
burst in order to retain control of the medium and avoid releasing to contention. This
research only considered the DCF operational mode. Throughput and latency were the
primary metrics. The factors considered were load and frame size. The results indicate that
WLAN MAC protocols are not very efficient for small packet sizes and the authors propose
their Packet Frame Grouping as a possible solution to the problem.
IEEE 802.11e
The IEEE 802.11e draft standard was designed to augment the existing WLAN stan-
dards to integrate support for QoS. This draft standard was included in Related Work
because it is currently a work in progress subject to changes rather than a standard point
of reference. The 802.11e working group released a draft copy of the standard [18]. The cur-
rent draft contains a significant number of changes from the previous, indicating that the
standard has not yet solidified and may yet be far from ratification.
The relevant portion of IEEE 802.11e is actually one that was omitted from further
consideration in the standard. The working group considered frame level aggregation, also
called containerization, during their design process. [22] are minutes from a teleconference
dedicated to aggregation issues in which their concept is delineated. The intent was to
encapsulate multiple MAC frames into a single container frame. According to the minutes
[22] and subsequent notes available on the IEEE 802.11 web site, aggregation was omitted due
to the increased complexities of properly handling multiple layers of WLAN MAC headers.
J. Scot Ransbottom Chapter 3. Related Work 63
Some of the issues cited were: whether CRC was done on the internal frames or on the
aggregate frame, whether an ACK was required for each internal frame, and how to define
the length field and sequence numbers of the container frame.
3.3 Summary
This chapter presented an overview of related work. In Section 3.1, we presented work
related to the interworking of UMTS andWLAN systems to support "hot spots" in a cellular
domain. We presented worked related to WLAN performance in Section 3.2. The next two
chapters covers our work in UMTS and WLAN technologies in a tightly-coupled interworked
environment. Chapters 6 and 7 presents our AGG-MAC work to improve WLAN perfor-
mance and Chapter 8 presents identifies the remaining experimentation currently planned
in the completion of this research effort.
Chapter 4
UMTS-WLAN Design and
Methodology
This chapter presents the methodology used throughout this research and the design
of the UMTS-WLAN interworking simulation model. As discussed in Section 1.5, the purpose
of the first portion of this research effort was to create a network system-level simulation to
allow investigators to study the issues and tradeoffs for interworking the infrastructure-based
wireless LAN (WLAN) technologies into UMTS. The key contribution of this research was
the UMTS-WLAN simulation environment, specifically the enhanced user equipment node
model (UW) and the 3G-aware WLAN AP (UWLAN_AP). The techniques for interworking
these two technologies are described in Sections 4.9.4 and 4.9.2.
The interworked UMTS-WLAN research was conducted jointly with masters student
TracyMann. During the course of my studies, I guided him in the specification, design, model
implementation and initial testing of the simulation model set. Our initial implementation
was presented in [36] and was well received. Following the updated implementation and
subsequent validation and verification testing, Tracy and I outlined the testing design and he
went on to further study the performance of the UMTS-WLAN interworked system based on
64
J. Scot Ransbottom Chapter 4. UMTS-WLAN Design and Methodology 65
our models while my research efforts moved forward in the WLAN MAC layer enhancements
presented later in Chapter 6. The design and model implementation results for the UMTS-
WLAN interworking simulation model presented herein were also presented in his Masters
thesis [8]. The reader is urged to read [8] for additional performance related results of our
UMTS-WLAN interworked model set.
Selecting an appropriate, proven research methodology is a critical step in any re-
search endeavor. Resource constraints were prohibitive for implementing and testing the
interworking of UMTS and WLAN in prototype 3G wireless equipment. Therefore, a simu-
lation model was designed as the primary goal of this research. The simulation model was
developed using the commercial discrete simulation package OPNET ModelerTM . Initial
implementation was done in version 9.0.A and updated to OPNETTM version 9.1.A. The
sections in this chapter describe the simulation model developed for this research effort.
Jain presents a ten-step method of systematic performance evaluation, which is well suited
for evaluating the performance of a communications system through simulation [37]. This
method was used to create the UMTS-WLAN simulation environment.
1. State goals and define the system
2. List services and outcomes
3. Select metrics
4. List parameters
5. Select factors to study
6. Select evaluation technique
7. Select workload
8. Design experiments

J. Scot Ransbottom Chapter 4. UMTS-WLAN Design and Methodology 66
9. Analyze and interpret data
10. Present results
4.1 System Definition and Assumptions
The purpose of this portion of the research was to develop a network system level
simulation (shown in Figure 4.1) to allow investigators to study the effects of interworking
WLAN and UMTS. The research problem was defined in Section 1.1.. OPNET ModelerTM
was chosen as the simulation environment due to its flexibility and extensive model library
sets. The author created user-defined models as well as modified and augmented the existing
models in order to develop the UMTS-WLAN simulation environment. This research effort
leveraged the existing OPNETTM model libraries, specifically the UMTS and the 802.11b
WLAN model sets. Several assumptions were necessary to limit the scope of the problem.
The intent of these limiting assumptions was to keep the simulation complexity manageable,
while still meeting the research goals. This section describes assumptions made in model-
ing both the UMTS and WLAN data networks, as well as the interworking of these two
technologies.
4.1.1 UMTS Model Assumptions
The UMTS-WLAN simulation environment designed in the research leverages the
OPNETTM UMTS model set. The following sections describe the assumptions of this model
set.
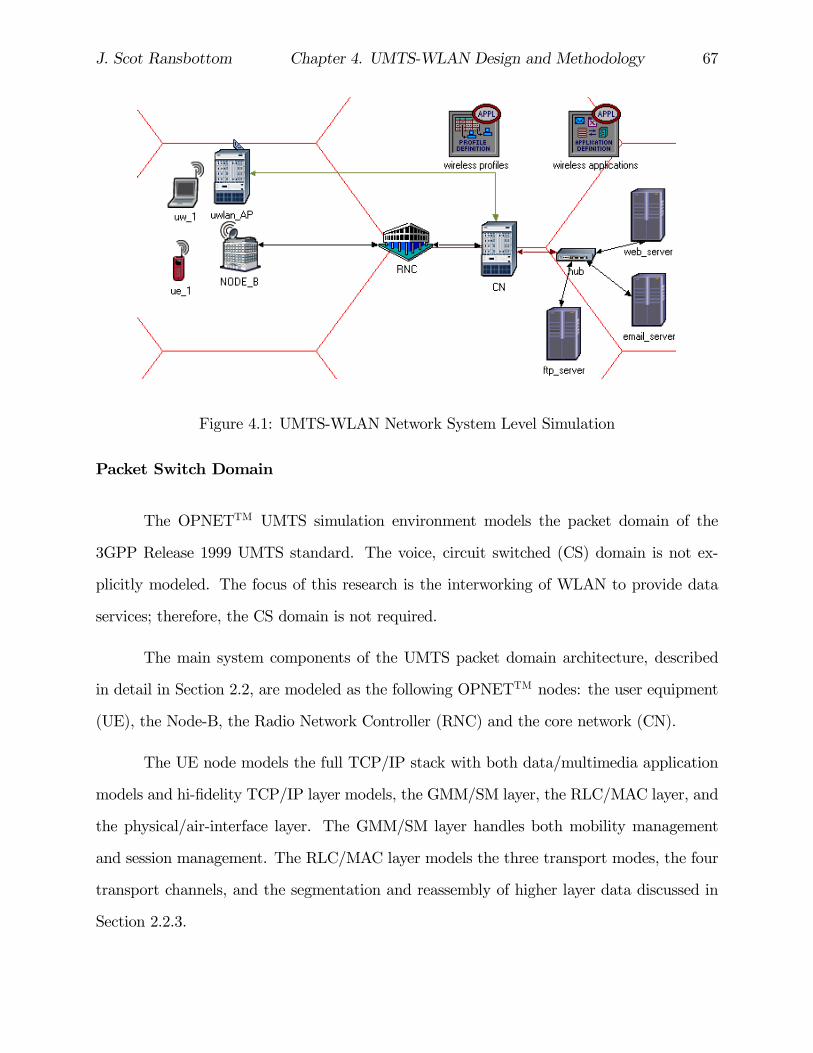
J. Scot Ransbottom Chapter 4. UMTS-WLAN Design and Methodology 67
Figure 4.1: UMTS-WLAN Network System Level Simulation
Packet Switch Domain
The OPNETTM UMTS simulation environment models the packet domain of the
3GPP Release 1999 UMTS standard. The voice, circuit switched (CS) domain is not ex-
plicitly modeled. The focus of this research is the interworking of WLAN to provide data
services; therefore, the CS domain is not required.
The main system components of the UMTS packet domain architecture, described
in detail in Section 2.2, are modeled as the following OPNETTM nodes: the user equipment
(UE), the Node-B, the Radio Network Controller (RNC) and the core network (CN).
The UE node models the full TCP/IP stack with both data/multimedia application
models and hi-fidelity TCP/IP layer models, the GMM/SM layer, the RLC/MAC layer, and
the physical/air-interface layer. The GMM/SM layer handles both mobility management
and session management. The RLC/MAC layer models the three transport modes, the four
transport channels, and the segmentation and reassembly of higher layer data discussed in
Section 2.2.3.

J. Scot Ransbottom Chapter 4. UMTS-WLAN Design and Methodology 68
The Node-B models the radio interface (physical/air-interface) with the UE, the radio
link management functionality, and the ATM interface layer that provides connectivity to the
RNC. The RNC models the RLC/MAC layer protocol interaction with the UE, handles both
UE admission control and radio bearer (RB) assignment, and provides the ATM interfaces
to the Node-B and SGSN.
The CN models the GMM/SM layer protocol interaction with the UE, handles GPRS
attach, PDP context activation, and Service requests, and provides both an IP interface to
the Internet and ATM interfaces to multiple RNCs. It models the CN functionality in the
SGSN. The GGSN as well as the tunneling between the SGSN and GGSN are not explicitly
modeled. The IP gateway functionality is modeled with an IP router stack connected to the
SGSN.
GPRS Mobility Management / Session Management
With the exception of the GPRS attach procedure, the UE synchronization that
occurs when a user powers-on is not modeled. The PS (packet-switched) signaling connection
is not modeled explicitly. The model assumes that a RRCConnection Setup procedure occurs
when a user powers-on and thus a PS signaling connection is established. This connection
is maintained for the entire simulation. The GPRS detach procedure is not modeled–a UE
will remain attached for the entire simulation [38].
Upon receipt of PDUs, the UE or network activates a PDP context if one is not
already activated. The PDP context activation includes the requested QoS profile associated
with its class of traffic. Once activated, a PDP context remains active for the remainder
of the simulation. Multiple PDP contexts per QoS, and the PDP context deactivation and
reactivation procedures are not modeled. Only one PDP context for each QoS is modeled.
The PDP context is not deactivated and is reused for subsequent data traffic associated with
the QoS. The Service Request procedure is used to establish a RAB for a PDP that is active.
J. Scot Ransbottom Chapter 4. UMTS-WLAN Design and Methodology 69
Radio Resource Management
Both the RAB Setup and Release procedures are modeled. As stated above, the
model assumes that a PS signaling connection is already established for the PDP context
activation procedure. RABs are set up by the network and are later released after being idle
for a period of time. The model does not support QoS negotiation; the SGSN model either
grants the UEs requested QoS in its entirety or rejects the request.
UMTS Air Interface
The WCDMA air interface for the FDD mode only is modeled. OPNET’s WirelessTM
module includes 13 pipeline stages to model radio interfaces. The UMTS model set develop-
ers modified the following pipeline stages to model specific WCDMA air interface behavior:
received power, background noise, interference noise, bit error rate. The packet dropping
probability is based on curves obtained from another set of simulations of the WCDMA air
interface. This simulation was accurate to the waveform level [38].
4.1.2 WLAN Model Assumptions
The UMTS-WLAN simulation environment designed in the research leverages the
OPNETTM WLAN model set. The OPNETTM WLAN simulation environment models the
WLAN MAC and PHY specifications of the IEEE 802.11b Release 1999 standard. The
following sections describe the assumptions of this model set.
The main system components of the WLAN infrastructure-based network architec-
ture, described in detail in Section 2.3.1, are the station and the WLAN AP (access point)
modeled as OPNETTM nodes.
The Station models the full TCP/IP stack with application models and hi-fidelity
TCP/IP layer models, the WLAN MAC layer, and the physical/air-interface layer. The

J. Scot Ransbottom Chapter 4. UMTS-WLAN Design and Methodology 70
WLAN AP models an IP routing stack, the WLAN MAC layer, the WLAN physical/air-
interface layer and an Ethernet MAC and physical layer. The OPNETTM 802.11 model
provides a complete representation of the MAC layer protocol, but much of the PHY is
abstracted.
Medium Access Control
The WLAN MAC supports the three access mechanisms described in Section 2.3.5:
DCF, RTS/CTS, and PCF. The interframe spacings (IFS) and binary exponential backoff
are modified based on the selection of the physical layer. The frame exchange sequence is
modeled in accordance with the standard requiring a data and acknowledgement exchange
to ensure the reliability of data transfer. The model supports data rates of 1, 2, 5.5, and 11
Mbps.
The WLAN MAC model provides tunable attributes based on the physical layer
impacts on the MAC protocols.
WLAN Air Interface
The WLAN air interface is not explicitly modeled. It is modeled with the thirteen
pipeline stages of the OPNET’s WirelessTM module. The WLAN model set developers
modified the following pipeline stages to model the specific WLAN air interface behavior:
radio receiver, channel match, propagation delay, and error correction stages.

J. Scot Ransbottom Chapter 4. UMTS-WLAN Design and Methodology 71
4.1.3 UMTS-WLAN Interworking Assumptions
Coupling Scheme
Using the coupling taxonomy defined in [6], the design approach presented in this
research used the tight coupling scheme. The UMTS-WLAN system was tightly coupled at
the RNC using theWLAN technology as an alternate radio access technology for “hot spots.”
The physical layer radio interface and the transport network layer protocols of the RNC
were replaced with WLAN MAC and PHY, while the system network and radio network
layer protocols remained with little modification. This provided a simplified interface for
interworking the WLAN network with the UMTS core network.
The design decision to use the tight coupling scheme was made for two reasons.
First, the author considers the loosely coupled scheme to be a “solved problem” by Lucent
Technologies, Inc., as stated [39]. Second, the loosely coupled scheme would integrate the
two systems at the IP layer and would rely on the IP protocols, specifically Mobile IP, to
handle mobility and roaming between the access networks. This internetwork mobility was
beyond the scope of this research.
The tightly coupled design leveraged the mobility management features of UMTS
and therefore, required a Mobile IP implementation to handle mobility and roaming. The
design using the tight coupling scheme created a controlled, baseline simulation framework
to study the interworking of WLAN and UMTS. This simulation framework was designed
to allow future investigators to easily modify the models in order to investigate the loosely
coupled scheme.
Technology Generation Independence
The simulation model was designed using the 3GPP UMTS Release 1999 as the repre-
sentative cellular phone technology and the IEEE 802.11b Release 1999 as the representative
J. Scot Ransbottom Chapter 4. UMTS-WLAN Design and Methodology 72
WLAN technology. The model was designed so that as future technologies are released, the
effect of these technologies can be studied with minimal modifications to the current design.
Mobility and Handoff
The simulation does not model UWmobility or call handoff between the UWLAN_AP
and the UMTS system. Modeling call handoff for IP data users between the two technologies
would require extensive modifications to TCP in order to “throttle back” the transmission
rate in order to facilitate handoff fromWLAN to UMTS. These modifications would enhance
the model, but were not within the scope of this research. The intent of the open architec-
ture design of this simulation model was to allow future investigators to modify the current
model set in order to study interworking affects such as this.
4.2 System Services and Outcomes
The UMTS-WLAN simulation environment will allow an investigator to study the
protocol effects and evaluate the overall system performance for an interworked UMTS-
WLAN system. The specific statistics and effects that can be studied with this simulation
environment are the control plane signaling protocol interaction, the UMTS dedicated chan-
nels (DCH) utilization, and the application response time for a variety of application traffic.
As with the 3GPP UMTS standards, the UMTS-WLANmodel separates the user and
control planes so that protocol enhancements and interactions can be studied for both data
and signaling messages independently. The model was designed so that it can be extended
to allow investigators to study the protocol effects of virtually any component or system
service.

J. Scot Ransbottom Chapter 4. UMTS-WLAN Design and Methodology 73
4.3 Performance Metrics
The UMTS-WLAN system was evaluated based upon protocol interaction, dedicated
channel utilization (DCH), data session set-up delay, and application response time (FTP
download response time and Web page response time). These performance metrics were
defined as follows:
4.3.1 Protocol Interaction
Protocol interaction was defined as the control plane signaling messages required to
complete a system level control transaction (i.e., GPRS Attach). The protocol interaction
was expressed as a sequence of signaling messages between system nodes required to complete
a transaction. The protocol interaction metric was used in the model verification process to
ensure that the simulation accurately modeled the 3GPP UMTS and IEEE 802.11 WLAN
protocol standards.
4.3.2 DCH Utilization
DCH utilization was defined as the number of active UMTS dedicated channels. DCH
utilization was measured in number of channels, and a smaller value was considered better.
The DCH utilization was used to demonstrate how the proposed interworked UMTS-
WLAN system allows the conservation of the limited UMTS cellular capacity.
4.3.3 Data Session Setup Delay
Data session setup delay was defined as the time between a client requesting an
application service to the time when the first response packet was received. The data session
setup delay was measured in seconds, and a smaller value was considered better. The data

J. Scot Ransbottom Chapter 4. UMTS-WLAN Design and Methodology 74
session setup delay included the time to establish a TCP connection, a PDP context, a Radio
Access Bearer and process a Service Request as applicable. The data session setup delay
was used to demonstrate how the UMTS-WLAN system differed from the existing WLAN
system, specifically it demonstrated the additional connection setup delay as a result of the
UMTS signaling procedures.
4.3.4 Application Response Time
FTP and Web application response times were chosen because they belong to two
different UMTS QoS profiles. Both response times were measured in seconds, and a smaller
value was considered better.
FTP download response time was defined as the time that elapses between a client
sending a “get” request and receiving the entire file. It was measured from the time a client
application sent a request to the server to the time it received the file. The FTP download
response time included the time required to transmit the entire file–it was dependent on
the file size. This time included the signaling delay for connection setup. As described in
Section 4.8, FTP download response time was used to demonstrate how the UMTS-WLAN
system differs from the existing UMTS and WLAN systems. It was also used to show how
the UMTS-WLAN system performs over a range of normal operating conditions.
Web page response time was defined as the time required to retrieve an entire HTML
page with all of its inline objects. Similar to the FTP response time, the web page response
time was measured from the time a client browser application sent the request to the web
server and ends when the client received the entire HTML page.
Both application delay performance measures were used to demonstrate the benefit
of shifting data users to the WLAN access network in terms of reduced application delays.
These performance measures were also used to demonstrate the capabilities of the inter-
worked UMTS-WLAN system over a range of normal operating conditions.

J. Scot Ransbottom Chapter 4. UMTS-WLAN Design and Methodology 75
4.4 Simulation Parameters
Inputs to the simulation model that were not varied during different simulation runs
are termed simulation parameters. The values selected for these parameters affected how
accurately the simulation modeled the actual system. The simulation parameters are given
in Table 4.1, and are discussed below.
Table 4.1: UMTS-WLAN Simulation ParametersSimulation Parameters ValuesWLAN PCF Functionality EnabledWLAN Access Point Functionality EnabledWLAN Physical Layer Characteristics Direct SequenceWLAN Data Rate 11MbpsBeacon Interval 0.02CFP Interval (sec) 0.018CFP Beacon Multiple 1UMTS Cell State DCH
4.4.1 WLAN PCF Functionality
The simulation was run with the WLAN PCF (Point Coordination Function) func-
tionality enabled. This value specified whether the Point Coordination Function was enabled
for the WLAN MAC. When enabled for the WLAN AP, its MAC acted as the point coordi-
nator for the BSS. The WLAN AP polled client nodes with the WLAN PCF functionality
enabled during the CFP, contention free period.
4.4.2 WLAN Access Point Functionality
The simulation was run with the WLAN Access Point functionality enabled for the
UWLAN_AP and disabled for all UWs. This attribute was used to assign the WLAN MAC
within the UWLAN_AP as the access point of its BSS. BSSs that deploy PCF required an
access point.

J. Scot Ransbottom Chapter 4. UMTS-WLAN Design and Methodology 76
4.4.3 WLAN Physical Layer Characteristics
The simulation was run with the WLAN physical layer characteristics set to Direct
Sequence Spread Spectrum. The value of this attribute determined the physical layer tech-
nology in use. As stated in Section 4.1.2, the WLAN PHY was not modeled explicitly; the
WLAN MAC configured the values of the following parameters as indicated in the IEEE
802.11 WLAN standard:
a) SIFS time,
b) SLOT time,
c) Minimum and Maximum contention window sizes,
d) and any other parameter value derived from the values of these parameters (like
DIFS).
4.4.4 WLAN Data Rate
The simulation was run with the WLAN data rate set to 11 Mbps. This value
specified the data rate that was used by the MAC for the transmission of the data frames
via the physical layer. The WLAN model set supported data rates specified in IEEE 802.11b
standards.
4.4.5 CFP and Beacon Intervals
The beacon interval specified the TBTT (Target Beacon Transmission Time) in sec-
onds. The AP attempted to transmit beacon frames (and subsequently mark the beginning
of a CFP for a CFP beacon multiple of 1) with a period specified by the value of this at-
tribute. As stated in Section 2.3.8, the actual start of a CFP can be slightly off, since the AP
may need to wait for the shared medium to become idle before it can transmit the beacon

J. Scot Ransbottom Chapter 4. UMTS-WLAN Design and Methodology 77
frame.
The CFP interval specified the maximum duration of the CFP in seconds. The value
of the CFP interval was dependent on the beacon interval and the CFP beacon multiple.
Based on these values, the CFP interval was calculated so that the duration of the CFP was
maximized and the CP, contention period, minimized. The reason that the duration of the
CFP was maximized was that in an infrastructure BSS (i.e. WLAN “Hot Spots”), most of
the client traffic was directed to the Internet via the AP. Therefore, one of the goals of the
system was to maximize throughput to/from the AP, and the way to accomplish this was to
minimize contention for the WLAN channel by controlling access as much as possible (i.e.
minimize the CP window).
The IEEE 802.11 Standard [3] stated that the maximumCFP interval must be limited
to allow the coexistence between the CP and the CFP (Equation 4.1).
Max_CFP_Interval = TBTT −Min_CP_Dur (4.1)
The TBTT was defined in Equation 4.2.
TBTT = Beacon_Interval ∗ CFP_Beacon_Multiple (4.2)
The minimum CP duration required sufficient time to send at least one data frame
and receive a positive ACK. To send a data frame during the CP, a station must wait a
period of a DCF interframe spacing (DIFS) to sense if the medium is idle. If idle, station A
will transmit the data frame to station B. After receiving the entire data frame, station B
will wait a period of a short interframe spacing (SIFS) and then transmit a positive ACK.
Equation 4.3 defines this relationship for the minimum CP duration.
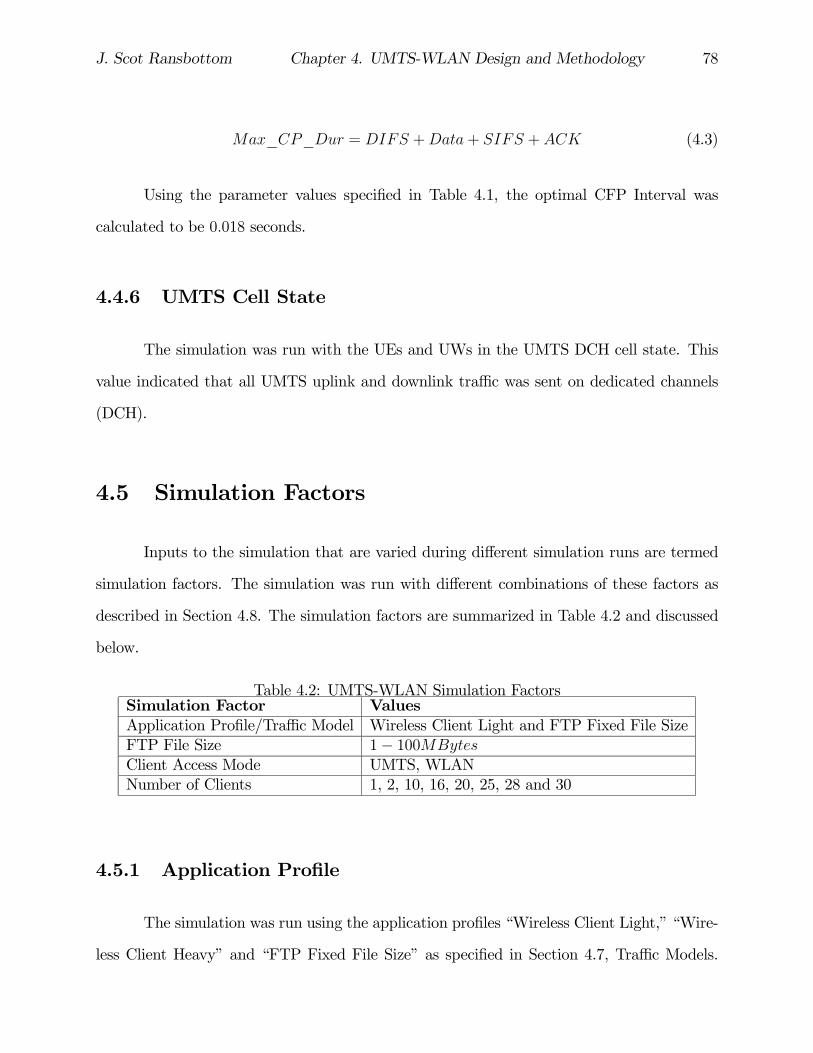
J. Scot Ransbottom Chapter 4. UMTS-WLAN Design and Methodology 78
Max_CP_Dur = DIFS +Data+ SIFS +ACK (4.3)
Using the parameter values specified in Table 4.1, the optimal CFP Interval was
calculated to be 0.018 seconds.
4.4.6 UMTS Cell State
The simulation was run with the UEs and UWs in the UMTS DCH cell state. This
value indicated that all UMTS uplink and downlink traffic was sent on dedicated channels
(DCH).
4.5 Simulation Factors
Inputs to the simulation that are varied during different simulation runs are termed
simulation factors. The simulation was run with different combinations of these factors as
described in Section 4.8. The simulation factors are summarized in Table 4.2 and discussed
below.
Table 4.2: UMTS-WLAN Simulation FactorsSimulation Factor ValuesApplication Profile/Traffic Model Wireless Client Light and FTP Fixed File SizeFTP File Size 1− 100MBytesClient Access Mode UMTS, WLANNumber of Clients 1, 2, 10, 16, 20, 25, 28 and 30
4.5.1 Application Profile
The simulation was run using the application profiles “Wireless Client Light,” “Wire-
less Client Heavy” and “FTP Fixed File Size” as specified in Section 4.7, Traffic Models.
J. Scot Ransbottom Chapter 4. UMTS-WLAN Design and Methodology 79
This value specified the names of the application profile that were enabled for a UW.
Each application profile was defined in the profile configuration object at the OPNETTM
network level. An application profile described user behavior in terms of what applications
were being used and the amount of traffic each application generated. More than one profile
can be configured for a particular client.
4.5.2 FTP File Size
The simulation was run varying the FTP file size from 1 to 100MBytes. The combi-
nation of the Application Profile, FTP file size, number of clients, and their corresponding
client access mode determined the traffic loads for both the WLAN channel and the UMTS
DCH channels. These combinations were varied in order to exercise the model to demon-
strate the system’s performance over a range of normal operating conditions.
4.5.3 Client Access Mode
The simulation was run with the UW in the UMTS mode and the WLANmode. This
value was used to determine if the UW used the WLAN or UMTS interface. In the UMTS
mode, the UW functioned as a UMTS UE. In the WLAN mode, the UW used the WLAN
interface to gain access to the UMTS PS services via the UWLAN_AP.
4.5.4 Number of Clients
The simulation was run with 1, 2, 10, 16, 20, 25, 28 and 30 clients. These values
represented the number of clients sharing access to the WLAN channel or sharing UMTS
DCH channels depending on the Client Access Mode setting. These values were selected
because they represent the number of clients that a typical UMTS cell or WLAN AP is
expected to support. The combination of the application profile, packet size, number of
J. Scot Ransbottom Chapter 4. UMTS-WLAN Design and Methodology 80
clients, and their corresponding client access mode setting determined the traffic loads for
both the WLAN channel and the UMTS DCH channels.
4.6 Evaluation Technique
The selection of a particular evaluation technique can significantly impact the out-
come of a performance evaluation. Three possible techniques of performance evaluation are
analytic, simulation, and measurement [37]. These methods differ in terms of accuracy, cost,
and required time. Based upon these factors, simulation was the most appropriate technique
for this research effort. Measurement was easily ruled out as a feasible technique based
upon both cost and required time. Commercial 3G equipment was not yet available, and
the development of prototype 3G hardware was not possible within the financial and time
constraints of this project. Analytic solutions typically offer less accuracy than simulation,
but are also less costly and often more time consuming. In this case, the cost of simulation
was negligible because the hardware and software required was already on-hand. Therefore,
simulation was used to conduct this performance analysis. Analytical methods were used in
the model verification process.
4.7 Traffic Models
The simulation model used the OPNETTM built-in application distribution models.
The built-in OPNETTM application profiles were used to closely simulate traffic generated
by a wireless data user. The application profiles used were the FTP, E-mail, and HTTP
profiles. These profiles, discussed below, were combined and parameterized in order to define
the Wireless Client application profile. The Wireless Client application profile provided a
realistic model of application data traffic, but could not be analyzed with traditional queuing
theory because the stochastic nature of the traffic does not offer closed form solutions.

J. Scot Ransbottom Chapter 4. UMTS-WLAN Design and Methodology 81
To facilitate the verification process, the FTP application was parameterized such
that a client requested a single file transfer. This configuration might provide a less realistic
model of actual FTP application data traffic, but allowed the results to be analyzed using
analytical methods and was useful in verifying correct operation of the model.
4.7.1 Wireless Client Traffic Model
The Wireless Client traffic model was defined by using the OPNETTM Standard
Network Application models. The Standard Network Application models are a set of models
that capture specific characteristics of the application that they represent. They are defined
within the application configuration object. The built-in standard network applications
are implemented in a two-tier (client-server) architecture, wherein: (1) the client issues a
request; and (2) the server receives the request and returns a response. The request-response
exchange, termed a conversation, represent a sequence of activity between the client and the
server within the context of a given application. The conversations include a pattern of data
exchanges that are defined in a statistical manner to repeat over time [40].
The Wireless Client profile described a wireless data user’s activity over a period of
time. The profile consisted of the standard network applications: FTP, E-mail, and HTTP.
The applications were parameterized in order to create a Wireless Client profile that was
representative of the data traffic generated by a typical wireless data user. These profiles
were used to generate traffic across the network.
4.7.2 File Transfer Protocol (FTP) Application
The standard OPNETTM FTP application allows file transfers between a client and
server. It permits the user to issue two basic commands for transferring a file: “get” and
“put.” TCP is the default transport protocol for this application. The FTP application was

J. Scot Ransbottom Chapter 4. UMTS-WLAN Design and Methodology 82
parameterized using the attributes in Table 4.3 [40].
Table 4.3: UMTS-WLAN FTP Application AttributesAttribute DescriptionCommand Mix (get/total) Ratio of "get" (downloads) to the total number of commandsInter-Request Time Time between subsequent file requestsFile Size (Bytes) Average size of a file being transferredType of Service QoS parameter for assigning priority to this application’s traffic
4.7.3 E-mail Application
TCP is the default transport protocol used in the standard OPNETTM E-mail ap-
plication. SMTP (Simple Mail Transport Protocol) and POP (Post Office Protocol), which
usually use TCP as the underlying transport protocol are not explicitly modeled. E-mail
is modeled as a single TCP connection between the client and the server, and the data is
transferred based on the configured send and receive attributes. The message transfer is
modeled between the client and the server, not from a client to another client. The E-mail
application was parameterized using the attributes in Table 4.4 [40].
Table 4.4: UMTS-WLAN E-mail Application AttributesAttribute DescriptionSend Interarrival Time (sec) Time between E-mails sent from the client to the serverSend Group Size Number of E-mail messages grouped before transmissionRcv Interarrival Time (sec) Time between E-mails rcv’d at the client from the serverReceive Group Size Number of E-mail messages grouped before receptionE-mail Size (bytes) Average size of an E-mail messageType of Service QoS parameter for assigning priority to this application’s traffic
4.7.4 HTTP (Web) Application
The HTTP application models web browsing. The user downloads a page from a
server. The page contains text and graphics (termed inline objects). TCP is the default

J. Scot Ransbottom Chapter 4. UMTS-WLAN Design and Methodology 83
transport protocol. Each HTTP page request may result in opening multiple TCP connec-
tions for transferring the contents of the inline objects embedded in the page. The Web
application was parameterized using the attributes in Table 4.5 [40].
Table 4.5: UMTS-WLAN HTTP (Web) Application AttributesAttribute DescriptionHTTP Specification HTTP VersionMax Connections Max number of simultaneous connectionsMax idle period Max idle time before a connection is torn down
Pipeline Buffer Size(requests)Number of HTTP request that can be bufferedtogether into a single application message
Page Interarrival Time (sec)Time between subsequent pages that auser browses
Page Properties- Object Size (bytes/object) Average size of an objectNum Objects (Object/page) Number of objects per page
Server Selection- Initial Repeat ProbabilityProbability that the user will request the nextpage from the same server
Pages per ServerNumber of pages accessed consecutivelyon the same server
Type of ServiceQoS parameter for assigning priority tothis application’s traffic
4.8 Simulation Scenarios
The simulation was run under three different scenarios termed Existing WLAN vs
UMTS-WLAN Scenario, Existing UMTS vs UMTS-WLAN Scenario, and Mixed Client Ac-
cess WLAN–UMTS Scenario. The primary difference between these scenarios was the
access network used. All three scenarios varied the simulation factors discussed in Section
4.5 and the traffic models discussed in Section 4.7 in order to vary the network traffic loads.
The performance metrics defined in Section 4.3 were used to measure performance in each
scenario.
J. Scot Ransbottom Chapter 4. UMTS-WLAN Design and Methodology 84
4.8.1 Existing WLAN vs UMTS-WLAN Scenario
The Existing WLAN vs UMTS-WLAN scenario simulated a single wireless client data
user running the FTP application. The purpose of this scenario was to demonstrate how the
existing WLAN differs from the proposed interworked UMTS-WLAN system. Both systems
were evaluated in terms of data session set-up time and application response time. The FTP
file size was varied in order to systematically vary the network traffic load.
The existing WLAN system simulated a single WLAN client accessing the network
using a WLAN access point (AP). The UMTS-WLAN system simulated a single UW in the
WLAN Client Access Mode accessing the network via the UWLAN_AP.
The data session set-up time was chosen as a performance measure because it demon-
strated the additional set-up delay that a UW encountered as a result of the UMTS signaling
procedures. The FTP download response time was chosen as a performance measure in this
scenario because it demonstrated how UMTS-WLAN system differs from the existing WLAN
systems in terms of application response time. Specifically, it demonstrated the accumulative
application delay for large file transfers as a result of the PDP header overhead.
4.8.2 Existing UMTS vs UMTS-WLAN Scenario
The Existing UMTS vs UMTS-WLAN scenario simulated a number of wireless client
data users running a mix of client applications. The purpose of this scenario was to demon-
strate how the existing UMTS system differs from the proposed interworked UMTS-WLAN
system. Both systems were evaluated in terms of their DCH utilization and application
response time.
The existing UMTS system simulated a number (1, 2, 4, 6,. . . , 18, 20) of UEs accessing
the network using UMTS dedication channels (DCH). The UMTS-WLAN system simulated
a number of UWs accessing the UMTS network via the UWLAN_AP.

J. Scot Ransbottom Chapter 4. UMTS-WLAN Design and Methodology 85
The DCH utilization was measured for both systems with 20 clients running the Wire-
less Client application profile. The DCH utilization was chosen as a performance measure
because it demonstrated how the proposed interworked UMTS-WLAN system differs from
the existing UMTS system in terms cellular capacity utilization.
The FTP download response time was measured for both systems for a single user
running the FTP application. The FTP file size was varied in order to systematically vary the
network traffic load. The FTP download response time was chosen as a performance measure
in this scenario because it demonstrated how the UMTS-WLAN system differs from the
existing UMTS system in terms of application response time. Specifically, it demonstrated
the significant differences in application response times for even relatively small file sizes.
4.8.3 Mixed Client Access WLAN–UMTS Scenario
The Mixed Client Access UMTS-WLAN scenario simulated twenty UWs running a
UMTS parameterized Wireless Client application profile. The UWs accessed the UMTS
data services via both the UWLAN-AP and the UMTS access network. The purpose of
this scenario was to exercise the interworked UMTS-WLAN system over a range of normal
operating conditions in order to demonstrate system capabilities. The client access modes
were varied from 20 WLAN and 0 UMTS to 0 WLAN and 20 UMTS varying the client
access mode by 2 each simulation run. The DCH utilization and application response time
for both FTP and HTTP traffic were collected.
Varying the client access mode had the result of systematically varying the network
traffic load for both the UWLAN_AP and the UMTS access networks. The results of this
scenario were analyzed in terms of DCH utilization, FTP and HTTP application response
time.
The DCH utilization was chosen as a performance measure because it demonstrated
how the proposed interworked UMTS-WLAN system allows wireless data users to be shifted
J. Scot Ransbottom Chapter 4. UMTS-WLAN Design and Methodology 86
to the WLAN access network so that cellular capacity is conserved and available to support
cellular voice subscribers.
Both the HTTP and FTP application response times were chosen as a performance
measures because they both belong to different QoS profiles. This allowed us to analyze the
effect of varying the network traffic load in terms of application response time.
4.9 UMTS-WLAN Interworked System Design
The simulation was designed in OPNET ModelerTM using a top-down design ap-
proach. ModelerTM uses a hierarchical structure of network scenarios, nodes and processes.
The top level of the simulation graphically depicted the network containing the Enhanced
WLAN Access Point (termed UWLAN_AP), the Enhanced User Equipment (termed UW),
the Core Node (CN), the Radio Network Controller (RNC), the Node Base Station (Node-B),
the UMTS User Equipment (UE), and the Application server. The UWLAN_AP and UW
were designed at the node level using both built-in OPNETTM processes and user-defined
processes. User defined processes, UWLAN_AP Controller and UW_MAC_IF_Control,
were defined at the process level using state diagrams. The simulation actions in each state
of the user-defined processes were defined with a combination of C code and built-in OPNET
functions. This section presents an overview of the simulation design at the network, node,
and process levels.
The UMTS-WLAN system was designed in accordance with the second scenario as
defined by the 3GPP Feasibility Study for Interworking WLAN into 3G Wireless Systems
[7]. This design leveraged the resources of the OPNETTM UMTS specialized model set as
the representative 3G cellular system [1] and 802.11b model set as the representative WLAN
system.
The design created an enhanced UE (termed UW- discussed in detail in Section 4.9.4).

J. Scot Ransbottom Chapter 4. UMTS-WLAN Design and Methodology 87
The UW was augmented with the capability to selectively gain network access through
either a UMTS Node-B or through a 3G-aware WLAN network The WLAN network was
made 3G aware by tightly coupling the WLAN access point (AP) at the UMTS Radio
Network Controller (RNC) to create an enhancedWLAN access point (termed UWLAN_AP
- discussed in detail in Section 4.9.2). The UWLAN_AP was augmented with the RNC
functionality and the capability to process UMTS control messages in order to build an
access control table to support UMTS authentication and access control. Together, the UW
and UWLAN_AP created a simulation framework for interworking the WLAN technology
into UMTS as an alternate radio access network for supporting “hot spots.” This would
conceptually be an airport, or office building or other indoor area with high concentration
of wireless data users.
4.9.1 Network Level
The simulation network level, depicted graphically in Figure 4.1, consisted of a number
of UWs with the capability to access the UMTS packet network via either the UWLAN_AP
or the UMTS Node-B depending on their client access mode setting. In the WLAN client
access mode, the UW gains network access through the UWLAN_AP to the CN. In the
UMTS client access mode, the UW gains access through the Node-B to the RNC and CN.
At simulation start up, the network initializes. Once the network is initialized, the
UWs “power on” and perform a GMM_Attach procedure in order to authenticate with the
UMTS network. The GPRS Mobility Management (GMM) Attach procedure, discussed in
detail in Section 2.10, is performed to register the UW for the GPRS network services by
notifying the SGSN of its location and to establish a PS signaling connection with the SGSN.
The GMM protocol provides a logical connection between the UW and the CN, specifically
the SGSN, for this procedure to occur. The OPNETTM UMTS model set explicitly models
the GMM attach procedure between the UE and the SGSN. The WLAN AP had to be
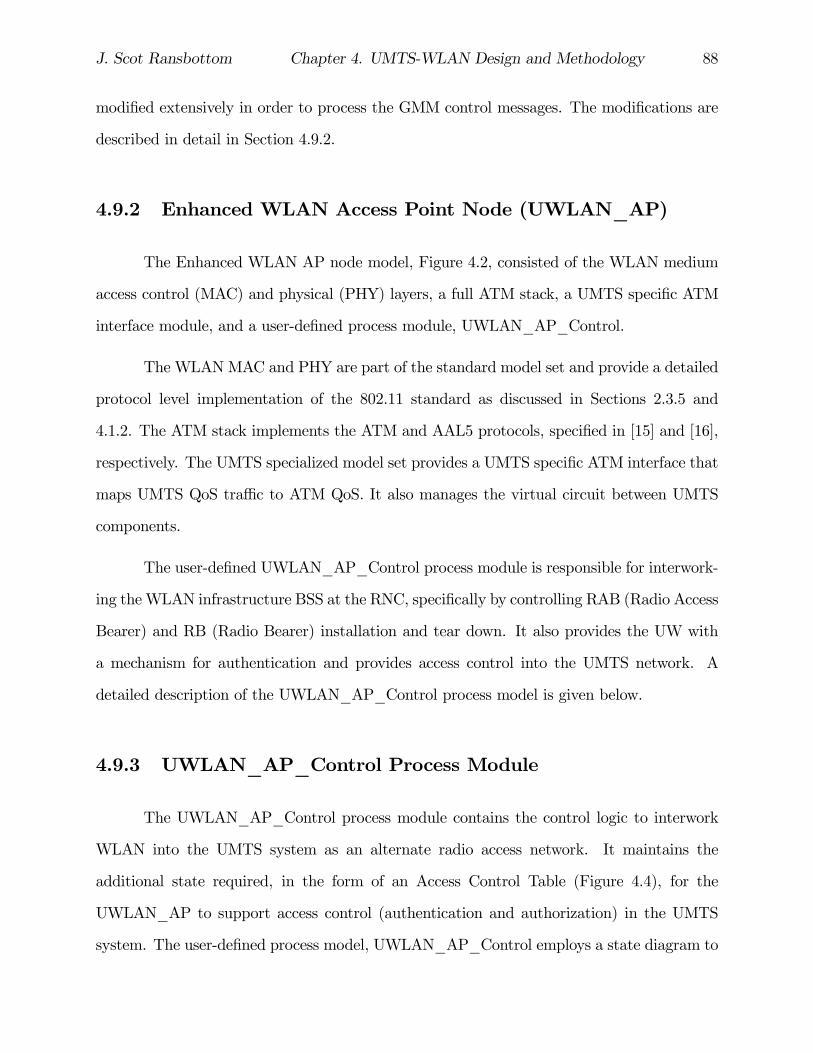
J. Scot Ransbottom Chapter 4. UMTS-WLAN Design and Methodology 88
modified extensively in order to process the GMM control messages. The modifications are
described in detail in Section 4.9.2.
4.9.2 Enhanced WLAN Access Point Node (UWLAN_AP)
The Enhanced WLAN AP node model, Figure 4.2, consisted of the WLAN medium
access control (MAC) and physical (PHY) layers, a full ATM stack, a UMTS specific ATM
interface module, and a user-defined process module, UWLAN_AP_Control.
The WLANMAC and PHY are part of the standard model set and provide a detailed
protocol level implementation of the 802.11 standard as discussed in Sections 2.3.5 and
4.1.2. The ATM stack implements the ATM and AAL5 protocols, specified in [15] and [16],
respectively. The UMTS specialized model set provides a UMTS specific ATM interface that
maps UMTS QoS traffic to ATM QoS. It also manages the virtual circuit between UMTS
components.
The user-defined UWLAN_AP_Control process module is responsible for interwork-
ing theWLAN infrastructure BSS at the RNC, specifically by controlling RAB (Radio Access
Bearer) and RB (Radio Bearer) installation and tear down. It also provides the UW with
a mechanism for authentication and provides access control into the UMTS network. A
detailed description of the UWLAN_AP_Control process model is given below.
4.9.3 UWLAN_AP_Control Process Module
The UWLAN_AP_Control process module contains the control logic to interwork
WLAN into the UMTS system as an alternate radio access network. It maintains the
additional state required, in the form of an Access Control Table (Figure 4.4), for the
UWLAN_AP to support access control (authentication and authorization) in the UMTS
system. The user-defined process model, UWLAN_AP_Control employs a state diagram to
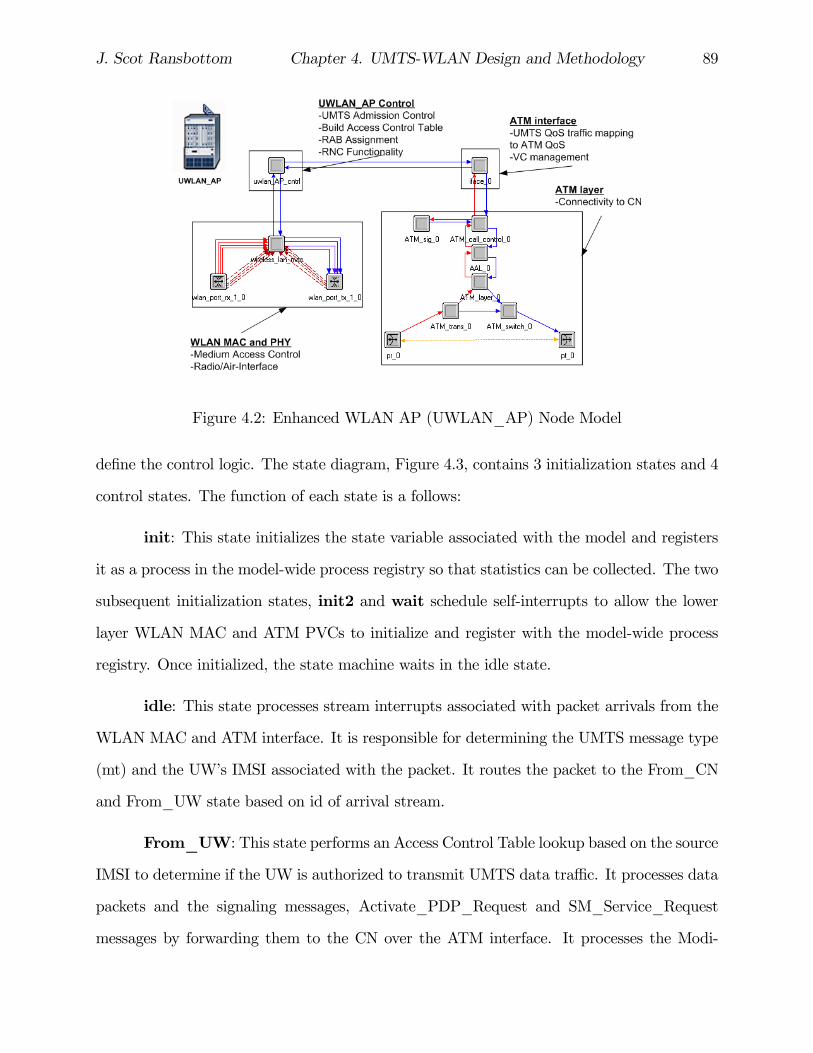
J. Scot Ransbottom Chapter 4. UMTS-WLAN Design and Methodology 89
Figure 4.2: Enhanced WLAN AP (UWLAN_AP) Node Model
define the control logic. The state diagram, Figure 4.3, contains 3 initialization states and 4
control states. The function of each state is a follows:
init: This state initializes the state variable associated with the model and registers
it as a process in the model-wide process registry so that statistics can be collected. The two
subsequent initialization states, init2 and wait schedule self-interrupts to allow the lower
layer WLAN MAC and ATM PVCs to initialize and register with the model-wide process
registry. Once initialized, the state machine waits in the idle state.
idle: This state processes stream interrupts associated with packet arrivals from the
WLAN MAC and ATM interface. It is responsible for determining the UMTS message type
(mt) and the UW’s IMSI associated with the packet. It routes the packet to the From_CN
and From_UW state based on id of arrival stream.
From_UW: This state performs an Access Control Table lookup based on the source
IMSI to determine if the UW is authorized to transmit UMTS data traffic. It processes data
packets and the signaling messages, Activate_PDP_Request and SM_Service_Request
messages by forwarding them to the CN over the ATM interface. It processes the Modi-
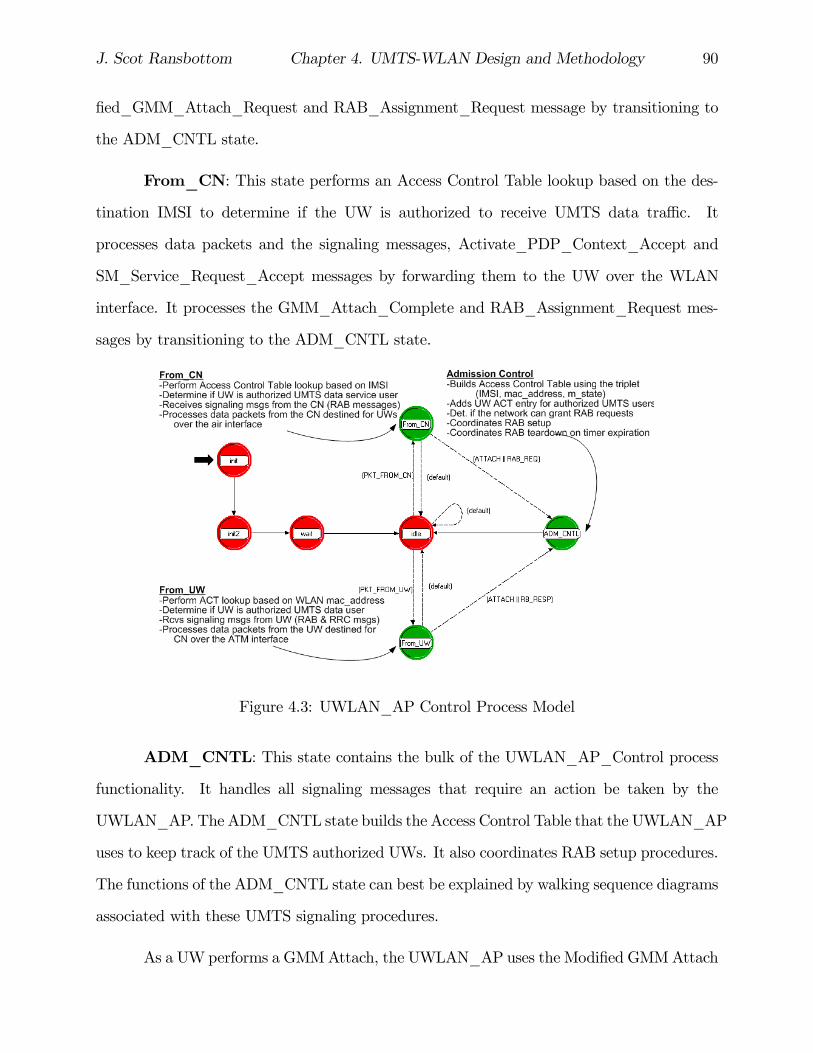
J. Scot Ransbottom Chapter 4. UMTS-WLAN Design and Methodology 90
fied_GMM_Attach_Request and RAB_Assignment_Request message by transitioning to
the ADM_CNTL state.
From_CN: This state performs an Access Control Table lookup based on the des-
tination IMSI to determine if the UW is authorized to receive UMTS data traffic. It
processes data packets and the signaling messages, Activate_PDP_Context_Accept and
SM_Service_Request_Accept messages by forwarding them to the UW over the WLAN
interface. It processes the GMM_Attach_Complete and RAB_Assignment_Request mes-
sages by transitioning to the ADM_CNTL state.
Figure 4.3: UWLAN_AP Control Process Model
ADM_CNTL: This state contains the bulk of the UWLAN_AP_Control process
functionality. It handles all signaling messages that require an action be taken by the
UWLAN_AP. The ADM_CNTL state builds the Access Control Table that the UWLAN_AP
uses to keep track of the UMTS authorized UWs. It also coordinates RAB setup procedures.
The functions of the ADM_CNTL state can best be explained by walking sequence diagrams
associated with these UMTS signaling procedures.
As a UWperforms a GMMAttach, the UWLAN_AP uses the Modified GMMAttach

J. Scot Ransbottom Chapter 4. UMTS-WLAN Design and Methodology 91
Request message to build the Access Control Table. The UWLAN_AP adds a UW entry,
Figure 4.4, using the triplet (IMSI, MAC_Address, M_State). The Access Control Table
provides the UWLAN_AP with the ability to look at a packet. Based on its IMSI either
support access or drop the packet thereby denying access. The Modified_GMM_Attach
procedure is discussed in detail in Section 4.9.3. The UWLAN_AP Control process also
implements the PDP_Context_Activation, and RAB_Assignment procedures both of which
are discussed later in Section 4.9.3.
IMSI,MAC_Address,M_State
Figure 4.4: UWLAN_AP Access Control Table Entry
Modified GMM Attach Procedure
The GMM protocol, which logically operates between the UE and the SGSN, provides
the basic signaling mechanisms for controlling mobility management and authentication into
the UMTS PS domain. The GMM Attach procedure is the signaling required to implement
this protocol. In order for the UWLAN_AP to build the Access Control Table and thus con-
trol access to the UMTS network, the GMM Attach procedure was modified. The sequence
diagram for the Modified GMM Attach procedure is shown in Figure 4.5.
The GMM Attach process is a 3-way handshake process between the GMM modules
in the UW and the SGSN, where the UW requests access, the SGSN accepts, and the UW
acknowledges. The steps of the Modified GMM Attach procedure and the actions taken by
the key processes are below:
1. The GMM in the UW generates a GMM_Attach_Request.
1a. The UW_MAC_IF_Control process in the UW destroys the original request
and generates a Modified_GMM_Attach_Request and forwards it to the UWLAN_AP.
The Modified_GMM_Attach_Request message, Figure 4.6,uses 32 bits of the 144 unused
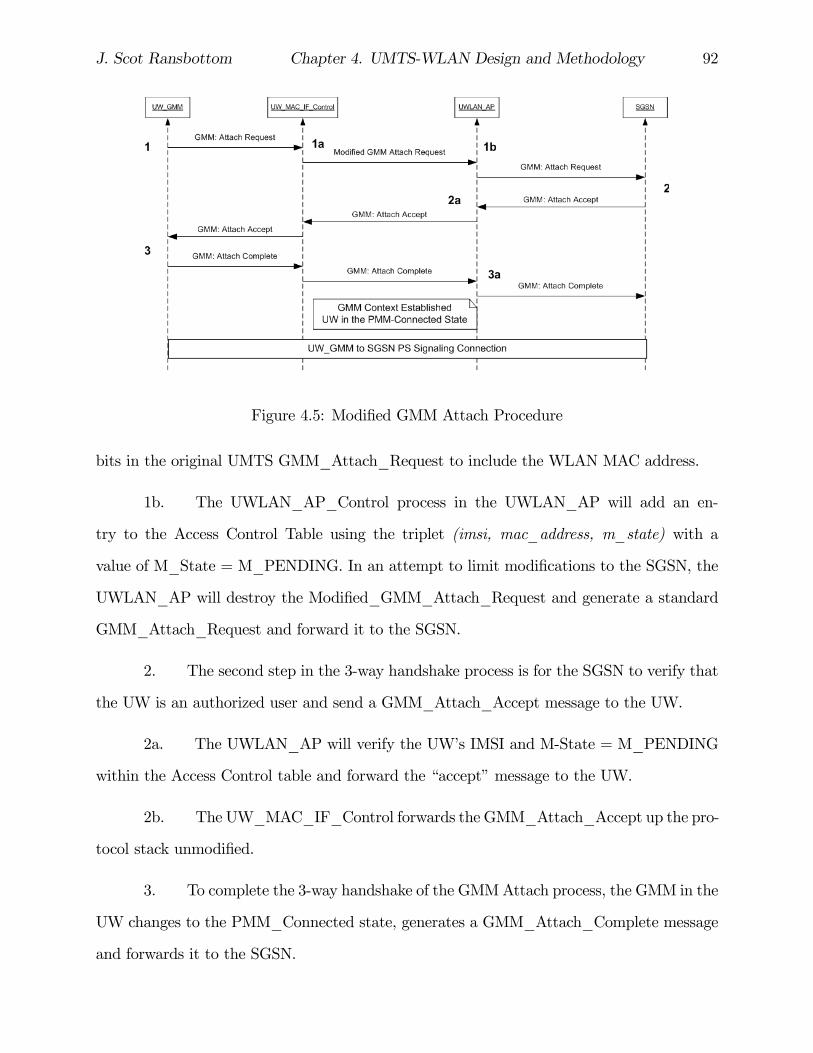
J. Scot Ransbottom Chapter 4. UMTS-WLAN Design and Methodology 92
Figure 4.5: Modified GMM Attach Procedure
bits in the original UMTS GMM_Attach_Request to include the WLAN MAC address.
1b. The UWLAN_AP_Control process in the UWLAN_AP will add an en-
try to the Access Control Table using the triplet (imsi, mac_address, m_state) with a
value of M_State = M_PENDING. In an attempt to limit modifications to the SGSN, the
UWLAN_AP will destroy the Modified_GMM_Attach_Request and generate a standard
GMM_Attach_Request and forward it to the SGSN.
2. The second step in the 3-way handshake process is for the SGSN to verify that
the UW is an authorized user and send a GMM_Attach_Accept message to the UW.
2a. The UWLAN_AP will verify the UW’s IMSI and M-State = M_PENDING
within the Access Control table and forward the “accept” message to the UW.
2b. The UW_MAC_IF_Control forwards the GMM_Attach_Accept up the pro-
tocol stack unmodified.
3. To complete the 3-way handshake of the GMMAttach process, the GMM in the
UW changes to the PMM_Connected state, generates a GMM_Attach_Complete message
and forwards it to the SGSN.

J. Scot Ransbottom Chapter 4. UMTS-WLAN Design and Methodology 93
3a. The UWLAN_AP will once again verify the UW’s IMSI and M_State =
M_PENDING; change the M_State = M_CONNECTED and forward the message to the
SGSN. At this point the UW is authorized into the UMTS network and is allowed to use
the UMTS resources via the WLAN access network.
Figure 4.6: Modified GMM Attach Request Message Format
Modified RAB Assignment Procedures
The PDP Context Activation and Modified RAB Assignment Procedures are shown
below in Figure 4.7. Upon receiving PDUs on a QoS for which the UW does not have an
active PDP Context, the GMM in the UWwill request an active PDP Context using the PDP
Context Activation procedure. This procedure is unmodified from the standard, except that
the UWLAN_AP_Control process (see 1a in Figure 4.7) inspects the IMSI and performs an
Access Control Table lookup to ensure that the UW is authorized services. This procedure
is discussed in detail in Section 2.2.6. The modification of the UWLAN_AP inspecting the
IMSI and performing an Access Control Table lookup applies to all packets (both data and
signaling); therefore, for brevity, this modification will not be repeated for every message.
The modifications to the RAB Assignment Request procedure occurs at 2a in Figure
4.7. The standard RAB Assignment procedure requires the RNC to reserve resources for a
Radio Bearer (RB) between the UE and the Node-B as discussed in Section 2.2.6. TheWLAN
protocol does not support resource reservation; therefore, this portion of the procedure is
not required. A future enhancement to this system could be to modify the WLAN protocol
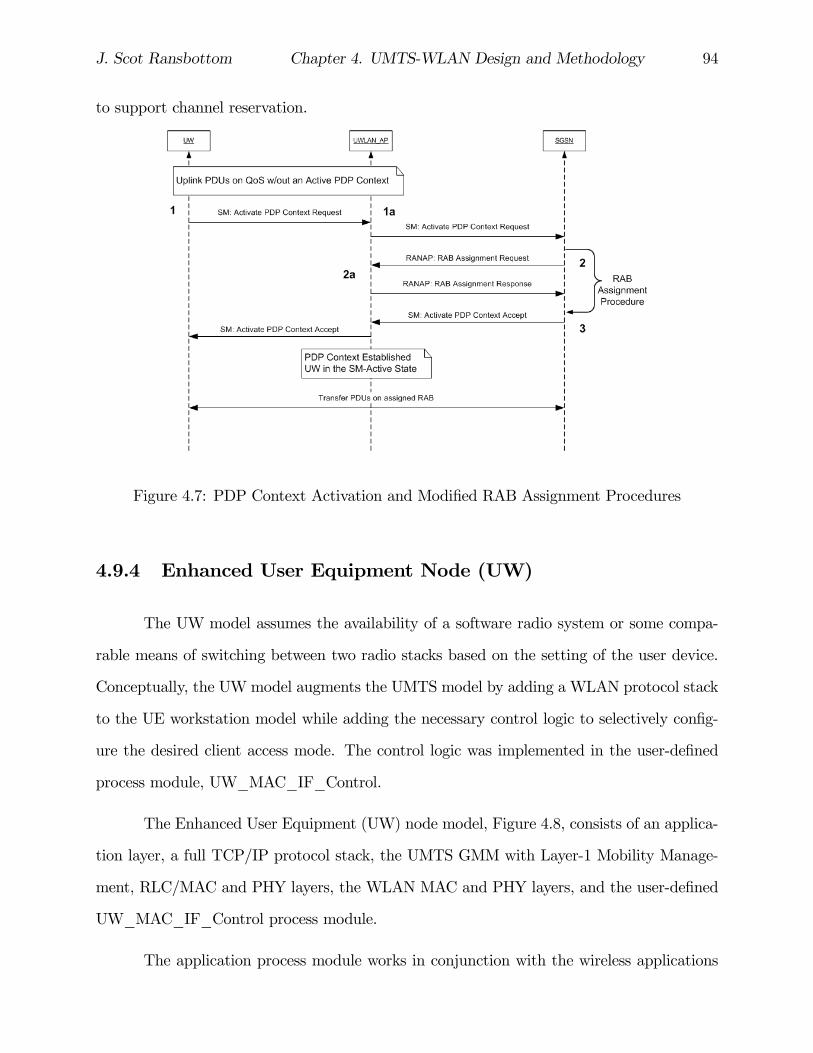
J. Scot Ransbottom Chapter 4. UMTS-WLAN Design and Methodology 94
to support channel reservation.
Figure 4.7: PDP Context Activation and Modified RAB Assignment Procedures
4.9.4 Enhanced User Equipment Node (UW)
The UW model assumes the availability of a software radio system or some compa-
rable means of switching between two radio stacks based on the setting of the user device.
Conceptually, the UWmodel augments the UMTS model by adding a WLAN protocol stack
to the UE workstation model while adding the necessary control logic to selectively config-
ure the desired client access mode. The control logic was implemented in the user-defined
process module, UW_MAC_IF_Control.
The Enhanced User Equipment (UW) node model, Figure 4.8, consists of an applica-
tion layer, a full TCP/IP protocol stack, the UMTS GMM with Layer-1 Mobility Manage-
ment, RLC/MAC and PHY layers, the WLAN MAC and PHY layers, and the user-defined
UW_MAC_IF_Control process module.
The application process module works in conjunction with the wireless applications

J. Scot Ransbottom Chapter 4. UMTS-WLAN Design and Methodology 95
and profiles utilities, shown in the network model (Figure 4.1), to define the application traffic
that will be applied to the simulation. The standard applications utility module, discussed
in detail in Section 4.7, defines a set of client-server based application transactions, including
E-mail, Web browsing (HTTP), and File Transfer Protocol (FTP) traffic. The profiles utility
allows the user to define a mix of applications from the application utility to form a profile
that is representative of a client’s application use.
The standard OPNETTM TCP/UDP/IP protocol stack provides a high-fidelity im-
plementation of the transport and network layers.
Figure 4.8: Enhanced User Equipment (UW) Node Model
The GMM module provides a detailed implementation of the GPRS Mobility Man-
agement/Session Management (GMM/SM) layers of the UMTS control plane, discussed in
detail in Section 2.2.4. The GMM, which logically operates between the UW and the SGSN,
provides the basic signaling mechanisms for controlling mobility management and UW au-

J. Scot Ransbottom Chapter 4. UMTS-WLAN Design and Methodology 96
thentication into the UMTS PS domain. The SM protocol is responsible for establishing and
releasing packet data sessions, called packet data protocol (PDP) contexts within the UMTS
network.
The RLC/MAC module provides a detailed implementation of the UMTS Reliable
Link Control and Medium Access Control layer, discussed in detail in Section 2.2.5. The
RLC portion of the module supports the transfer of user data in three modes: transparent,
unacknowledged, and acknowledged modes as specified by the protocol in 3G TS 25.322.
The module provides logical link control over the radio interface and can provide several
simultaneous RLC links per UW with each link being identified by it own radio bearer (RB)
ID. The MAC portion of the module implements the radio channel access signaling as spec-
ified in 3G TS 25.321. It provides this service as a set of logical channels. It (de)multiplexes
protocol data units (PDUs) from the RLC into transport blocks that are delivered to/from
the physical layer. The PHY portion of the module maps the logical transport channels to
the physical channels to be processed through the WirelessTM module’s 13-stage pipeline air
interface model.
The WLAN MAC and PHY were implemented as stated above in the UWLAN_AP
discussion, Section 4.9.2.
The user-defined UW_MAC_IF_Control process module is responsible for selec-
tively switching the radio air interface between the UMTS radio stack and the WLAN radio
stack. It does this by inspecting the model attribute Client Access Mode. When the Client
Access Mode is set to UMTS, the UW_MAC_IF_Control routes packets to the UMTS
RLC/MAC layer and the UW functions as a standard UE.
When the Client Access Mode is set to WLAN, the UW_MAC_IF_Control routes
packets to the WLAN MAC layer and the UW uses WLAN as the radio access network via
the UWLAN_AP. The modification to the GMM_Attach_Request, discussed in Section
4.9.3, is the only modification to the UMTS signaling.

J. Scot Ransbottom Chapter 4. UMTS-WLAN Design and Methodology 97
4.9.5 Core Network (CN)
The following three sections give a brief node model overview of the existing OPNETTM
UMTS specialized model set that was leveraged for this research.
The UMTS Core Network (CN) node model, Figure 4.9, consists of the SGSN process
model, eight ATM layer interfaces to provide connectivity to the RNCs and UWLAN_AP,
and a full IP router stack to interface with the Internet at large.
The CN model abstracts the operation of the Serving and Gateway GPRS Support
Nodes (SGSN/GGSN), as well as the authentication center (AuC) and visitor location reg-
ister (VLR) into one node model. The internal interaction between these entities is not
simulated. The IP gateway functionality in the GGSN is modeled as IP routing stack and
the SGSN process module interfaces the IP process module of this IP routing stack. The
ATM stacks provide connectivity to the RNCs and the UWLAN_AP.
4.9.6 Serving GPRS Support Node (SGSN) Process Module
The SGSN process module models the two system network protocols in the UMTS
control plane: the GPRS Mobility Management (GMM) and the Session Management (SM)
protocols. The GMM protocol signaling is modeled between the UE and the SGSN with
the various GMM_Attach_* messages to provide the basic signaling mechanisms for mo-
bility management and authentication functions within UMTS PS domain. The SM proto-
col signaling is modeled between the UE/UW with the various PDP_Activate_* and Ser-
vice_Request_* messages in order to establish/release packet data sessions, called packet
data protocol (PDP) contexts within the UMTS network. The SM protocol signaling is
modeled between the RNC/UWLAN_AP with the various RAB_Assignment_* messages
in order establish/release Radio Access Bearer (RAB) assignments between the UE and its
SGSN. The RAB assignment process triggers the establishment of a Radio Bearer (RB), the
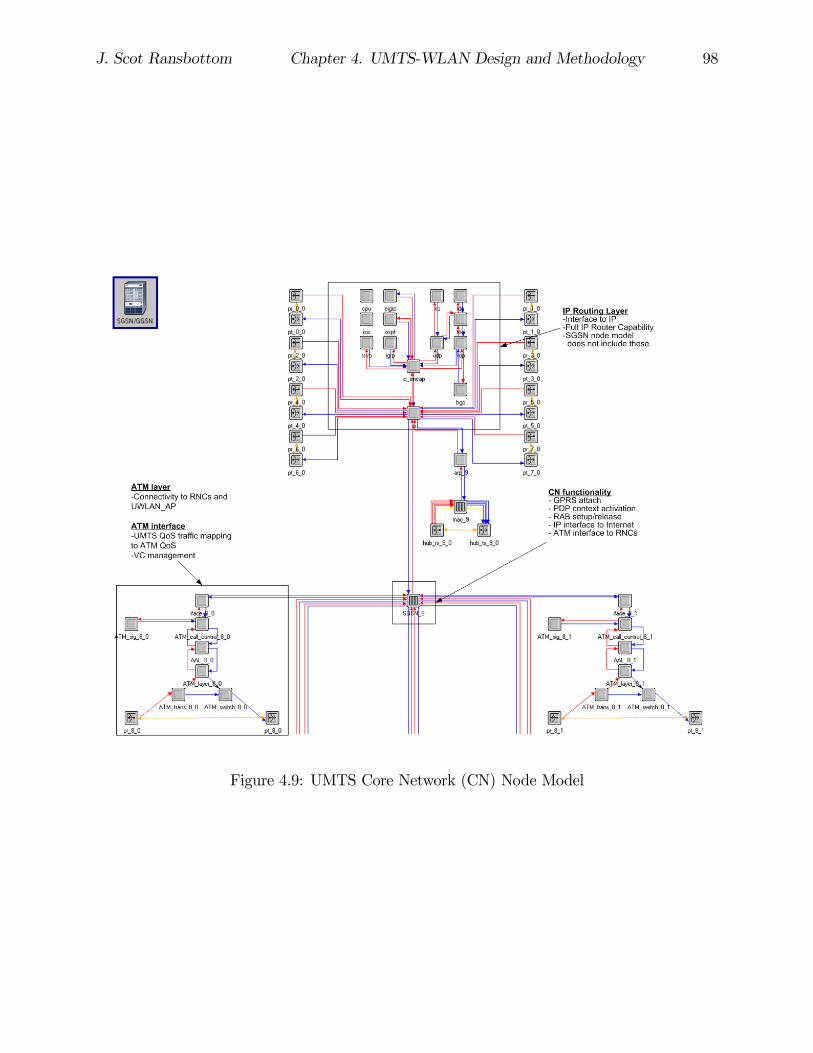
J. Scot Ransbottom Chapter 4. UMTS-WLAN Design and Methodology 98
Figure 4.9: UMTS Core Network (CN) Node Model
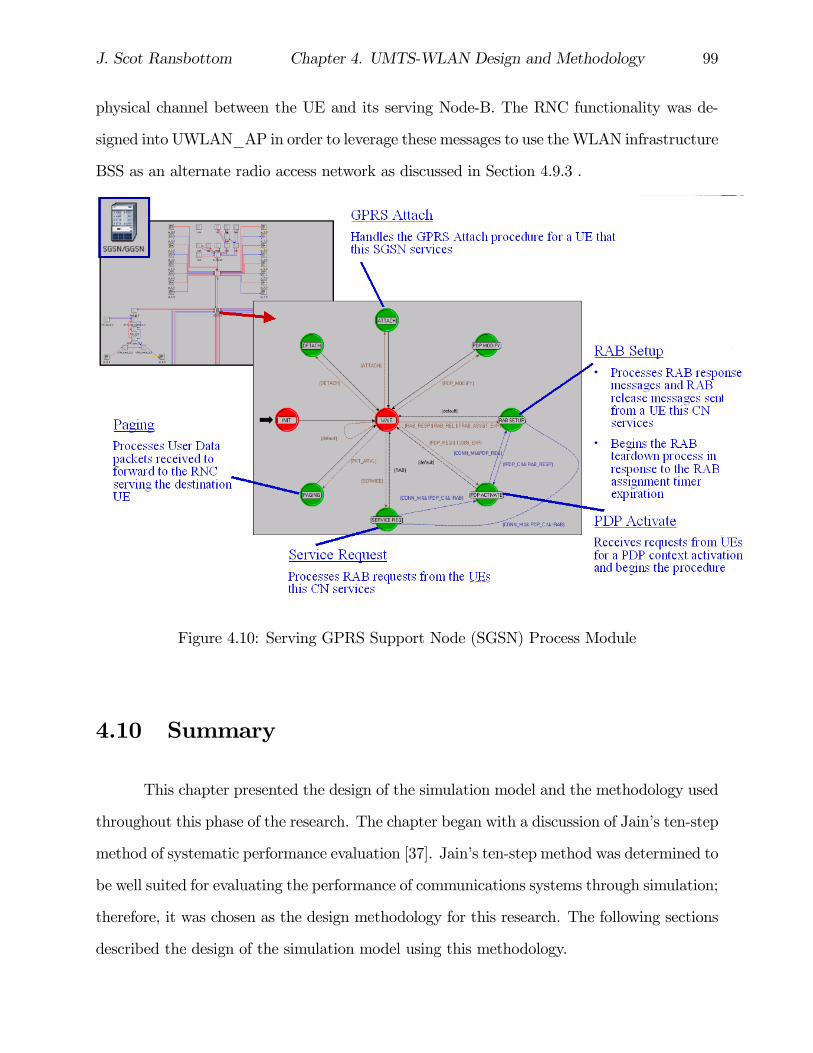
J. Scot Ransbottom Chapter 4. UMTS-WLAN Design and Methodology 99
physical channel between the UE and its serving Node-B. The RNC functionality was de-
signed into UWLAN_AP in order to leverage these messages to use theWLAN infrastructure
BSS as an alternate radio access network as discussed in Section 4.9.3 .
Figure 4.10: Serving GPRS Support Node (SGSN) Process Module
4.10 Summary
This chapter presented the design of the simulation model and the methodology used
throughout this phase of the research. The chapter began with a discussion of Jain’s ten-step
method of systematic performance evaluation [37]. Jain’s ten-step method was determined to
be well suited for evaluating the performance of communications systems through simulation;
therefore, it was chosen as the design methodology for this research. The following sections
described the design of the simulation model using this methodology.

J. Scot Ransbottom Chapter 4. UMTS-WLAN Design and Methodology 100
Section 4.1 presented the definition of the system to be modeled and detailed the
assumptions that were necessary to limit the scope of the problem. It described the as-
sumptions made in modeling both the UMTS and WLAN data networks, as well as the
interworking of these two technologies. The selection of these assumptions was a critical
step in order to keep the simulation complexity manageable, while still meeting the research
goals.
The system services and outcomes were discussed in Section 4.2. This section ex-
plained the possible usages of the UMTS-WLAN simulation environment. These included
the investigation of the protocol effects and overall system performance for an interworked
UMTS-WLAN system. The specific statistics and effects that can be studied with this
simulation environment were listed as the control plane signaling protocol interaction, the
UMTS dedicated channels (DCH) utilization, and application response time for a variety of
application traffic.
Section 4.3 presented the performance measures used to evaluate the UMTS-WLAN
system. These performance measures included protocol interaction, dedicated channel uti-
lization (DCH), data session set-up delay, and application response time.
Inputs to the simulation model that were not varied during different simulation runs
were termed simulation parameters. Section 4.4 presented the simulation parameters used
to model the UMTS-WLAN system. The selection of these values was important because
they affected how accurately the simulation modeled an actual system. The simulation
parameters were given in Table 4.1.
Inputs to the simulation that were varied during different simulation runs were termed
simulation factors. Section 4.5 presented the simulation factors used to exercise the simula-
tion environment across a spectrum of normal operating conditions. The simulation factors
were summarized in Table 4.2.
Section 4.6 presented the decision to use simulation was the primary tool used through-

J. Scot Ransbottom Chapter 4. UMTS-WLAN Design and Methodology 101
out this research. It also highlighted that OPNET ModelerTM 9.1.A was used to implement
and test the UMTS-WLAN simulation environment.
The selection of the appropriate traffic models to test the simulation environment was
a critical step to ensure that the systemmodeled an actual UMTS-WLAN system. Section 4.7
presented the traffic models used in this research endeavor. The traffic models were designed
using the OPNETTM built-in application models. These profiles were parameterized in order
to closely simulate traffic generated by a wireless data user. The application profiles used
were the FTP, E-mail, and HTTP profiles.
Section 4.8 presented the three scenarios that where used to test the simulation model.
The three scenarios were termed ExistingWLAN vs UMTS-WLAN Scenario, Existing UMTS
vs UMTS-WLAN Scenario, and Mixed Client Access WLAN–UMTS Scenario. The primary
difference between these scenarios was the access network used. All three scenarios varied
the simulation factors and the traffic models in order to vary the network traffic load.
Section 4.9 described the design of the simulation in detail. The simulation was
designed in OPNET ModelerTM 9.1.A using a top-down design approach. ModelerTM uses
a hierarchical structure of network scenarios, nodes and processes. This section presented
an overview of the simulation design at the network, node, and process levels. A detailed
description of how the UWLAN_AP and UW were designed at the node level using both
built-in OPNETTM processes and user-defined processes was also given.
The next chapter provides results from the UMTS-WLAN network simulation models.

Chapter 5
UMTS-WLAN Results
This chapter presents the simulation results and analysis and is the product of work
jointly conducted with Tracy Mann. The chapter begins with a discussion of the simula-
tion results’ statistical accuracy in Section 5.1. Subsequent sections represent work jointly
conducted with Tracy Mann. These results are also presented in his Masters Thesis [8].
We jointly designed and implemented the UMTS-WLAN simulation tools and conducted
the initial validation and verification testing presented in Section 5.2. Additional perfor-
mance testing results are presented in [8], as I was involved in the design of the performance
tests, but not in the actual execution of those tests. The reader is urged to reference [8]
for additional performance testing results of the UMTS-WLAN interworking simulation set.
While Tracy continued testing the UMTS-WLAN models, my research activities branched
to AGG-MAC which is presented later in Chapters 6 and 7.
The research questions were intended to provide a context in which to exercise the
UMTS-WLAN models over a range of normal or anticipated operating conditions and to
demonstrate the functionality of the UMTS-WLAN simulation environment. The research
questions for this phase of the research were originally stated in Section 1.4. The questions
related to the UMTS-WLAN interworked phase of our research are restated here for ease of
102

J. Scot Ransbottom Chapter 5. UMTS-WLAN Results 103
reference:
1. What are the benefits associated with a tightly-coupled UMTS-WLAN interworked
system?
2. How does a tightly-coupled, interworked UMTS-WLAN system perform?
5.1 Statistical Accuracy
The use of stochastic processes introduces a measure of uncertainty in simulation
results. Running a simulation with different random number generator seeds will produce
different results. In this research, the simulation model was run with five different seed values
for each set of input parameters. The statistical accuracy of the results was measured as
a confidence interval. The 95-percent confidence interval was calculated with Equation 5.1,
where x is the mean, s is the standard deviation, n is the number of samples, and t[1−α/2;n−1]
is the (1− α/2) -quantile of the Student t distribution with n− 1 degrees of freedom [37].
100(1− α)%CI =
µx− t[1−α/2;n−1]
s√n, x+ t[1−α/2;n−1]
s√n
¶(5.1)
The simulation results for the FTP application traffic had very tight confidence inter-
vals. Table 5.1 gives the FTP download response time results for a single UW in the WLAN
Client Access Mode with FTP application traffic. As an example, consider the right-most
column for an FTP file size of 60 MBytes. The average FTP download response time for all
five seeds was 448.6591 seconds with a 95-percent confidence interval of 448.5574 to 448.7607
seconds. There was a less than 1-percent difference between the minimum and maximum
FTP response times for all of file sizes.
The simulation results for the Wireless Client application traffic also had very tight
confidence intervals. Table 5.2 gives the HTTP page response time results for the UMTS-

J. Scot Ransbottom Chapter 5. UMTS-WLAN Results 104
Table 5.1: FTP Download Response Time (sec) for a UW in WLAN Client Access ModeFTP Filesize 1B 100KB 800KB 1.5MB 7MB 12MB 15MB 30MB 40MB 60MBSeed 1 0.194574 1.177744 6.337744 11.71774 52.45774 89.95774 112.5177 223.9377 298.0577 448.7377Seed 2 0.188612 1.190725 6.350725 11.73073 52.47073 89.97073 112.5307 223.9307 298.0707 448.7507Seed 3 0.183707 1.203707 6.363707 11.74371 52.48371 89.78371 112.4086 223.7437 297.8837 448.5637Seed 4 0.190725 1.068612 6.428612 11.60861 52.54861 89.84861 112.3437 223.8546 297.9546 448.6086Seed 5 0.197744 1.094574 6.454574 11.63457 52.57457 89.87457 112.4346 223.8086 297.9486 448.6346Mean: 0.191072 1.147072 6.387072 11.68707 52.50707 89.88707 112.4471 223.8551 297.9831 448.659195% CI: 0.184352 1.071135 6.323218 11.61113 52.44322 89.79029 112.3503 223.7529 297.8847 448.5574
0.197793 1.22301 6.450927 11.76301 52.57093 89.98386 112.5439 223.9573 298.0815 448.7607
WLAN scenario with the Wireless Client application traffic. As an example, consider the
right-most column for 2 UWs in the UMTS access mode and 18 UWs in the WLAN access
mode. The average HTTP page response time for all five seeds was 7.8262 seconds with a
95-percent confidence interval of 7.1727 to 8.4796 seconds.
Table 5.2: HTTP Response Time (sec) for UWs in UMTS Client Access ModeNumber of UWs in UMTS Mode 20 18 16 14 12 10 8 6 4 2Seed 1 12.432839 9.167257 8.251739 8.116110 8.385436 8.096770 7.359587 7.627617 8.387927 7.525191Seed 2 13.416985 8.911012 8.658675 8.086360 7.534312 8.096770 7.651648 7.722649 7.751405 8.666523Seed 3 13.667978 8.865238 9.023893 8.796989 8.571726 7.673093 7.694435 8.272729 7.446080 7.268593Seed 4 12.710351 9.249344 8.772352 10.255774 8.036825 8.029945 7.695623 7.315788 7.261536 7.848843Seed 5 13.161796 8.891231 8.517017 8.068062 8.243471 7.538070 7.461991 7.967559 7.586461 7.821761Mean: 13.077990 9.016817 8.644735 8.664659 8.154354 7.886930 7.572657 7.781268 7.686682 7.82618295% CI: 12.450649 8.795917 8.287612 7.496688 7.660177 7.560854 7.382510 7.333671 7.151045 7.172729
13.705330 9.237717 9.001858 9.832630 8.648531 8.213006 7.762803 8.228865 8.222319 8.479636
The results for all simulation runs exhibited similar 95-percent confidence intervals.
Both the FTP application traffic and the Wireless Client application traffic produced very
tight confidence intervals. Therefore, five simulation runs with different seed values was
determined to be sufficient for 95-percent confidence intervals. All data points presented
throughout the rest of this chapter represent the mean value of five simulation runs with
different seed values. Complete tables with the results of individual simulation runs and the
95-percent confidence intervals are provided in the Appendix.
J. Scot Ransbottom Chapter 5. UMTS-WLAN Results 105
5.2 Model Verification and Validation
This section describes the methods used to ensure the simulation model was both
correctly implemented and representative of the real system. These two steps were termed
model verification and model validation [37]. Section 5.2.1 discusses the use of a single
FTP file transfer to input signals to verify correct operation of the simulation. Section 5.2.2
presents the theoretical analysis that was used to validate the simulation model. The analysis
compared theoretical and simulation results for a single client with the FTP traffic inputs.
5.2.1 Model Verification
Model verification is the process of determining if a simulation model functions cor-
rectly. This includes such tasks as debugging the computer code, testing for logic errors, and
testing the functionality of different modules. As discussed in Section 4.9, the simulation
was designed in OPNETModeler 9.1.A using a top-down, modular approach. This approach
simplified the task of model verification since each module was tested independently.
Each node and process in the simulation was tested to verify that it functioned cor-
rectly. This was accomplished by running short simulations in the OPNETTM ODB (OPNET
Simulation Debugger) mode. The ODB provides an environment where the user has inter-
active control of the simulation in order to investigate its behavior by setting breakpoints
and traces to print out detailed information about events or objects. The user-defined au-
thentication and access control protocol was verified in detail by creating traces for each
of the messages. The results of these traces can be seen in the appendix. Each of the
protocol transactions was verified by inspecting the proper message flow to ensure that it
corresponded with message flow defined in 2.2.6. The user-defined authentication and access
control protocol passed the verification process. The signaling protocol mechanisms of the
model functioned in accordance with the 3GPP standards as designed.

J. Scot Ransbottom Chapter 5. UMTS-WLAN Results 106
Short simulations were also run to collect statistics at various points in the model to
ensure that the model was functioning properly. The standard OPNETTM processes were
tested to ensure they functioned as described in the software documentation. This required
that both the UMTS and WLAN model sets to be tested.
The UMTS model set was developed jointly by Telcordia and OPNETTM Technolo-
gies. [1], by Demers, is the seminal paper highlighting the capabilities of the baseline UMTS
model set. The results from the short verification simulation tests verified the correct oper-
ation of the UMTS models against the results of this paper. The UMTS models passed the
verification and validation process.
The WLAN model set was verified in the same manner as the UMTS models. Short
simulations were run to verify the correct operation of the various WLAN nodes. The
results of these simulations were compared against the results presented in the OPNETTM
Technologies model documentation [41]. The WLAN models passed the verification and
validation process.
5.2.2 Model Validation
Model validation is the process of determining if a simulation model is representa-
tive of the real system. A simulation can be validated using expert intuition, real system
measurements, or theoretical results [37]. Comparing simulation outputs and measurements
from a real system is the most reliable way of validating a simulation model. Real sys-
tem measurements were not available in this research since resources were not available for
prototype 3G wireless equipment. Comparing simulation and theoretical results was the
primary method used to validate the simulation model. Theoretical analysis of the system
was conducted using FTP application traffic.
To the validate the PCF data transfer within the WLAN access network, a test was
conducted with one wireless client data user running the FTP application. The system

J. Scot Ransbottom Chapter 5. UMTS-WLAN Results 107
Figure 5.1: Simplified Analytical Model
consisted of a WLAN node operating in an infrastructure BSS. The FTP file size was sys-
tematically increased in order to vary the network traffic load. The FTP download response
time was measured for each increment of the FTP file size and compared with the analytical
results in Figure 5.3.
The block diagram in Figure 5.1 was used to construct the analytical model and
determine all of the delays that an FTP packet will encounter in the system. The following
simplifying assumptions were made in order to make the analytical model tractable.
Backside Server Network
The delays on the backside server network would be implementation dependent. The
focus of this analysis was on the access network and not the backside server network; there-
fore, the backside network delay was considered to be constant. From 3GPP TR 25.853, the
one-way delay between a 200 km link between the SGSN and the GGSN would be 800µs;
therefore, a total round-trip delay of 2ms was chosen between the access network and the
server.

J. Scot Ransbottom Chapter 5. UMTS-WLAN Results 108
TCP Setup, Slow-start, and Window Size
The delays from TCP connection setup and the slow-start algorithm were assumed to
be constant. By assuming an infinite TCP window size, the delays from the TCP throttling
were minimized. Ignoring the non-deterministic effects of TCP affected the accuracy of the
analytical model, but this assumption was necessary to make the model tractable.
Node Processing Delay
The node processing delays were considered to be small as compared to the link
transmission delays and the PCF signaling delays. Therefore, the node processing delays
were assumed to be zero.
Number of Packets
The number of packets was calculated by dividing the file size by the maximum
segment size (MSS). The MSS for the access network was assumed to be 1500 bytes.
Num_Pkts =»File_sizeMSS
¼(5.2)
WLAN CFP Timing and Overhead
The most significant source of delay was from the WLAN CFP Timing and packet
overhead as result of the point coordination function (PCF) protocol. The CFP timing
delays were calculated using Figure 5.2.
Once all of the CFP timing delays and overhead were accounted for, the wireless link
transmission delay was calculated for a single packet using the packet size divided by the
client goodput. The client goodput referred to the bandwidth the user actually received after
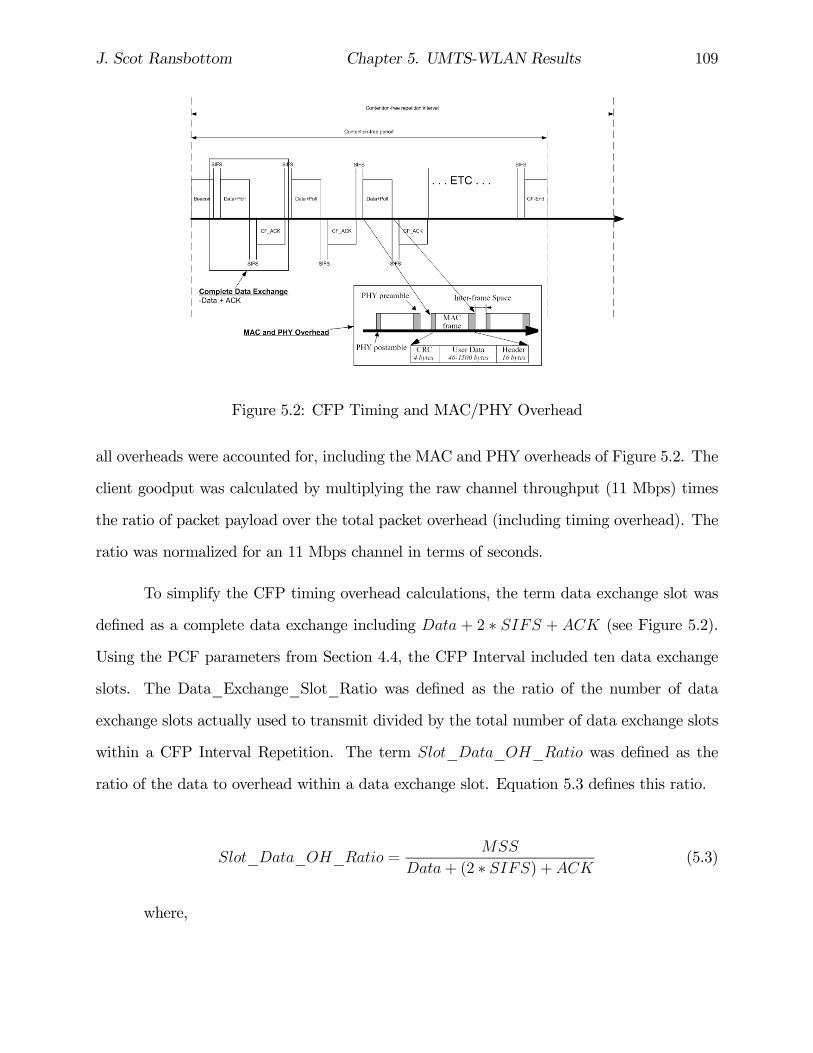
J. Scot Ransbottom Chapter 5. UMTS-WLAN Results 109
Figure 5.2: CFP Timing and MAC/PHY Overhead
all overheads were accounted for, including the MAC and PHY overheads of Figure 5.2. The
client goodput was calculated by multiplying the raw channel throughput (11 Mbps) times
the ratio of packet payload over the total packet overhead (including timing overhead). The
ratio was normalized for an 11 Mbps channel in terms of seconds.
To simplify the CFP timing overhead calculations, the term data exchange slot was
defined as a complete data exchange including Data + 2 ∗ SIFS + ACK (see Figure 5.2).
Using the PCF parameters from Section 4.4, the CFP Interval included ten data exchange
slots. The Data_Exchange_Slot_Ratio was defined as the ratio of the number of data
exchange slots actually used to transmit divided by the total number of data exchange slots
within a CFP Interval Repetition. The term Slot_Data_OH_Ratio was defined as the
ratio of the data to overhead within a data exchange slot. Equation 5.3 defines this ratio.
Slot_Data_OH_Ratio =MSS
Data+ (2 ∗ SIFS) +ACK(5.3)
where,

J. Scot Ransbottom Chapter 5. UMTS-WLAN Results 110
Data =
·WLAN_MaxSDU +WLAN_MSDU_Header
Data_Rate+ plcp_overhead
¸(5.4)
Packet Delay
Using the terms defined above, the per packet delay was defined in Equation 5.5.
Pkt_delay =Pkt_sizeData_rate
∗ Slot_Data_OH_Ratio ∗Data_Exchnge_Slot_Ratio (5.5)
FTP Response Time
The FTP response time was defined in Equation 5.6.
FTP_Rspns_Time = Conn_Setup+Num_Pkts ∗ Pkt_delay (5.6)
The theoretical results were calculated in MATLAB using the relationships defined
above and the parameters defined in Section 4.4. Figure 5.3 shows a comparison between
the theoretical and simulation results for various file sizes. The simulation results are very
close to the theoretical results. The difference between the theoretical and the simulation
results can be accounted for by the inability of the simple analytical models to capture the
full effects of TCP. The agreement between the analytical and simulation results validates
the correct operation of the PCF data transfer for the WLAN access network. All aspects
of the model passed the verification and validation process.

J. Scot Ransbottom Chapter 5. UMTS-WLAN Results 111
Figure 5.3: Simulated vs Theoretical Results
5.3 Benefits of Interworking UMTS-WLAN
The intent of this scenario was to demonstrate the benefits of the interworked UMTS-
WLAN system as compared to the existing UMTS system. Specifically, this scenario demon-
strated the conservation of limited dedicated cellular channels by shifting data users to the
WLAN access network. This had the effect of “freeing” limited resources for revenue pro-
ducing voice calls. It also demonstrated the significant improvement in application response
time of the interworked UMTS-WLAN system as a result of the larger WLAN channel.
Since the primary motivation for integrating WLAN into the UMTS system was to
free limited resources while continuing to provide service, the number of reserved dedicated
channels (DCH) in the Node-B was examined. Because of the importance of voice channels,
dedicated channels were considered the critical, finite resource in the UMTS network.
The interworking UMTS-WLAN experiment was conducted using twenty wireless
client data users running a mix of client applications; specifically the mix of Web, E-mail

J. Scot Ransbottom Chapter 5. UMTS-WLAN Results 112
and FTP applications (Wireless_Client application profile) discussed in Section 4.7. The
baseline system consisted of twenty UW nodes operating in a UMTS cell. Sixteen of these
clients were operating within 300m of the UWLAN_AP, and the other five were not within
the range of the WLAN access network. The simulation was first run with the Client Access
Mode set to UMTS for all 20 clients. The Client Access Mode was then toggled to WLAN
for the sixteen clients that were in range of the WLAN access network and the results were
compared.
Based on the quality of service requirements for the data session, the UMTS allocates
one or more DCH channels to support a user session. It can be observed from Figure 5.4
that reducing the number of contenders for service from twenty to four reduced the average
number of DCH channels in use by approximately 65%. It is possible to reallocate these
unused DCH channels to voice services or to additional packet data services. Thus, it can
be asserted that a service provider could use these unused resources to generate additional
revenue.
Figure 5.4: Reserved DCH Channels (DCH Count vs Time (min))
One might question why the reduction in DCH utilization was only 65%, and the
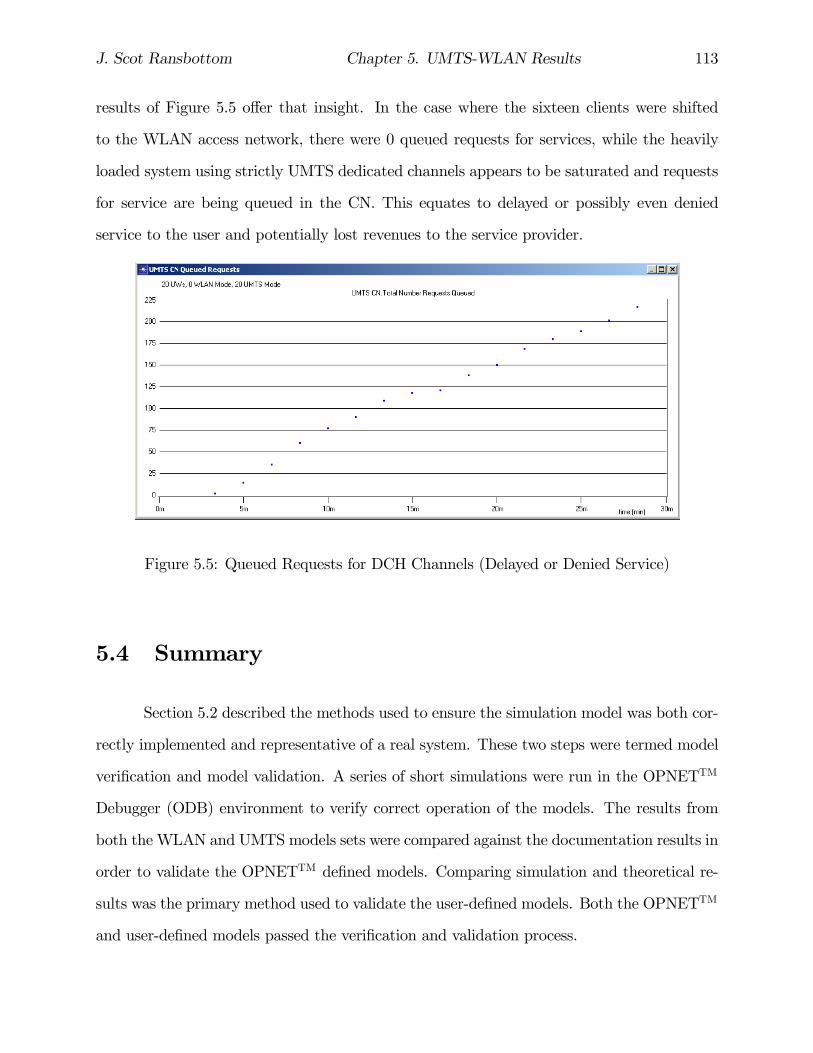
J. Scot Ransbottom Chapter 5. UMTS-WLAN Results 113
results of Figure 5.5 offer that insight. In the case where the sixteen clients were shifted
to the WLAN access network, there were 0 queued requests for services, while the heavily
loaded system using strictly UMTS dedicated channels appears to be saturated and requests
for service are being queued in the CN. This equates to delayed or possibly even denied
service to the user and potentially lost revenues to the service provider.
Figure 5.5: Queued Requests for DCH Channels (Delayed or Denied Service)
5.4 Summary
Section 5.2 described the methods used to ensure the simulation model was both cor-
rectly implemented and representative of a real system. These two steps were termed model
verification and model validation. A series of short simulations were run in the OPNETTM
Debugger (ODB) environment to verify correct operation of the models. The results from
both the WLAN and UMTS models sets were compared against the documentation results in
order to validate the OPNETTM defined models. Comparing simulation and theoretical re-
sults was the primary method used to validate the user-defined models. Both the OPNETTM
and user-defined models passed the verification and validation process.

J. Scot Ransbottom Chapter 5. UMTS-WLAN Results 114
The benefits associated with a UMTS-WLAN interworked system were demonstrated
in Section 5.3. The performance of the UMTS-WLAN interworked system is more fully
covered in [8], but significant results are included herein in Sections 5.2 and 5.3. The second
phase of our work was initiated when we discovered that, for some cases, the achievable
throughput was significantly less than expected. This led us to consider packet aggregation
for which the design and methodology is presented in Chapter 6. The results for the AGG-
MAC protocol are presented in Chapter 7.
Chapter 6
AGG-MAC Design and Methodology
During the second phase of our research, we sought to identify a protocol enhance-
ment in the WLAN MAC which would provide performance improvements in the WLAN
component of a UMTS-WLAN interworked system. In this context, the mode of operation
was PCF and traffic was routed through the AP to an external network. At the time of
this research, it was unclear what characteristics a client device would exhibit. A client
station might resemble a wireless phone with rather limited capabilities or a fully featured
mobile computer. Because the future was unclear, we focused our efforts on the limited
capability system with the realization that our enhancements would benefit either type of
client. We further assumed that the access point (AP) in a "hot spot" scenario would gen-
erally be significantly more capable than the client station. With these considerations, we
attempted to identify which aspect of WLAN performance would yield the most performance
improvement.
We focused our efforts on the reduction of per frame fixed overhead because it offered
the most potential for improvement in our defined environment. Contention based, or backoff
algorithm, enhancements are more relevant for DCF mode operation. During the CFP, the
backoff algorithm is not invoked, and although backoff does function during the CP, the CP
115

J. Scot Ransbottom Chapter 6. AGG-MAC Design and Methodology 116
is limited in such a system. We did not focus on higher layer protocols because we wanted
our enhancement to support a range of traffic conditions from CBR, voice traffic, to VBR,
data traffic such as E-mail, HTTP, and FTP traffic. We saw frame size referenced as a
factor commonly identified as affecting WLAN performance [42][33][5]. As our focus was
a limited capability client station, we considered the traffic in such a system and observed
that at least as many, if not more, small packet sizes than referenced in traffic research
[43][44][45][5] occurred under these conditions. For these reasons, we sought to reduce the
per frame overhead for small packet sizes.
For this phase of our research, we again followed the ten-step method of systematic
performance evaluation using simulation [37].The ten-step method was covered in the design
discussion of our first research phase in Section 4. In the upcoming sections, we present our
WLAN MAC layer protocol enhancement. Section 6.1 provides an overview of the protocol
at a higher level of abstraction. Additional specifics on the design choices and considerations
made in the design of AGG-MAC are presented in Section 6.2. Performance metrics are
presented in Section 6.3, simulation parameters are in Section 6.4, and simulation factors are
presented in Section 6.5. The simulation design is presented in Section 6.7. We subsequently
present the results of validation, verification and other simulated experiments in Chapter 7.
6.1 AGG-MAC Protocol Design
The packet aggregation protocol was implemented in the MAC layer (AGG-MAC).
An illustrative example of the functionality of AGG-MAC wireless LAN MAC layer protocol
design is presented in Figure 6.1. Packets received from the higher layer are aggregated into
a single frame up to the maximum allowable size. The fragmentation threshold was defined
as the maximum allowable aggregate size in order to avoid creating frames that were too
large for existing channel conditions. Our protocol works with either a statically assigned
fragmentation threshold or any of the several dynamic assignment mechanisms currently

J. Scot Ransbottom Chapter 6. AGG-MAC Design and Methodology 117
being researched as discussed in Section 3.2.2 [33][34]. As illustrated, the protocol provides
performance improvements for a collection of packets having a total aggregate size less than
or equal to the fragmentation threshold. The protocol does not offer improvement, nor
does it degrade performance, for a series of packets that would exceed the threshold (such
as packets 3 and 4 shown in Figure 6.1). Notable from this illustration is the dependence
on not only distribution of packet sizes, but also the specific ordering of packet sizes and on
the arrival time of packets from the higher layer.
Figure 6.1: AGG-MAC Protocol Overview
The algorithm implementing AGG-MAC is quite straightforward. The basic design
choices in the algorithm are below:
• When to perform aggregation operation
• What is the upper limit for aggregate frame size
• Which packets selected as candidates for aggregation
J. Scot Ransbottom Chapter 6. AGG-MAC Design and Methodology 118
6.1.1 When to perform aggregation operation
The timing for when to perform the aggregation will have an impact on performance of
the algorithm. In the processing of packets from the higher layer for transmission, traditional
designs of MAC layer protocols respond to an interrupt from above, immediately encapsulate
the packet into its appropriate frame and then place it in a queue for transmission by the
physical layer. In the very first local area network (LAN) systems, this approach was a
necessity because protocol-processing delays were the limiting factor rather than capacity of
the medium. AGG-MAC benefits most from having as many packets as possible awaiting
transmission and available to aggregate. Therefore we sought to construct the frame just
prior to transmission while insuring that a frame is ready for transmission when the physical
layer is ready to transmit. The WLAN protocol implements a more complex protocol than
most traditional MAC layers in order to provide IEEE 802.2 based LAN services via a wireless
medium. This added complexity generally allows for a range of instants in which a packet or
set of packets could be prepared and passed to the physical layer.
6.1.2 What is the upper limit for aggregate frame size
With the realization in actual system implementations that bigger is not always bet-
ter, we leveraged the existing fragmentation threshold parameter to limit the upper bound
of an aggregated frame. This allowed better performance of AGG-MAC under varied chan-
nel conditions. The purpose of the fragmentation threshold was to establish the maximum
allowable size of a frame in order to have a high probability of successful transmission. We
recognize that this is the appropriate upper limit for an aggregated frame as well. As stated
in [46] and restated in many subsequent works, fragmentation can significantly degrade per-
formance. It would be counterproductive to create an aggregate frame that was allowed
to trigger fragmentation. We are just beginning to explore the possibility of using various
values of the fragmentation threshold to apportion capacity to different classes of clients.

J. Scot Ransbottom Chapter 6. AGG-MAC Design and Methodology 119
In OPNETTM, the fragmentation mechanism is implemented using the Segmentation
and Reassembly (SAR) package in the function wlan_prepare_frame_to_send(). Because
of the flexible design of the SARs package, we were able to implement the aggregation and
subsequent recovery of packets in the AGG-MAC enhancement using the existing wlan_mac
kernel procedures (KPs) and data structures with only minor modification to parameters
used to create the SARs lists. The SARs package greatly simplifies the receive process in the
simulation. An actual receiving MAC layer would be required to parse the length information
from the higher layer (IP) header in order to identify the end of a packet and the start of the
next within an aggregated frame. In the simulation, the KP op_sar_rsmbuf_pk_remove()
allowed us to remove a single packet at a time from an aggregate frame and pass that packet
up to the higher layer.
6.1.3 Which packets selected as candidates for aggregation
Concerning the selection of packets for consideration in the AGG-MAC protocol, this
implementation considered packets in strict order received from the higher layer. Packets
from the higher layer are enqueued in order. Our iterative operation first selected the packet
at the head of the queue for preparation to transmit and considered the next packet to
aggregate with the current set of packets. If the destination address of the packet under
consideration was the same as the destination address of the current working frame and if
the total size does not exceed the maximal size limitation of the AGG-MAC frame, then
the packet is aggregated with the current set. This selection process iterates until either
condition is false. The aggregated collection of packets is then encapsulated into the WLAN
frame for transmission.
We considered more complex scheduling algorithms, but selected simple FIFO to
ensure strict ordering is maintained. We could search from through the queue until we
either created a maximal frame or encountered the end of the queue. This would potentially
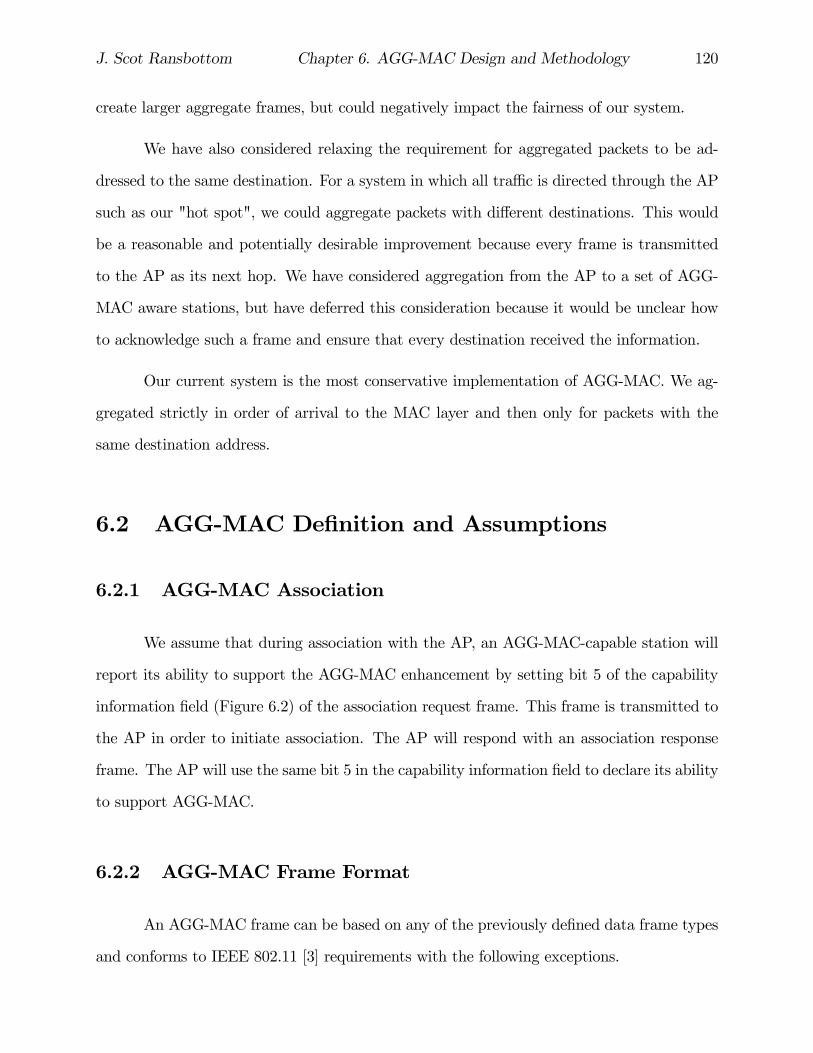
J. Scot Ransbottom Chapter 6. AGG-MAC Design and Methodology 120
create larger aggregate frames, but could negatively impact the fairness of our system.
We have also considered relaxing the requirement for aggregated packets to be ad-
dressed to the same destination. For a system in which all traffic is directed through the AP
such as our "hot spot", we could aggregate packets with different destinations. This would
be a reasonable and potentially desirable improvement because every frame is transmitted
to the AP as its next hop. We have considered aggregation from the AP to a set of AGG-
MAC aware stations, but have deferred this consideration because it would be unclear how
to acknowledge such a frame and ensure that every destination received the information.
Our current system is the most conservative implementation of AGG-MAC. We ag-
gregated strictly in order of arrival to the MAC layer and then only for packets with the
same destination address.
6.2 AGG-MAC Definition and Assumptions
6.2.1 AGG-MAC Association
We assume that during association with the AP, an AGG-MAC-capable station will
report its ability to support the AGG-MAC enhancement by setting bit 5 of the capability
information field (Figure 6.2) of the association request frame. This frame is transmitted to
the AP in order to initiate association. The AP will respond with an association response
frame. The AP will use the same bit 5 in the capability information field to declare its ability
to support AGG-MAC.
6.2.2 AGG-MAC Frame Format
An AGG-MAC frame can be based on any of the previously defined data frame types
and conforms to IEEE 802.11 [3] requirements with the following exceptions.
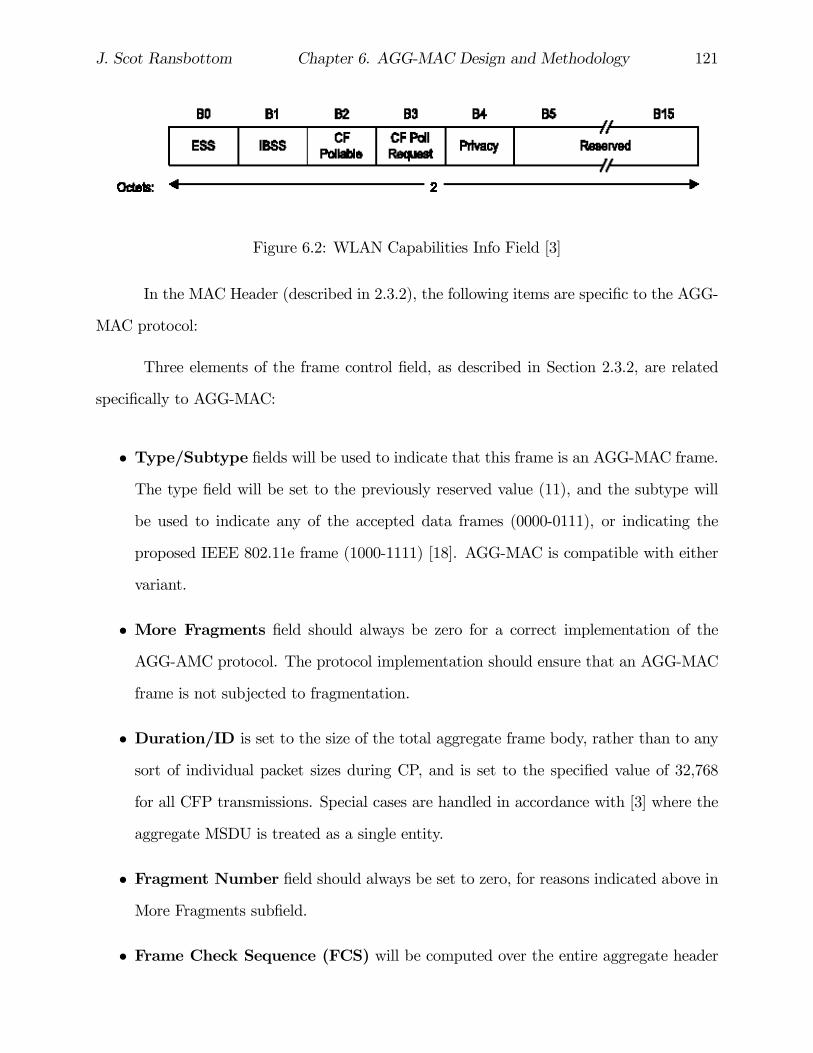
J. Scot Ransbottom Chapter 6. AGG-MAC Design and Methodology 121
Figure 6.2: WLAN Capabilities Info Field [3]
In the MAC Header (described in 2.3.2), the following items are specific to the AGG-
MAC protocol:
Three elements of the frame control field, as described in Section 2.3.2, are related
specifically to AGG-MAC:
• Type/Subtype fields will be used to indicate that this frame is an AGG-MAC frame.The type field will be set to the previously reserved value (11), and the subtype will
be used to indicate any of the accepted data frames (0000-0111), or indicating the
proposed IEEE 802.11e frame (1000-1111) [18]. AGG-MAC is compatible with either
variant.
• More Fragments field should always be zero for a correct implementation of theAGG-AMC protocol. The protocol implementation should ensure that an AGG-MAC
frame is not subjected to fragmentation.
• Duration/ID is set to the size of the total aggregate frame body, rather than to any
sort of individual packet sizes during CP, and is set to the specified value of 32,768
for all CFP transmissions. Special cases are handled in accordance with [3] where the
aggregate MSDU is treated as a single entity.
• Fragment Number field should always be set to zero, for reasons indicated above inMore Fragments subfield.
• Frame Check Sequence (FCS) will be computed over the entire aggregate header

J. Scot Ransbottom Chapter 6. AGG-MAC Design and Methodology 122
and payload.
6.3 Performance Metrics
The AGG-MAC protocol was evaluated based upon throughput, delay, dropped data,
and voice over IP performance metrics. Voice over IP metrics consisted of voice packet end-
to-end delay and voice packet delay variation. These performance metrics were defined as
follows:
6.3.1 Throughput
Relative to the WLAN MAC layer, throughput was defined as the total number of
bits sent to the higher layer from the MAC layer. The data packets received at the physical
layer were sent to the higher layer if they were destined for this station. We measured this
value in terms of bits per second. Throughput represents an average rate of traffic flow where
higher values were better.
6.3.2 End-to-End Delay
End-to-End Delay was the period of time between arrival of a packet at a protocol
layer and the completion of processing of the packet at the peer protocol on the receiving
node. The receiving node reported the value of End-to-End delay. This delay included all
processing, queueing, and transmission times from source to destination. End-to-End delay
was reported for voice protocol packets and for other traffic flows.

J. Scot Ransbottom Chapter 6. AGG-MAC Design and Methodology 123
6.3.3 Data Dropped
The metric, Data Dropped, measured the rate of data lost in the WLAN MAC
and in unsuccessful transmission between peer MACs. This value was measured in bits per
second and lower was better.
The packets dropped in bits by the WLAN MAC due to:
a) the overflow of higher layer buffer, or
b) failure of all retransmissions until retry limit.
In an error-free channel, buffer overflow was the cause of dropped data. In such a
case, the reported value can be considered representative of congestion.
6.3.4 Voice Packet Delay Variation (Jitter)
Delay Variation measured variance among end-to-end delays for voice packets re-
ceived by a node. End-to-end delay for a voice packet was measured from the time it was
created to the time it was received. This value was measured in seconds and smaller is
better. Delay variation impacts the amount of additional delay required and the size of the
buffers necessary to support real-time, voice applications in order to limit the effects of the
network on the user.
6.3.5 Application Response Time
HTTP and FTP application response times were chosen because they represented
two different classes of traffic. Both response times were measured in seconds and a smaller
value was considered better.
HTTP Page Response Time was defined as the time required to retrieve an
entire HTML page with all associated inline objects. The web page response time was

J. Scot Ransbottom Chapter 6. AGG-MAC Design and Methodology 124
measured from the time a client browser application sent the initial request to the web
server and terminated when the client received the last element of the entire HTML page.
Embedded within this measurement were the setup and termination signaling required for
the TCP connections. HTTP1.1 protocols were employed in order to allow connection reuse
to limit this overhead. It was believed that version 1.1 of the HTTP protocol was more likely
representative of current and future browsers.
FTP Upload Response Time was defined as the time that elapsed between a client
sending a "put" request and when acknowledgement of the final segment signaling successful
upload of the entire file to the FTP server. This metric was dependent upon the file size.
Like the HTTP response time, this metric includes the TCP protocol setup and termination
of the TCP connection.
6.3.6 Amount of Aggregation
Packets per frame represents the number of individual data packets combined into
a single data frame transmitted, or the amount of aggregation. If IP Aggregation is inactive,
this value should always be 1. With IP Aggregation, the value should be greater than or
equal to 1. The higher the value, the more aggregation. More is better. This value was
measured in packets per frame (ppf).
6.4 Simulation Parameters
Inputs to the simulation model that were not varied during different simulation runs
are termed simulation parameters. The values selected for these parameters affected how
accurately the simulation modeled the actual system. The simulation parameters are given
in Table 6.1.

J. Scot Ransbottom Chapter 6. AGG-MAC Design and Methodology 125
Table 6.1: AGG-MAC Simulation ParametersSimulation Parameters ValuesWLAN PCF Functionality EnabledWLAN Access Point Functionality EnabledWLAN Physical Layer Characteristics Direct SequenceWLAN Data Rate 11MbpsBeacon Interval 0.02CFP Interval (sec) 0.018CFP Beacon Multiple 1UMTS Cell State DCH
6.5 Simulation Factors
Inputs to the simulation that are varied during different simulation runs are termed
simulation factors. The simulation was run with different combinations of these factors as
described in Section 6.7. The simulation factors are summarized in Table 6.2 and discussed
below.
Table 6.2: AGG-MAC Simulation FactorsSimulation Factor ValuesPacket Size 32B - 2,304BNumber of Transmitting Stations 1, 10, 50BER 0, 10−8, 10−5, 10−4, and 10−3
Fragmentation Threshold 150B, 300B, 576B, 1, 500B, 2, 304BApplication Profile/Traffic Model FTP, E-mail, HTTP, and Voice_pcm
6.5.1 Packet Size
Packet Size affects not only traffic loads as related to capacity of the channel, but
also directly affects the potential for aggregation. If all packets are larger than one half the
size of the fragmentation threshold, the AGG-MAC protocol will perform exactly like the
original WLAN MAC protocol. The amount of aggregation depends on the arrival rate,
arrival sequence and packet size offered to the MAC layer protocol.
The packet size was varied from 32B to 2, 304B. These values were selected to

J. Scot Ransbottom Chapter 6. AGG-MAC Design and Methodology 126
represent small control packets from higher layer protocols up to the maximal allowable
MSDU. Research has shown that a significant percentage of internet traffic is less than 100B
in size [44][5]. The IP protocol recommends an upper limit of 576B. All IP networks are
required to support at least this limit [47]. For application based traffic, packet sizes are
set within the definition of the protocol in the form of a probabilistic distribution, and the
sizes are impacted by the TCP MSS value and the IP maximum MTU value. In those
simulations, the full IP protocol stack was employed with its default values. This implies
that the IP maxMTU was set to 576B, and the TCP MSS was set based upon the value of
the IP maxMTU.
6.5.2 Number of Transmitting Stations
The basic simulation was run with 1, 10, and 50 transmitting stations. These values
represented the number of stations sharing access to the WLAN channel. These values were
selected because they represented a reasonable range of clients that a typical WLAN might
be expected to support [48]. The combination of the application profile, packet size, and
number of stations determined the traffic loads for the WLAN channel.
6.5.3 BER
In a digital transmission, bit error rate (BER) is the percentage of bits with errors
divided by the total number of bits that have been transmitted, received or processed over a
given time period. The rate is typically expressed as 10 to the negative power. For example,
four erroneous bits out of 100,000 bits transmitted would be expressed as 4 x 10⁻⁵, or the
expression 3 x 10⁻⁶ would indicate that three bits were in error out of 1,000,000 transmitted.
BER is the digital equivalent to signal-to-noise ratio in an analog system. We varied the bit
error rate (BER) of the wireless channel to assess the performance of AGG-MAC under more
realistic conditions. The channel model we used employed additive white Gaussian noise

J. Scot Ransbottom Chapter 6. AGG-MAC Design and Methodology 127
(AWGN) based models for BER. We evaluated the performance using a perfect channel, and
BERs of 10−8, 10−5, 10−4, and 10−3 to represent increasingly worsening channel conditions.
This factor will demonstrate the overhead incurred from attempting to transmit larger
frames which encounter an increased probability of error in transmission of an aggregate
frame. This factor is varied in conjunction with fragmentation threshold and will be com-
pared with results from [33]. The characteristics of the noise additionally had a measurable
effect on WLAN performance. For this reason, we also considered the effects of a single
periodic bit error that would produce the desired BER and of a periodic burst error. The
effect of periodic burst errors were evaluated for various noise ON/OFF periodocities. We
considered time periods where a burst of noise yielding the desired BER was repeated every
1sec, every 0.5sec, and for the case where the noise was active occurred for exactly one_bit.
Not surprisingly, the same BER with more distributed errors affected more frames, and
therefore negatively impacted performance more than longer burst errors.
6.5.4 Fragmentation threshold
As stated in Section 6.1, the fragmentation threshold establishes the upper limit on
the size of a frame transmitted over the WLAN channel. AGG-MAC will not create frames
larger than the size established by the fragmentation threshold in order to avoid triggering
the fragmentation algorithm, thereby inducing significant additional overhead.
In the evaluation of AGG-MAC performance under varied channel conditions, we
varied the value of fragmentation threshold based upon data presented in [33]. We compared
the performance of AGG-MAC with both the original WLAN MAC performance in our
simulation, and with the computed values presented in [33].

J. Scot Ransbottom Chapter 6. AGG-MAC Design and Methodology 128
6.5.5 Traffic models
We ran validation and verification testing with basic station models transmitting
generic frames. Subsequent simulations were conducted with workstation models capable
of simulating the entire protocol stack. Our traffic was based on the OPNET defined
traffic application profiles "wireless_client," "Voice_pcm," "Web," and "FTP." Section 4.7
presented an overview of most of the applicable traffic models, which will again be used in
simulations evaluating the AGG-MAC protocol enhancement. Section 6.7.2 describes the
simulation environment for the Infrastructure Mode simulation designed to represent shared
access for multiple stations with differing traffic requirements.
Voice_pcm Traffic Models
The Voice_pcm application models PCM quality VoIP traffic. A voice application
enables two clients to establish a virtual channel over which they can communicate using
digitally encoded voice signals. UDP is the default transport protocol used for this appli-
cation. The voice data arrives in spurts that are followed by a silence period. Encoding
schemes can be specified for the voice-to-packet translation. The Voice_pcm application
was parameterized using the attributes in Table 6.3 [40].
Table 6.3: AGG-MAC VoIP Application AttributesAttribute Description
Silence Length (sec)Silence length for the incoming and outgoingcalls along with the associated distributions.
Talk Spurt Length (sec)Length of a talk spurt for the incoming and outgoingcalls along with the associated distributions.
Symbolic Destination Name Symbolic destination name of the client.Encoder Scheme Encoding scheme in effect at the client.Voice Frames per Packet Number of voice frames that can be sent in a single packet.
Type of ServiceQuality-of-service parameter forassigning priority to this application’s traffic.
RSVP Parameters RSVP parameters for making bandwidth reservations.
J. Scot Ransbottom Chapter 6. AGG-MAC Design and Methodology 129
6.6 Evaluation Techniques
As stated in Section 4.6, the selection of a particular evaluation technique can sig-
nificantly impact the outcome of a performance evaluation. Three possible techniques of
performance evaluation are analytic, simulation, and measurement [37]. These methods dif-
fer in terms of accuracy, cost, and required time. We again choose simulation to conduct
this performance analysis due to limitations in available resources. Analytical methods were
used in the model verification process.
6.7 Simulation Design
The rationale and design overview of the simulation-based experiments employed to
evaluate the AGG-MAC protocol enhancement are contained in this section. The results
and analysis from each of those simulations are located in Chapter 7. We again used
standard OPNETTM models and modified them to support our AGG-MAC protocol. Our
initial work was to conduct verification and validation testing to ensure the proper and
correct functioning of the AGG-MAC protocol and the associated model. Those results are
presented in Section 7.1 and in Section 7.2. In addition to basic verification and validation
testing, we conducted a range of simulation experiments to better analyze and characterize
the performance of the AGG-MAC protocol enhancement as compared to the original WLAN
MAC protocol. We conducted simulations to better understand the effects of noise on the
channel. The design of our testing system operation over a channel subject to errors due
to noise is presented in Section 6.7.1 and results and analysis of various BER situations are
presented in Section 7.3. We present the simulation design for a reasonable office network
scenario in Section 6.7.2 with the results of those simulations presented in Section 7.4.
Section 6.7.3 presents an overview of our rationale and approach for using live trace
data to evaluate and compare the performance of AGG-MAC on actual network traffic. We

J. Scot Ransbottom Chapter 6. AGG-MAC Design and Methodology 130
present two very distinct cases in order to better understand the performance of the AGG-
MAC protocol enhancement. Section 6.7.4 provides an overview of the problem space and a
discussion of the approach to analyzing the performance of AGG-MAC on traffic generated by
the U.S. Army’s Land Warrior proof of concept exercise. The results from the Land Warrior
traffic trace, representing a small data set collected from an ad hoc network configuration
are presented in Section 7.5. Our second live data set involves over 1GB of collected trace
data from an infrastructure-based network at the IEEE SIGCOMM Conference 2001; the
overview of the situation and discussion of our simulation design are found in Section 6.7.5
with results from these simulations included in Section 7.6.
Our final experimental scenario involves the incorporation of the AGG-MAC WLAN
protocol enhancement incorporated into a UMTS-WLAN interworked system. The rationale
and design of the UMTS-WLAN interworked system were discussed at length in Chapter
4 with results from the baseline system without the AGG-MAC protocol enhancements
included in 5. In Section 6.7.6 we identify the rationale and methodology we employed
to consider the effect of incorporating the AGG-MAC WLAN protocol enhancement into
the UMTS-WLAN interworked system. Our results from these simulations are located in
Section 7.7.
6.7.1 Effect of Errors on the Channel
Noise in a wireless radio channel is a common occurrence. From the perspective
of the MAC-layer protocol, loss of data during transmission is the result of noise on the
channel. Wired networks generally have a very low noise level and therefore, the probability
of error on a wireline channel is often negligible. Most higher layer protocols were designed
to operate under conditions associated with wired networks. For this reason, frame loss is
generally assumed to be the result of increased congestion along the path rather than due
to bursty losses associated with noise on the channel. The issues associated with using

J. Scot Ransbottom Chapter 6. AGG-MAC Design and Methodology 131
these assumptions on a wireless network have been well studied [30][31][33][35]. The BER-
related simulation experiments were designed to better understand how the employment of
the AGG-MAC protocol would function across a range of noise conditions.
One of the potential negative results from packet aggregation is that a larger frame
incurs a greater probability of encountering an error during transmission which results in
the loss of a larger number of bytes of data. Lettieri, et al. [33] presented analytical and
experimental results (summarized in Section 3.2.2) pertaining to the performance of WLAN
systems under various BER conditions. We sought to confirm their results with an original
WLAN and to evaluate AGG-MAC under the same conditions. We additionally sought to
identify an appropriate value for the fragmentation threshold for a given channel BER. We
used workstation models to evaluate the achievable throughput across the range of factors
as identified in Table 6.4. We selected the values of BER to best correlate to the results
presented in [33].
Table 6.4: AGG-MAC Simulation Factors for BERSimulation Factor ValuesPacket Size 32B - 2, 304BNumber of Transmitting Stations 1, 10, 50BER 0, 10−8, 10−5, 10−4, and 10−3
Fragmentation Threshold 150B, 300B, 576B, 1, 500B, 2, 304B
Modeling Noise on WLAN Channel
Our WLAN MAC-layer model, AGG-MAC, was further modified to include the
highlighted parameters listed in Figure 6.3. The parameter "Is Noise Active" was a
BOOLEAN value toggled and globally monitored by each station. "Noise_Burst_OFF"
and "Noise_Burst_ON" were each double precision numeric values which established the
length of time, or periodocity, of noise bursts. Code was added to the model to perform
the required logic to process the noise on the channel. The model updated the status of
"Is Noise Active" based upon the values of the ON/OFF parameters. During reception

J. Scot Ransbottom Chapter 6. AGG-MAC Design and Methodology 132
Figure 6.3: MAC-layer model parameters for BER
of a packet, the receiver compared the time period of the packet’s transmission to the time
period of the most recent burst of noise. If there was any overlap in the packet transmission
and the noise burst, the packet was marked to be dropped due to errors. This processing
occurred at the receiver to ensure that packet collisions were still properly considered in all
cases. Statistics were updated and the packet was subsequently dropped when collision or
noise dictated it.
BER Simulation Configuration
We based the network simulation design used to test the effects of bit error rate on
the same fundamental design as was used for validation testing, see Section 7.2. In order to
test the effect of errors on the channel, we added periodic bursts of errors into the simulation
using the mechanisms discussed in the previous subsection. We additionally repeated the
simulations with 1, 10 and 50 transmitting stations operating in DCF mode. The network
diagram for a single transmitting station was the same as presented in Figure 7.2, and the
diagram for 50 stations is presented in Figure 6.4. In each case, the receiver is labeled
wkstn_2 and each of the other nodes in the diagram is a transmitter. We positioned
the transmitters in close physical proximity to one another in order to provide the fairest

J. Scot Ransbottom Chapter 6. AGG-MAC Design and Methodology 133
Figure 6.4: Baseline 50 Station AGG-MAC Network
opportunity for successful transmission among competing stations. In our environment, each
of the transmitting stations generated enough data to saturate the shared, contention-based
channel. This provided us with an opportunity to observe, in effect, 1, 10 and 50 continuous
sources, each attempting to saturate the channel. When periodic errors were introduced, we
examined the effect of the errors for a range of both number of clients and a range of BERs.
We additionally sought to obtain confirmation of the analytically derived appropriate value
for fragmentation threshold for a given channel BER as presented in [33] while testing our
BER scenarios. The results of our BER simulation are presented in Section 7.3. The effects
of various burst characteristics of the noise are presented in Section 7.3.3.
6.7.2 AGG-MAC Infrastructure Mode
In order to determine the performance of AGG-MAC under more realistic and varied
conditions, we compared its performance with OPNETTM provided scenarios. We have
focused our efforts on the scenarios provided in the project Wireless_LAN [41] and in the
OPNETWORK 2002 Tutorial 1332 titled “Maximizing Performance for Wireless LANs””

J. Scot Ransbottom Chapter 6. AGG-MAC Design and Methodology 134
[49]. As we anticipated, for traffic streams with small packet sizes, we were able to improve
throughput and generally decrease delay.
Figure 6.5: Network Configuration
Figure 6.5 presents the network configuration. In this office environment, a single
AP provides network connectivity to eight client machines via the WLAN. Each client was
designed to use a single application. Two were PCM quality voice, two were HTTP traffic and
four were transferring FTP traffic. In the scenario PCF_disable, all clients were operating
in DCF mode in which all traffic was pure contention based. In the PCF_enable mode,
preference was given to the voice clients by configuring a 20mSec contention-free period
(CFP) approximately every 30mSec in which voice stations were the only clients permitted
access to the medium. We used the provided reference model in the tutorial and strictly
replaced the wlan_mac process model with our wlan_mac_ip_agg process model to test
our enhancements. AGG-MAC requires a value for fragmentation threshold in order to
actually aggregate the traffic; we set this to the maximal value of 2, 304B. This represented
performance on a perfect channel with the best possible results, just as the case was in the
original tutorial.
Our analysis included result from four different scenarios and are presented in Sec-
tion 7.4. Two scenarios were the original unchanged MAC protocol called PCF_disable and

J. Scot Ransbottom Chapter 6. AGG-MAC Design and Methodology 135
PCF_enable, and the other two scenarios were our AGG_MACprotocol calledPCF_disable_agg
and PCF_enable_agg.
6.7.3 Trace Traffic
We evaluated the performance of AGG-MAC for live data. We acquired WLAN traf-
fic traces from two sources. The first source was a US Army platoon-level exercise testing
prototype systems which employed the Land Warrior communications system, see Section
6.7.4. The second was trace data collected during the ACM SIGCOMM’01 conference held
at UCSD in August 2001, see Section 6.7.5. Each of the traces provided an opportunity
to evaluate AGG-MAC performance on actual user traffic. They represented two very dif-
ferent types of communication. The Land Warrior data was a very small data set of an ad
hoc network in DCF mode. The communications were almost exclusively multicast. The
SIGCOMM’01 trace was an extremely large data set consisting of PCF mode clients that
accessed the Internet via four Access Points. While the Land Warrior data was collected
over a period of approximately thirty minutes, the time necessary to conduct the military
operation, the SIGCOMM’01 traffic was collected over three full days of the conference and
represented over 300,000 flows from 195 distinct users.
We used a manual analysis of the Land Warrior traffic data in order to better un-
derstand the effects of AGG-MAC on such a data set and we ran OPNETTM simulations
using the actual traffic flows with the SIGCOMM’01 traffic captures. The Land Warrior
data offered little statistical significance, but did provide a single sample of an interesting
class of real traffic in a real situation. The SIGCOMM’01 trace data offered a much better
statistical significance in terms of both users and time. The results collected from these two
scenarios significantly improved our understanding of the benefits and limitations offered by
AGG-MAC over a wide range of conditions.

J. Scot Ransbottom Chapter 6. AGG-MAC Design and Methodology 136
6.7.4 Land Warrior Trace Traffic
Land Warrior Background
The US Army’s Land Warrior (LW) system was designed to interconnect the individ-
ual infantry soldier on the ground to the Tactical Internet. The purpose of this system was
to enhance the ground forces’ ability to deploy, fight and win on the battlefields of the 21st
century. The Land Warrior design considered the soldier to be a system of systems, tightly
integrated to form a complete weapons system. The soldier generated and consumed data
from many different sources. This data was transferred among the soldiers in the platoon
via a WLAN. Separate radio links served as gateways to send information from the platoon
to headquarters, to other units and to the rest of the Tactical Internet. Bandwidth limita-
tion was a major consideration throughout the design of the system. The current prototype
systems were quite judicious in limiting the size and quantity of the data transmitted over
the system. We believed that as the system continued to mature, the capacity requirements
would continue to increase significantly, but that many artifacts of the small message sizes
would persist. Since WLAN was a shared bandwidth medium, an increase in traffic for an
individual soldier reduced the total available capacity for all elements of the WLAN.
Figure 6.6 illustrates the hierarchical unit organization. Eight individual soldiers
and a squad leader comprised a squad. Three squads were grouped along with additional
leadership and a headquarters section to form a platoon. The platoon was led by the platoon
leader and was generally comprised of approximately 30-40 soldiers. The next level higher,
the company, was comprised of three platoons and a headquarters element.
Traditionally, communications among soldiers at the platoon-level had been con-
ducted via either non-technical means or through the use of voice radio systems. The LW
system was designed to enhance the individual soldier through an infusion of information
technology [50]. The communications subsystem provided integrated voice and data com-
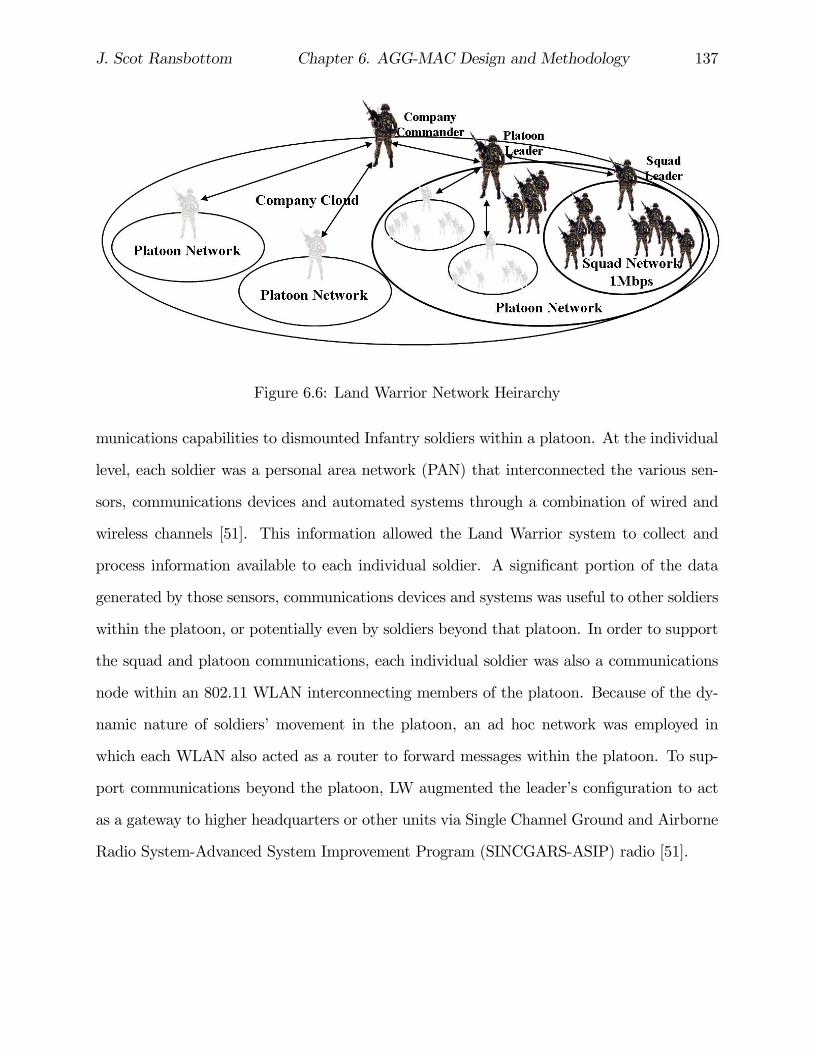
J. Scot Ransbottom Chapter 6. AGG-MAC Design and Methodology 137
Figure 6.6: Land Warrior Network Heirarchy
munications capabilities to dismounted Infantry soldiers within a platoon. At the individual
level, each soldier was a personal area network (PAN) that interconnected the various sen-
sors, communications devices and automated systems through a combination of wired and
wireless channels [51]. This information allowed the Land Warrior system to collect and
process information available to each individual soldier. A significant portion of the data
generated by those sensors, communications devices and systems was useful to other soldiers
within the platoon, or potentially even by soldiers beyond that platoon. In order to support
the squad and platoon communications, each individual soldier was also a communications
node within an 802.11 WLAN interconnecting members of the platoon. Because of the dy-
namic nature of soldiers’ movement in the platoon, an ad hoc network was employed in
which each WLAN also acted as a router to forward messages within the platoon. To sup-
port communications beyond the platoon, LW augmented the leader’s configuration to act
as a gateway to higher headquarters or other units via Single Channel Ground and Airborne
Radio System-Advanced System Improvement Program (SINCGARS-ASIP) radio [51].

J. Scot Ransbottom Chapter 6. AGG-MAC Design and Methodology 138
Exercise Data Origin
We were provided with captured traces from an actual Land Warrior exercise con-
ducted in 1999 at Fort Polk, Louisiana by a platoon of approximately 40 soldiers from the
82nd Airborne Division. The exercise was a proof of concept and used prototype equipment.
The results were considered a major success and the program continued to move forward
although it was still in the process of significant modifications and enhancements. An open
area of concern was and continues to be scalability of the system to ultimately support
multiple and larger units on the battlefield.
Though useful, the exercise data, presented several issues for our purposes. The
quantity of data itself was limited. Our sample data covered only a period of approximately
fifteen minutes of actual network operation. This provided only a single sample of a single
type of operation — and communications patterns could differ greatly for other types of
operations.
The only data in the trace was internal platoon communications. In a fully developed
Land Warrior system, additional data from external sources would enter and propagate
through the network. Presumably, additional reported data would also propagate outward
beyond the platoon. Only IP-level header information was available in the trace. No WLAN
specific traffic such as collisions, or protocol management traffic was collected. One significant
limitation for our purposes was having only transmission time available. For this reason, we
assumed a 30ms window to account for variations in queuing in the MAC or PHY layers.
The data also did not include retransmissions for subsequent hops across the network, so
it is unclear how many retransmissions of multicast traffic occurred. Each of these factors
should be considered when evaluating the overall performance of the WLAN network.
There were four distinct types of data packets in the current Land Warrior system:
Active Soldier data, E-mail data, Overlay data, and Voice over IP (VoIP) data. There were
currently several future data sources planned, including biometric and other sensor data, as
J. Scot Ransbottom Chapter 6. AGG-MAC Design and Methodology 139
well as data interconnecting additional peripherals. Active Soldier data was GPRS location
data transmitted every minute to update soldier’s location in the common operating picture.
E-mail data format was used to transmit text messages including predefined messages such
as SALUTE report, (SALUTE report includes {Size, Activity, Location, Unit or Uniform,
Time, and Equipment} information of potential intelligence value and was transmitted to
higher headquarters upon observation), call for fire, request for medical support, and several
others. Overlay data consisted of graphics images transmitted to other soldier’s such as map
graphics or battlefield images. VoIP packets were used to transmit voice communications
among the members of the platoon. Each of these packet types had differing constraints of
service requirements for the servicing network. Research into QoS attempted to address these
requirements. Our approach recognized these benefits and was intended to fully support and
potentially enhance QoS-aware implementations.
The current LW architecture employed a multicast-based addressing scheme. This
created a number of effects on the resultant network traffic. As most of the data generated
was intended for multiple recipients, repetitive unicast transmissions to each destination were
avoided. This design decision also prohibited the use of reliable MAC layer protocol mech-
anisms, so UDP packets were used in the transmission of all the data across the network.
Application layer protocols were used to handle reliability and retransmission. The mechan-
ics of these application protocols were not available to the authors, and was therefore not
considered. We considered each packet for transmission as an individual entity and assumed
it was processed accordingly. Results of our analysis of the Land Warrior trace data are
presented in Section 7.5.
6.7.5 ACM SIGCOMM’01 Trace Traffic
Researchers at UCSD captured user traffic during the conduct of the ACM sponsored
SIGCOMM’01. The duration of both the conference and the resulting trace was three days.
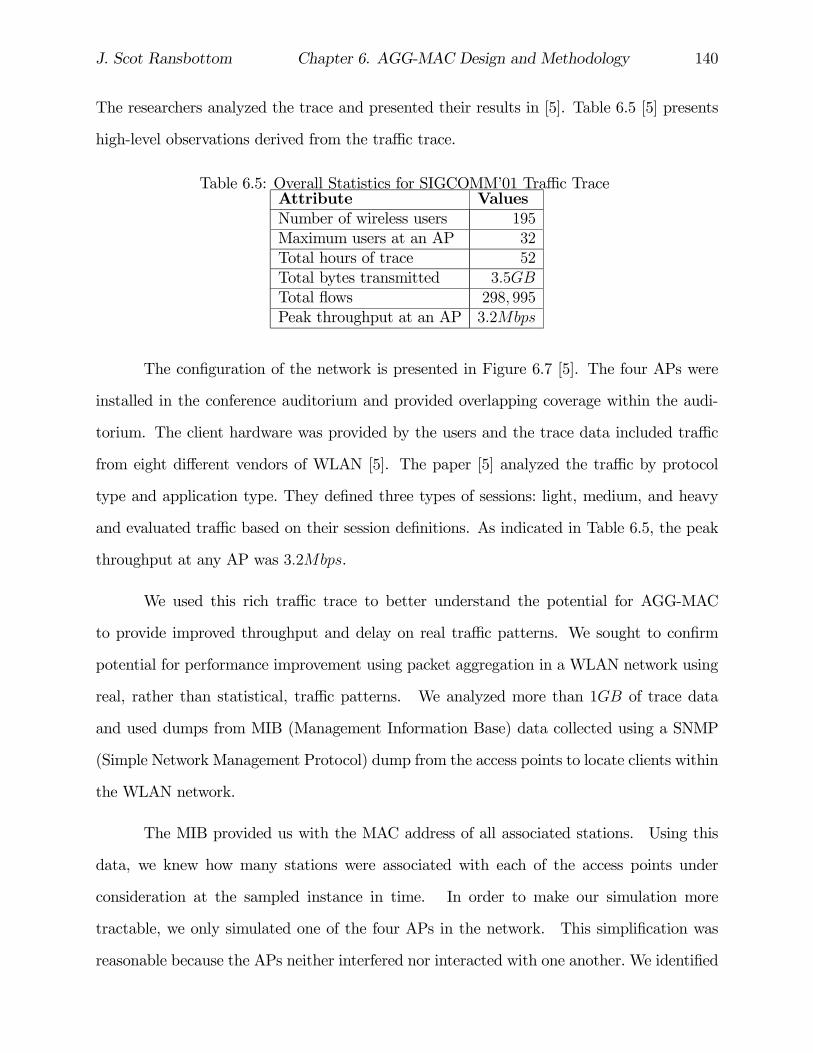
J. Scot Ransbottom Chapter 6. AGG-MAC Design and Methodology 140
The researchers analyzed the trace and presented their results in [5]. Table 6.5 [5] presents
high-level observations derived from the traffic trace.
Table 6.5: Overall Statistics for SIGCOMM’01 Traffic TraceAttribute ValuesNumber of wireless users 195Maximum users at an AP 32Total hours of trace 52Total bytes transmitted 3.5GBTotal flows 298, 995Peak throughput at an AP 3.2Mbps
The configuration of the network is presented in Figure 6.7 [5]. The four APs were
installed in the conference auditorium and provided overlapping coverage within the audi-
torium. The client hardware was provided by the users and the trace data included traffic
from eight different vendors of WLAN [5]. The paper [5] analyzed the traffic by protocol
type and application type. They defined three types of sessions: light, medium, and heavy
and evaluated traffic based on their session definitions. As indicated in Table 6.5, the peak
throughput at any AP was 3.2Mbps.
We used this rich traffic trace to better understand the potential for AGG-MAC
to provide improved throughput and delay on real traffic patterns. We sought to confirm
potential for performance improvement using packet aggregation in a WLAN network using
real, rather than statistical, traffic patterns. We analyzed more than 1GB of trace data
and used dumps from MIB (Management Information Base) data collected using a SNMP
(Simple Network Management Protocol) dump from the access points to locate clients within
the WLAN network.
The MIB provided us with the MAC address of all associated stations. Using this
data, we knew how many stations were associated with each of the access points under
consideration at the sampled instance in time. In order to make our simulation more
tractable, we only simulated one of the four APs in the network. This simplification was
reasonable because the APs neither interfered nor interacted with one another. We identified

J. Scot Ransbottom Chapter 6. AGG-MAC Design and Methodology 141
Figure 6.7: SIGCOMM’01 Network Configuration [5]
all of the clients associated with AP-NW at 11:00, the peak-hour, on Thursday, the busiest
day of the three-day conference. We randomly selected the AP-NW, one of the two busiest
APs, and conducted a limited search of the other APs in order to ensure that AP-NW was
representative of the overall population. Our analysis of the trace data also revealed that
due to the use of DHCP-based addressing, the IP addresses of the clients was allowed to
change throughout the conference. We realized therefore that we were required to use the
client adapter’s MAC address in order to uniquely identify an individual client machine.
Using the MAC address of each client associated with the AP-NW as a filter, we used
a C++ program to create an individual packet trace for each of the 25 clients associated
with the AP-NW. The C++ program incorporated the WinPcap Developer’s pack library
routines to read each packet from the original trace and write it out to another trace file if
the desired client was either the source or the destination address. This produced 25 trace
files, one for each desired client, that contained all captured packets where the desired client

J. Scot Ransbottom Chapter 6. AGG-MAC Design and Methodology 142
was either a source or destination in the ethernet packet - in effect, a trace file for each client.
This allowed us to use the OPNETTM Application Characterization Environment (ACE) to
analyze traffic flows for each specific client from which we created an application profile to
generate traffic on the network representative of the trace traffic generated by each client.
6.7.6 UMTS-WLAN w/AGG-MAC
We evaluated the performance of AGG-MAC in the interworked UMTS-WLAN sys-
tem we discussed in Chapters 4 and 5. As previously stated, the focus of Tracy Mann’s
thesis work [8] was to develop simulation experiments to compare the performance of an
interworked system against each of the baseline technologies, UMTS and WLAN. In or-
der to evaluate the performance of an interworked system, Section 4.9, which has been
augmented with AGG-MAC, a WLAN enhancement, we compared the performance of the
original UMTS-WLAN system with the performance of the same system using AGG-MAC
at the WLANMAC protocol layer. We based our comparison on Mann’s simulation scenario
UW-Heavy [8] because it evaluated the performance of the WLAN portion of the network
for a varied number of clients passing data traffic based upon a mix of http, email, and ftp
sessions. The original purpose of these experiments was to compare the performance of
the UMTS-WLAN interworked system against a baseline original WLAN system. The orig-
inal UTMS-WLAN interworked system was considered to be the baseline for our purposes
in order make a comparison with a similar system enhanced with AGG-MAC. The net-
work diagram for these experiments is shown in Figure 6.8. The results of these simulation
experiments are presented in Section 7.7.

J. Scot Ransbottom Chapter 6. AGG-MAC Design and Methodology 143
Figure 6.8: UMTS-WLAN with AGG-MAC Network Diagram
6.8 Summary
This chapter presented the design of the simulation model and the methodology used
in the development and evaluation of the AGG-MAC protocol. Section 6.1 provided a high-
level overview and discussion of the design space. More detailed discussion of the protocol
was presented in Section 6.2. We presented values for performance metrics used in our
simulation environment in Section 6.3, simulation parameters and simulation factors were
presented in Section 6.4 and Section 6.5 respectively, and the design of each of the simulation
experiments were presented in Section 6.7.
We tested AGG-MAC in both the PCF and the DCF modes, and determined that it
could be useful in a very broad range of situations. We simulated performance using both
statistically generated and actual captured live trace traffic data. Our analysis considered
the performance of the protocol across a wide range of conditions. We present the results of
validation, verification and our other simulated experiments next in Chapter 7.
Chapter 7
AGG-MAC Results
7.1 Model Verification
Model verification is the process of determining if a simulation model functions cor-
rectly. This includes such tasks as debugging the computer code, testing for logic errors,
and testing the functionality of different modules. As discussed in Section 6.1 and Section
6.2, the simulation was designed in OPNETTM Modeler 9.1.A using a top-down, modular
approach. This approach simplified the task of model verification since each module can be
tested independently.
Each node and process in the simulation was tested to verify that it functioned cor-
rectly. This was accomplished by running short simulations and collecting statistics at
various points in the model. Standard OPNETTM processes were tested to ensure they
functioned as described in the software documentation.
In order to verify correct operation of the AGG-MAC model, we created a basic
scenario in which the network consisted of only two simple, custom stations (Figure 7.1). The
only traffic on this network was generic packets transmitted from station_1 to station_2. We
based our source on the process model comm_station, and made modifications to compute
144

J. Scot Ransbottom Chapter 7. AGG-MAC Results 145
Figure 7.1: Aggregation Baseline Network
and set the arrival_rate based on the promoted parameter, packet_size. We designed the
source process to produce packets of the requested size at a rate of 2 Mbps, based on either
a constant or exponential distribution.
Our initial verification was to ensure that packets coming into our wlan_mac_ip_agg
process model were correctly leaving our process model and being sent to the correct destina-
tion. Also we ensured that packets were not in any way resequenced by wlan_mac_ip_agg
to ensure that current in order delivery assumptions were not modified. We recognize, see
Section 6.1.3, that additional performance enhancements could be obtained through rese-
quencing, but that mechanism remains an open topic for future research. We collected each
packet transmitted, verifying both correct and in-order transmission and receipt of packets
from transmitting node to receiving node over the wireless channel were correctly performed.
In addition to basic verification, our subsequent testing included operation with a fully simu-
lated protocol stack (workstation) in which we confirmed correct operation during interaction
with higher layer protocols.

J. Scot Ransbottom Chapter 7. AGG-MAC Results 146
7.2 Model Validation
Model validation is the process of determining if a simulation model is representa-
tive of the real system. A simulation can be validated using expert intuition, real system
measurements, or theoretical results [37]. Comparing simulation outputs and measurements
from a real system is the most reliable way of validating a simulation model. Real system
measurements were not available in this research, since this was not yet a currently imple-
mented protocol. Comparing simulation and theoretical results was the primary method
used to validate the simulation model. Theoretical analysis of the system was conducted
using both deterministic and exponential traffic sources.
To validate the expected performance improvements, we computed the expected
throughput and delay based on overhead associated with a packet in the original and in
our aggregated wireless LAN protocol. Our results were consistent with the computed val-
ues, as Figure 7.2 indicates by plotting the throughput for the original WLAN and for
AGG-MAC. As expected, and predicted analytically, the original throughput was severely
limited for small packet sizes while AGG-MAC provided near optimal throughput at high
load.
Figure 7.2: Avg. Throughput (Constant 2Mbps Source)

J. Scot Ransbottom Chapter 7. AGG-MAC Results 147
Figure 7.3 presented the average bits per second dropped due to buffer capacity
and Figure 7.4 similarly presented the average delay for both cases. Clearly AGG-MAC
provided significant performance benefit for small data streams with small packet sizes and
performance consistent with the original WLAN for packet sizes too large to aggregate. In
such a case, throughput was near optimal, and delay was lower and more constant with less
data dropped.
Figure 7.3: Avg. Dropped Data (Constant 2Mbps Source)
Figure 7.4: Avg. WLAN Delay (Constant 2Mbps Source)
The saw tooth effect in the red AGG-MAC traces (Figures 7.2 and 7.3) was due to

J. Scot Ransbottom Chapter 7. AGG-MAC Results 148
the increasing step sizes where the number of packets that was aggregated changed. Best
performance occurred where the total size of the aggregate frame was equal to the maximum
fragmentation threshold, 2, 304 Bytes. The drop in the saw tooth occurred where an addi-
tional incremented byte in packet size caused fewer packets to be aggregated. Larger packet
sizes created larger saw tooth because the step size between number of packets aggregated
was larger.
7.3 Results for Effect of Errors on the Channel
In this section, we present the results of analysis of effect of noise on the WLAN
channel. As presented in Section 6.7.1, we ran an extensive set of simulations designed to
better characterize the performance of AGG-MAC protocol and to determine its suitability
under anticipated operating conditions. Section 7.3.1 demonstrated the performance of a
single transmitting station over varied error conditions. In Section 7.3.2, we expanded on the
insights gleaned from Section 7.3.1 to consider the effects of multiple stations competing for
the shared channel. We incorporated results for scenarios with 10 stations and for 50 stations
attempting to transmit data over the shared WLAN channel. Because the characteristics
of a source of noise that produced errors at a given value of BER and their resultant effect
on performance can vary significantly, we addressed this situation in Section 7.3.3.
7.3.1 Single Transmitting Station
This section considered our most basic error-prone scenario. As identified in Section
6.7.1, we began with the same system used in our Validation testing, see Section 7.2, and
injected periodic bursts of noise on the channel. The results presented in this section
represent a single bit error where the frequency of occurrence of the error, or the length of
time the channel was noise free, was set to produce the desired BER. The results produced

J. Scot Ransbottom Chapter 7. AGG-MAC Results 149
Figure 7.5: Original WLAN Throughput vs. Packet Size under varied BER
in this set of simulations were expected to be consistent with those published in [33] and
discussed in Section 3.2.2. The results for the original WLAN MAC system for various
Frame Sizes for varied values of BER are depicted in Figure 7.5. The achieved results are
consistent with those presented [33] and discussed in Section 3.2.2 where the reader can refer
back to Figure 3.1. These results illustrate the analytical results published in [33]. While
the focus of [33] was on establishing the fragmentation_threshold as an upper limit to the
size of large frames based on a low probability of successful transmission; we approached
the problem from the other extreme. AGG-MAC used the fragmentation_threshold as,
still an upper limit, but also as a target value to aggregate together smaller packets so the
total system functions as close to the optimum operating point, fragmentation_threshold, as
possible.
Figure 7.6 illustrates the performance of the same system augmented with the AGG-
MAC protocol. These results are presented for a maximal value, 2, 304 Bytes, of fragmenta-
tion_threshold. Under conditions of low noise, BERs above approximately 10−5, AGG-MAC
with a maximal fragmentation_threshold outperformed or at least equaled the performance
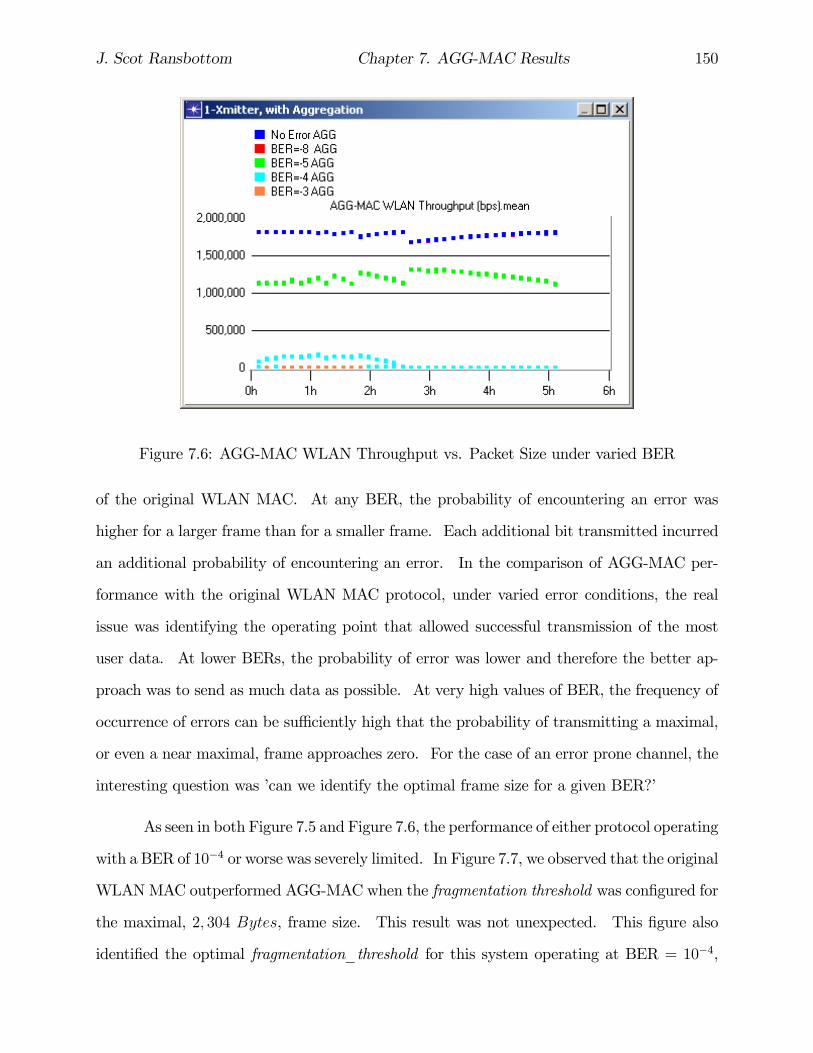
J. Scot Ransbottom Chapter 7. AGG-MAC Results 150
Figure 7.6: AGG-MAC WLAN Throughput vs. Packet Size under varied BER
of the original WLAN MAC. At any BER, the probability of encountering an error was
higher for a larger frame than for a smaller frame. Each additional bit transmitted incurred
an additional probability of encountering an error. In the comparison of AGG-MAC per-
formance with the original WLAN MAC protocol, under varied error conditions, the real
issue was identifying the operating point that allowed successful transmission of the most
user data. At lower BERs, the probability of error was lower and therefore the better ap-
proach was to send as much data as possible. At very high values of BER, the frequency of
occurrence of errors can be sufficiently high that the probability of transmitting a maximal,
or even a near maximal, frame approaches zero. For the case of an error prone channel, the
interesting question was ’can we identify the optimal frame size for a given BER?’
As seen in both Figure 7.5 and Figure 7.6, the performance of either protocol operating
with a BER of 10−4 or worse was severely limited. In Figure 7.7, we observed that the original
WLANMAC outperformed AGG-MAC when the fragmentation threshold was configured for
the maximal, 2, 304 Bytes, frame size. This result was not unexpected. This figure also
identified the optimal fragmentation_threshold for this system operating at BER = 10−4,
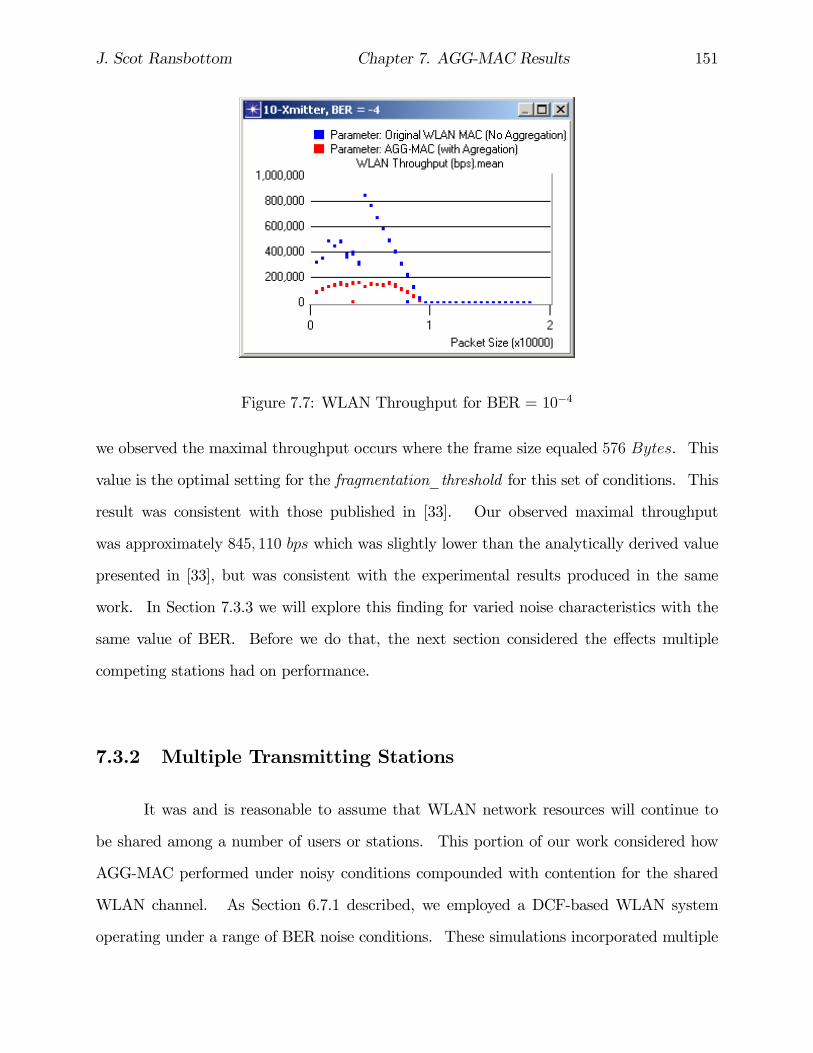
J. Scot Ransbottom Chapter 7. AGG-MAC Results 151
Figure 7.7: WLAN Throughput for BER = 10−4
we observed the maximal throughput occurs where the frame size equaled 576 Bytes. This
value is the optimal setting for the fragmentation_threshold for this set of conditions. This
result was consistent with those published in [33]. Our observed maximal throughput
was approximately 845, 110 bps which was slightly lower than the analytically derived value
presented in [33], but was consistent with the experimental results produced in the same
work. In Section 7.3.3 we will explore this finding for varied noise characteristics with the
same value of BER. Before we do that, the next section considered the effects multiple
competing stations had on performance.
7.3.2 Multiple Transmitting Stations
It was and is reasonable to assume that WLAN network resources will continue to
be shared among a number of users or stations. This portion of our work considered how
AGG-MAC performed under noisy conditions compounded with contention for the shared
WLAN channel. As Section 6.7.1 described, we employed a DCF-based WLAN system
operating under a range of BER noise conditions. These simulations incorporated multiple

J. Scot Ransbottom Chapter 7. AGG-MAC Results 152
Figure 7.8: WLAN Throughput, Multiple Stations, Error Free
stations concurrently generating data and attempting to transmit over the shared channel.
Each station generated sufficient traffic to saturate the system, so each station consistently
had frames to transmit. We considered 10 stations to a be a nominal, reasonable operating
condition and used 50 stations for a purely saturated condition.
As illustrated in Figure 7.8, under the examined set of operating parameters, the num-
ber of transmitting stations had a measurable impact on the maximum achievable through-
put, but the characteristics of the throughput curves were consistent for the cases of 1, 10,
and 50 transmitting stations. Figure 7.8 presents only the error free case for clarity and
simplicity, however comparison of Figure 7.5 and Figure 7.9 illustrates the point for the
original WLAN MAC protocol. Similarly for the case of the performance of WLAN systems
augmented with the AGG-MAC protocol, compare Figure 7.6 with Figure 7.10 to observe
that the characteristic curves are similar.
Under the least favorable conditions, we observed that the performance of the systems
was more dependent upon the errors in the system than on the amount of contention in the

J. Scot Ransbottom Chapter 7. AGG-MAC Results 153
Figure 7.9: Original WLAN Throughput vs. Packet Size under varied BER (50 stations)
Figure 7.10: AGG-MACWLAN Throughput vs. Packet Size under varied BER (50 stations)

J. Scot Ransbottom Chapter 7. AGG-MAC Results 154
Figure 7.11: Multiple Station Total WLAN Throughput for BER=10−4
system. Figure 7.11 illustrated the performance of the system, regardless of number of users,
was directly connected to the BER encountered on the channel. In the next section, we
examine the effect longer or shorter bursts of noise on the channel.
7.3.3 Burstiness of the Noise
As bit error rate is, in fact, a measure of the rate and a single dimensional value,
it necessarily abstracts away much information about the characteristics of the source of
the errors. In order to produce a BER = 10−4, a single bit error would occur every
10, 000 bits, while a repeated burst error of 1, 000 bits in length would be repeated only
once every 10, 000, 000 bits. In this section, we examined the effects of differing lengths of
burst errors, or the characteristics of the noise on the channel. We identified this as one
aspect of [33] that could have been more explicitly described in better understanding the
parameters they used. As seen in Figure 7.12, the characteristics of the length of the noise
burst had a significant impact on the performance of the channel. Distributed single bit

J. Scot Ransbottom Chapter 7. AGG-MAC Results 155
Throughput vs. Packet Size, BER = 10^-4
0
200
400
600
800
1000
1200
1400
1600
1800
2000
0 256 512 768 1024 1280 1536 1792 2048 2304Packet Size (Bytes)
Thro
ugpu
t (kb
ps)
1-bit, Orignal WLAN1-bit, AGG-MAC0.5s burst, Original WLAN0.5s burst, AGG-MAC1.0s burst, Original WLAN1.0s burst, AGG-MAC
Figure 7.12: WLAN Throughput vs. Packet Size under varied length burst errors (BER =10−4)
errors potentially generated errors in several frames and had a significantly greater negative
effect on the potential throughput of the WLAN than a burst of bit errors that collided with
a single packet or group of adjacent packets. This work did not consider the higher-order
effects of transport level protocols, such as TCP, that might respond to differently to a single
packet loss than to loss of a sequence of packets.
7.4 AGG-MAC Infrastructure Mode
Below we present some of the results from the OPNETWORK 2002 Tutorial 1332
titled “Maximizing Performance for Wireless LANs” [49]. The scenario of this tutorial was
selected because it represented a very diverse traffic load with consideration for both DCF and
PCF modes of operation. Refer to [49] for additional specifics on the simulation parameters.
Because the system operated well below capacity and was designed to provide suc-
cessful communication in its original configuration, the throughput was not significantly
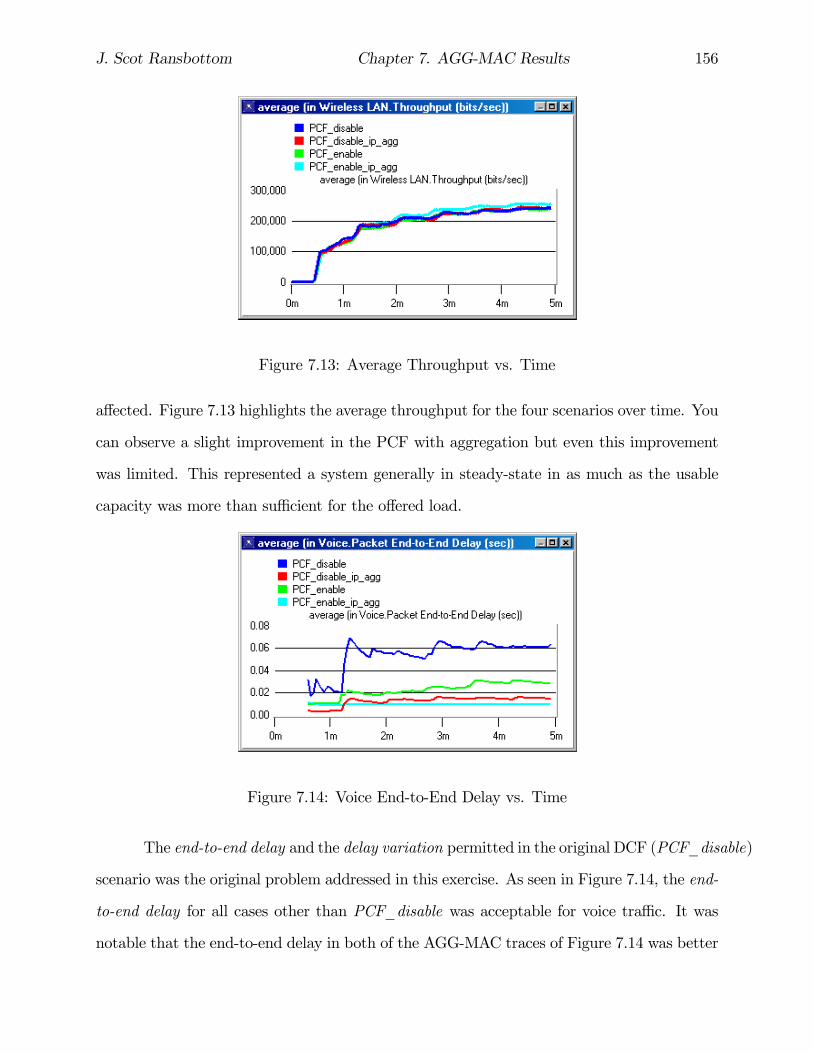
J. Scot Ransbottom Chapter 7. AGG-MAC Results 156
Figure 7.13: Average Throughput vs. Time
affected. Figure 7.13 highlights the average throughput for the four scenarios over time. You
can observe a slight improvement in the PCF with aggregation but even this improvement
was limited. This represented a system generally in steady-state in as much as the usable
capacity was more than sufficient for the offered load.
Figure 7.14: Voice End-to-End Delay vs. Time
The end-to-end delay and the delay variation permitted in the original DCF (PCF_disable)
scenario was the original problem addressed in this exercise. As seen in Figure 7.14, the end-
to-end delay for all cases other than PCF_disable was acceptable for voice traffic. It was
notable that the end-to-end delay in both of the AGG-MAC traces of Figure 7.14 was better

J. Scot Ransbottom Chapter 7. AGG-MAC Results 157
than either of the original traces. This indicated that even in the contention-based DCF
mode of operation, AGG-MAC could support voice traffic in this scenario and while either
MAC layer could support voice traffic in PCF mode, AGG-MAC performance was better
under these conditions.
Figure 7.15 indicated that delay variation or jitter was significantly reduced when
using AGG-MAC. Because AGG-MAC attempted to send as much data as was available
under the constraints of the fragmentation threshold, the small packet sizes of the voice
traffic clearly benefited from our approach. From these graphs, it appeared that aggregation
in either mode of operation was more beneficial than simple PCF mode operation for voice
communications under these conditions.
Figure 7.15: Voice Delay Variation vs. Time
We additionally observed from Figure 7.16 that HTTP traffic performance was com-
parable and acceptable in all cases with generally a slightly better performance under AGG-
MAC than with the original protocols.
In Figure 7.17, we observed that FTP performance was also comparable with or
without aggregation. FTP performance was slightly worse for the AGG-MAC protocol during
peak traffic periods and for the QoS generally associated with FTP protocols. We considered
this a desirable trait because it had the effect of rewarding smaller streams and penalizing

J. Scot Ransbottom Chapter 7. AGG-MAC Results 158
Figure 7.16: Avg. HTTP Page Response
Figure 7.17: Avg. FTP Upload Reponse
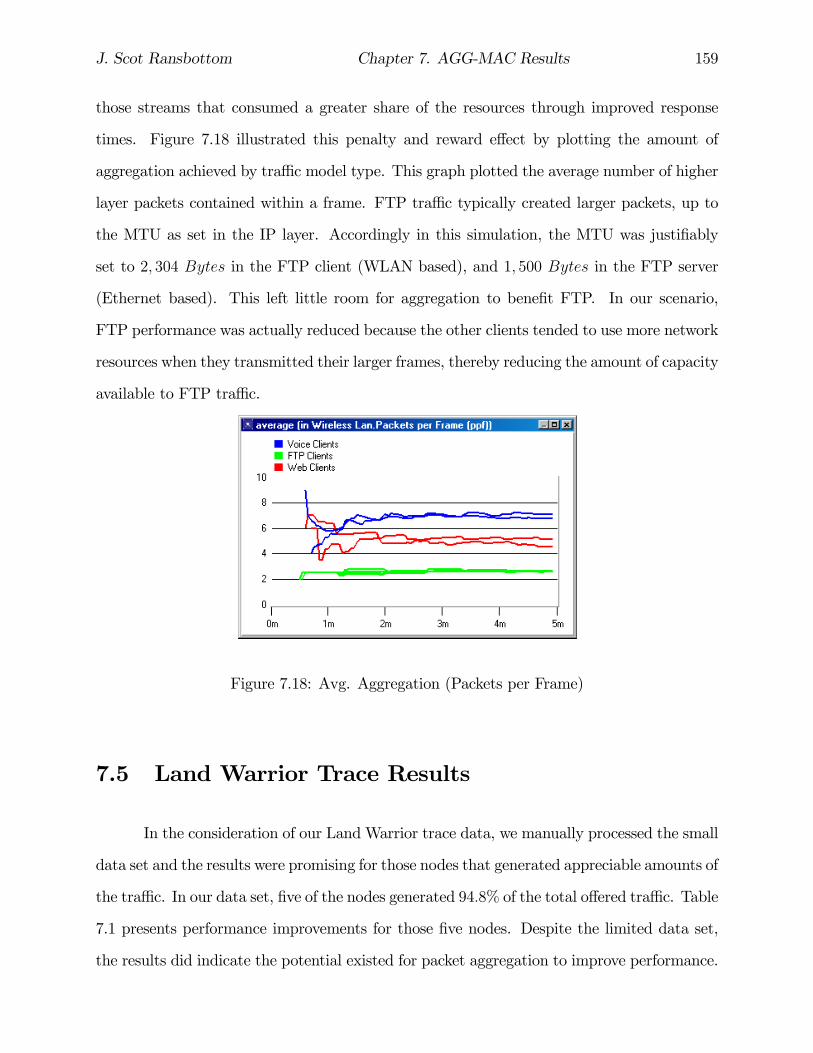
J. Scot Ransbottom Chapter 7. AGG-MAC Results 159
those streams that consumed a greater share of the resources through improved response
times. Figure 7.18 illustrated this penalty and reward effect by plotting the amount of
aggregation achieved by traffic model type. This graph plotted the average number of higher
layer packets contained within a frame. FTP traffic typically created larger packets, up to
the MTU as set in the IP layer. Accordingly in this simulation, the MTU was justifiably
set to 2, 304 Bytes in the FTP client (WLAN based), and 1, 500 Bytes in the FTP server
(Ethernet based). This left little room for aggregation to benefit FTP. In our scenario,
FTP performance was actually reduced because the other clients tended to use more network
resources when they transmitted their larger frames, thereby reducing the amount of capacity
available to FTP traffic.
Figure 7.18: Avg. Aggregation (Packets per Frame)
7.5 Land Warrior Trace Results
In the consideration of our Land Warrior trace data, we manually processed the small
data set and the results were promising for those nodes that generated appreciable amounts of
the traffic. In our data set, five of the nodes generated 94.8% of the total offered traffic. Table
7.1 presents performance improvements for those five nodes. Despite the limited data set,
the results did indicate the potential existed for packet aggregation to improve performance.

J. Scot Ransbottom Chapter 7. AGG-MAC Results 160
The six nodes with the fewest transmissions each had only one transmission. It was
not clear whether these were frames received in error but not identified or whether six nodes
transmitted only one frame during the entire exercise. Our inclination was that these frames
were received in error.
Table 7.1: Top 5 Land Warrior Senders AGG-MAC ImprovmentOriginating Number Frames Transmitted PercentStation Original Enhanced Reduction Reduction
Platoon Leader 2322 1511 811 34.93%Unidentified (192.169.0.60) 563 384 179 31.79%Unidentified (192.169.0.83) 70 50 20 28.57%Unidentified (192.169.0.37) 158 116 42 26.58%Unidentified (192.169.0.42) 126 97 29 23.02%
One additional enhancement that would be worth consideration for the Land Warrior
system was to set a minimum and maximum timer for the transmission of Active Soldier
data on the order of 30s - 55s. If, upon receipt of a packet for transmission after the timer
reached the minimum value but before reaching the maximum value, the desired GPS po-
sition location information could then be opportunistically generated and aggregated into
the other data traffic. Then the system would only generate an additional frame to support
position location in the event the maximum timer were allowed to expire without the oc-
currence of a packet for transmission. Similar approaches could be used for other periodic,
non-real-time or near real-time data transmissions.
The platoon leader generated the most data during the exercise, and therefore pre-
sented the most potential for improved performance. Because the trace data was captured
during actual transmission, we could not exactly determine when the packet was available
to the MAC layer and whether or not internal queuing had occurred. For this reason, we
assumed that packets transmitted within a 30msec window could potentially be aggregated.
In order to consider the effect of a noisy channel and to conform to stated design
considerations [50], we constrained the maximum size of a data element to be 256 Bytes.
Selection of this value corresponded to the most restrictive possible value for fragmenta-

J. Scot Ransbottom Chapter 7. AGG-MAC Results 161
Figure 7.19: SIGCOMM’01 Network Simulation Layout
tion_threshold in 802.11 [28]. Even under these limited constraints, the platoon leader
achieved a 34.9% reduction in the number of frames transmitted. This resulted in additional
realizable capacity of 338 kbits of data traffic for a fully utilized channel. The total improve-
ment achieved 7.5% increase in throughput overall, even with the inclusion of the six nodes
that transmitted only a single frame. Based upon our operational experience, we believe that
as the Land Warrior system develops, the traffic intensity will only increase and could derive
even greater performance improvement from the AGG-MAC packet aggregation technique.
7.6 ACM SIGCOMM’01 Trace Results
Section 6.7.5 provided an overview of our methodology for using the rich trace data
collected at the IEEE SIGCOMM2001 conference. This real-world traffic was the foundation
for the simulation scenario depicted in Figure 7.19. In this section, we present the results of
our simulation using trace data collected from the IEEE SIGCOMM’01 conference.
As indicated in Section 6.7.5 , our simulation was constrained to only one, AP_NW,
of the four access points. In order to limit the volume of data considered, we further

J. Scot Ransbottom Chapter 7. AGG-MAC Results 162
Figure 7.20: SIGCOMM’01 Client Data Exchange (52 hour Trace)
constrained our focus to the busiest hour of the conference. While users were free to move
among the different access points throughout the conference, [5] noted that mobility was not
a factor during scheduled sessions. It was noted that clients only moved to a different AP
following breaks in the program. We filtered the original trace file using a C++ program we
created using the WinPCAP libraries, and created trace files for each of the 25 clients that
were associated with the AP-NW as identified in the MIB files at the start of the busiest
hour. Because our focus was on the performance of the WLAN portion of the network,
we abstracted the 473 remote machines contacted by the conference attendees into a single
conceptual destination.
An example filtered trace file for the client with MAC address = 00:e0:63:50:6c:d4 is
provided in Figure 7.20. This trace represented the entire 52 hours of the conference. This
client was identified as one of the heavy traffic clients throughout the conduct of conference.
From this trace, we can clearly identify the times the conference was in session and when it
was not. It can also be observed that the preponderance of traffic was less than 500 Bytes
in size. These two observations were consistent for each of the 25 clients we analyzed.

J. Scot Ransbottom Chapter 7. AGG-MAC Results 163
Figure 7.21: SIGCOMM’01 Client Data Exchange (11:00 - 11:10 Trace)
Figure 7.21 presents a view of the first ten minutes of communications during the
busiest hour for this heavy traffic client. This was a ten minute subset of the 52 hours
depicted in Figure 7.20. This ten minute period represented the time simulated in our
OPNETTM model. Analysis of the communications traces for each of the 25 clients associ-
ated considered in this simulation identified that although 25 clients were associated, only
seven of those communicated any traffic during the period of observation. Four of those
clients were characterized as medium traffic clients and three were identified as heavy traffic
clients. We simulated this network with nodes using the original WLAN MAC and then
repeated it using our AGG-MAC protocol enhanced nodes. The results of those simulations
are presented in Table 7.2.
The throughput of our simulated system was consistent with the expected peak
throughput for the original system from which the trace data originated. Average through-
put during the simulation was 3.04Mbps with an instantaneous peak throughput of 4.1Mbps.
As indicated in Figure 6.5, [5] observed a peak data rate of 3.2 Mbps and our system was
designed to represent the busy hour of the conference. When AGG-MAC was active, the
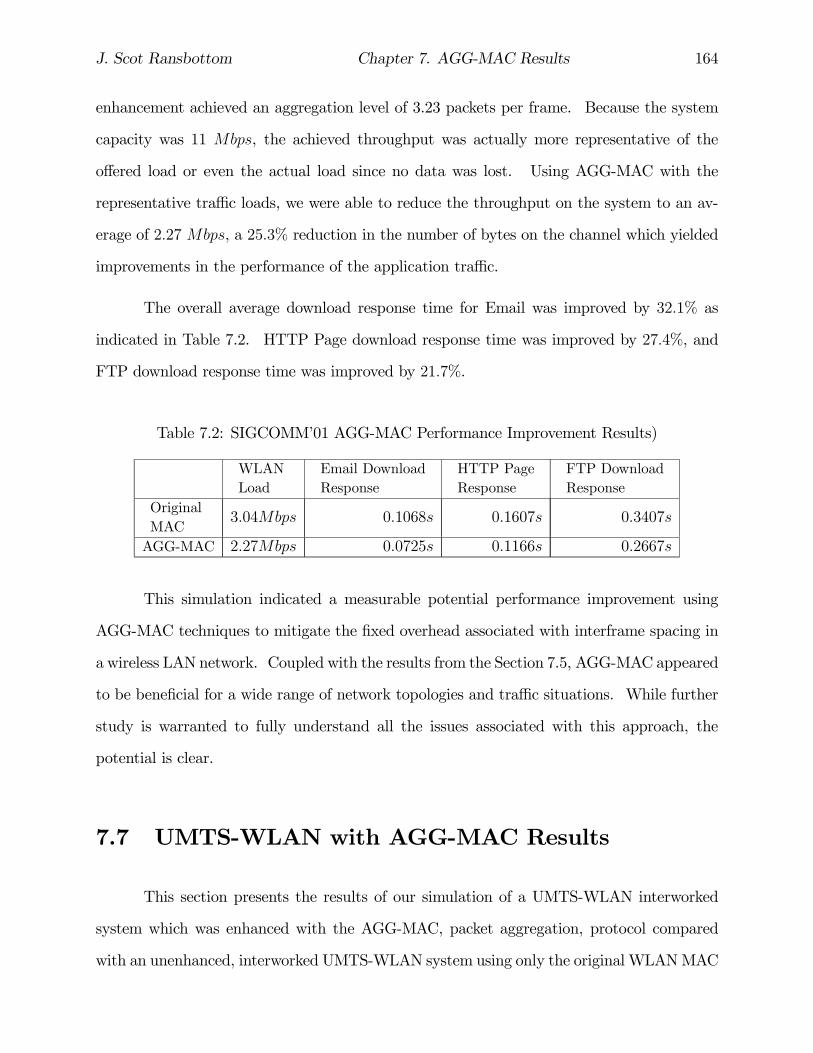
J. Scot Ransbottom Chapter 7. AGG-MAC Results 164
enhancement achieved an aggregation level of 3.23 packets per frame. Because the system
capacity was 11 Mbps, the achieved throughput was actually more representative of the
offered load or even the actual load since no data was lost. Using AGG-MAC with the
representative traffic loads, we were able to reduce the throughput on the system to an av-
erage of 2.27 Mbps, a 25.3% reduction in the number of bytes on the channel which yielded
improvements in the performance of the application traffic.
The overall average download response time for Email was improved by 32.1% as
indicated in Table 7.2. HTTP Page download response time was improved by 27.4%, and
FTP download response time was improved by 21.7%.
Table 7.2: SIGCOMM’01 AGG-MAC Performance Improvement Results)
WLANLoad
Email DownloadResponse
HTTP PageResponse
FTP DownloadResponse
OriginalMAC
3.04Mbps 0.1068s 0.1607s 0.3407s
AGG-MAC 2.27Mbps 0.0725s 0.1166s 0.2667s
This simulation indicated a measurable potential performance improvement using
AGG-MAC techniques to mitigate the fixed overhead associated with interframe spacing in
a wireless LAN network. Coupled with the results from the Section 7.5, AGG-MAC appeared
to be beneficial for a wide range of network topologies and traffic situations. While further
study is warranted to fully understand all the issues associated with this approach, the
potential is clear.
7.7 UMTS-WLAN with AGG-MAC Results
This section presents the results of our simulation of a UMTS-WLAN interworked
system which was enhanced with the AGG-MAC, packet aggregation, protocol compared
with an unenhanced, interworked UMTS-WLAN system using only the original WLANMAC

J. Scot Ransbottom Chapter 7. AGG-MAC Results 165
WLAN Throughput
0
1
2
3
4
5
6
7
8
0 5 10 15 20 25 30
Mbp
s
Number of UWs in WLAN mode
Thro
ughp
ut (M
bps)
mea
n
Original WLAN MAC (No Aggregation)
AGG-MAC (w ith Aggregation)
Figure 7.22: UMTS-WLAN with AGG-MAC: WLAN Average Total Throughput (Mbps)
protocol. The original purpose of Tracy Mann’s thesis experiments [8] was to compare
the performance of the UMTS-WLAN interworked system with an original baseline WLAN
system. We compared his results with those produced by a UMTS-WLAN interworked
system enhanced with the AGG-MAC packet aggregation protocol. While the simulations
in [8] had three portions, our focus is currently on the performance of the WLAN component.
In order to evaluate the performance of an AGG-MAC enhanced UMTS-WLAN system, our
focus was strictly on UWs operating in WLAN mode.
In order to assess the overall performance of our two systems, we examined total
system throughput by varying the number of UWs that were attempting to communicate on
the channel. The results of these simulations are presented in Figure 7.22. At first glance, it
appeared that AGG-MAC performed worse than the original WLAN based on total system
throughput. However this was not the case, due to the aggregation of packets, fewer bits
were transmitted over the channel. In this case, the channel supported all of the offered
communications requirements while transmitting fewer bits. In the cases consisting of a
small number of clients, fewer than ten, the network was idle for measurable periods of time
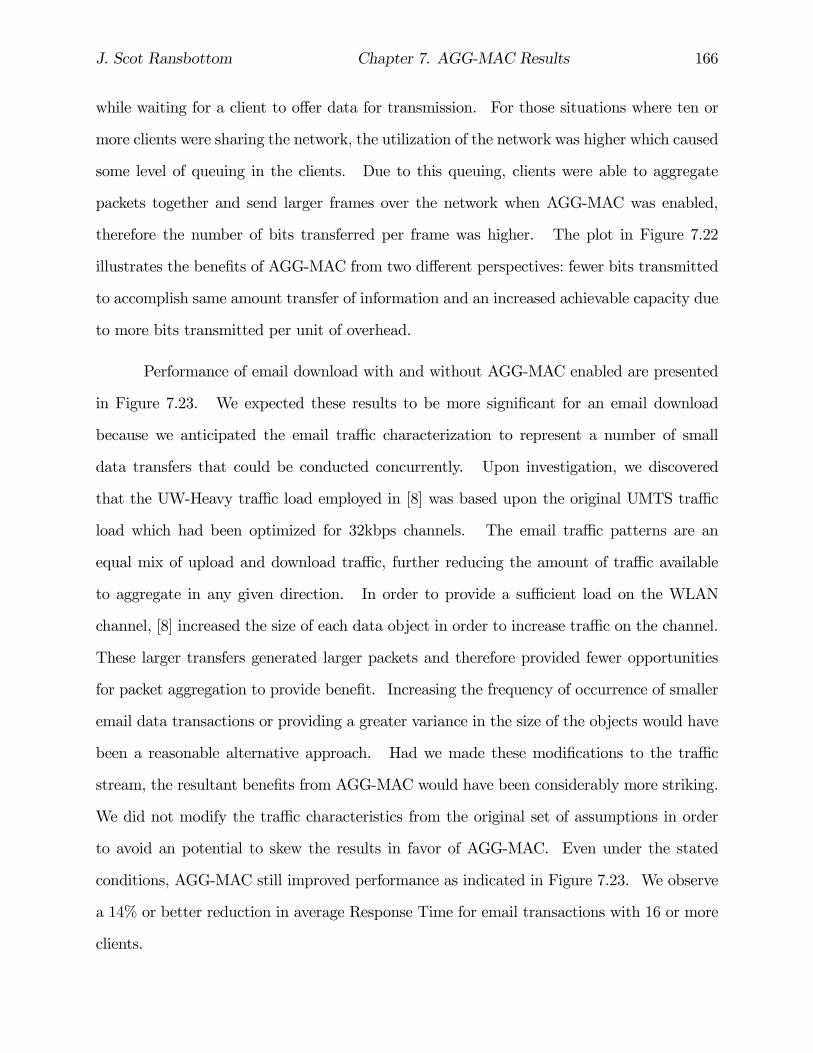
J. Scot Ransbottom Chapter 7. AGG-MAC Results 166
while waiting for a client to offer data for transmission. For those situations where ten or
more clients were sharing the network, the utilization of the network was higher which caused
some level of queuing in the clients. Due to this queuing, clients were able to aggregate
packets together and send larger frames over the network when AGG-MAC was enabled,
therefore the number of bits transferred per frame was higher. The plot in Figure 7.22
illustrates the benefits of AGG-MAC from two different perspectives: fewer bits transmitted
to accomplish same amount transfer of information and an increased achievable capacity due
to more bits transmitted per unit of overhead.
Performance of email download with and without AGG-MAC enabled are presented
in Figure 7.23. We expected these results to be more significant for an email download
because we anticipated the email traffic characterization to represent a number of small
data transfers that could be conducted concurrently. Upon investigation, we discovered
that the UW-Heavy traffic load employed in [8] was based upon the original UMTS traffic
load which had been optimized for 32kbps channels. The email traffic patterns are an
equal mix of upload and download traffic, further reducing the amount of traffic available
to aggregate in any given direction. In order to provide a sufficient load on the WLAN
channel, [8] increased the size of each data object in order to increase traffic on the channel.
These larger transfers generated larger packets and therefore provided fewer opportunities
for packet aggregation to provide benefit. Increasing the frequency of occurrence of smaller
email data transactions or providing a greater variance in the size of the objects would have
been a reasonable alternative approach. Had we made these modifications to the traffic
stream, the resultant benefits from AGG-MAC would have been considerably more striking.
We did not modify the traffic characteristics from the original set of assumptions in order
to avoid an potential to skew the results in favor of AGG-MAC. Even under the stated
conditions, AGG-MAC still improved performance as indicated in Figure 7.23. We observe
a 14% or better reduction in average Response Time for email transactions with 16 or more
clients.
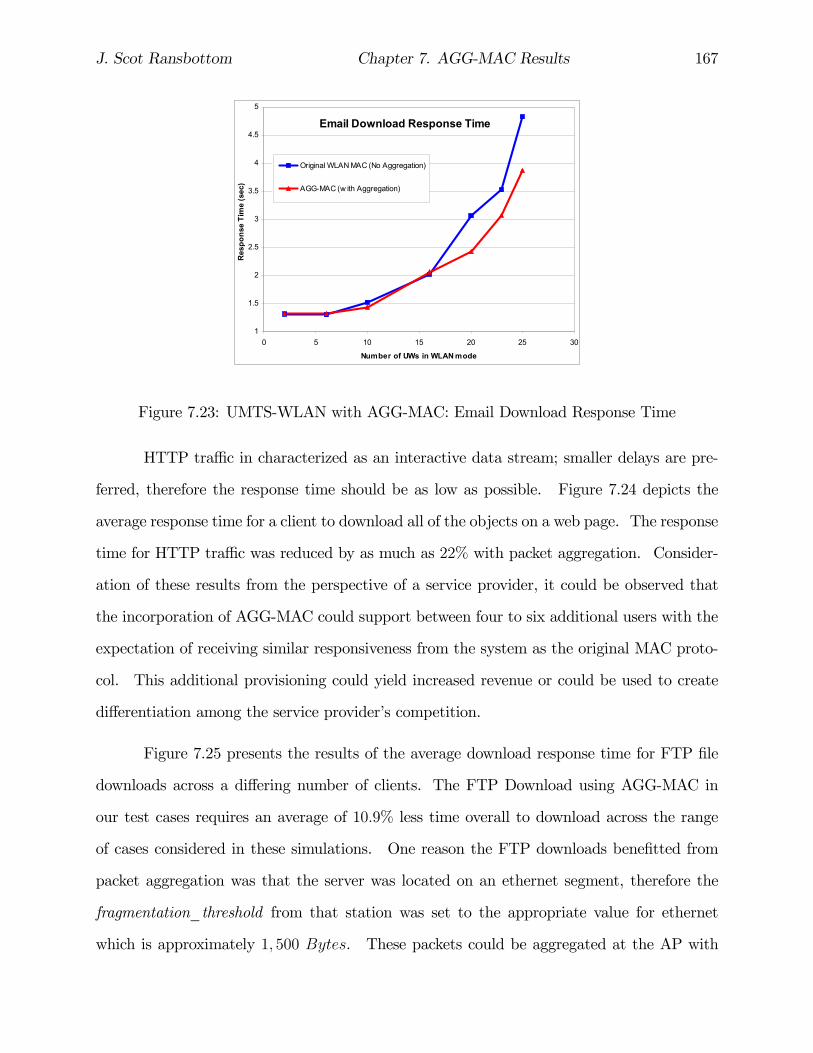
J. Scot Ransbottom Chapter 7. AGG-MAC Results 167
Email Download Response Time
1
1.5
2
2.5
3
3.5
4
4.5
5
0 5 10 15 20 25 30
Number of UWs in WLAN mode
Res
pons
e Ti
me
(sec
)
Original WLAN MAC (No Aggregation)
AGG-MAC (w ith Aggregation)
Figure 7.23: UMTS-WLAN with AGG-MAC: Email Download Response Time
HTTP traffic in characterized as an interactive data stream; smaller delays are pre-
ferred, therefore the response time should be as low as possible. Figure 7.24 depicts the
average response time for a client to download all of the objects on a web page. The response
time for HTTP traffic was reduced by as much as 22% with packet aggregation. Consider-
ation of these results from the perspective of a service provider, it could be observed that
the incorporation of AGG-MAC could support between four to six additional users with the
expectation of receiving similar responsiveness from the system as the original MAC proto-
col. This additional provisioning could yield increased revenue or could be used to create
differentiation among the service provider’s competition.
Figure 7.25 presents the results of the average download response time for FTP file
downloads across a differing number of clients. The FTP Download using AGG-MAC in
our test cases requires an average of 10.9% less time overall to download across the range
of cases considered in these simulations. One reason the FTP downloads benefitted from
packet aggregation was that the server was located on an ethernet segment, therefore the
fragmentation_threshold from that station was set to the appropriate value for ethernet
which is approximately 1, 500 Bytes. These packets could be aggregated at the AP with

J. Scot Ransbottom Chapter 7. AGG-MAC Results 168
HTTP Page Response Time
1
1.5
2
2.5
3
3.5
4
4.5
5
2 4 6 8 10 12 14 16 18 20 22 24Number of UWs in WLAN mode
Page
Res
pons
e Ti
me
(sec
)
Original WLAN MAC (No Aggregation)
AGG-MAC (w ith Aggregation)
Figure 7.24: UMTS-WLAN with AGG-MAC: HTTP Page Response Time
other smaller packets.
The situation where performance was not generally improved was in the FTP files
upload. In this case, the frames were often maximal in size and therefore were unable to
benefit from aggregation. Because competing stations were able to aggregate, those other
stations generally sent larger quantities of data when it was their turn to transmit which
increased the station’s waiting time. For this reason, Figure 7.26 illustrates an example of
a traffic stream that did not benefit from packet aggregation. These results were consistent
with those observed in Section 7.4 which considered a PCF-based WLAN office network with
multiple types of competing data streams.
7.8 Summary
AGG-MAC provided a more efficient use of WLAN capacity. Section 7.1 verified
the correct operation of the AGG-MAC protocol and its associated simulation model while
Section 7.2 validated the model’s operation within the context of both the network and
the protocol stack. We demonstrated that when sufficient traffic was offered, AGG-MAC
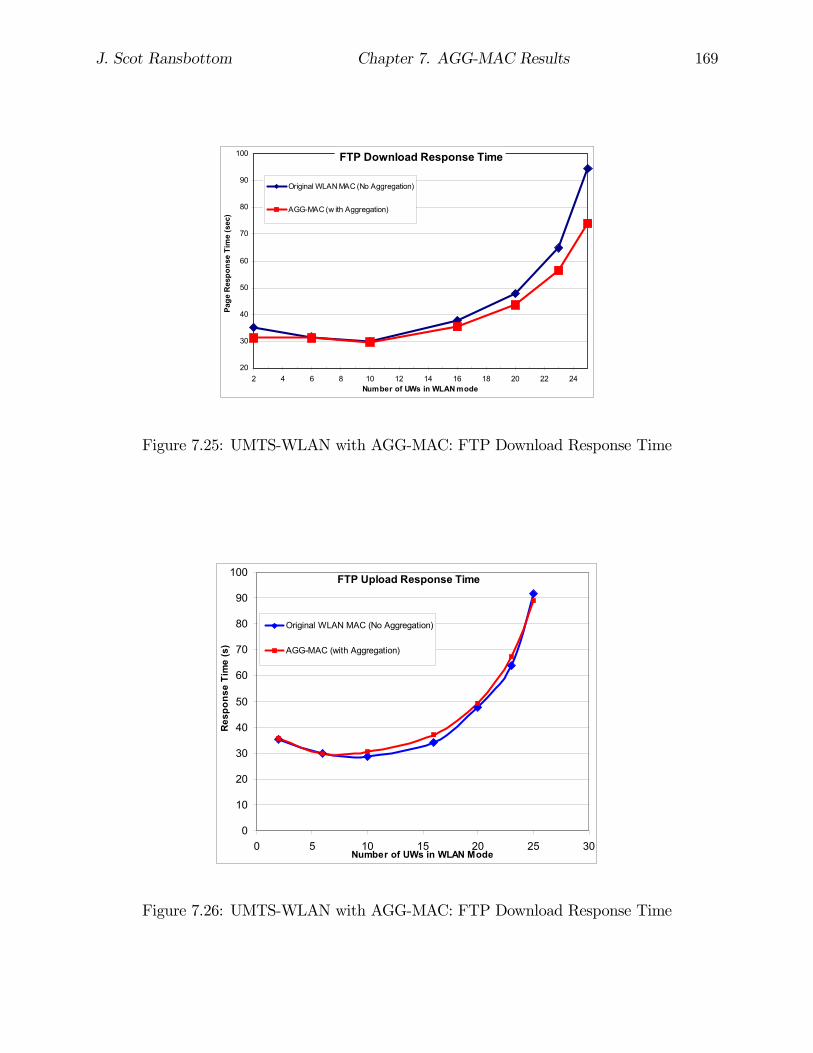
J. Scot Ransbottom Chapter 7. AGG-MAC Results 169
FTP Download Response Time
20
30
40
50
60
70
80
90
100
2 4 6 8 10 12 14 16 18 20 22 24Number of UWs in WLAN mode
Page
Res
pons
e Ti
me
(sec
)
Original WLAN MAC (No Aggregation)
AGG-MAC (w ith Aggregation)
Figure 7.25: UMTS-WLAN with AGG-MAC: FTP Download Response Time
FTP Upload Response Time
0
10
20
30
40
50
60
70
80
90
100
0 5 10 15 20 25 30Number of UWs in WLAN Mode
Res
pons
e Ti
me
(s)
Original WLAN MAC (No Aggregation)
AGG-MAC (with Aggregation)
Figure 7.26: UMTS-WLAN with AGG-MAC: FTP Download Response Time

J. Scot Ransbottom Chapter 7. AGG-MAC Results 170
systems could achieve 90% of the advertised capacity throughout the range of frame sizes
compared to only 11% achievable for small frame sizes, 32B, for the original WLAN MAC.
Furthermore, end-to-end delay was as much as 0.777s on the original system and varied
significantly for different frame sizes; but on the AGG-MAC system, for a range of frame
sizes from 32B to 2, 304B, the end-to-end delay remained within the range of 0.101s - 0.144s.
This result indicated not only lower delays, but also limited delay variation or jitter which
was particularly important to interactive or real-time systems.
The effects of noise on the system was examined in Section 7.3. On the original
WLAN MAC, our simulation results were consistent with those published in [33]. We
observed that for both the original and the AGG-MAC enhanced systems, BERs of 10−5
or better benefitted from maximal frame sizes. For BERs of 10−4 or lower, frames larger
than the optimal size reduced achievable performance as did frames smaller than optimal
size, but the performance of the system improved using AGG-MAC with an appropriately
chosen fragmentation threshold The shape of the curve seemed to be influenced more by the
amount of errors and by the burstiness of those errors than by contention from competing
stations.
We additionally demonstrated the benefits of AGG-MAC in both infrastructure and
ad hoc networks. Our infrastructure mode simulations illustrated a situation where AGG-
MAC improved performance more dramatically than a proposed prioritization scheme pro-
viding dedicated PCF communications opportunities for voice traffic. AGG-MAC improved
the original, problematic, pure-DCF system by 60% for end-to-end delay and by 80% for
delay variation or jitter. Furthermore, AGG-MAC even improved on the original proposed
solution of using dedicated PCF opportunities by 30% and 27% respectively. We confirmed
similar results for a number of DCF implementations, to include multi-cast based systems in
the US Army’s Land Warrior WLAN system. The Land Warrior evaluations demonstrated
the utility of AGG-MAC for ad hoc network systems and for a very lightly loaded system,
provided a potential improvement in achievable capacity of 7.9%.

J. Scot Ransbottom Chapter 7. AGG-MAC Results 171
The SIGCOMM’01 simulations were based upon live collected data and yielded a
32.1% improvement for email download response time, a 27.4% reduction for HTTP Page
response time and a 21.7% reduction for FTP download response time. From this trace data,
we observed that the size of almost all of the frames on this network were less than 576B.
This provided significant support to the potential for derived benefit from the AGG-MAC
approach.
Our final results in this section sought to assess the performance of AGG-MAC when
employed in an interworked UMTS-WLAN network. These results produced as much as
a 14% reduction in the Email response time, up to a 22% reduction in the HTTP Page
response time, and a 10.9% improvement in the FTP download response time.
Because WLAN was a shared channel, the impact of such improvements generally
provided better performance not only to the user who implemented the change, but to all
users on the system. We observed that AGG-MAC protocol generally rewarded data streams
that did not overuse the shared channel and yielded slightly lower performance for those data
streams that consumed significant resources on a high demand channel. While additional
developmental testing to include prototype evaluation systems should be considered, our
results were quite favorable.
Packet level aggregation, especially in the context of PCF-based WLAN, yielded con-
siderable performance improvement provided appropriate value for fragmentation_threshold
was set for the existing channel conditions. If the fragmentation_threshold was too high,
then AGG-MACmay increase the probability of frame error be generating larger frames, and
actually degrade system performance. While it was possible to create a monitor capable of
dynamically controlling the fragmentation_threshold, it was beyond the scope of our current
research effort.

Chapter 8
Conclusions
The wireless communications industries experienced significant growth over the past
decade. Cellular communication devices and wireless LAN systems have become so perva-
sive that they are considered commonplace in most households in North America. While
a number of scheduled UMTS system fieldings had been delayed due to economic factors,
systems were available at the time of this publication and more were programmed for imple-
mentation. Despite the economic factors, the proliferation of WLAN systems experienced
near phenomenal growth in both the US and in Europe. WLAN "hotspots" were widely
available. While WLAN capacities are marketed as 11Mbps and 54Mbps in current systems,
this level of performance is generally not reached in practice. Means to improve the perfor-
mance of WLAN systems under various conditions and constraints was an ongoing research
issue. At the time of this publication, systems supporting 3G cellular and WLAN access
mechanisms were based upon Mobile IP. Mobile IP-based systems would be considered
loosely-coupled systems and are not capable of supporting all of the levels of interoperability
defined for an interworked UMTS-WLAN system as defined by the 3GPP, see Section 3.1.1.
Research is ongoing to fully define the standard implementation of a tightly-coupled UMTS-
WLAN interworked system. Our research effort in this integration sought to produce a
viable UMTS-WLAN interworking model and simulation framework for evaluating future
172

J. Scot Ransbottom Chapter 8. Conclusions 173
systems. We additionally sought to improve the performance of the WLAN portion of this
interworked system.
8.1 Significant Results
The primary contributions of this research were two-fold. The first contribution was
the design and implementation in OPNETTM of a network level simulation tool to support
future research in tightly-coupled interworked system consisting of WLAN "hot spots" and
UMTS cellular systems. The second significant contribution was the design, implementation
and testing of AGG-MAC, a WLAN MAC layer protocol enhancement designed to improve
performance for a broad range of wireless LAN configurations and traffic patterns. The
UMTS-WLAN interworked system was described in Section 4 and the design of the WLAN
enhancement, AGG-MAC, was presented in Section 6.
Simulation was the primary tool used to implement and test each of these mechanisms.
The simulation was validated using analytic mechanisms for a baseline implementation using
deterministic and exponential traffic sources, as described for AGG-MAC in Section 7.2. For
each of the two primary portions of this research, simulations were conducted to assess the
performance and evaluate the suitability of the proposed system under consideration in order
to address the research questions posed in Section 1.4. A summary of significant results for
each of those questions is presented below.
8.2 UMTS-WLAN System Significant Results
The initial phase of work focused on the design, implementation and testing of a
tightly-coupled network-level system designed to provide WLAN "hot spots" interworked
with 3G cellular mobile communications system, specifically UMTS networks. The resultant
J. Scot Ransbottom Chapter 8. Conclusions 174
network level simulation tools provided a foundation for future research into the issues and
trade-offs associated with protocol design and parameterization in this type of system.
The 3rd Generation Partnership Project (3GPP) was one of the primary sources of
standardization efforts for 3G cellular systems. Much of their work focused on the con-
vergence of voice and data communications. WLAN is capable of providing significantly
higher capacity for indoor environments albeit is of limited range. For this reason, the
3GPP Services and Systems Aspects (SA1) published a feasibility study and further sought
to develop standards for the interworking of 3GPP systems with WLAN systems [7]. Their
study identified six scenarios ranging in amount of interoperability between the two systems.
These scenarios are presented in Section 3.1.1. We sought to provide a robust network level
simulation environment capable of supporting future research on UMTS-WLAN interworked
systems.
8.2.1 Benefits to a tightly-coupled UMTS-WLAN interworked sys-
tem
The benefits associated with a UMTS-WLAN interworked system were demonstrated
in Section 5.3. The intent of Section 5.3 was to demonstrate the benefits of the interworked
UMTS-WLAN system as compared to the existing UMTS system. Specifically, this scenario
demonstrated the conservation of limited dedicated cellular channels by shifting data users to
the WLAN access network. It also demonstrated the significant improvement in application
response time of the interworked UMTS-WLAN system as a result of the larger WLAN
channel.
Since the primary motivation for integrating WLAN into the UMTS system was to
free limited resources while continuing to provide service, the number of reserved dedicated
channels (DCH) in the Node-B was examined. Because of the importance of voice channels,
dedicated channels were considered to be the finite, limiting resource in the UMTS network.

J. Scot Ransbottom Chapter 8. Conclusions 175
The interworking UMTS-WLAN experiment was conducted using twenty wireless
client data users running a mix of client applications; specifically the mix of Web, E-mail
and FTP applications (Wireless_Client application profile) discussed in Section 4.7. The
baseline system consisted of twenty UW nodes operating in a UMTS cell. Sixteen of these
clients were operating within 300m of the UWLAN_AP, and the other five were not within
the range of the WLAN access network. The simulation was first run with the Client Access
Mode set to UMTS for all 20 clients. The Client Access Mode was then toggled to WLAN
for the sixteen clients that were in range of the WLAN access network and the results were
compared.
Based on the quality of service requirements for the data session, the UMTS allocates
one or more DCH channels to support a user session. It can be observed from Figure 5.4
that reducing the number of contenders for service from twenty to four reduced the average
number of DCH channels in use by approximately 65%. It is possible to reallocate these
unused DCH channels to voice services or to additional packet data services. Thus, it can
be asserted that a service provider could use these unused resources to generate additional
revenue.
Beyond these basic performance metrics, the simulation platform provides a founda-
tion for development of protocols to leverage a shared packet network, an alternative path
to migrate to an all IP network, and the potential for service differentiation throughout the
core network.
8.2.2 UMTS-WLAN System Performance
The first issue to consider in the performance of our proposed system was its ability to
perform as intended. Because we proposed a new and novel system approach based upon the
integration of aWLANAP and a 3GRNC as the coupling point, we first had to ensure proper
operation. The design considerations, rationale and decisions were presented in Section 4.
J. Scot Ransbottom Chapter 8. Conclusions 176
Verification and validation of the protocols and models was discussed in Section 5.2. The
performance of the UMTS-WLAN interworked systemwas more fully covered in [8] which was
derived from this research effort. The jointly conducted significant results were also presented
in Sections 5.2 and 5.3 herein. The design of the performance testing was conducted jointly
and involves comparison of the interworked UMTS-WLAN system and both baseline UMTS
and baseline WLAN networks. The potential performance improvements over pure UMTS
continued to fuel efforts to identify best practices and appropriate configurations to enhance
consumer interest in such systems. While systems were being commercially fielded, the
absence of a key application for which this feature becomes critical was limiting the adoption
and growth of integrated UMTS-WLAN systems.
The UMTS-WLAN interworked simulation environment provided a rich framework
in which to conduct future research. The two systems to be interworked each provided mu-
tually supportive benefits and should be combined to improve performance for a wide range
of situations. The information gained from understanding the issues with a tightly-coupled
system are beneficial in any interworked system to include loosely-coupled using technologies
such as mobile IP. A service provider could gain competitive advantage through the addi-
tional capabilities offered in a tightly-coupled environment. The UMTS-WLAN framework
provides a foundation for conducting additional research in order to better understand the
benefits and trade-offs associated with a range of interworked system configurations.
8.3 AGG-MAC Protocol Enhancement Significant Re-
sults
The second phase of this work was the design of AGG-MAC, a WLAN MAC layer
protocol designed to significantly improve throughput and reduce latency for data traffic
consisting of packets of less than maximal size. The identification of the bottleneck associated

J. Scot Ransbottom Chapter 8. Conclusions 177
with the transmission of small frame sizes and its severity was identified as the result of
UMTS-WLAN interworked system simulations. The utility of AGG-MAC is not restricted
to interworked UMTS-WLAN systems or even to infrastructure based systems. We have
demonstrated that AGG-MAC can benefit quite a wide range of WLAN configurations.
8.3.1 Design of the WLAN Packet Aggregation MAC protocol
(AGG-MAC)
The design of the protocol was discussed in Section 6.1. AGG-MAC does not adhere
to the traditional MAC-layer protocol paradigm of handling exactly one packet per frame.
We made a conscious design decision to relax this requirement while ensuring transparency
and compatibility with the layers above and below the MAC in the protocol stack. We also
wanted to ensure that the transmitted frame and transmission parameters did not interfere
with and could communicate with the existing, legacy WLAN systems. The basic design
choices for the implementation consist of the three questions below. Refer to Section 6.1 for
discussion of the options, rationale, and design choices made in our implementation. Any
or all of these three design options could be pursued for further research.
• When to perform aggregation operation
• What is the upper limit for aggregate frame size
• Which packets selected as candidates for aggregation
8.3.2 Baseline Performance
In order to evaluate baseline performance for our AGG-MAC enhanced system, we
considered the most basic possible WLAN network. We employed a single transmitter and
a single receiver operating on an error-free channel. In the baseline system, we evaluated

J. Scot Ransbottom Chapter 8. Conclusions 178
the performance using a deterministic and an exponential source. In each of these cases,
the results were compared to analytically derived results, see Section 7.1. Validation of the
model included demonstration that the AGG-MAC protocol could potentially achieve 90%
of the stated network capacity whereas for small frames, 32B, the original system would
be limited to not more than 11% of the system capacity. We further illustrated that the
end-to-end delay and the delay variation or jitter would both be significantly improved with
the AGG-MAC enhancement.
Because noise on the channel is a significant difference between wired and wireless
network systems, we developed simulations to better understand the effects of noise on
the WLAN system. We considered the original WLAN MAC protocol and our AGG-
MAC protocol enhancement. Our simulations for the original system served to further
validate the simulation implementation. Our results were compared with analytical and
laboratory measured results as published in [33]. Our results were consistent. From
these simulations, we observed that low BER conditions strongly favored larger frame sizes.
While higher BERs, 10−4 or worse, favored limiting the frame size. Our results indicated
that the characteristics of the noise on the channel was the determining factor in determining
the appropriate value for the maximum frame size, fragmentation_threshold, and a poorly
chosen frame size can severely reduce, potentially to nothing, the achievable throughput on
the channel. Multiple competing stations reduced the achievable throughput on a channel,
but their effect was one of scaling the results rather than changing the characteristics of the
performance curve, Section 7.3.2.
8.3.3 AGG-MAC Performance Over a Range of Scenarios
We simulated the AGG-MAC protocol over a range of diverse network configurations.
The results are presented throughout Chapter 7. AGG-MAC demonstrated the potential
to improve overall system performance as well as individual client performance. Perfor-

J. Scot Ransbottom Chapter 8. Conclusions 179
mance metrics considered, described in Section 6.3, were throughput, end-to-end delay, data
dropped, voice packet delay variation (jitter), application response time, and the amount of
aggregation.
Our simulations demonstrated example configurations in which the AGG-MAC proto-
col enhancement can benefit real-time, interactive, voice data. The results of our simulation
reduced the end-to-end delay from 0.06s to less than 0.02s, a 60% improvement. Delay
variation or jitter was reduced from 0.017s to 0.002s, nearly an order of magnitude im-
provement. These simulations also identified a property of this approach to provide greater
improvement to smaller packets while providing less benefit to larger packet sizes; a desir-
able trait in many QoS systems. In our SIGCOMM’01 trace data, we observed that over
97% of the packets transmitted on the network were smaller than 576B in size and therefore
could benefit significantly from the AGG-MAC approach. This observation was the result
of over 1GB of data collected over three days from 195 distinct users employing their own
equipment and communicating with several thousand distinct distant host machines. The
SIGCOMM’01 and the Land Warrior results were derived from live trace data rather than
purely statistically generated traffic. The Land Warrior system, while of limited statistical
significance demonstrated the utility of AGG-MAC in a distributed, ad hoc environment
where the traffic load was severely limited. The SIGCOMM’01 data was statistically much
more robust and it provided a real example of an infrastructure network with a wide range of
clients, similar to a public "hotspot." The SIGCOMM’01 data rates were higher, generally
loading the AP at approximately 20% - 25%. Due to the reduction in the number of bytes
transmitted because of both protocol retransmissions and from reduction in the total number
of bytes of frame overhead, the load on the SIGCOMM’01 AP was reduced from 3.2 Mbps
to 2.27 Mbps while application response times for the range of applications was improved.
This is an example of accomplishing more while consuming less resources, specifically 25.3%
less resources. The bandwidth saved could be used to support additional users.

J. Scot Ransbottom Chapter 8. Conclusions 180
8.3.4 AGG-MAC Performance Incorporated in a UMTS-WLAN
System
We evaluated AGG-MAC within the context of a UMTS-WLAN interworked system
and the results were promising. This research effort provided additional information available
for consideration of future 3G and WLAN systems. At the time of this publication, the
biggest drawback in the employment of AGG-MAC seemed to be a reluctance to permit the
MAC layer protocol to operate on more than one packet at a time. The general rationale
seemed to be reluctance to change commonly accepted paradigms rather than technological
issues.
Our evaluation of the performance of AGG-MAC within the context of a tightly cou-
pled, heterogeneous, combined 3G cellular (UMTS) andWLAN system [7][36] were presented
in Section 7.7. These simulations yielded improvements to the applications with as much
as a 14% reduction in the Email response time, up to a 22% reduction in the HTTP Page
response time, and a 10.9% improvement in the FTP download response time. Although
these traffic patterns were designed for and optimized for a UMTS client using a dedicated
32kbps circuit, we illustrated the potential for AGG-MAC to provide increased performance
on such a client communicating with a WLAN "hotspot". These improvements could al-
low the "hotspot" to support a greater number of users and therefore increase the earning
potential of the service provider while additionally providing better service to the user.
8.4 Recommendations for Future Research
This research effort has successfully developed a feasible initial architecture and resul-
tant simulation framework to further evaluate a tightly-coupled integrated 3G cellular and
WLAN networking system. We have also developed an enhancement to the WLAN MAC
layer protocol, AGG-MAC, capable of providing measurable performance enhancements for

J. Scot Ransbottom Chapter 8. Conclusions 181
a wide range of situations. In each case, there are several aspects of this work which offer
the potential for meaningful future research.
8.4.1 Loose Coupled Design
The simulation environment could be expanded by creating UW and UWLAN_AP
node models to implement a loosely-coupled design. The future trend for 3G and 4G wireless
systems is for the network between the Node-B and CN to evolve into an all-IP based
architecture. This would allow service providers to provide data services at various locations
in the network without all of the data traffic flowing through the GGSN. A loose-coupled
implementation would provide the necessary simulation environment to study the signaling
protocol effects of an all-IP network. The loosely coupled design would integrate the two
systems at the IP layer. Both the control and data traffic would be routed over the IP
network. The ability of IP protocols, such as Mobile IP, to handle mobility and roaming
between the access networks would also need to be studied. This would allow more direct
and meaningful comparison between the two approaches to further define strengths and
weaknesses.
8.4.2 QoS or Alternative Queuing over the WLAN Access Net-
work
The simulation environment could be expanded to study QoS mechanisms over the
WLAN access network. While the current simulation environment and 3GPP standards
provide inherent support for quality of service over the UMTS access network, the simulated
WLAN access network and 802.X standards do not provide these QoS mechanisms. WLAN
does not distinguish between data streams of differing QoS. The current Internet service
model supports only best-effort traffic. Therefore, as UMTS networks are deployed there
J. Scot Ransbottom Chapter 8. Conclusions 182
may initially be little incentive to support different QoS levels for data traffic. However, as
both IP QoS and the 3G wireless networks develop there will be increasing requirements to
support data traffic with different QoS requirements. For WLAN to be a viable alternate
access network it will also have to provide inherent support for QoS. The OPNETTM ap-
plication model set provides the necessary hooks to support QoS. Different QoS scheduling
mechanisms could be studied within the framework of the UMTS-WLAN simulation envi-
ronment. The model could be used to explore management, overhead, and scheduling and
control issues to support QoS. It could also be used to study how the PCF
As identified in Section 6.1.3, our research effort implemented a single FIFO queue
for packets received from the higher level for processing. Multiple queues could easily be
implemented to facilitate either a QoS approach, or many other alternatives. The control
traffic could be prioritized, as could potentially routing or security protocol packets. In
addition to considering strictly prioritization as the reason to use a more advanced queuing
mechanism, one could employ either logically or physically multiple queues to each address,
or could sort queues based on packet size in order to increase the probability of finding a
packet suitable to aggregrate. Each of these approaches would need to be considered in the
context of their interaction with higher level protocols and with their impact on both the
local and other nodes in the network. (point coordination function) in the WLAN access
point can be leveraged to support multiple clients each with different data streams and mixes
of QoS requirements.
8.4.3 Adaptive Fragmentation Threshold
The selection of appropriate value for the fragmentation threshold has been identified
throughout this work. It was originally discussed here in Section 3.2.2 from the original
document [33]. Although we have demonstrated the utility of finding the right fragmentation
threshold, the value is still defined as a static value in the IEEE 802.11 series of standards
J. Scot Ransbottom Chapter 8. Conclusions 183
and proposed standards. A fragmentation threshold that dynamically adjusts to changing
channel conditions would have significant impact on noisy channels, see Section 7.3. AGG-
MAC was designed to support a dynamic fragmentation threshold and would benefit from
such an advancement.
8.5 Summary
This chapter presented conclusions based upon research results and recommended
future areas of research. The goal of this research was to, first, design and implement
a framework suitable for evaluation of mechanisms necessary to realize a tightly-coupled,
UMTS-WLAN interworked network system; second, to implement a WLAN MAC-layer pro-
tocol enhancement capable of mitigating the costly per frame overhead per unit of user data
associated with sequences of small packets. The results demonstrated that the research goals
were achieved. The UMTS-WLAN system configuration is viable and the existing simu-
lation framework provides a platform for future research issues. The AGG-MAC WLAN
protocol enhancement provides a mechanism to aggregate suboptimal size packets into a
larger frame in order to amortize the per frame overheads associated with a WLAN chan-
nel. We demonstrated the suitability of such a system for a variety of both theoretical and
actual situations. The results of this research effort could be expanded by further protocol
development in UMTS-WLAN interworked systems.

References
[1] Stephanie Demers, “UMTS model overview and performance,” OPNETWORK 2001,
August 2001.
[2] 3G TS 23.060, “General Packet Radio Service (GPRS); service description; stage 2
release 1999,” Tech. Rep. 3.13.0, 3GPP, November 2002.
[3] IEEE, “IEEE standards for information technology — telecommunications and infor-
mation exchange between systems — local and metropolitan area network — specific
requirements — part 11: Wireless LAN medium access control (MAC) and physical
layer (PHY) specifications,” 1999.
[4] Charles E. Perkins, “IP mobility support,” Tech. Rep. RFC 2002, IETF, October 1996.
[5] Paramvir Bahl Anand Balachandran, Geoffrey M. Voelker and P. Venkat Rangan,
“Characterizing user behavior and network performance in a public wireless LAN,”
in ACM SIGMETRICS’02, ACM, Ed., Marina Del Ray, 2002, ACM.
[6] Christophe Lerouge Johan De Vriendt, Philippe Laine and Xiaofeng Xu, “Mobile net-
work evolution: A revolution on the move,” IEEE Communications Magazine, vol. 40,
no. 4, pp. 104—111, April 2002.
[7] “Feasbility study on 3GPP system to wireless local area network (WLAN) interwork-
ing,” Tech. Rep. (Release 6), version 1.0.0, 3rd Generation Partnership Project, Febru-
ary 2002.
184

J. Scot Ransbottom. References 185
[8] Tracy L. Mann, “A network system level simulator for investigating the interworking of
wireless LAN and 3G mobile systems,” M.S. thesis, Virginia Polytechnic Institute and
State University, 2003.
[9] Lauri Laitinen Siamak Naghian Heikki Kaaranen, Ari Ahtiainen and Valtteri Niemi,
UMTS Networks: Architecture, Mobility and Services, John Wiley and Sons, Ltd.,
West Sussex, PO19 1UD, England, 2001.
[10] Theodore S. Rappaport, Wireless Communications: Principle and Practice, Second
Edition, Prentice Hall, Upper Saddle River, NJ, 2002.
[11] Richard E. Howard John Freidenfelds Reinaldo A. Valenzuela George I. Zysman, Joseph
A. Tarallo and Paul M. Mankiewich, “Techonology evolution for mobile and personal
communications,” Bell Labs Technical Journal, vol. 5, no. vol. 5, no. 1, pp. 107—129,
January-March 2000.
[12] Jain Cai and David J. Goodman, “General Packet Radio Service in GSM,” IEEE
Communications Magazine, vol. 35, no. 10, pp. 122—131, October 1997.
[13] Wener Mohr Prodip Chaudhury and Seizo Onoe, “The 3GPP proposal for IMT-2000,”
IEEE Communications Magazine, vol. 35, no. 12, pp. 72—81, December 1999.
[14] Tero Ojanpera and Ramjee Prasad, “An overview of third-generation wireless personal
communications: A European perspective,” IEEE Personal Communications Magazine,
vol. 5, no. 6, pp. 59—65, December 1998.
[15] ITU-T, “Recommendation 1.361: "b-ISDN layer specification",” Tech. Rep., ITU.
[16] ITU-T, “Recommendation i.361.5: "b-ISDN ATM adaptation layer spcification: Type
5 AAL",” Tech. Rep.
[17] Jochen Schiller, Mobile Communications, Addison-Wesley, 2000.

J. Scot Ransbottom. References 186
[18] J. Fakatselis, “802.11e draft standard d1.0 letter ballot 27 comments, general,” IEEE
802.11-01/267r3, dated 5 October 2001, October 2001.
[19] Charles E. Perkins, “Mobile IP,” IEEE Communications Magazine, vol. 35, no. 5, pp.
84—99, May 1997.
[20] Charles E. Perkins, “Mobile IP,” IEEE Communications Magazine, 50th Anniversary
Commemorative Issue, May 2002.
[21] D. Johnson and C. Perkins, “Mobility support in IPv6 (work in progress),” Tech. Rep.
draft-ietf-mobileip-ipv6-15.txt, IETF, October 2001.
[22] Harry R. Worstell, “Minutes of p802.11 task group e interim teleconferences QoS base-
line development,” October 2000, dated 11 October 2000.
[23] IEEE, “Wireless LAN medium access control (MAC) and physical layer (PHY) speci-
fications: Quality of service,” 2002, DRAFT 2002.
[24] 3rd Generation Partnership Project (3GPP), “UTRAN overall description,” Tech. Rep.
25.401, 3rd Generation Partnership Project, 1999.
[25] Information Society Technologies, “WINE GLASS: Wireless IP network as a generic
platform for location aware service support,” Tech. Rep. IST-1999-10699WINEGLASS,
Information Society Technologies, 2000.
[26] ETSI BRAN, “ETSI BRAN,” On-line http://portal.etsi.org/bran/home.asp.
[27] Shaio-Li Tsao and Chia-Ching Lin, “Design and evaluation of UMTS-WLAN inter-
working strategies,” IEEE Vehicular Technology Conference, vol. 2, pp. 777—781, 2002.
[28] IEEE, “Supplement to 802.11-1999, wireless LANMAC and PHY specifications: Higher
speed physical layer (PHY) extension in the 2.4 GHz band,” 1999.

J. Scot Ransbottom. References 187
[29] IEEE, “Supplement to 802.11-1999, wireless LAN medium access control (MAC) and
physical layer (PHY) specifications: High-speed physical layer extension in the 5 GHz
band,” 1999.
[30] Hari Balakrishnan, Venkata N. Padmanabhan, Srinivasan Seshan, and Randy H. Katz,
“A comparison of mechanisms for improving TCP performance over wireless links,”
IEEE/ACM Transactions on Networking, vol. 5, no. 6, pp. 756—769, 1997.
[31] Keping Long Shiduan Cheng Haitao Wu, Yong Peng and Jian Ma, “Performance of
reliable transport protocol over IEEE 802.11 wireless LAN: Analysis and enhancement,”
Proceedings of the IEEE INFOCOM 2002, June 2002.
[32] L. Fratta G. Bianchi and M. Oliveri, “Performance evaluation and enhancement of
the CSMA/CA MAC protocol for 802.11 wireless LANs,” in Proceedings of PIMRC,
October 1996.
[33] Paul Lettieri and Mani B. Srivastava, “Adaptive frame length control for improving
wireless link throughput, range and energy efficiency,” in INFOCOM (2), March 1998,
pp. 564—571.
[34] I. Chlamtac, A. Faragó, A. D. Myers, V. R. Syrotiuk, and G. Záruba, “Adapt: a
dynamically self-adjusting media access control protocol for ad hoc-networks,” in Global
Telecommunications Conference, 1999. GLOBECOM ’99, December 1999, pp. 11—15.
[35] Jean Tourrilhes, “Packet frame grouping : Improving IP multimedia performance over
CSMA/CA,” in ICUPC ‘98, 1998.
[36] Tracey L. Mann J. Scot Ransbottom and IV Nathaniel J Davis, “Evaluation of signaling
mechanisms to incorporate wireless LAN "hotspots" into 3G/4G mobile systems,” in
OPNETWORK 2002, Washington, DC, 2002, OPNET.
[37] Raj Jain, The Art of Computer Systems Performance Analysis: Techniques for Exper-
imental Design, Measurement, Simulation, and Modeling, Wiley, New York, 1991.
J. Scot Ransbottom. References 188
[38] Inc. OPNET Technologies, UMTS Model Usage Guide, OPNET, Bethesda, MD, Sep-
tember 2002.
[39] Lucent Technologies, “Lucent technologies successfully demonstrates seamless roaming
between WIFI and 3G UMTS wireless networks,” September 2002.
[40] Inc. OPNET Technologies, OPNET Methodologies Guide: Standard Network Applica-
tions, OPNET, Bethesda, MD, July 2001.
[41] Inc. OPNET Technologies, Wireless LAN Model Description, OPNET, Bethesda, MD,
November 2000.
[42] F. Calì, M. Conti, and E. Gregori, “IEEE 802.11 Wireless LAN: Capacity analysis and
protocol enhancement,” in Proceedings of the Conference on Computer Communications
(IEEE Infocom). IEEE, March/April 1998, p. 142.
[43] Robert M. Metcalfe and David R. Boggs, “Ethernet: Distributed packet switching for
local computer networks,” Communications of the ACM, vol. 19, no. 5, pp. 395—404,
July 1976.
[44] W. Willinger W. E. Leland, M. S. Taqqu and D. V. Wilson, “On the self-similar nature
of ethernet traffic (extended version),” IEEE/ACM Transactions on Networking (ToN),
vol. 2, no. 1, pp. 1—15, February 1994.
[45] Sally Floyd and Vern Paxson, “Difficulties in simulating the internet,” IEEE/ACM
Transactions on Networking, vol. 9, no. 4, pp. 392—403, February 2001.
[46] C. A. Kent and J. C. Mogul, “Fragmentation considered harmful,” WRL Technical
Report 87/3, 1987.
[47] J. Postel and J. Reynolds, “RFC-1042: A standard for the transmission of IP datagrams
over IEEE 802 networks,” 1988.
J. Scot Ransbottom. References 189
[48] Piyush Gupta and P. R. Kumar, “The capacity of wireless networks,” IEEE Transac-
tions on Information Theory, vol. 46, no. 2, pp. 388—404, March 2000.
[49] OPNET Technologies, "Maximizing Performance of Wireless LANs", Tutorial 1332,
OPNETZ Technologies,l2002, OPNETWORK 2002, August 2002.
[50] PM Soldier, “Land warrior operational requirements document,” Tech. Rep. Technical
Report, U.S. Army Training and Doctrine Command, Ft. Benning, GA, August 1999.
[51] D.C. Wong M.J. Zieniewicz, D.C. Johnson and J.D. Flatt, “The evolution of army
wearable computers,” Pervasive Computing, October/November 2002.

Appendix A
Simulation Data Tables
Table A.1: FTP Download Response Time vs. FTP Filesize (1UE vs. 1UW)1 UMTS UEFTP Filesize 1B 50KB 100KB 200KB 500KB 700KB 900KB 1MB 1.5MB 1.8MB 2MB 3MBSeed 1 1.252 21.943 37.783 66.343 182.963 238.849 390.563 370.063 533.349 653.749 724.449 1053.533Seed 2 1.252 37.369 38.849 61.249 179.069 250.249 344.869 360.849 538.449 646.435 731.235 1071.933Seed 3 1.253 47.949 38.649 73.249 179.849 252.533 323.049 364.249 561.335 630.633 716.333 1063.932Seed 4 1.253 27.249 37.749 70.855 176.855 259.273 326.749 363.055 556.533 665.433 711.533 1082.632Seed 5 1.253 27.835 39.735 77.273 178.653 249.252 324.735 368.733 554.533 651.749 743.053 1061.932Mean: 1.253 32.469 38.553 69.794 179.478 250.031 341.993 365.390 548.840 649.600 725.321 1066.79295% CI: 1.252 19.700 37.527 62.093 176.701 240.880 306.571 360.566 533.690 633.868 709.851 1053.123
1.253 45.238 39.579 77.495 182.255 259.183 377.415 370.214 563.989 665.331 740.790 1080.462
1 UW (WLAN Mode)FTP Filesize 1B 100KB 250KB 800KB 1.5MB 4MB 7MB 12MB 15MB 20MB 30MB 40MBSeed 1 0.195 1.178 2.358 6.338 11.718 30.278 52.458 89.958 112.518 149.798 223.938 298.058Seed 2 0.189 1.191 2.171 6.351 11.731 30.291 52.471 89.971 112.531 149.831 223.931 298.071Seed 3 0.184 1.204 2.184 6.364 11.744 30.369 52.484 89.784 112.409 149.624 223.744 297.884Seed 4 0.191 1.069 2.249 6.429 11.609 30.304 52.549 89.849 112.344 149.715 223.855 297.955Seed 5 0.198 1.095 2.275 6.455 11.635 30.395 52.575 89.875 112.435 149.689 223.809 297.949Mean: 0.191 1.147 2.247 6.387 11.687 30.327 52.507 89.887 112.447 149.731 223.855 297.98395% CI: 0.184 1.071 2.153 6.323 11.611 30.263 52.443 89.790 112.350 149.627 223.753 297.885
0.198 1.223 2.341 6.451 11.763 30.391 52.571 89.984 112.544 149.835 223.957 298.081
FTP Download Response Time (sec) vs FTP Filesize
190

J. Scot Ransbottom Appendix A. Simulation Data Tables 191
Table A.2: SIGCOMM 2001 AGG-MAC Performance Results
Original AGG-MAC Original AGG-MAC Original AGG-MAC Original AGG-MAC Original AGG-MACSeed 1 2890.753 4190.187 1 3.5000 0.1073 0.0917 0.2402 0.1024 0.4261 0.3848Seed 2 1740.220 1503.707 1 3.5000 0.1170 0.0522 0.0890 0.1385 0.1929 0.2874Seed 3 4273.840 3025.453 1 3.7143 0.1240 0.0744 0.1752 0.1079 0.3066Seed 4 3451.787 1598.787 1 3.3333 0.1088 0.0725 0.1881 0.1374 0.1735Seed 5 2871.507 1050.220 1 2.1111 0.0767 0.0716 0.1110 0.0967 0.4032 0.1814Mean 3045.621 2273.671 1.0000 3.2317 0.1068 0.0725 0.1607 0.1166 0.3407 0.266795% C.I. 1895.696 656.981 1.0000 2.4361 0.0843 0.0551 0.0850 0.0919 0.1812 0.1558
4190.714 3230.428 1.0000 4.0062 0.1292 0.0839 0.2138 0.1393 0.4748 0.3433
FTP Download Response (sec)
WLAN Throughput (bps)
Packets per Frame
Email Download Response (sec)
HTTP Page Response (sec)
Table A.3: WLAN Throughput (bps) vs. Number of ClientsOriginal MAC
Number of UWs in WLAN Mode 2 6 10 16 20 23 25Seed 1 624698.3 1337410 2372332 3931098 5166313 6121838 6803098Seed 2 369216.1 1175165 2629577 4085539 5077751 5922392 7311414Seed 3 400841.7 875810.7 3025562 4818576 5268652 6423834 6966020Seed 4 384531.7 1169035 2847130 4151827 5724907 5713984 6741078Seed 5 1099556 882155.5 2656270 3926646 5174739 6826022 7025860Mean 444822 1139355 2718650 4246760 5309406 6045512 695540395% CI 58876.7 888157.1 2413489 3789099 4991103 5503879 6677830
830767.2 1390553 3023812 4704421 5627709 6587145 7232975
Number of UWs in WLAN Mode 2 6 10 16 20 23 25Seed 1 453047 999017.7 2905132 4295042 4677677 6687835 6789057Seed 2 370907 970794 2631792 4098125 5083766 6463385 6839448Seed 3 457072.6 1068595 2049095 4439709 5236814 5919574 6596546Seed 4 593332.7 1102662 2690511 3806671 5108206 5938991 6919918Seed 5 289193.4 882293.8 3118303 4389574 5683152 5683152 6518607Mean 468589.8 1035267 2569133 4159887 5026616 6252446 678624295% CI 328102 928032.5 2071282 3838933 4578700 5732217 6576663
609077.7 1142502 3066984 4480841 5474532 6772675 6995821
AGG-MAC

J. Scot Ransbottom Appendix A. Simulation Data Tables 192
Table A.4: Email Download Response Time (sec) vs. Number of ClientsOriginal MAC
Number of UWs in WLAN Mode 2 6 10 16 20 23 25Seed 1 1.338187 1.276127 1.273018 1.660419 2.979936 3.06995 4.43885Seed 2 1.247118 1.296025 1.501833 2.007365 3.286699 3.806128 6.0522Seed 3 1.355304 1.347258 1.623578 2.254882 3.149737 2.658883 3.963652Seed 4 1.331513 1.298409 1.400458 1.993467 3.394444 3.373943 4.498285Seed 5 1.284629 1.260143 1.842715 2.181432 2.491643 4.737488 5.194292Mean 1.31135 1.295593 1.52832 2.019513 3.060492 3.529278 4.82945695% CI 1.256 1.255 1.258 1.734 2.621 2.542 3.821
1.367 1.336 1.799 2.305 3.500 4.516 5.838
Number of UWs in WLAN Mode 2 6 10 16 20 23 25Seed 1 1.318933 1.31706 1.421392 1.96496 2.21556 3.214532 4.453271Seed 2 1.313237 1.386206 1.507734 1.87695 2.21556 3.165747 3.621121Seed 3 1.338043 1.319151 1.280306 1.734024 2.343017 3.329029 3.700737Seed 4 1.333889 1.267478 1.323334 2.362701 2.444014 2.640791 3.861176Seed 5 1.318673 1.301968 1.624324 2.398806 2.895512 3.054623 3.728114Mean 1.324555 1.318373 1.431418 2.067488 2.422733 3.080944 3.87288495% CI 1.311 1.265 1.258 1.698 2.074 2.752 3.456
1.338 1.372 1.604 2.437 2.772 3.410 4.290
AGG-MAC

J. Scot Ransbottom Appendix A. Simulation Data Tables 193
Table A.5: HTTP Page Response Time (sec) vs. Number of ClientsOriginal MACNumber of UWs in WLAN Mode 2 6 10 16 20 23 25Seed 1 1.126953 1.088874 1.11312 1.617066 2.893603 2.564647 3.809593Seed 2 1.012171 1.062954 1.319026 1.995069 2.386861 2.520937 3.486958Seed 3 1.051496 1.113623 1.138121 2.170647 2.576208 3.03189 4.752442Seed 4 1.068473 1.072801 1.158159 1.713091 2.099019 2.958858 5.768314Seed 5 1.155275 1.059954 1.182349 1.624993 2.032074 3.871353 4.44427Mean 1.064773 1.084563 1.182107 1.873968 2.488923 2.769083 4.45432795% CI 0.993 1.057 1.082 1.567 2.050 2.095 3.350
1.137 1.112 1.282 2.181 2.928 3.444 5.559
Number of UWs in WLAN Mode 2 6 10 16 20 23 25Seed 1 1.08571 1.055486 1.173096 1.587889 2.063021 2.69573 3.92433Seed 2 1.082376 1.077153 1.041581 1.545024 1.608402 2.82449 3.192896Seed 3 1.098433 1.075701 1.101508 1.584995 2.274205 2.346 3.438289Seed 4 1.148125 1.024209 1.06979 1.524214 1.796345 2.547238 3.072442Seed 5 1.113574 1.101822 1.482568 1.662411 2.300332 2.467062 3.105449Mean 1.103661 1.058137 1.096494 1.560531 1.935494 2.603364 3.40698995% CI 1.070 1.022 0.874 1.495 1.561 2.370 2.968
1.137 1.094 1.319 1.626 2.310 2.837 3.846
AGG-MAC

J. Scot Ransbottom Appendix A. Simulation Data Tables 194
Table A.6: FTP Download Response Time (sec) vs. Number of ClientsOriginal MAC
Number of UWs in WLAN Mode 2 6 10 16 20 23 25Seed 1 37.98518 32.17791 29.60495 39.84076 51.94955 54.58895 72.89831Seed 2 34.44464 32.9196 30.40111 46.13049 49.94332 67.44773 101.9493Seed 3 35.19232 30.28213 30.66728 34.12649 45.90415 76.51637 93.40438Seed 4 33.20475 30.70411 29.43784 34.07965 45.2318 61.05606 109.2755Seed 5 35.2 31.5 29.8975 34.938 45.74584 64.9 94.3Mean 35.20538 31.51675 30.00174 37.82308 47.75493 64.90182 94.3655195% CI 33.028 30.187 29.354 31.340 44.020 54.844 77.462
37.383 32.847 30.649 44.306 51.490 74.959 111.269
Number of UWs in WLAN Mode 2 6 10 16 20 23 25Seed 1 32.32675 32.72118 30.13524 31.09142 41.17497 53.94636 83.38348Seed 2 30.52336 30.92515 29.21571 38.54042 43.73469 51.43869 72.30913Seed 3 36.17891 31.30436 27.85806 35.88355 41.00852 55.88482 70.33524Seed 4 26.05137 30.13165 29.02273 36.59116 43.91356 64.17476 69.89879Seed 5 31.2 31.2 31.7505 34.66156 47.56636 56.3 73.9Mean 31.25608 31.25647 29.59645 35.35362 43.47962 56.34892 73.9653395% CI 26.737 30.091 27.795 31.919 40.173 50.416 67.133
35.775 32.422 31.398 38.788 46.786 62.282 80.798
AGG-MAC

J. Scot Ransbottom Appendix A. Simulation Data Tables 195
Table A.7: FTP Upload Response Time (sec) vs. Number of ClientsOriginal MAC
Number of UWs in WLAN Mode 2 6 10 16 20 23 25Seed 1 31.9483 29.02267 27.48263 32.67273 45.15917 55.25635 106.8355Seed 2 35.47446 28.51647 28.65674 32.24532 47.65609 78.00263 90.37302Seed 3 38.0658 30.38613 28.53809 38.73574 50.31432 69.6465 94.49867Seed 4 35.79855 31.36712 28.9126 32.44519 50.33898 51.70481 74.76741Seed 5 30.7024 30.0102 29.65165 34.49985 44.91267 68.64636 61.79836Mean 34.39791 29.86052 28.64834 34.11976 47.67625 64.65133 91.6186695% CI 30.662 28.462 27.677 30.728 44.390 51.122 69.789
38.134 31.259 29.619 37.512 50.962 78.181 113.448
Number of UWs in WLAN Mode 2 6 10 16 20 23 25Seed 1 34.0256 31.00059 28.74363 38.35409 51.97187 71.72923 96.03442Seed 2 38.5473 30.88335 29.70175 35.75054 46.32221 67.58896 74.97303Seed 3 33.37654 28.63718 31.80237 37.58979 46.52963 65.54268 86.02254Seed 4 36.90343 27.842 29.90335 34.65876 44.91328 63.72706 98.49381Seed 5 33.81959 30.63383 32.10356 38.22709 56.41674 70.08661 116.8579Mean 35.33449 29.79939 30.45093 36.91606 49.23075 67.73491 88.8809595% CI 32.515 27.990 28.659 34.886 43.227 63.694 69.535
38.154 31.609 32.243 38.946 55.234 71.776 108.227
AGG-MAC

J. Scot Ransbottom Appendix A. Simulation Data Tables 196
Table A.8: Amount of Aggregation (packets per frame) vs. Number of ClientsOriginal MAC
Number of UWs in WLAN Mode 2 6 10 16 20 23 25Seed 1 1 1 1 1 1 1 1Seed 2 1 1 1 1 1 1 1Seed 3 1 1 1 1 1 1 1Seed 4 1 1 1 1 1Seed 5 1 1 1 1Mean 1 1 1 1 1 1 195% CI 1 1 1 1 1 1 1
1 1 1 1 1 1 1
Number of UWs in WLAN Mode 2 6 10 16 20 23 25Seed 1 1.175439 1.58209 2.686567 3.507463 4.41791 5.522388 5.925373Seed 2 1.209677 1.671642 2.074627 3.791045 4.283582 5.164179 5.477612Seed 3 1.265625 1.626866 2.597015 3.328358 4.298507 5.208955 5.671642Seed 4 2.850746 3.791045 4.61194 5.149254 6.104478Seed 5 1.153846 1.545455 5.208955 6.074627Mean 1.216914 1.626866 2.552239 3.604478 4.402985 5.261194 5.79477695% CI 1.156397 1.558941 2.135981 3.322045 4.214629 5.069794 5.459708
1.27743 1.69479 2.968496 3.886911 4.591341 5.452594 6.129845
AGG-MAC

Vita
J. Scot Ransbottom is currently serving as a Major in the United States Army Signal
Corps. After receiving the Ph.D. degree in computer engineering from Virginia Polytechnic
Institute and State University (Virginia Tech), he will be assigned as an Assistant Professor
in the Department of Electrical Engineering and Computer Science, United States Military
Academy, West Point, NY. Major Ransbottom received the B.S. degree in electrical engi-
neering from Ohio University in 1988 and the M.S. degree in computer science from Duke
University in 1997. His current research interests include mobile communications networks,
integrating voice and data networks, quality of service, and network simulation. Major
Ransbottom’s publications include:
Ransbottom, J. Scot and Nathaniel J. Davis, IV, ‘IP Packet Aggregation through aPCF Wireless LAN using OPNETTM’, OPNETWORK 2003.
Ransbottom, J. Scot, Tracy Mann, and Nathaniel J. Davis, IV, ‘Evaluation of Sig-naling Mechanisms to Incorporate Wireless LAN “Hotspots” Into 3G/4G Mobile Systems’,OPNETWORK 2002.
Smith, Todd L. and Scot Ransbottom, ‘Digital Video in Education’, book chapterpublished in textbook titled Distance Learning Technologies: Issues, Trends, and Opportu-nities, 2000.
Hamilton, John A., Jeffrey Ransbottom, and Noël J. Davis, ‘An Integrated Approachto Network Simulation’, Proceedings of Advanced Technology Simulation Conference, Mili-tary, Government, and Aerospace Simulation,1999.
Davis, Noël, Scot Ransbottom, and John A. Hamilton, ‘Teaching Computer Network-ing Through Modeling,’ ACM SIGAda Ada Letters, Volume XVIII Issue 5, September 1998,pp. 104-110.
Davis, Noël, Scot Ransbottom, and John A. Hamilton, ‘Teaching Computer Network-
197
J. Scot Ransbottom. Vita 198
ing Through Modeling’ Proceedings of Ada Software Engineering Education and TrainingConference (ASEET), 1998.
Ransbottom, Jeffrey S. ‘DU-Net: An Implementation of User Level Communicationin Digital UNIX’, Master’s Thesis, Duke University, Durham, NC, 1997.