mobile monitoring for site evaluation in vancouver, wa
TRANSCRIPT

Mobile Monitoring for Site Evaluation in Vancouver, WA
NW-AIRQUEST Annual Meeting
Jill Schulte
June 20, 2014

Vancouver Overview
1

Vancouver Monitoring Site
• Neighborhood-scale PM2.5 monitoring
• Thermo Scientific™ 1405F • Tapered Element Oscillating Microbalance (TEOM)™
• Federal Equivalent Method (FEM)
• Installed at 4th Plain Rd. site October 2011
• Moved ~200m northwest to Vancouver Plaza Dr. in August 2013
June 20, 2014
2

Vancouver Sites Map
June 20, 2014
3

Winter PM2.5 by Heating Season
and Location
4

Nearby Monitoring Sites
5

Vancouver/Portland/Beaverton
PM2.5 Comparison
6

Nearby Source Impacts
7
Monitoring site fence
Chimney smoke

Nearby Source Impacts
8
Monitoring site
Residential chimneys (east)

What do you do when you have
neither time nor money?
• Study needs:
• Immediate results
• Only equipment on hand
• Wide spatial coverage
• Minimal temporal variation
…all it takes is a nephelometer, a GPS, two adventurous night-owls, a funnel, and a pair of pantyhose.
June 20, 2014
9
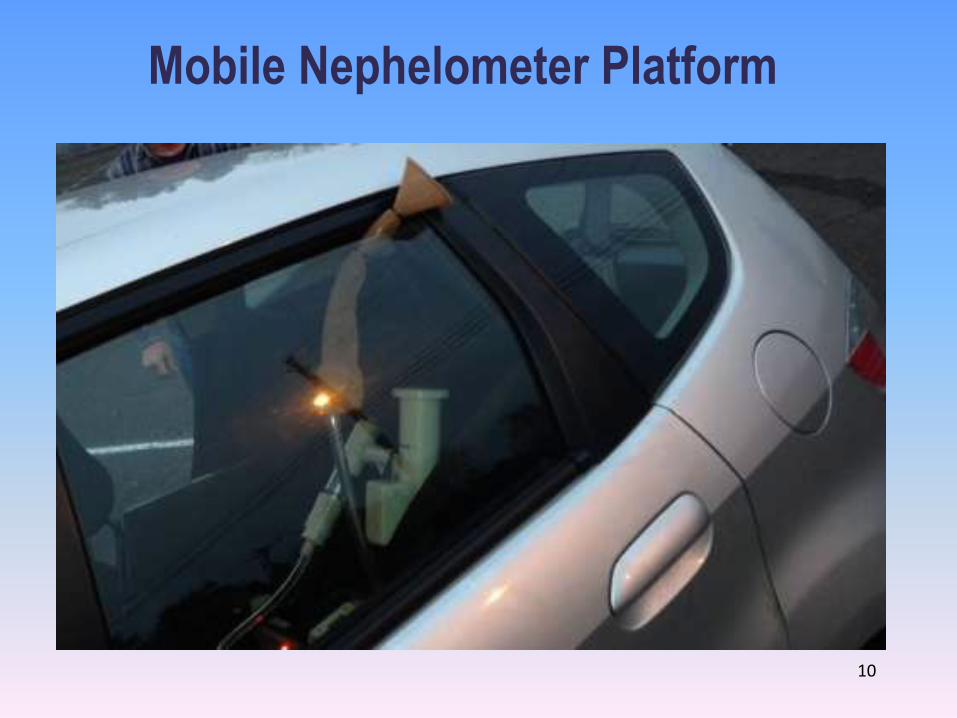
Mobile Nephelometer Platform
10

Mobile Nephelometer Platform
11

Mobile Nephelometer Platform
12

Mobile Nephelometer Platform
13

Methods
• Radiance Research M903 nephelometer
• Calibrated in lab before and after use
• Funnel out rear window
• “Slow” data mode at 2.5 σsp values per second
• RS232 connection to Hyperterminal
• Garmin eTrex GPS at 1 point per second
• 3 runs in late evening and early morning
June 20, 2014
14

Route Priorities
• ~35 miles (1.5 hours)
• Focus on residential areas with moderate-to-high density of primary wood heating
• Include monitoring site and surrounding neighborhood
• Identify impacts of elevation and distance from Columbia River
June 20, 2014
15
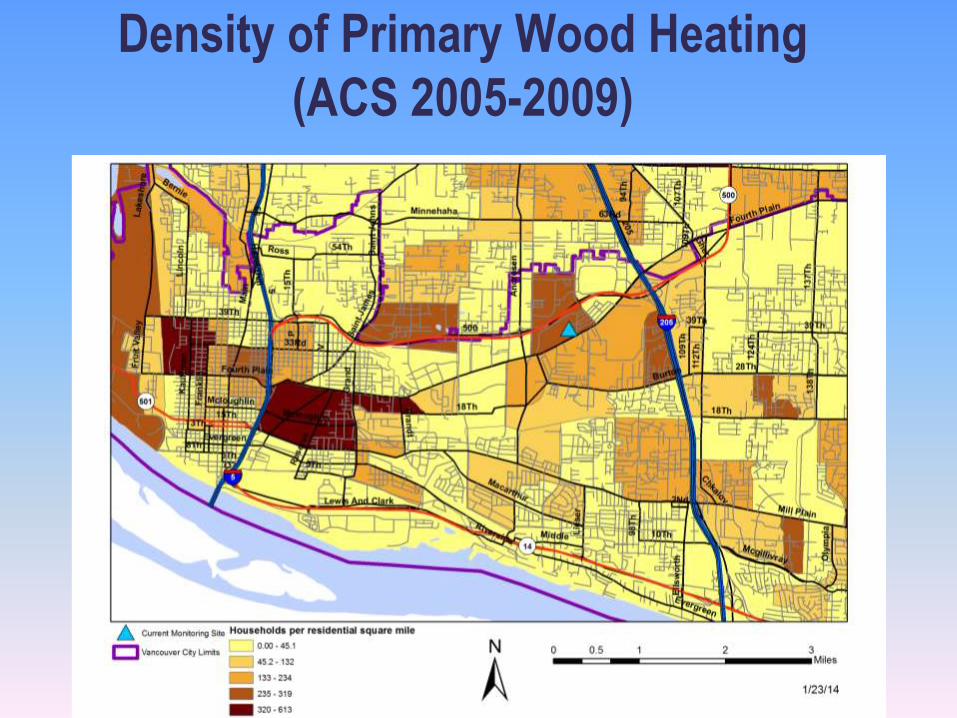
Density of Primary Wood Heating
(ACS 2005-2009)
16

Mobile Monitoring Route
17

Distribution of PM2.5 Results
18

Run 2 Results (23:24 – 1:38)
19

Analysis Method
• Grid of evenly-spaced points 50m apart
• By run:
• Geometric mean log-σsp within 300m of each point
• Log-σsp PM2.5 using Vancouver correlation
• Arithmetic mean PM2.5 across 3 runs
• Ordinary kriging
June 20, 2014
20

50m Grid Map (Run 2 Results)
21

Background
June 20, 2014
22

Background
June 20, 2014
23

Background
June 20, 2014
24

Background
June 20, 2014
25
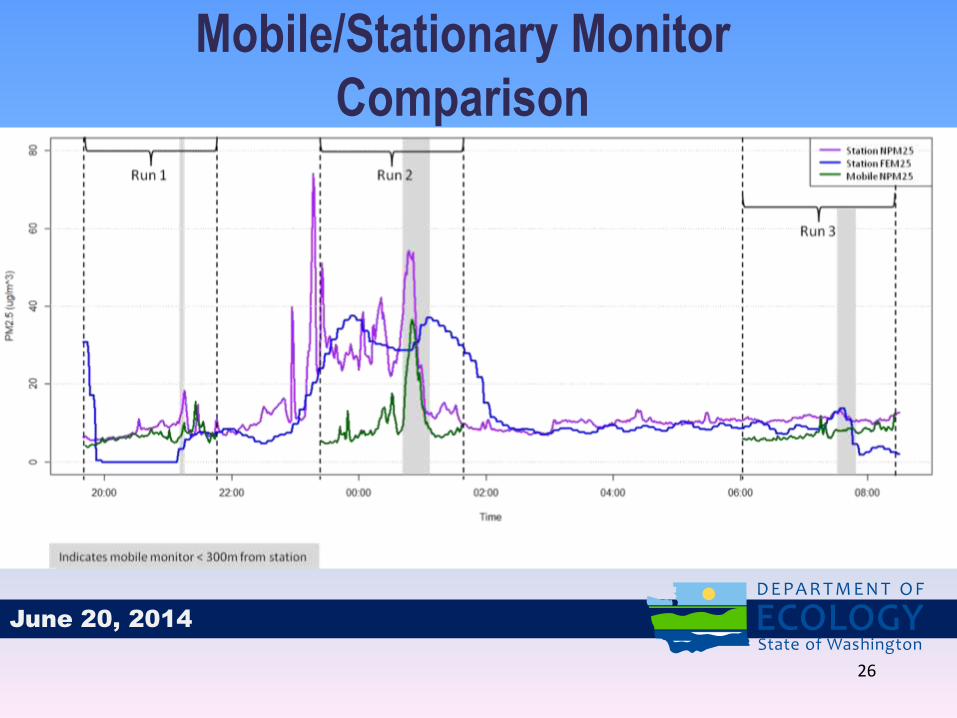
Mobile/Stationary Monitor
Comparison
June 20, 2014
26

Recommendations
• Longer stagnation period
• More and shorter runs
• Maximize right turns
• Drive the route before sampling
• Maintain a constant speed
June 20, 2014
27

Next Steps
• Screened 4 alternate sites • 2 meet neighborhood-scale siting criteria
• Deploy E-samplers at 2 sites by late summer
• Move to new site by Dec. 31, 2014
June 20, 2014
28

Questions?
Jill Schulte, Data Analyst
Washington Department of Ecology
Air Quality Program
October 13, 2009
29