mobile engagement industry benchmarks: push notification...
TRANSCRIPT
Push Notification Opt-In Rates
Mobile Engagement Industry Benchmarks:

©2015 Urban Airship | Portland San Francisco London | 855 385 3151 | urbanairship.com 2
OverviewOur largest data study yet utilizes nearly 3,000 apps and 100 billion push notifications sent to more than 500 million users through all of 2014 to shed light on core questions facing every mobile innovator:
• How do my app’s mobile engagement rates compare to those of my industry peers?
• What’s the delta between average and top performers?
• Is the opt-in rate for push notifications remaining steady or on the decline?
• What beyond push is proving to be effective at driving engagement?
• How does message response vary by mobile OS?• How does send frequency impact notification
engagement rates?
To offer actionable benchmarks, apps were categorized into 15 vertical industries with findings presented as high, medium and low values using the performance of apps in the 90th, 50th and 10th percentiles. The first in this series of benchmark reports examines push notification opt-in rates.
Executive summaryWhy are notification opt-in rates such an important metric? Because all of our previous Good Push Index studies have found that users opted in to notifications are four times more engaged with apps and are retained at double the rate of opt-out users. Notification opt-ins are an important component of a healthy and growing app.
Mobile engagement industry benchmarks:
Push notification opt-in rates

©2015 Urban Airship | Portland San Francisco London | 855 385 3151 | urbanairship.com 3
Our last exhaustive study of push notification opt-in rates was in December 2013 (Good Push Index), where data from more than 1,000 apps in six industry verticals found the average opt-in rate to be 45 percent. This time around, with a data sample nearly three times as large, the median opt-in rate is 42 percent.
In and of itself, a 3 percent drop in opt-in rates year-over-year is not cause for alarm. In fact, the true year-over-year decline is 2 percent if we had calculated the 50th percentile median rates as averages. Also, smaller sample sizes can produce higher results, as we saw in our May 2014 Location Opt-in study where 70 apps analyzed for location-sharing had an average push notification opt-in rate of 52 percent.
It’s also critical to view average or median industry vertical opt-in rates as exactly that — it’s the middle-of-the-pack. There’s a tremendous upside for apps that optimize their notification opt-in processes and follow push messaging best practices (check out the sidebar on Optimizing Opt-In Rates). The latest data shows that high-performing apps achieve average opt-in rates that are 45 percent higher than the rates medium-performing apps see. Where an app falls on the spectrum of high, medium and low opt-in rates—detailed in the vertical breakout section on page 10 — should very well dictate its next immediate areas of focus.
What’s really important to understand about the 42% median push opt-in rate is the remaining 58% of an app’s audience potentially left unaddressed. To be sure, many are focused on closing this addressability gap by adopting in-app message centers. The next benchmark report in our series will compare user engagement rates with in-app messages, and early results show tremendous potential to engage all app users — opt-in or not.
Media and Retail saw the biggest declines in average opt-in rates year-over-year. When viewed in relation to 2014 holiday shopping data, as well as our December 2013 study that identified these two industries as achieving the highest benefit from notifications, apps in any industry can gain valuable perspective and context.

All Industr
y
Utility
&
Productivity
Travel &
Transporta
tion
Sports & Rec.
SocialRetail
Medical, Health
&
FitnessMedia
Gaming
Gambling
Food & Drink
Finance
Entertainment
Education
Charities,
Foundations
& Non-Profit
Business
50%
60%
30%
10%
0%
20%
40%
©2015 Urban Airship | Portland San Francisco London | 855 385 3151 | urbanairship.com 4
Median push notification opt-in rates by industryThe chart above shows median opt-in rates for iOS apps, as Android users are automatically opted in to notifications upon app download. Median opt-in rates range from 58 percent for Charities to 33 percent for Games. High-performing apps across all industry verticals — the 90th percentile — have opt-in rates above 50 percent with Travel, Business and Charities topping out at rates greater than 70 percent.
Two industries see the steepest declinesAmong the six industry verticals included in our December 2013 study, Media and Retail apps saw the biggest declines in year-over-year opt-in rates. Previously, Retail was found to gain the highest engagement and retention improvements comparing opt-in users to opt-out users, while Media achieved the highest six-month ending retention rates, keeping 50 percent of its opt-in users. To offer an apples-to-apples comparison year-over-year, our data scientists recalculated the median opt-in rates as averages, finding Retail going from 46 percent to 37 percent and Media going from 50 percent to 42 percent opted-in.

©2015 Urban Airship | Portland San Francisco London | 855 385 3151 | urbanairship.com 5
So what has changed between 2013 and 2014?
Notifications have gone mainstreamIt’s no small wonder that practically every app asks for the privilege to send push notifications. Notifications extend app life cycles, driving greater engagement and retention — and that’s just part of the story. Increasingly, businesses across every industry are realizing the immediacy and greater response that notifications deliver over other marketing channels like email marketing, with click-through rates that can be twice as high. Other customers have seen 10 times higher click-through rates and 1200 percent greater conversion than their email campaigns. Even for average-performing apps, it’s quite likely that push response rates are multiples of what they see in other channels (more on that in an upcoming benchmark report).
This mainstreaming of notifications was brought into full focus, when we tracked Retail’s use of push notifications over the 2013 and 2014 holiday seasons using the same 150 Retail apps. The two key findings:
• Retailers doubled their notification send volumes on key shopping days in 2014.
• Customers responded to those messages at double the rate of 2013.
There’s no other marketing channel that’s seeing this type of growth. There’s also no other marketing channel where well over one-third of the audience opting in to ongoing communications could be called out as an accomplishment let alone the new average. Consider how many people visit websites and how many of them sign up for email communications — industry estimates peg it at 2 percent.
For the 2014 holidays, consumers were most engaged with notifications the Saturday before Thanksgiving, but retailers focused on sending more notifications on key shopping days, including Thanksgiving, Black Friday and Cyber Monday — an overt focus on mobile’s immediacy. In addition, the vast majority of 2014 holiday notifications were of the generic broadcast variety, offering 40% off or free shipping for a limited time. Had Retail apps focused more on pre-shopping activities they could have tapped into higher upfront engagement rates to determine shoppers’ interests and tailor subsequent notifications. Maybe they would have gone from doubling response

©2015 Urban Airship | Portland San Francisco London | 855 385 3151 | urbanairship.com 6
rates over the 2013 holidays to achieving 4X-7X greater response that highly targeted notifications receive over messages broadcast to everyone (Good Push Index-Targeting, May 2014). Perhaps even more important, recipients might view notifications as offering them personalized value versus just another business-centric promotion.
There’s nothing wrong with sales promotions, or in Media’s case, breaking news headlines, but as more apps implement broadcast-type shouts to get users’ attention, it’s natural that consumers will become pickier about which apps they allow to do that. ABC News has introduced story-starring functionality that curates a personalized stream of notifications on story updates — another innovation that contributes to its app seeing one-third of all traffic directly attributable to notifications.
Optimizing opt-in ratesThe majority of apps just serve up standard iOS language on first app open before users have had the chance to explore the value of the app or any explanation of the value of opting in. From the app user’s perspective it can be a bit annoying and generic to see that same message pop up the moment they open an app for the first time. This default approach to asking for the opt-in is very likely the key reason, or at least the very first reason, we see such a massive delta between high- and low-performing apps.
A better approach is to describe the value of opting in through interactive walkthroughs shown on first app open. Victoria’s Secret does a nice job explaining the value of opting in to both push notifications and

©2015 Urban Airship | Portland San Francisco London | 855 385 3151 | urbanairship.com 7
location-sharing.You can also get creative and think about other places in the app or customer journey where asking for push and location opt-in might be more contextually relevant than during the initial app open, such as the first time users access app functionality that benefits from opting in. Alaska Airlines, for example, waits until the user has booked a flight and viewed the flight in the app to encourage opting in to flight notifications. If the user previously opted out, they provide instructions to navigate to the phone settings and turn push notifications back on.
Even serving up a single customized message before the default iOS language can have dramatic impact on opt-in rates, setting users’ expectations for the types of notifications they might receive.
For example, the NHL grew its opt-in rate nearly 10 percent since implementing a customized screen before the default iOS language.
What about app users that have previously opted-out? With in-app messaging, brands can reach opt-ins and opt-outs to ensure they are aware of the most relevant, timely content each time they open the app. These in-app messages can also be used to ask the app user to re-enable notifications when the time is right. For example, when opt-out users purchase an item an automated in-app campaign can ask if they’d like to receive alerts when their order ships, with “Yes” taps deep-linking them to the settings screen.

Business
Charities,Foundations,
Non-Profit
EducationEntertainment Finance
Food & Drink
GamblingGaming
Media
Medical,Health &Fitness
Retail
Social
Sports
Travel &Transportation
Utility &Productivity
100%
25%
50%
75%
0%
54%
73% 72%
22%19%
24%
64%66% 65%
51%
55%
14% 15%
52%
55%
24%26%
58%56%
20%
16%
67%
58%
32%30%
23%
66%
78%
23%
17%
34%
58%
49%
42% 41%
36%39%
33%
41% 40%
36%
41%
48% 47% 46%
©2015 Urban Airship | Portland San Francisco London | 855 385 3151 | urbanairship.com 8
Industry opt-in benchmarks for iOSThe following are high, medium and low notification opt-in rates by the 15 verticals included in this study.

Business
Charities,Foundations,
Non-Profit
EducationEntertainment Finance
Food & Drink
GamblingGaming
Media
Medical,Health &Fitness
Retail
Social
Sports
Travel &Transportation
Utility &Productivity
100%
25%
50%
75%
0%
54%
73% 72%
22%19%
24%
64%66% 65%
51%
55%
14% 15%
52%
55%
24%26%
58%56%
20%
16%
67%
58%
32%30%
23%
66%
78%
23%
17%
34%
58%
49%
42% 41%
36%39%
33%
41% 40%
36%
41%
48% 47% 46%
©2015 Urban Airship | Portland San Francisco London | 855 385 3151 | urbanairship.com 9

©2015 Urban Airship | Portland San Francisco London | 855 385 3151 | urbanairship.com 10
MethodologyUrban Airship analyzed customer data in aggregate to identify apps with at least 5,000 downloads that had sent at least 1,000 cumulative pushes in one month. Analysis included 2,946 apps that had collectively sent more than 93 billion notifications to more than 533 million users. For industry-specific insights, apps were manually categorized into 15 industry verticals. To offer performance benchmarks, results were grouped into high, medium and low ranges using 90th, 50th and 10th percentiles.
This report was generated by Urban Airship’s Strategic Consulting group and its data scientists. Strategic Consulting partners with brands to deliver tailored, relationship-based mobile strategies that increase app engagement and boost business metrics. Please contact Urban Airship to schedule a benchmark review.
About Urban AirshipUrban Airship is leading the movement of mobile innovators, helping them build high-value relationships through mobile apps and mobile wallets. Its mobile engagement and insight products mobilize all aspects of a business, powering exceptional mobile and omnichannel customer experiences. Studies have found that Urban Airship’s engagement solutions can drive an 878 percent return on investment for customers and overcome APPathy by increasing app user engagement 4X and doubling retention. Thousands of companies and some of the most demanding brands in retail, media & entertainment, sports and travel & hospitality, trust Urban Airship to deliver the mobile moments that matter to their customers and their business.
For more information, visit www.urbanairship.com and follow us on Twitter @urbanairship.
©2015 Urban Airship | Portland San Francisco London | 855 385 3151 | urbanairship.com 11
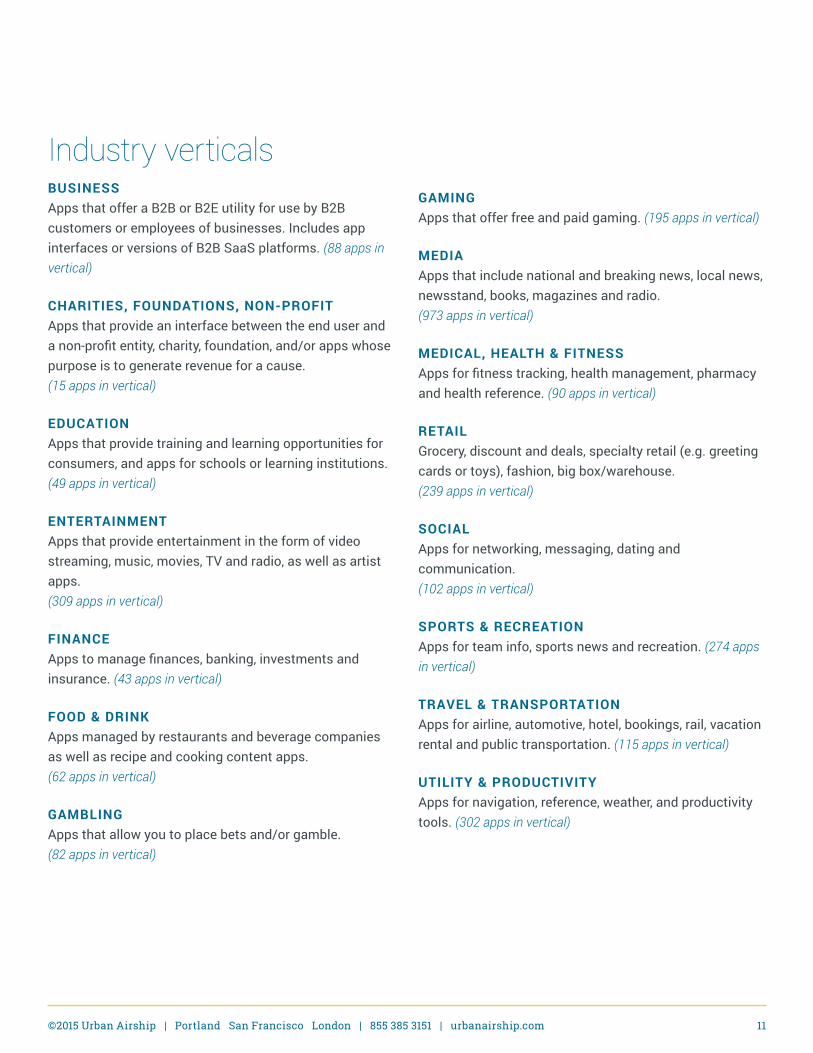
Industry verticalsBUSINESSApps that offer a B2B or B2E utility for use by B2B customers or employees of businesses. Includes app interfaces or versions of B2B SaaS platforms. (88 apps in vertical)
CHARITIES, FOUNDATIONS, NON-PROFITApps that provide an interface between the end user and a non-profit entity, charity, foundation, and/or apps whose purpose is to generate revenue for a cause. (15 apps in vertical)
EDUCATIONApps that provide training and learning opportunities for consumers, and apps for schools or learning institutions. (49 apps in vertical)
ENTERTAINMENTApps that provide entertainment in the form of video streaming, music, movies, TV and radio, as well as artist apps. (309 apps in vertical)
FINANCEApps to manage finances, banking, investments and insurance. (43 apps in vertical)
FOOD & DRINKApps managed by restaurants and beverage companies as well as recipe and cooking content apps. (62 apps in vertical)
GAMBLINGApps that allow you to place bets and/or gamble. (82 apps in vertical)
GAMINGApps that offer free and paid gaming. (195 apps in vertical)
MEDIAApps that include national and breaking news, local news, newsstand, books, magazines and radio. (973 apps in vertical)
MEDICAL, HEALTH & FITNESSApps for fitness tracking, health management, pharmacy and health reference. (90 apps in vertical)
RETAILGrocery, discount and deals, specialty retail (e.g. greeting cards or toys), fashion, big box/warehouse. (239 apps in vertical)
SOCIALApps for networking, messaging, dating and communication. (102 apps in vertical)
SPORTS & RECREATIONApps for team info, sports news and recreation. (274 apps in vertical)
TRAVEL & TRANSPORTATIONApps for airline, automotive, hotel, bookings, rail, vacation rental and public transportation. (115 apps in vertical)
UTILITY & PRODUCTIVITYApps for navigation, reference, weather, and productivity tools. (302 apps in vertical)