mo vapor intrusion training 11 2008 - pstif dc vapor summit j&e model published itrc vi...
TRANSCRIPT

Assessing Assessing
Vapor Intrusion Risk Vapor Intrusion Risk
at Tank Sitesat Tank Sites
Dr. Blayne HartmanIndependent Consultant
H&P Mobile [email protected]
November 2008November 2008
For MO-DNR &
MO PST Insurance Fund

Assessing Vapor IntrusionAssessing Vapor Intrusion
Risk at Tank SitesRisk at Tank Sites
Dr. Blayne HartmanIndependent Consultant
H&P Mobile [email protected]
November 2008November 2008
For MOFor MO--DNR & MO PST Insurance FundDNR & MO PST Insurance Fund

3
Training Overview
Part 1 - Overview of Vapor Intrusion
Part 2 - Review of Some Basic Principles
Part 3 - Review of VI Guidances
Part 4 - Methods to Assess Vapor Intrusion
Part 5 - Soil Gas Sampling & Strategies
Part 6 – Field Exercise

4
Part 1: Overview of Vapor Intrusion
� What Is It?
� Why Do You Care about It?
� When Should You Worry About It?
� What Sites to Worry?

5
What Is Vapor Intrusion?
Key Assumptions:– Risk level (1 in 10,000? 100,000? 1,000,000?)
– Toxicity of Compounds
– Exposure Factors (time, rates, ventilation)

6
Why Do You Care About VI?(Risk Often More Perceived Than Real)
� Health & Safety of Occupants
� EPA - Draft VI Guidance Exists
� Individual State Guidances
� ASTM New Phase 1 Standard
� Attorneys & Citizen Groups
7
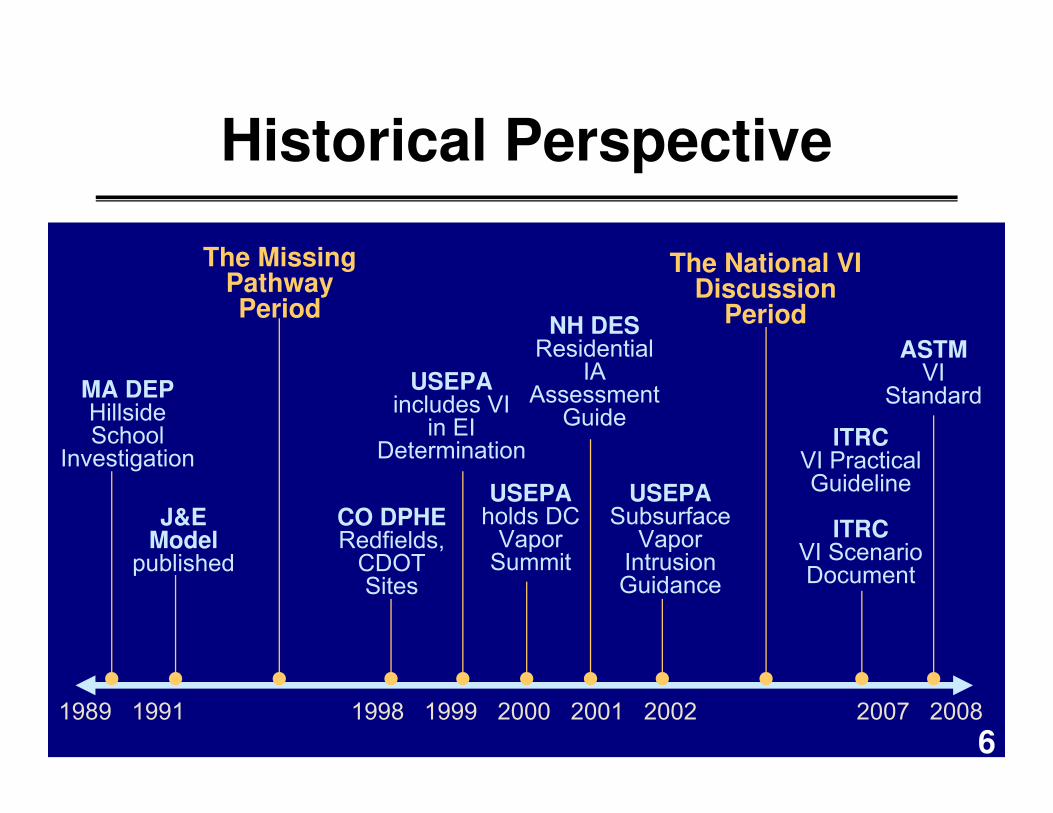
Historical Perspective
1989 1991 1998 1999 2000 2001 2002 2007 2008
MA DEPHillside School
Investigation
The Missing Pathway Period
CO DPHERedfields,
CDOT Sites
USEPA includes VI
in EI Determination
USEPAholds DC
Vapor Summit
J&E Model
published
ITRCVI Practical Guideline
ITRCVI Scenario Document
The National VI Discussion
Period
ASTMVI
Standard
NH DESResidential
IA Assessment
Guide
USEPA Subsurface
Vapor Intrusion Guidance
6

8
ITRC Survey Results
� 39 of 43 states say vapor intrusion is a current concern being actively addressed
� VI concerns in every program (RCRA, FUDs CERCLA, brownfields, UST, dry-cleaning
� Most preferred methods for evaluating vapor intrusion: shallow soil gas/subslab sampling followed by indoor air measurements
� 9 states allow for biodegradation of petroleum hydrocarbons

9
When to Worry About VI?
� If VOC Contamination & Structures Exist:
– Laterally within: EPA: 100’ MO: 25’ for HC
– Vertically Within: EPA 100’ MO: not specified
� Complaining Occupants
� Structures With Odors, Wet Basements
� Sites With Contamination & Future Use
� Attorneys & Communities
10
What Compounds?
� VOCs:
– Hydrocarbons (benzene, aliphatics)
– Methane
– MTBE, other oxys
– EDB & EDC
� Semi-VOCs:
– Naphthalene
11
What Types of Sites?
� Petroleum Hydrocarbons
– Service Stations, USTs, Pipelines
– Oil Furnaces (naphthalene)

12
Low Target Levels Mean More Sites to Assess
� Typical Groundwater Levels:
– benzene: 5 ug/L – domestic use
� Benzene Levels Exceeding 1E-5 Risk:
– Indoor Air: 0.003 ug/L

13
Part 2 – Some Basics
� Units
� Fick’s Law
� Contaminant Partitioning
� Attenuation (alpha) Factors
� Conceptual Site Model (CSM/SCM)
� Risk Based Target Levels (RBTL)

14
The Most Common Goof
1 ug/L Benzene equals: a) 1 ppbv
b) 1 ppmv
c) 330 ppbv
d) None of the Above

15
How do Contaminants Move?
Movement (Flux) = K d?/dx
where: K is a proportionality constant
d?/dx is a gradient
Property Equation Constant ______
Momentum: Flux = K dH/dx hydraulic cond
Heat (Poisson’s): Flux = Φ dT/dx thermal cond
Mass (Fick’s): Flux = D dC/dx diffusivity
Momentum, Heat, Mass ALL Move from High to Low
16
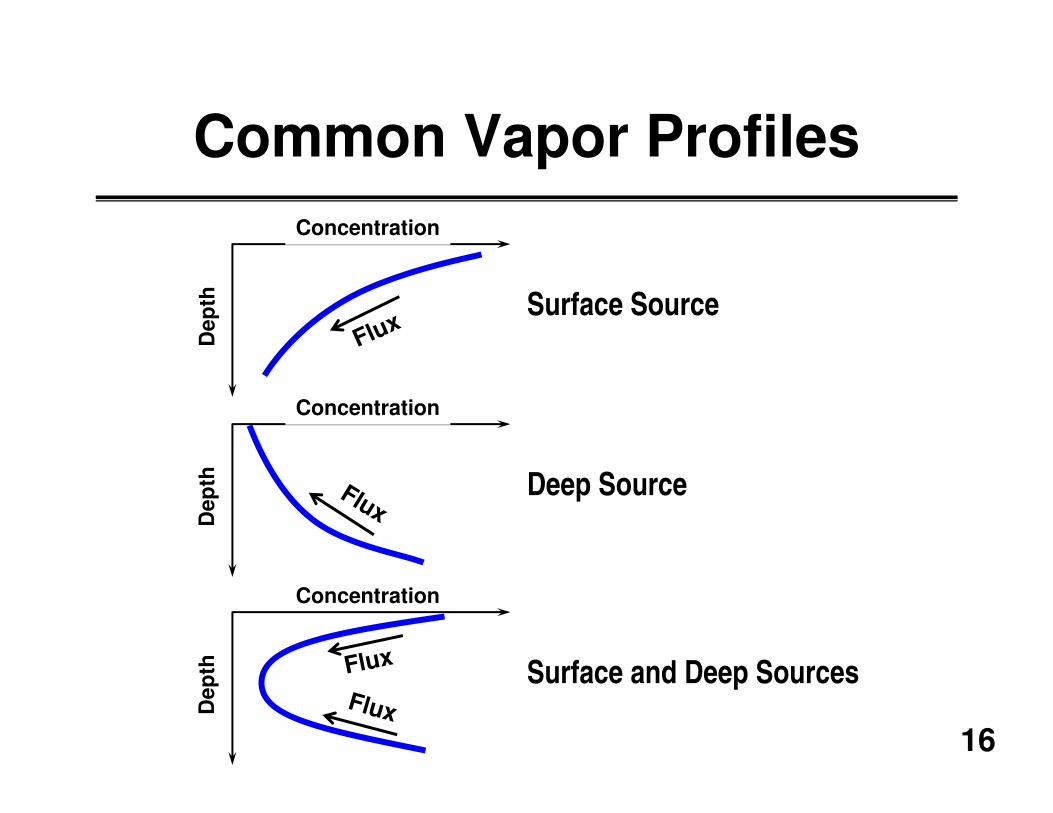
Common Vapor Profiles
Flux
Dep
thConcentration
FluxDep
th
Concentration
FluxDep
th
Concentration
Flux
Surface Source
Deep Source
Surface and Deep Sources
17
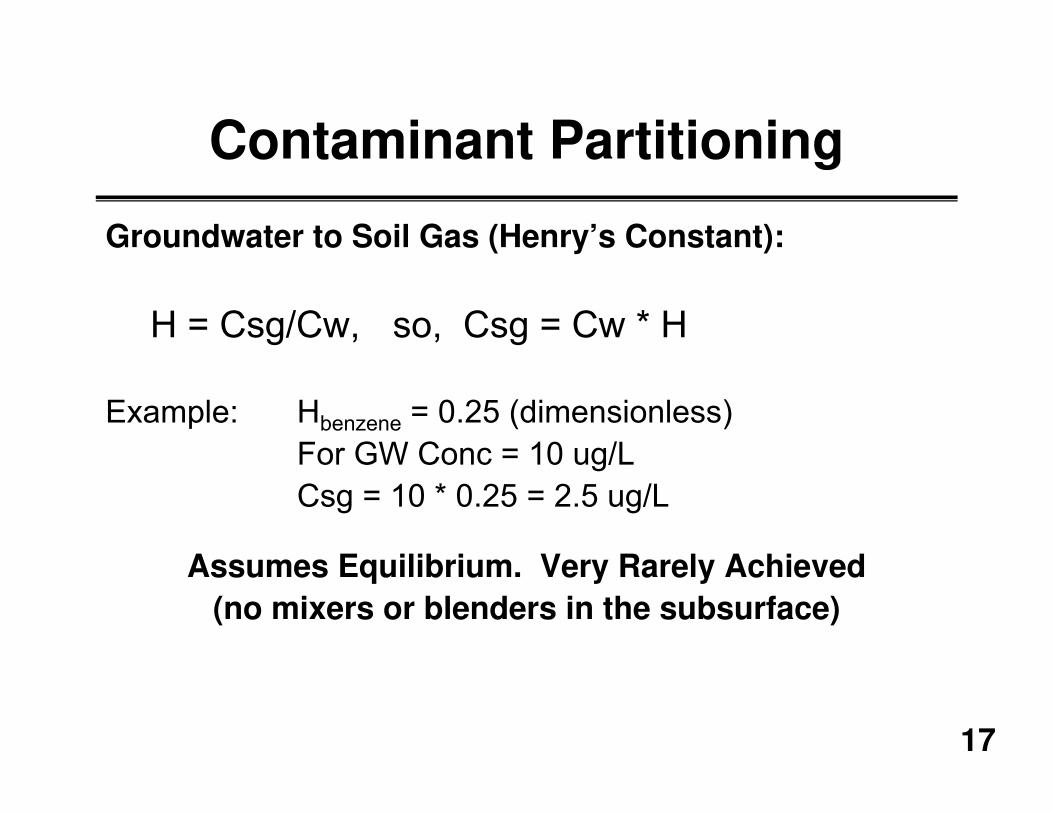
Contaminant Partitioning
Groundwater to Soil Gas (Henry’s Constant):
H = Csg/Cw, so, Csg = Cw * H
Example: Hbenzene = 0.25 (dimensionless)
For GW Conc = 10 ug/L
Csg = 10 * 0.25 = 2.5 ug/L
Assumes Equilibrium. Very Rarely Achieved
(no mixers or blenders in the subsurface)

1817

19
Measured Soil Gas Data vs. Predicted from Soil Phase Data
Measured vapor concentrations 10 to 1000x less than predicted
Key point:
CPPI Database
.005
20
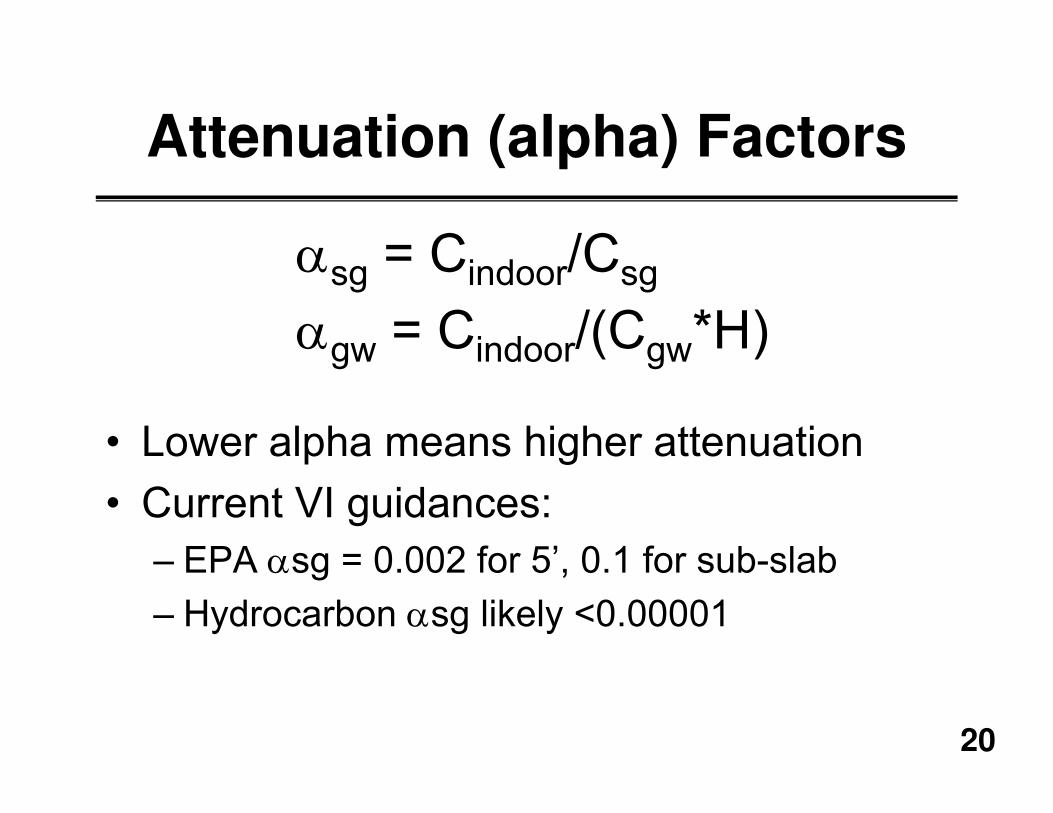
Attenuation (alpha) Factors
sg = Cindoor/Csg
gw = Cindoor/(Cgw*H)
� Lower alpha means higher attenuation
� Current VI guidances:
– EPA sg = 0.002 for 5’, 0.1 for sub-slab
– Hydrocarbon sg likely <0.00001

2120

22
Using Alpha Factors to Calculate Screening Levels
For Soil Gas:
Csg = Cindoor/sg
For Groundwater:
Cgw = Cindoor/(H*gw)
Example: Cin benzene = 3.1 ug/m3
Csg (5’) = 3.1/0.002 = 1500 ug/m3

23
Conceptual Site Model
DEFINITION:A conceptual site model (CSM) is a simplified version of a complex real-world system that approximates its relationships

24
Components of a CSM
� Underground utilities & pipes
� Existing & potential future buildings
� Construction of buildings
� Type of HVAC system
� Soil stratigraphy
� Hydrogeology & depth to water table
� Receptors present (sensitive?)
� Nature of vapor source
� Vadose Zone characteristics
� Limits of source area & contaminants of concern
� Surface cover description in source and surrounding area

25
RISK 101: Screening Levels
� RBTL: Risk Based Target Level (MO)
� RBC (from ASTM): Risk Based Concentration
� RBSL: Risk Based Screening Level
Need to Know When & How to Use

26
RISK 101:Why Are Indoor Air RBTLs So Low?
� MO Benzene: 3.1 ug/m3 (1e-5 risk)
� Values Assume Exposure Times of:
– 18 hr, 350 days/yr, 30 years
Ultra Conservative Assumptions Lower
Allowed Levels and Bring in More Sites
27
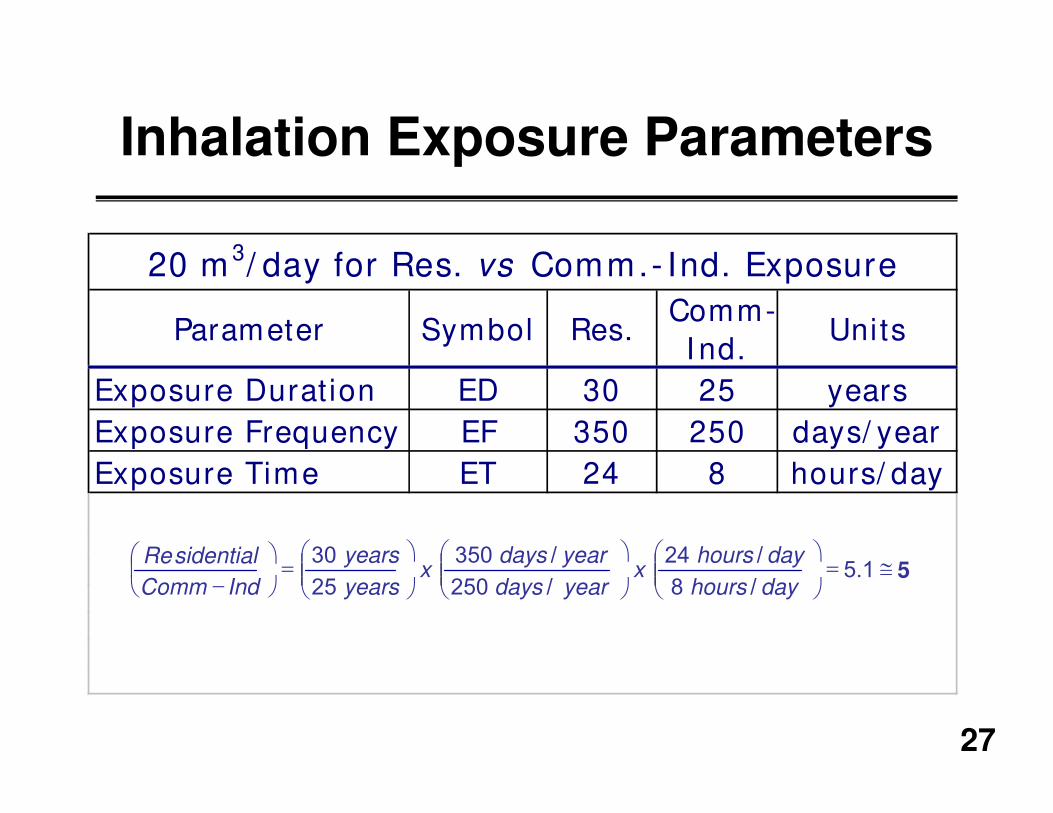
Inhalation Exposure Parameters
51.5/8
/24
/250
/350
25
30Re
dayhours
dayhoursx
yeardays
yeardaysx
years
years
IndComm
sidential
Parameter Symbol Res.Comm-
I nd.Units
Exposure Duration ED 30 25 years
Exposure Frequency EF 350 250 days/ year
Exposure Time ET 24 8 hours/ day
20 m 3/ day for Res. vs Comm.- Ind. Exposure

28
Methods for Target Level Determination
� Soil & GW: MO Table 7.1 through 7.3
� Soil Gas: Tier 2 Target Levels
� From Spreadsheet/Model (RAM Group)
� Use Custom Software (Tier 3)

29
Other Models
� Johnson-Ettinger Most Common– GW, soil, soil gas spreadsheets
– Screen & advanced versions
– Hard to compare defaults vs actual values used
� Variables You Can Change (Tier 3)– GW or soil gas concentration
– Soil type (diffusivity)
– Ventilation rate
– Exposure time
– Building Size

30
Part 3 – Review of VI Guidance
� EPA OSWER VI Guidance
� ITRC Guidance
� ASTM VI Standard

31
OSWER Draft Guidance for Evaluating the Vapor Intrusion to Indoor Air Pathway from Groundwater and Soils
(Subsurface Vapor Intrusion Guidance)
Federal Register Notice - November 29, 2002– Fact Sheet: Evaluating the Vapor Intrusion into Indoor Air
� Adobe PDF File [17 KB]
Draft Guidance for Evaluating the Vapor Intrusion to Indoor Air Pathway from Groundwater and Soils (Subsurface Vapor Intrusion Guidance) (Complete Document): Adobe PDF File [3019 KB]
– Draft Guidance� Adobe PDF File [516 KB]
– Tables� Adobe PDF File [353 KB]
– Appendices A-C� Adobe PDF File [972 KB]
– Appendices D-F� Adobe PDF File [722 KB]
– Appendices G-I� Adobe PDF File [475 KB]
E-Docket is an on-line system that allows viewers to search the Agency's major public dockets on-line, view the index listing of the contents for the dockets included in the system, and access those materials that are available on-line. You may also submit comments on-line while this docket is open for public comment.

32
EPA-OSWER Draft Guidance
� Tier 1: Primary Screening– Q1: VOCs present?
– Q2: Near buildings?
– Q3: Immediate concern?
� Tier 2: Secondary Screening– Q4: Generic screening
– Q5: Semi-site specific screening (alphas from charts & tables)
� Tier 3: Site-Specific Pathway Assessment – Q6: Indoor air (and/or subslab)
33
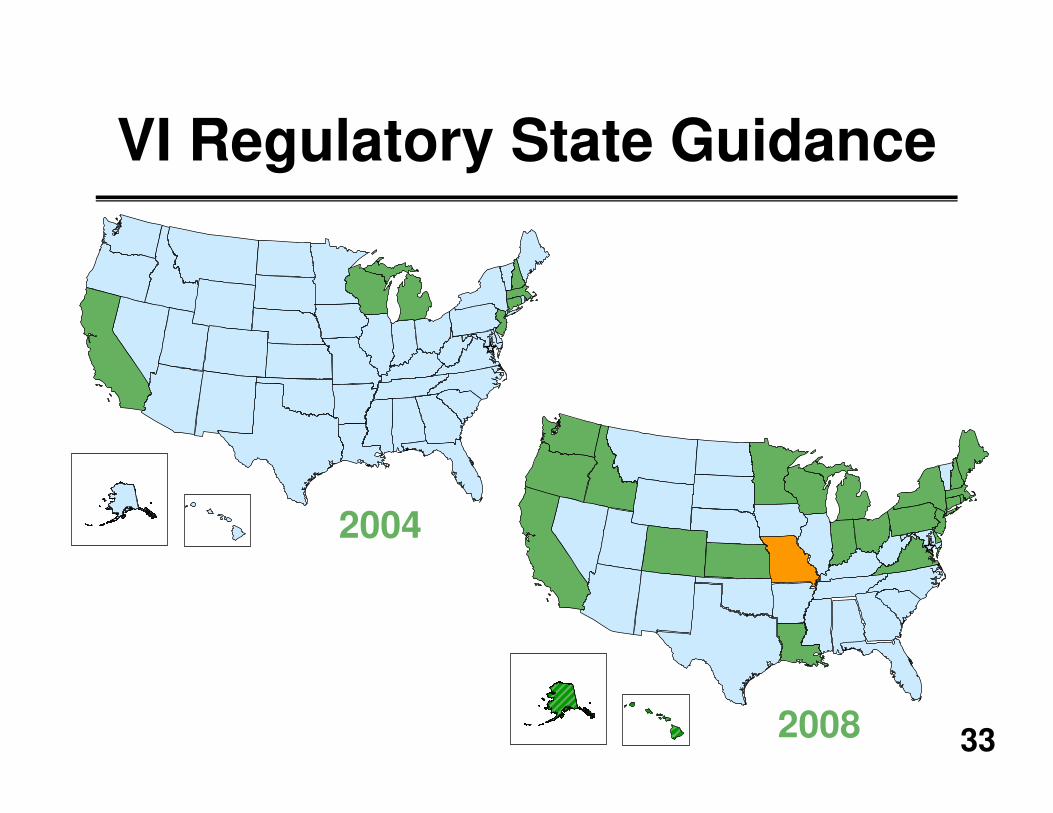
VI Regulatory State Guidance
2008
2004

34
ITRC VI Guidance
� Practical How-to Guide
� Stepwise Approach
� Discussion of Investigatory Tools
� Thorough Discussion of Mitigation
� Scenarios Document
� Classroom Training in 2008

35
ITRC VI Scenario Document
� Gas station in residential neighborhood
� Dry-cleaner in strip mall located adjacent to neighborhood
� Large industrial facility with long plume under several hundred buildings
� Vacant lot with proposed Brownfields development over groundwater plume
� Vacant large commercial building with warehouse space and office space
� Apartment building with parking garage over groundwater plume

36
ASTM VI Standard
� Focus on Property Transactions
� Prescriptive Screening Distances
� No RBSLs (RBC)
� No Assessment Recommendations
� Legal Standards
� Mitigation
� Released March 3, 2008

3736
38
Part 4 – Methods to Assess VI
� Indoor Air Sampling
� Groundwater Sampling
� Soil Phase Sampling
� Use of Predictive Models
� Measure Flux Directly
� Soil Gas Sampling
� Supplemental Tools/Data

39
Some Key VI Issues
� Experience of the Collector/Consultant– Have they done this before?
– Do they understand RBTLs?
– Quality/experience of field staff? Sr or Jr?
� Spatial & Temporal Variability– GW, Indoor Air, Soil Gas
� Ultra Low Screening Levels– Increases chances for false positives

40
Ingredients for Effective VI Assessments
� Investigatory Approach
� Determine Correct Screening Levels
� Sample & Analyze Properly
� Know & Use Supplemental Tools
� Demonstrating Bioattenuation

41
Approach Generalizations
� Indoor Air
– Always find something
– Multiple sampling rounds: extra time & $
� Groundwater Data
– Typically over-predicts risk
� Soil Phase Data
– Typically not allowed; over-predicts risk
� Soil Gas Data
– Transfer rate unknown
– Sub-slab intrusive

42
Groundwater Data
� Preexisting Data Often Exist – Over proper well screen interval?
– Coverage typically limited; interpolation
� Gather New Data
– Well location, construction, sampling
– Might miss actual contamination zone
� Perched/Clean Water Layer?
� Tier 1 Risk-Based Target Levels Exist
43
Soil Phase Data
� Soil Data OK to Use in MO
� Tier 1 Target Levels Exist
44
Soil Gas Measurement
� Pros:
– Representative of Subsurface Processes
– Higher Target Levels Than Indoor Air
– Relatively Inexpensive
– Can Give Real-time Results
� Cons:
– Transfer Rate Unknown
– Sampling Protocols Vary
Currently Most Preferred Approach
45
Part 4 – Soil Gas Sampling
� Soil Gas Methods
� Sampling & Analysis Issues
� Sampling Strategies
� Bioattenuation of Hydrocarbons
� Other Tools/Approaches

46
Which Soil Gas Method?
� Active?
� Passive? (qualitative)
� Flux Chambers? (limited use)
Active method most often employed for VI
47
Passive Soil Gas
� Pros:
– Easy to Deploy
– Can Find Contamination Zones
– Low Permeability soils
� Cons:
– Does not Give Concentration
– No Less Expensive
Considered as Screening Tool by MO-DNR

48
Passive Soil Gas Samplers
Adsorbent inside tube open on one
end
Adsorbent inside badge
Adsorbent inside vapor perm eable, w aterproof
m em brane
47
49
Direct Flux Measurement (Flux Chambers)
� Pros:
– Direct Measurement of Intrusion
� Cons:
– Proper Location?
– Protocols Debated
– How to Use Data?
MO-DNR: Will Consider Use

50
Static Flux Chamber

51
Get Enough Data
� Soil Gas Not Homogeneous
� Spatial & Vertical Variations Exist
�
� Don’t Chase 1 pt Anomalies
� Get Enough Data Near/Around/Under
� On-site Analysis Enables Real-Time Decisions

52
Probe Installation Methods
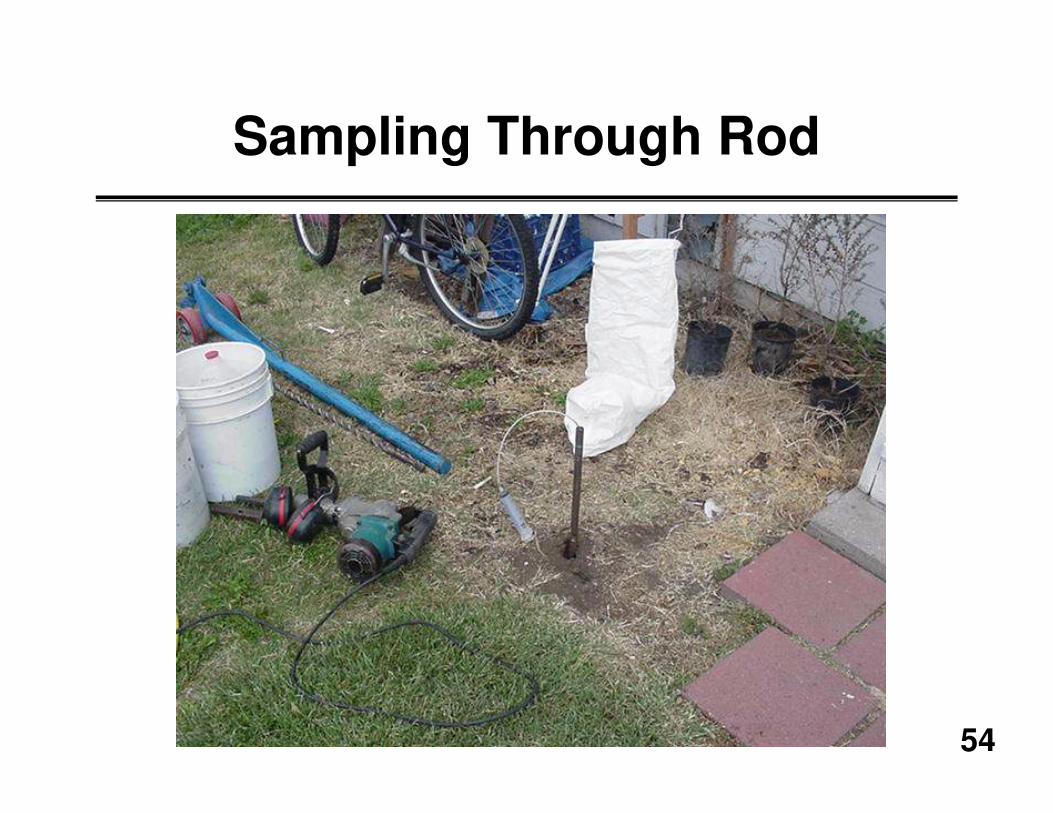
� Driven Rod Methods (Temporary)– Hand equipment, direct-push
– Collect sample while probe in ground
– MO-DNR wants accurate location
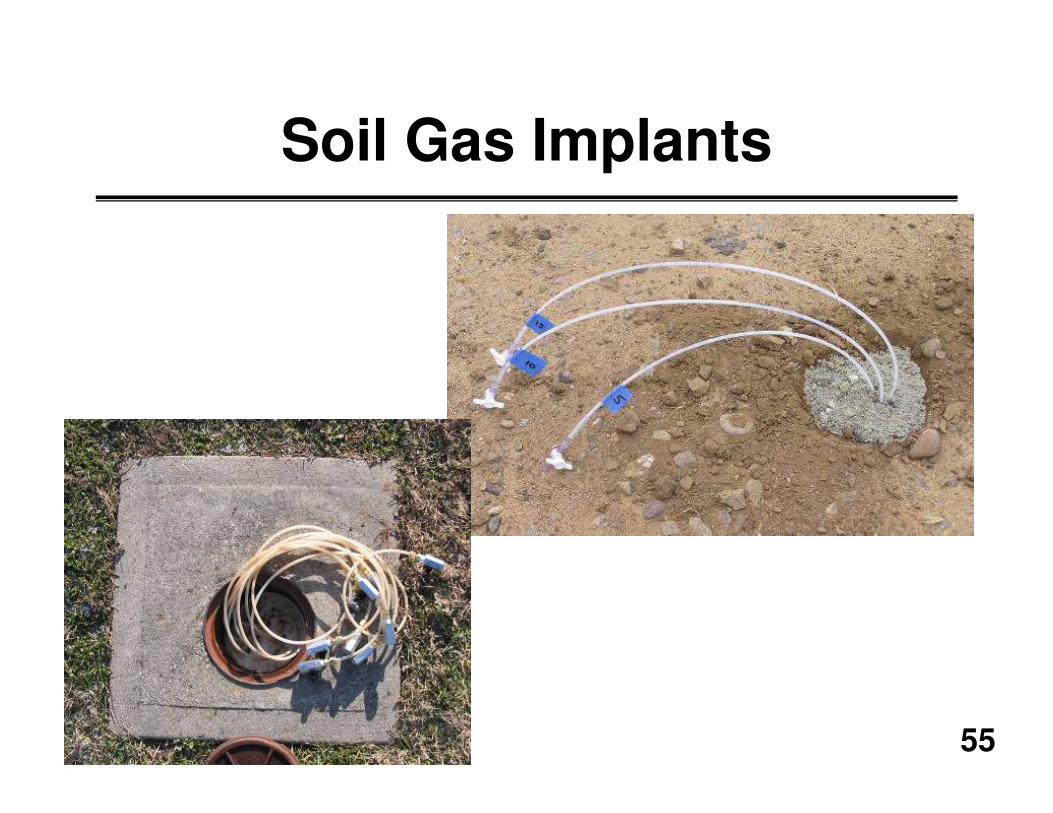
� Vapor Mini-Wells/Implants - MO Preferred– Inexpensive & easy to install/remove
– Allow repeated sampling
– Can “nest” in same bore hole
– Must construct to remain for at least 6 months

53
Probe Installation/Abandonment
� Must follow MO Well Construction Rules
� Wells > 10’ with riser < 2” or in a Borehole <6”OD Require Variance from GSRAD
54
Sampling Through Rod
55
Soil Gas Implants

56
Nylon Tubing

57
Multi-Depth Nested Well
58
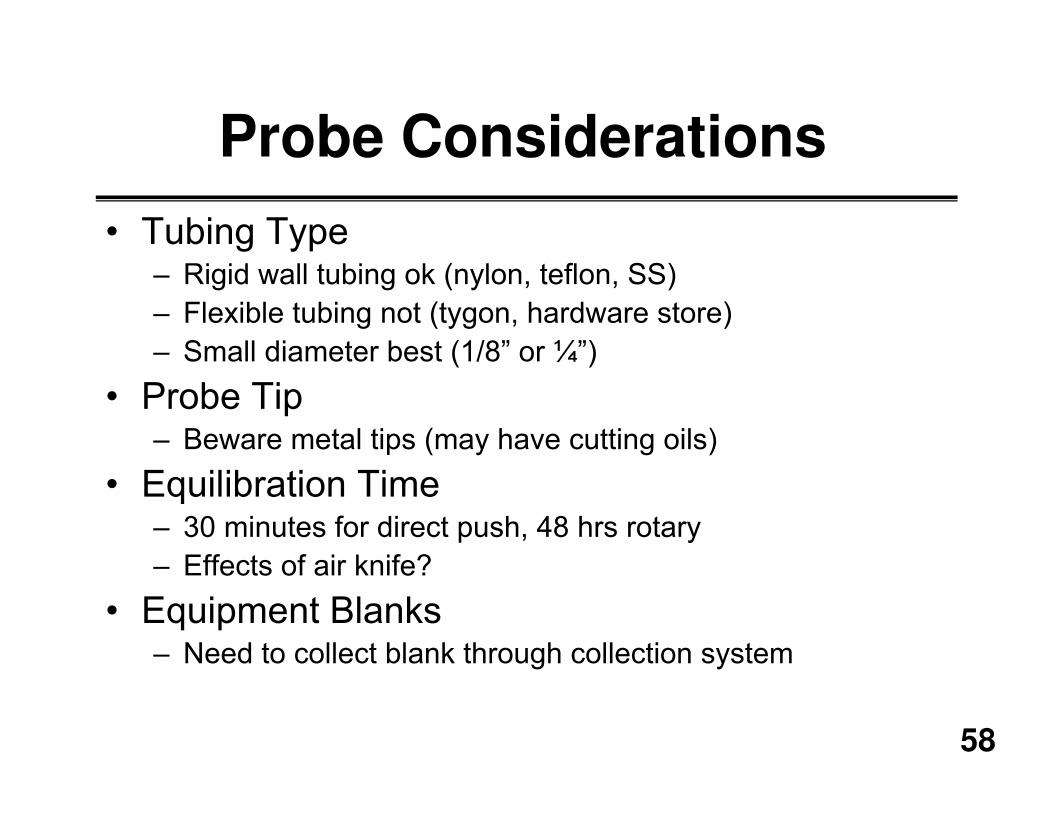
Probe Considerations
� Tubing Type– Rigid wall tubing ok (nylon, teflon, SS)
– Flexible tubing not (tygon, hardware store)
– Small diameter best (1/8” or ¼”)
� Probe Tip – Beware metal tips (may have cutting oils)
� Equilibration Time– 30 minutes for direct push, 48 hrs rotary
– Effects of air knife?
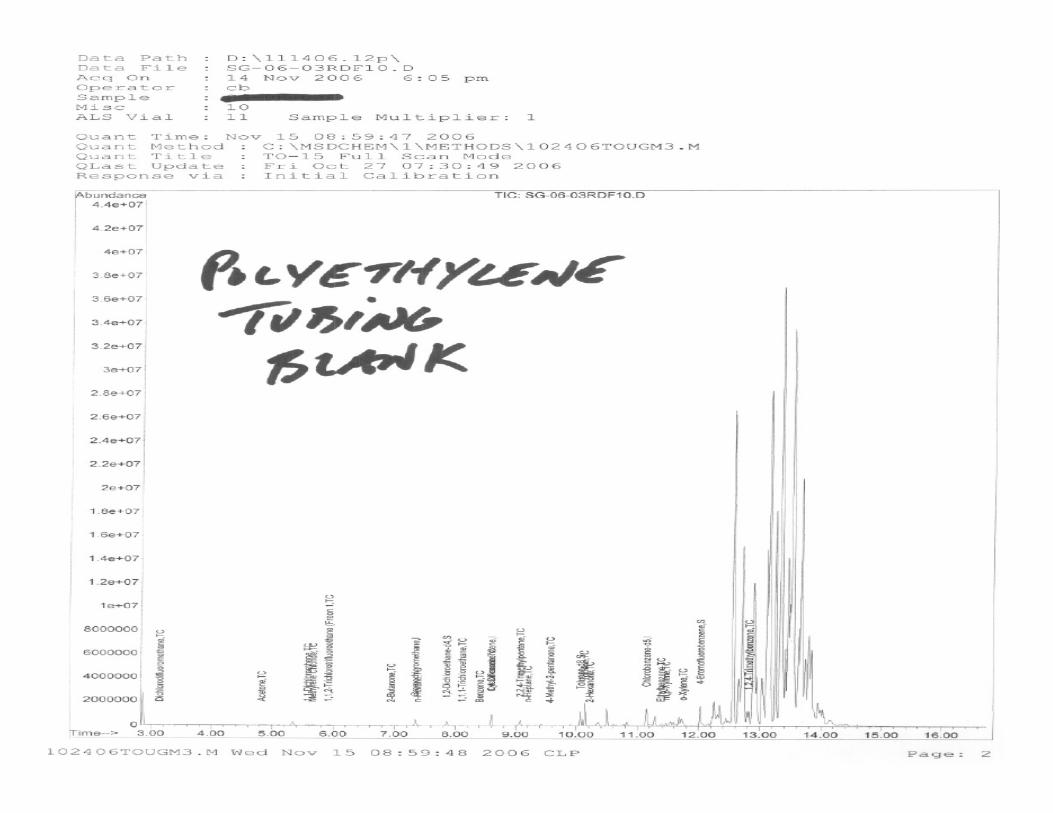
� Equipment Blanks– Need to collect blank through collection system

59
Tubing Test
395390400Nylaflow
400340460PEEK
?170ndCu
310310310Polyethylene
395410380Teflon
410350470SS
AverageTCE #2
(ug/m3)
TCE #1
(ug/m3)
Tubing
MO-DNR currently allows PolyEthy & Cu
60

61
Soil Gas Sampling Issues
� Sample Size– Smaller volumes faster & easier to collect
– MO prefers 1 liter or less
� Containers– Canisters: More blank potential. Higher cost
– Tedlars: Easier to collect
� Flow Rate– MO prefers < 200 ml/min
� Applied Vacuum– MO requires < 100 inches of water
– Must flag data if > 100 inches of water
62
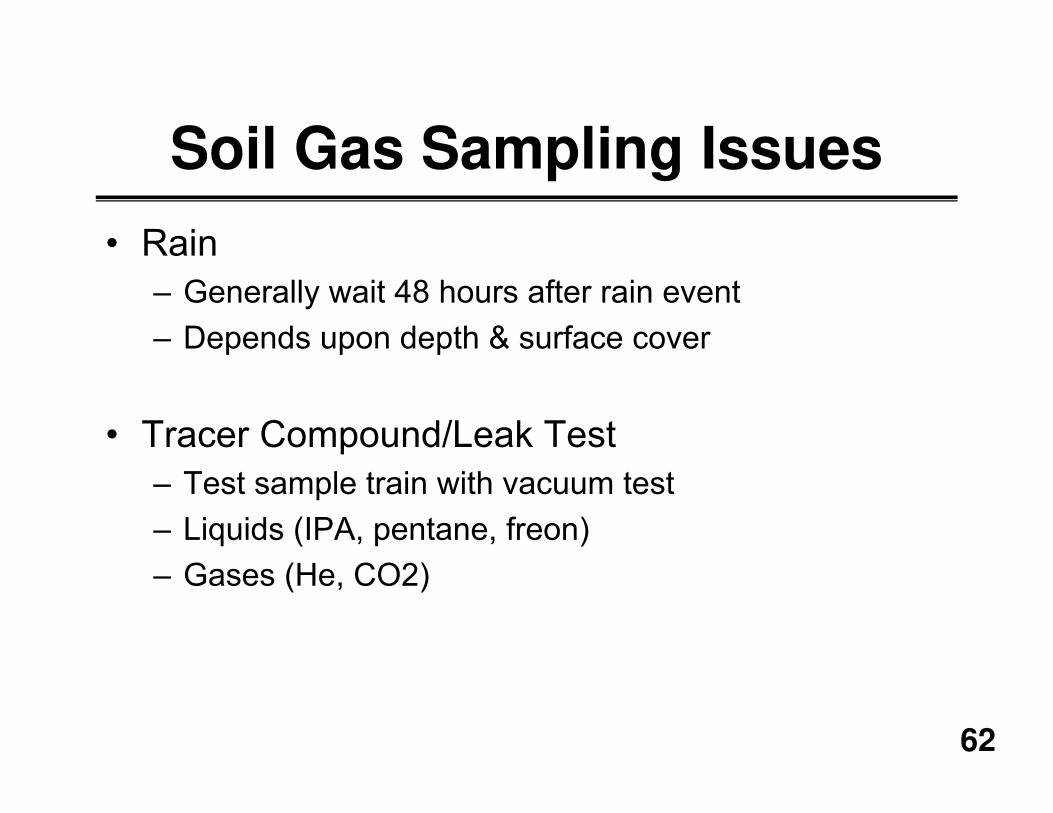
Soil Gas Sampling Issues
� Rain
– Generally wait 48 hours after rain event
– Depends upon depth & surface cover
� Tracer Compound/Leak Test
– Test sample train with vacuum test
– Liquids (IPA, pentane, freon)
– Gases (He, CO2)

63
Sample Volumes

64
Use of Tedlar Bags
Advantages offered by Tedlars:
� Many Consultants More Familiar With than Swageloks
� Easy to Fill: Perhaustalic Pump, Syringe, Lung Box
� Disposable - No Chance of Carry-over/False Positives
� Allows Repeat Analysis of a Sample if in Field
� Allows Measurement of Gaseous Tracer
� Allows On-site & Off-site Analysis of Same Sample!
65
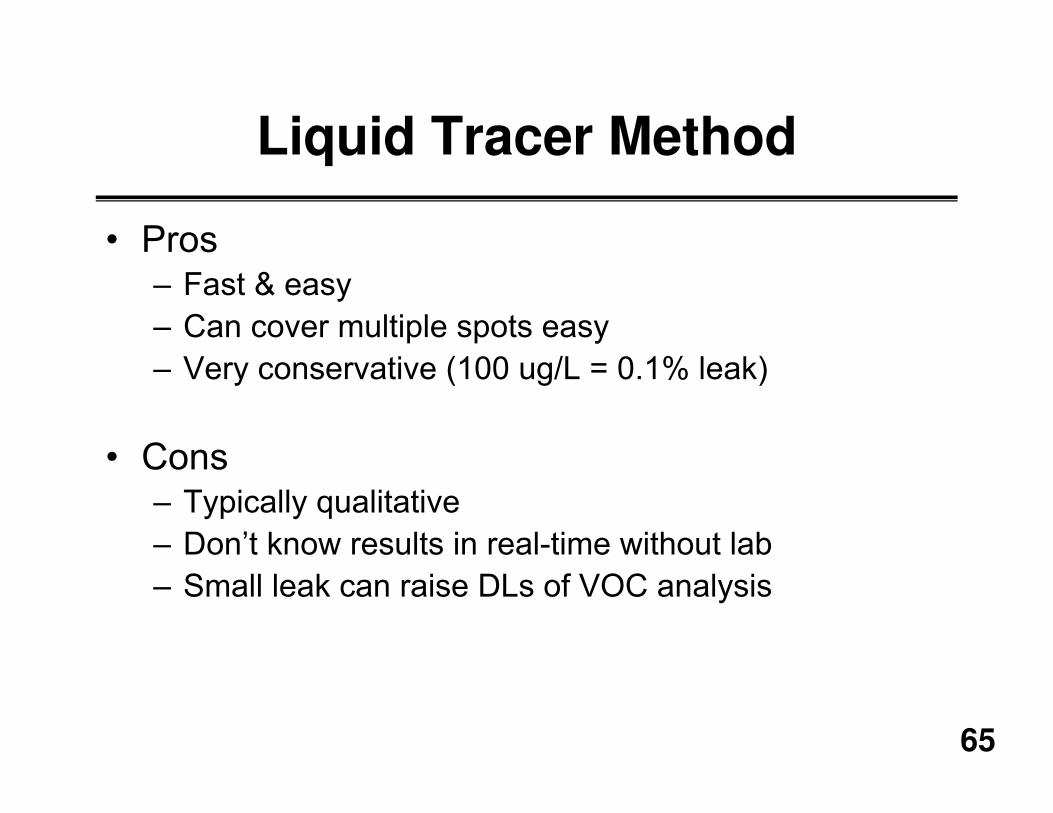
Liquid Tracer Method
� Pros– Fast & easy
– Can cover multiple spots easy
– Very conservative (100 ug/L = 0.1% leak)
� Cons – Typically qualitative
– Don’t know results in real-time without lab
– Small leak can raise DLs of VOC analysis

66
Gas Tracer Method
� Pros
– Quantitative
– Real-time results with portable meters
� Cons
– More complicated and slower. Increases costs
– Harder to cover multiple locations, esp with DP
Best Method if No Lab On-site

67
Liquid Method

68
Post-Run Tubing (PRT) Fitting

69
Gas Method
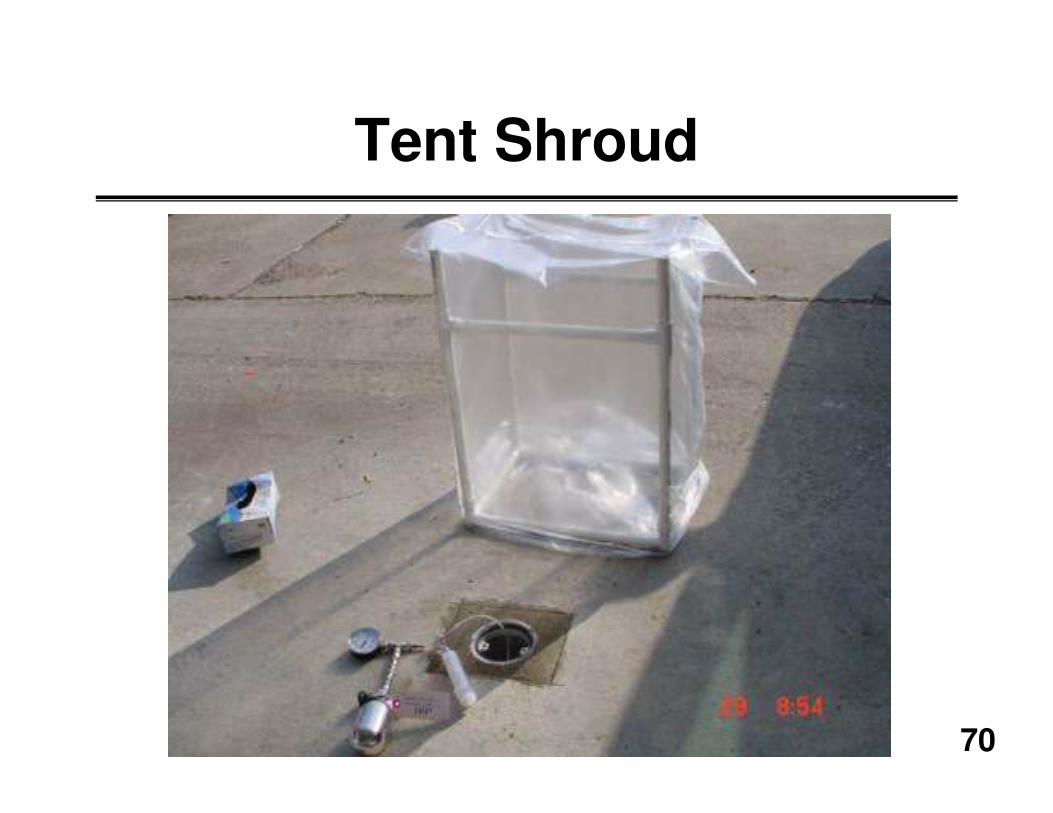
70
Tent Shroud

71
Sampling in Shroud

72
Purging with Syringe
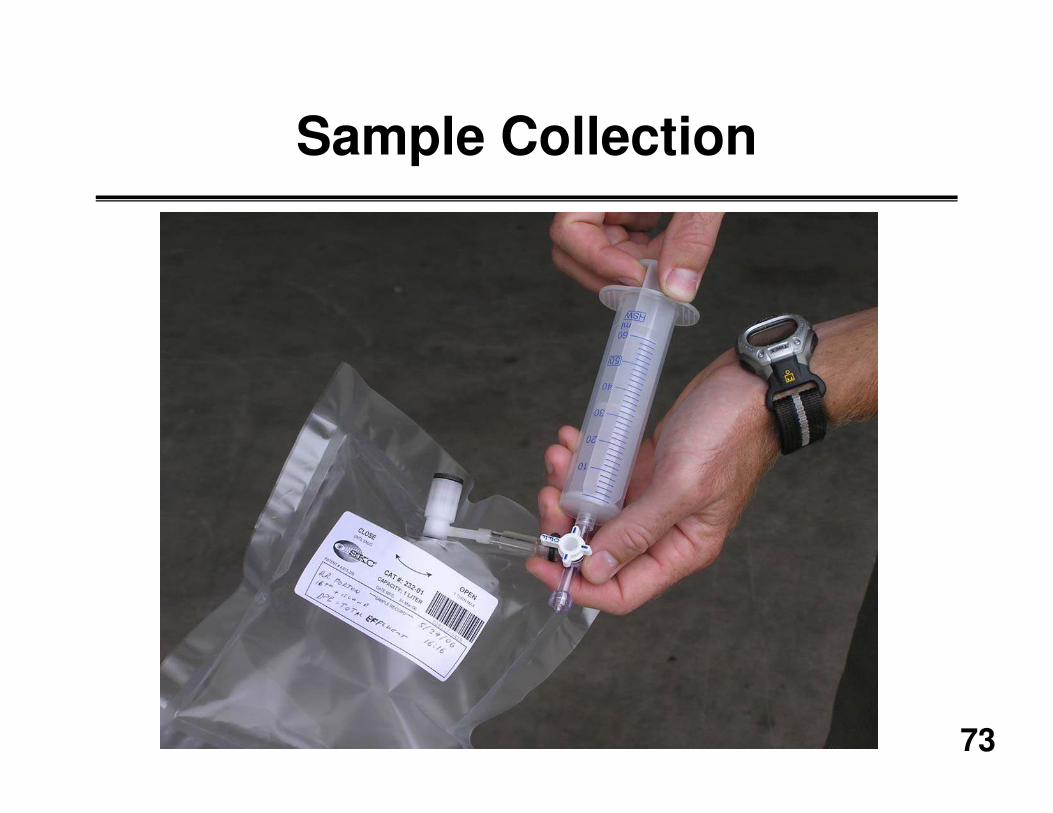
73
Sample Collection
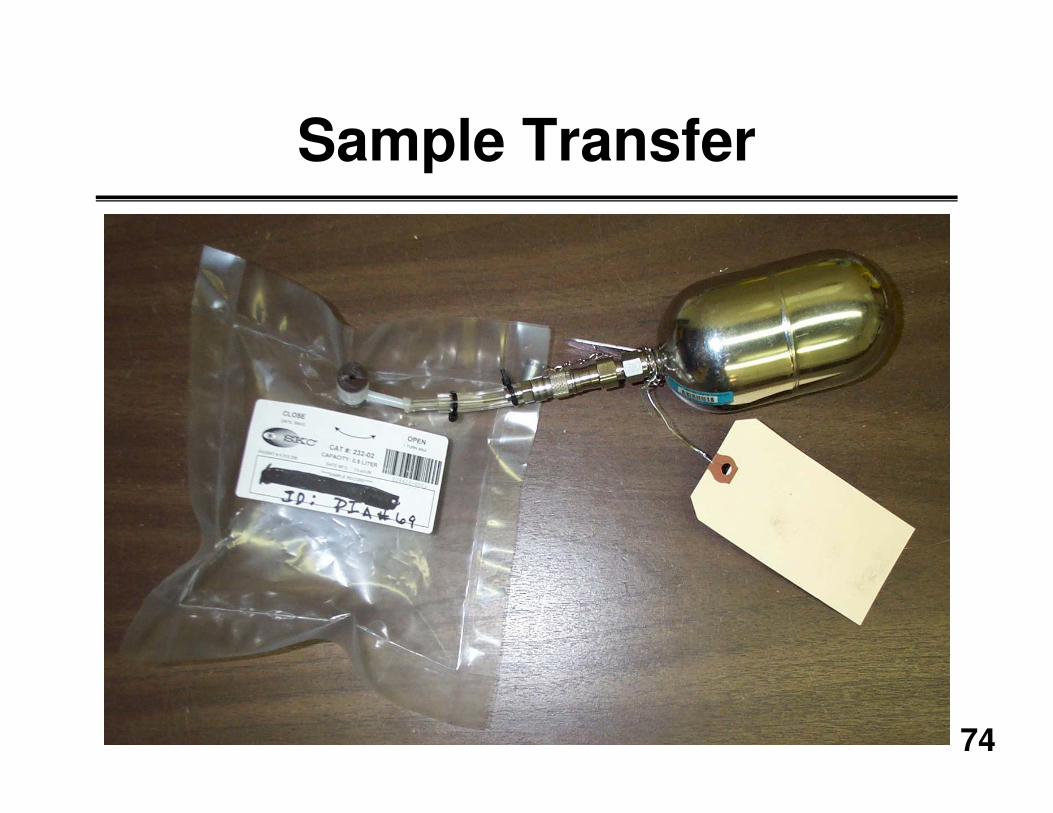
74
Sample Transfer
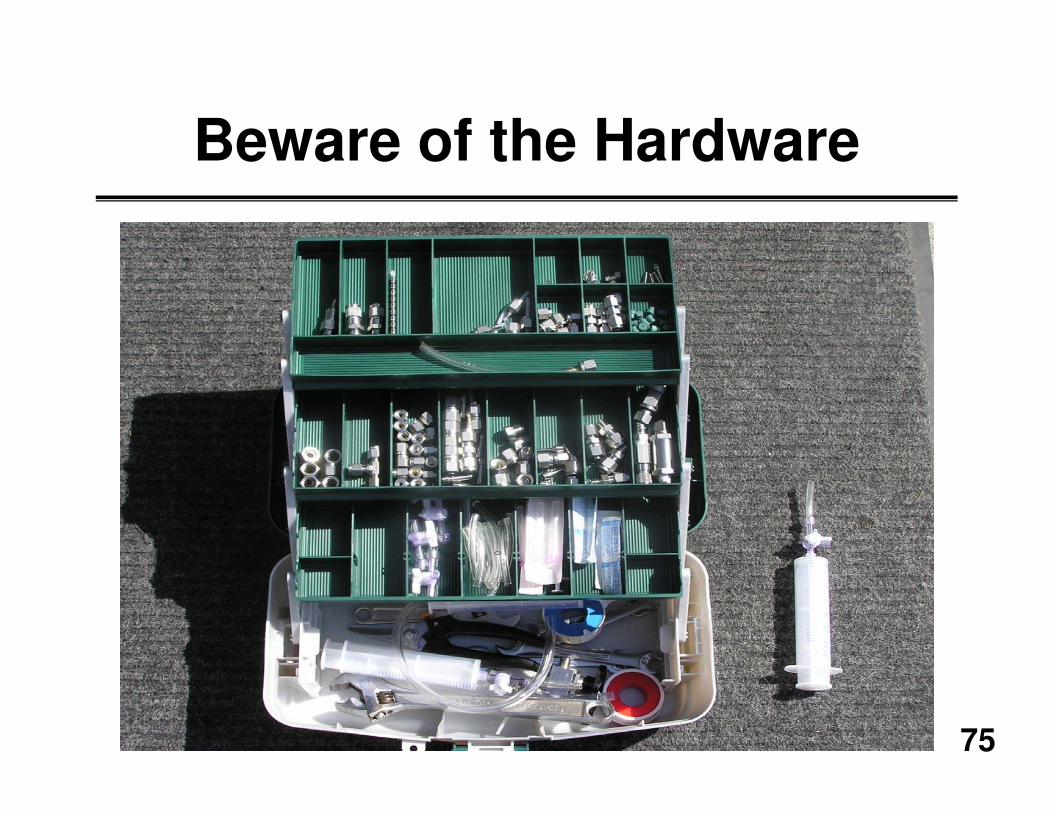
75
Beware of the Hardware

76
Sample Collection

77
SVOC Sampling

78
Some Final Sampling Issues
� Certified Clean Canisters
– Not needed if DL > 5 ug/m3
� Residual Vacuum in Canisters
– Not critical for soil gas samples
� Dedicated Flow Restrictors
– Not necessary if cleaned between samples

79
Common Soil Gas Analyses
� VOCs– Soil & Water Methods: 8021, 8260
– Air Methods: TO-14, TO-15, TO-17
� Hydrocarbons– 8015 m, TO-3
� Oxygen, Carbon Dioxide– ASTM 1945-96
� SVOCs: TO-4, TO-10, TO-13

80
Soil Gas Analysis Issues(TO-14/15 or 8260 or 8021)
� All Methods Give Reliable Results
� Detection Level Discriminator:
– TO Methods: <1 to 1 ug/m3
– 8021: 2-5 ug/m3
– 8260: 10-100 ug/m3
� On-Site Analysis:
– Extremely Helpful for VI
– Minimizes False Positives
81
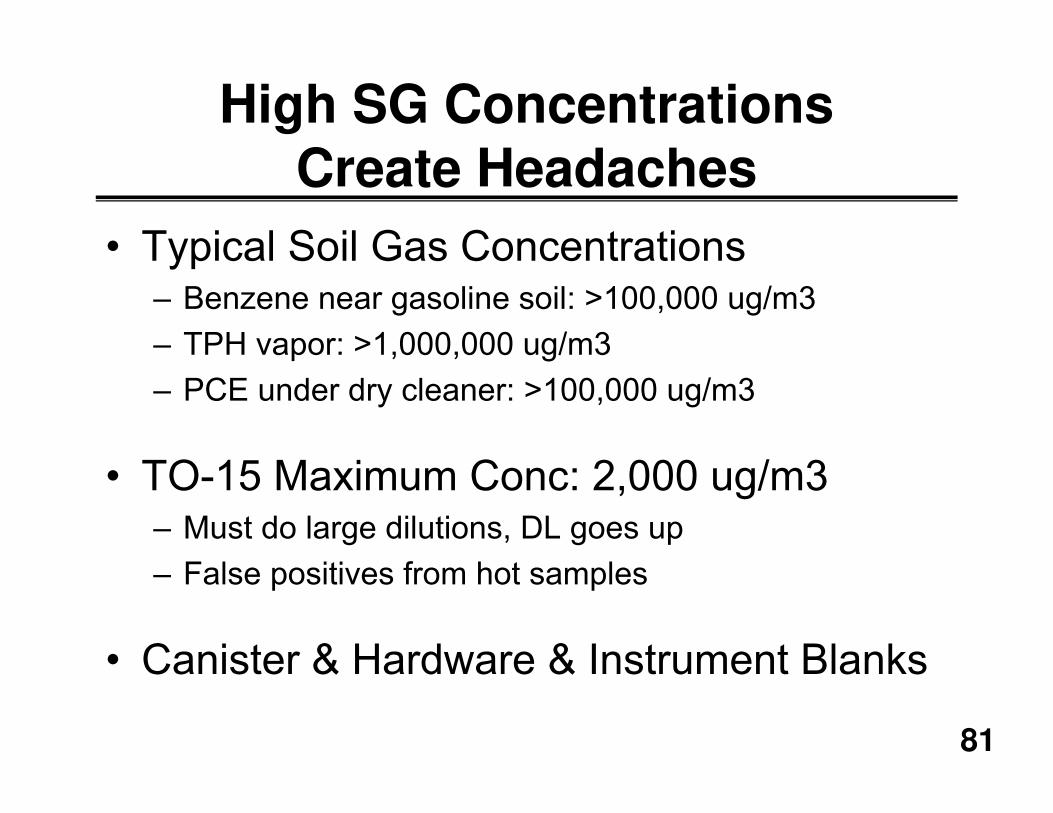
High SG Concentrations Create Headaches
� Typical Soil Gas Concentrations– Benzene near gasoline soil: >100,000 ug/m3
– TPH vapor: >1,000,000 ug/m3
– PCE under dry cleaner: >100,000 ug/m3
� TO-15 Maximum Conc: 2,000 ug/m3– Must do large dilutions, DL goes up
– False positives from hot samples
� Canister & Hardware & Instrument Blanks

82
New Advance: On-Site TO-15 Scan/SIM
� Simultaneous Scan/SIM mode enables
<10 ug/m3 for All VOCs &
~2 ug/m3 for subset of compounds.
� Only 2cc of Sample. Eliminates Hardware
� Real-time Analysis in Structures: Control!

83
Part 5: Soil Gas Sampling Strategies
� Where to Collect Samples
� Exterior vs. Interior (sub-slab)
� How Often to Sample
� Documenting Bioattenuation

84
Where to Sample - Vertically
� Generally Two Depths per Location– One of the two <3’ below foundation
– Basements: Within 5’ of wall at mid-depth
– Slabs: Within 3’ of bottom of slab
– Source below: collect below foundation
� Future Buildings– Two depths, nominally 3’ & 10’ bgs
– Just below future foundation if contamination shallow
� Shallow GW– Above cap fringe
– Just below future foundation if contamination shallow
85
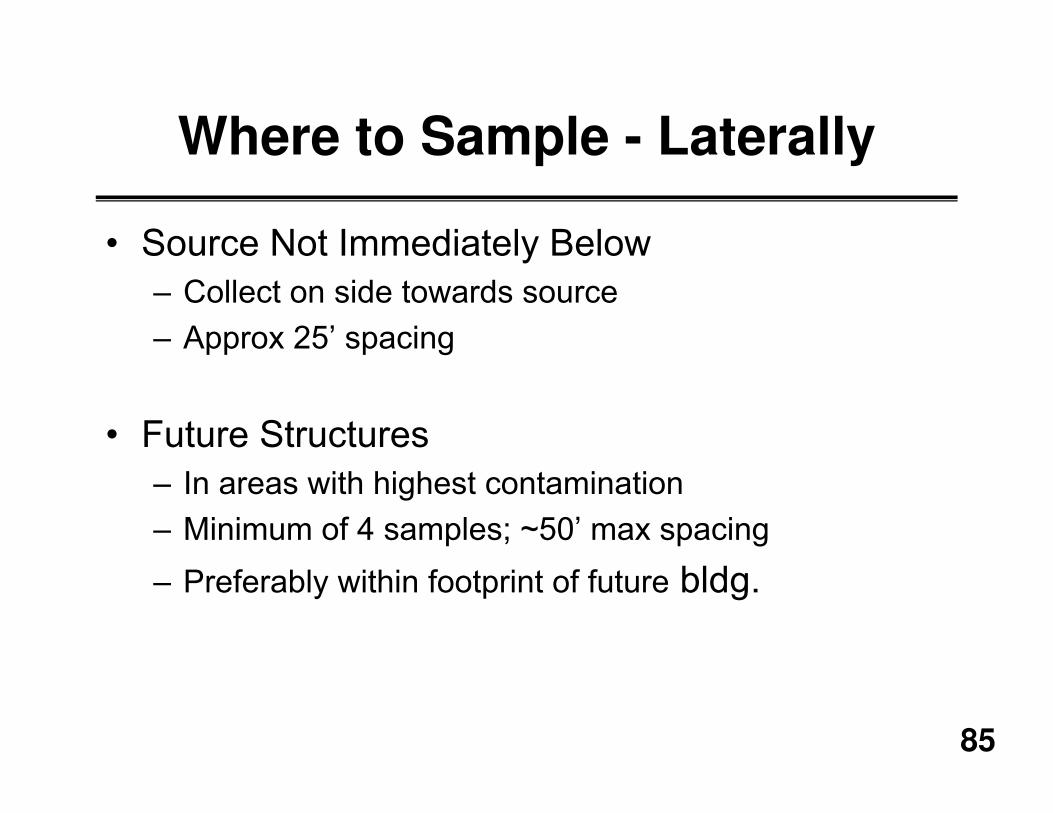
Where to Sample - Laterally
� Source Not Immediately Below
– Collect on side towards source
– Approx 25’ spacing
� Future Structures
– In areas with highest contamination
– Minimum of 4 samples; ~50’ max spacing
– Preferably within footprint of future bldg.

86
How Deep to Sample?
� Depth Below Surface
– 3’ to 5’ bgs generally considered stable
– MO allows as shallow as 18”
– Temporal Studies Ongoing

87
Probe A3 (TCE - Normalized)
0
0.2
0.4
0.6
0.8
1
1.2
1.4
1.6
1.8
2
13:5
0:0
9
10:5
0:2
6
7:5
0:4
4
4:5
1:0
4
1:5
1:4
3
22:5
3:4
6
5:4
3:2
9
2:4
3:4
7
23:4
4:0
4
20:4
4:2
2
17:4
4:3
9
14:4
4:5
7
11:4
5:1
5
8:4
5:3
2
16:0
2:0
1
13:0
2:1
8
10:0
2:3
6
7:0
2:5
5
4:0
3:1
2
1:4
3:5
6
22:4
4:1
5
7:0
6:4
1
4:0
6:5
9
1:0
7:1
9
22:0
7:5
8
19:1
1:2
5
Time (3/16/07 to 4/10/07)
Norm
alized C
oncentr
ation
Probe A3-3' (Port 9)
Probe A3-8' (Port 10)
Probe A3-17' (Port 5)
Soil Gas Temporal Study

88
How Often to Sample?
� MO Requires Minimum of Two Events
– No less than 3 months between events
– More events if data variable
– 4 events nominal, but more if necessary

8988

90
Location #9-Sub-Slab- 0.5 ft BGS
0
50
100
150
200
0 10 20 30 40 50 60 70 80
Time [d]
0
5
10
15
20
25
[v/v
%]
TPH [mg/L]
CO2 [% v/v]
O2 [% v/v]
Meteorological Effects on Soil Gas
-20
-15
-10
-5
0
5
10
15
20
42 49 56 63 70 77
Time [d]
Location 3
?
O2 and HC Concentrations800.0
850.0
900.0
950.0
1000.0
42 49 56 63 70 77 84
Time [d]
0.0
0.2
0.4
0.6
0.8
1.0
1.2
1.4
1.6
1.8
2.0
rain
fall
[m
m]
rainfall
barometric pressure
0.00
2.00
4.00
6.00
8.00
10.00
42 49 56 63 70 77 84
Time [d]
0
50
100
150
200
250
300
350
400
42 49 56 63 70 77 84
time [d]
wind direction
Wind Direction
Wind Speed
Barometric Pressure
Pressure Differential

91
Sub-Slab vs. Near-Slab Samples
?
92
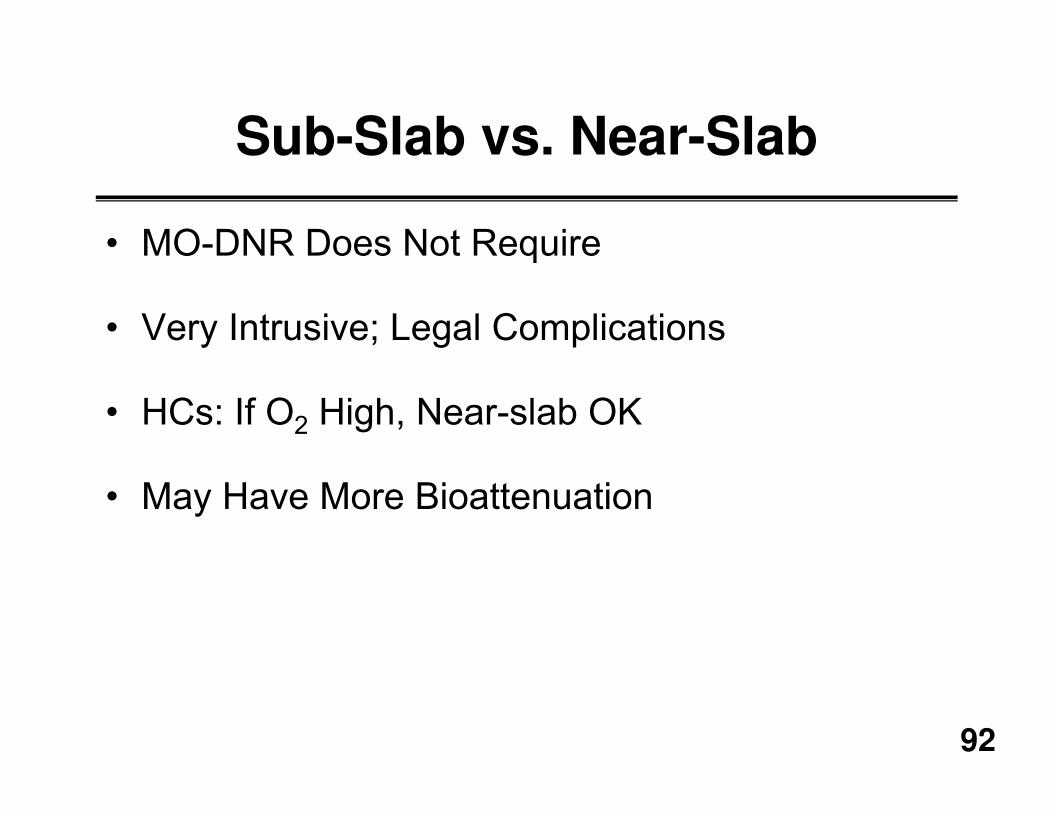
Sub-Slab vs. Near-Slab
� MO-DNR Does Not Require
� Very Intrusive; Legal Complications
� HCs: If O2 High, Near-slab OK
� May Have More Bioattenuation
93
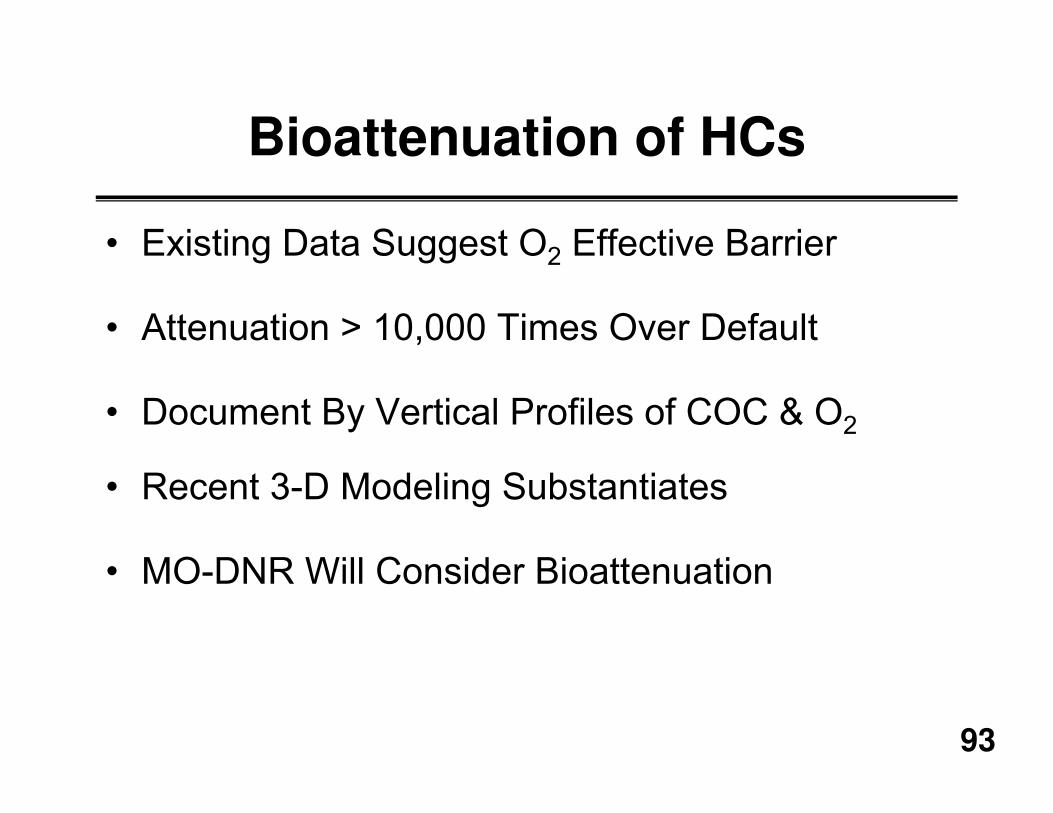
Bioattenuation of HCs
� Existing Data Suggest O2 Effective Barrier
� Attenuation > 10,000 Times Over Default
� Document By Vertical Profiles of COC & O2
� Recent 3-D Modeling Substantiates
� MO-DNR Will Consider Bioattenuation
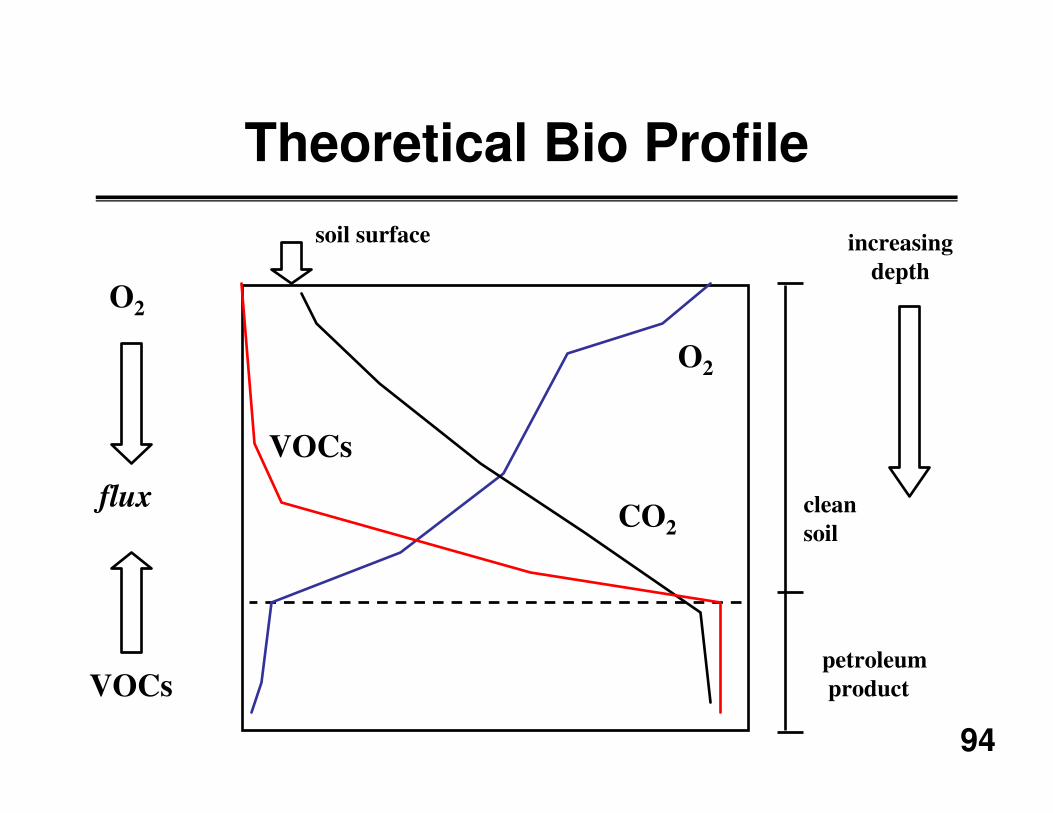
94
Theoretical Bio Profile
soil surface
O2
CO2
VOCs
clean
soil
petroleum
product
increasing
depth
VOCs
O2
flux

95
SIGNATURE CHARACTERISTICS OF BIO-ATTENUATION- 5 feet clean coarse-grained or 2 feet of fine-grained soil overlies contaminant source- Vapor concentrations decrease significantly vertically away from source- O2 depleted and CO2 enriched near the source, O2 enriched and CO2 depleted with increasing distance from the source
- O2 minimum range 3% to 5%
Sample Events and % Attenuation of
Benzene and TPHStudy Data Set Events: 102 Benzene, 71 TPH
n=# vapor sample events
0
20
40
60
80
100
120
Significant AF <0.1 Insignificant AF >0.1
n
98%
92%
2% 8%
Benzene
TPH

96
Effect of Source Concentration
Results suggest that there may be source vapor concentrations that are of little concern if soil gas beneath the foundation is well-oxygenated (e.g., groundwater plume sources)
= 0.18 h-1] = 7.1 x 10-5
= 7.2 x 10-8
= 5.6 x 10⁻¹¹
95

97
1.E-10
1.E-09
1.E-08
1.E-07
1.E-06
1.E-05
1.E-04
1.E-03
1.E-02
0.1 1 10 100 1000
Vapor Source Concentration (mg/L)
Att
en
uati
on
Fa
cto
r
L = 1 m, λ = 0.79 (1/h) L = 2 m bgs, λ = 0.79 (1/h)
L = 3 m, λ = 0.79 (1/h) L = 5 m, λ = 0.79 (1/h)
L = 10 m, λ = 0.79 (1/h) L = 1 m, No Biodegradation
L = 10 m, No Biodegradation
Effect of Vapor Source Concentration and DepthModeling Assumptions:
� Benzene source
� Sand soil
� Basement scenario
= 0.79 h-1
For NAPL sources, effect
of biodegradation on may be minimal due to
oxygen depletion
Dissolved phase NAPL
L: source-foundation distance
L = 1 m
L = 2 m
L = 3 m L = 5 m L = 10 m
Biodegradation is likely
to have a significant
effect on for non-NAPL
sources
98
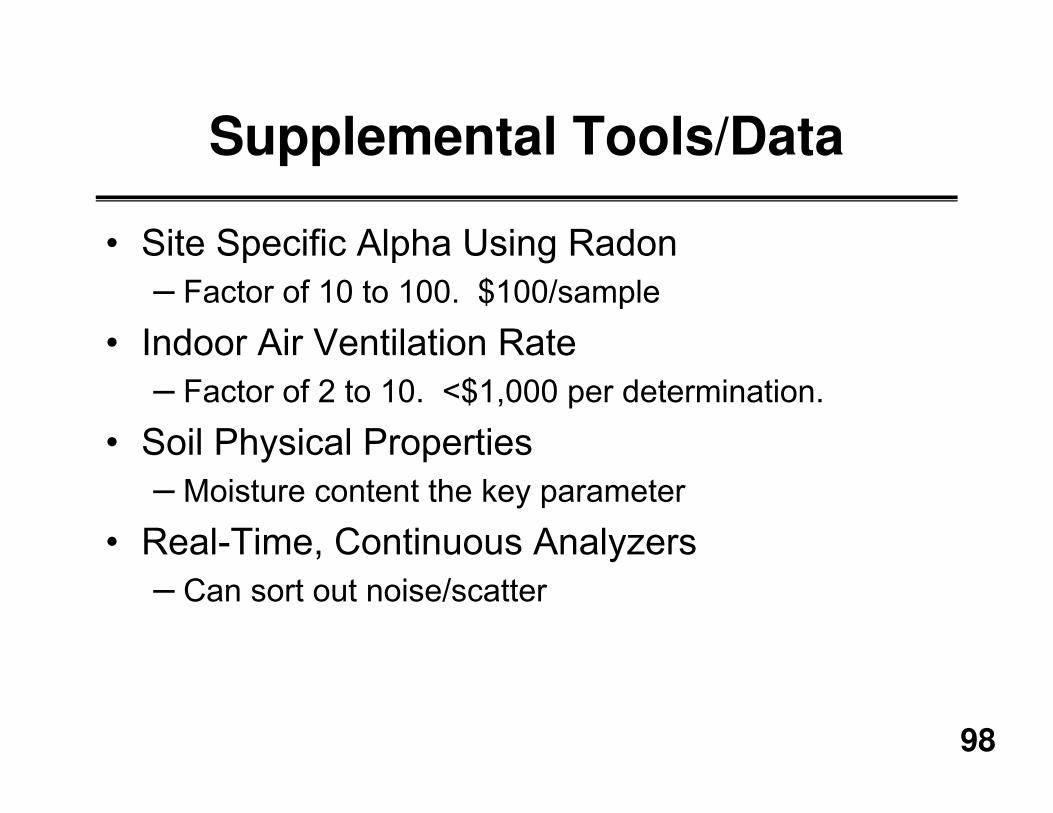
Supplemental Tools/Data
� Site Specific Alpha Using Radon
– Factor of 10 to 100. $100/sample
� Indoor Air Ventilation Rate
– Factor of 2 to 10. <$1,000 per determination.
� Soil Physical Properties
– Moisture content the key parameter
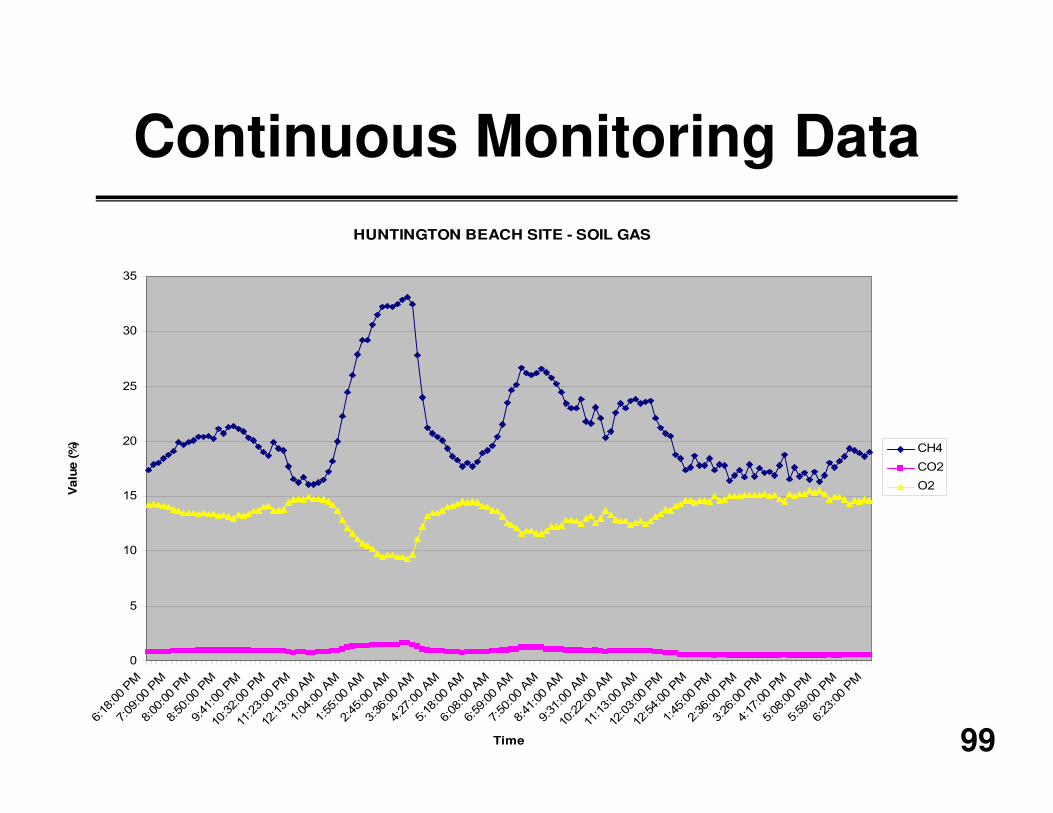
� Real-Time, Continuous Analyzers
– Can sort out noise/scatter
99
Continuous Monitoring Data
HUNTINGTON BEACH SITE - SOIL GAS
0
5
10
15
20
25
30
35
6:18
:00
PM
7:09
:00
PM
8:00
:00
PM
8:50
:00
PM
9:41
:00
PM
10:3
2:00
PM
11:2
3:00
PM
12:1
3:00
AM
1:04
:00
AM
1:55
:00
AM
2:45
:00
AM
3:36
:00
AM
4:27
:00
AM
5:18
:00
AM
6:08
:00
AM
6:59
:00
AM
7:50
:00
AM
8:41
:00
AM
9:31
:00
AM
10:2
2:00
AM
11:1
3:00
AM
12:0
3:00
PM
12:5
4:00
PM
1:45
:00
PM
2:36
:00
PM
3:26
:00
PM
4:17
:00
PM
5:08
:00
PM
5:59
:00
PM
6:23
:00
PM
Time
Valu
e (%
)
CH4
CO2
O2
100
VI Documents
� MO-DNR Soil Gas & MRBCA Guidance – http://www.dnr.mo.gov/env/hwp/tanks/mrbca-
pet/mrbca-pet-tanks.htm
� Overview of SV Methods (www.handpmg.com)– LustLine Part 1 - Active Soil Gas Method, 2002
– LustLine Part 2 - Flux Chamber Method, 2003
– LustLine Part 3 - FAQs October, 2004
– LustLine Part 4 – Soil Gas Updates, Sept 2006

101
Existing Documents & Training
� Soil Gas Sampling SOPs– Soil Gas Sampling, Sub-slab Sampling, Vapor Monitoring
Wells/Implants, Flux Chambers (www.handpmg.com)
– EPA-ORD Sub-slab SOP–Draft, Dr. Dom DiGuilio (www.iavi.rti.org/resources)
� Other – API Soil Gas Document (www.api.org/bulletins)
– Robin Davis Lustline Article on Bioattenuation
(Lustline June 2006, www.neiwpcc.org)

102
VI Websites & Links
� http://www.dnr.mo.gov/env/hwp/tanks/mrbca-pet/mrbca-pet-tanks.htm
� www.handpmg.com– Soil gas information
– Units converter
– Articles & presentations
� www.itrcweb.org
� www.api.org

103
Blayne Hartman, Ph.D.Independent Consultant, Vapor Intrusion
H&P Mobile GeochemistryCarlsbad, CA 92010
(760) 804-9678www.handpmg.com