mo rocc o south africa zambia · recent policy to produce biofuels (bioethanol and biodiesel) in...
TRANSCRIPT
UN
for C
POL
NITED NATI
UnitedProm
Climate Ch
LICY REFO
ONS ECON
d Nations Dmoting Ener
ange Mitig
MOSOUT
Z
ORMS AND
NOMIC CO
Developmenrgy Efficien
gation and S
Case study
OROCCTH AF
ZAMBIA
D REGULA
OMMISSION
nt Account pncy InvestmSustainabl
y
CO FRICAA
ATORY FR
N FOR AFR
project ments e Developm
RAMEWO
RICA
ment
ORKS
1

2
ACRONYMS Acronym Description ADEREE Moroccan National Agency for the Promotion of Renewable Energy and Energy Conservation BAU Business as usual CDM Clean development mechanism CEC Copperbelt Energy Company CFLBs Compact fluorescent light bulbs CHP Combined heat and power CO Carbon monoxide CO2 Carbon dioxide CSO Civil society organisation CTL Coal-to-liquid DoESA Department of Energy of South Africa EDC Energy Development Corporation EE Energy efficiency EEDSM Energy efficiency demand-side management EPC Energy performance contract ERB Energy Regulation Board ES Emission savings ESCO Energy Supply Company FBAE Free basic alternative energy FIT Feed-in tariff GDP Gross domestic product GHG Greenhouse gas GTA Global Trade Atlas GTL Goal-to-liquid GVEP Global Village Energy Partnership GWh Gigawatt - hour IPPs Independent power producers kWh Kilowatt - hour LEDS Low emission development strategies LHV Low heat value LEAP Long-range Energy Alternatives Planning LPG Liquefied petroleum gas LSM Living standard measure MASEN Moroccan Agency for Solar Energy MEWD Ministry of Energy and Water Development MRV Measurement, Reporting and Verification MYPD Multi-Year Price Determination MWh Megawatt - hour NEEA National Energy Efficiency Agency NERSA National Energy Regulator NREL National Renewable Energy Laboratory of United States ONEE Office National de l'Electricité et de l'Eau Potable PACE Property assessed clean energy PASASA Paraffin Safety Association of South Africa IPMVP International Performance Measurement and Verification Protocol IRP Integrated Resource Plan PPA Power purchase agreement PRSP Poverty Reduction Strategy Paper PV Photovoltaic R&D Research and development RE Renewable energy REBIDs Renewable energy bids REFIT Renewable energy feed-in tariff

3
REIPPP Renewable Energy Independent Power Producer Procurement Programme REMP Rural Electrification Master Plan RETs Renewable energy technologies RTPV Rooftop photovoltaic SADC Southern African Development Community SANEDI South African National Energy Development Institute SAPP Southern African Power Pool TNDP Transitional National Development Plan TOE Tonne of oil equivalent UNECA United Nations Economic Commission for Africa UNFCCC United Nations Framework Convention on Climate Change WHO World Health Organisation VAT Value added tax VoRE Value of renewable energy ZCCM Zambia Consolidated Copper Mines ZESCO Zambia Electricity Supply Corporation ZNFU Zambia National Farmers Union

4
EXECUTIVE SUMMARY In recent years, both developed and developing countries are paying greater attention to improving EE, mostly as the result of rising prices of electricity and the growing demand for finite and dimin-ishing fossil fuel resources. Improved energy efficiency is one of the most cost-effective ways to re-duce global greenhouse gas (GHG) emissions. It also enhances energy security of the countries by reducing energy demand. To date, energy efficiency has become one of the priority fields in the en-ergy, economic and climate change policies of many countries globally. Strategies on low-emission development make it possible for countries to advance sustainable, cli-mate-resilient development and private-sector growth while significantly reducing the greenhouse gas emissions traditionally associated with economic growth. Successful implementation of low emission development strategies (LEDS) is founded on the strategy being country-driven and which is built upon robust analyses, ranging from business-as-usual projections to financing plans. However, pro-motion of energy efficiency (EE) programs might face resistance if not practically clarified. In this study, an attempt is made to give practical examples of how this can be done, based on Morocco, South Africa and Zambia as case studies. A common feature about these countries is that poverty levels are high at 15 % of the 33 million peo-ple in Morocco, 31.3 % of the 48.4 million people in South Africa, and 60.5 % of the 14.64 million people in Zambia1. With this scenario accessibility and/or affordability becomes a problem. This is largely why in Morocco government subsidises energy consumption which for petroleum products in 2011 amounted to US$ 4.8 billion (Lahbabi 2013); in South Africa under the Free Basic Alternative Energy (FBAE) policy programme government subsidises the consumption of energy such as the 50 kWh free basic electricity, paraffin, LPG and ethanol gel fuel (Tait et al 2013); and in Zambia the government has problems to stop the forest-degrading production and use of wood/charcoal due to lack of an alternative affordable energy (Gumbo et al 2013). While most EE programs and projects tend to leave the poor in the end-user basket, this study puts the poor at the centre, for both production and use of the energy as part of the EE measures. Specifically, the EE measures for Morocco take advantage of the very favourable irradiation of more than 2300 kWh/m² per year as well as the European RE market; for South Africa measures take advantage of high direct normal irradiation averaging over 7.0 kWh/m2/day in many areas of the country and the recent policy to produce biofuels (bioethanol and biodiesel) in the country (DoESA Biofuels 2012); and for Zambia measures take advantage of the abundant use of charcoal in urban areas (Gumbo et al 2013; Mulenga et al 2013) and the available enabling environment to produce bioethanol in the coun-try. Below are results of the analysis. Morocco For Morocco, the estimated number of households in 2030 is 7,600,000 with the potential of gener-ating 26,600 Gigawatt-hours of electricity in 2030 if all housing units are installed with a 5kW solar PV system. The daily consumption per household for the 10 standard bulbs is 3 kWh while switching to compact fluorescent light bulbs (CFLBs) consumption would only be 0.54 kWh. The energy saved per household per day would therefore be 2.46 kWh, so that each household would sell 18,052 kWh per year, if all there is are CFLBs drawing on power. For an estimated capital cost for solar PV of US$ 2,750/kW (Can et al 2013), and given a US$ 0.10 feed-in tariff (FIT), this would be an income of US$ 1,805.20 per household. The investment would thus be recovered in about 7.6 years for the 5 kW solar PV systems, which looks good for a 20 – year lifespan of the system. Historical Data indicates that there were 19.54 Million Metric tons of GHG emissions from power generation in 2011. These emissions are projected to increase to 28.72 Million Metric tons in 2030 based on the business-as-usual (BAU) scenario. With a mandatory installation of solar PV systems per
1 www.cia.gov

5
household were instituted, additional 9.18 Million Metric tonnes of CO2 would be saved. Also, for every kWh of electricity generated from coal fired plants, there is 0.993 Kg CO2 – equivalent emitted (Letete et al 2007). Therefore, by use of CFLBs, each household would avoid 2.443 Kg CO2 per day. Thus, for a total 7.6 million households in 2030, 6.777 million tons Kg CO2 equivalent would be avoided in 2030 alone, due to use of CFLBs. South Africa In South Africa, the 16.7 million households projected in 20130 would have the potential to generate about 116,000 Gigawatt-hours of electricity if the policy mandates all to install 5kW solar systems. Similar to Morocco, each household would rake in US$ 1,805.20 and able to recover the investment in about 7.6 years for the 5 kW solar PV system. The second policy in South Africa would be to replace paraffin with bioethanol for cooking. On the assumption that 25 % of the 1.78 million electrified households are using 100% paraffin for cooking and that 50% of the 3.47 million non-electrified households are using 100% paraffin for cooking, bringing the total for the two categories to 2.18 million households using 100% paraffin for cooking, this would generate a bioethanol based economy of US$ 397.850 million for rural areas producing feedstocks for bioethanol, based on feedstock production cost of 50% of the bioethanol production cost. For 26.6 kWh per litre of bioethanol co-generated from bagasse and 40.6 kWh co-generated from vi-nasse, there would be a total of 67.2 kWh co-generated per litre of bioethanol produced. Assuming a US$ 0.10/kWh FIT, this would generate an additional economy worth US$ 5.35 billion in feedstock producing rural communities Historical data is up to 229.05 million metric tons in 2011 (World Bank 2014). Linear projected amount is 320.45 million Metric tons in 2030.The additional 91.4 million metric tons of CO2 would be saved if renewable energy and energy efficiency mandatory policy measures to install solar PV systems per household are instituted. By mandatory use of CFLBs in the total 16.7 million households in 2030, this would result in avoid-ance of 14.891 million tons Kg CO2 equivalent in 2030 alone, due to use of CFLBs alone. In the case of paraffin, the BAU emissions are projected to increase to 33 Metric Tonnes of CO2 equivalent in 2030. However, using Bioethanol reduces the emissions from an estimated 19.8 metric tonnes in 2012 to 3.4 metric tonnes in 2030. Zambia On the assumption that a household in Zambia uses 2.5 Kg per day per household for cooking, if 1,126,662 households are using bioethanol by 2030, the total annual bioethanol consumption would be 411,231,929 litres, based on 1 litre bioethanol charcoal equivalent consumption per household per day. Given a bioethanol producer price of US$1/litre and that 50% would be the cost of feedstock supplied by rural communities, there would be US$ 205. 62 million of annual retained economy in feedstock producing communities due to bioethanol alone. The additional economy due to power co-generation at US$ 0.10 FIT would be US$ 2.43 billion for the bioethanol producing communities in the year 2030. Together, the two would add up to 2.635 billion of annual retained economy. Under business-as-usual scenario, the GHG emissions due to charcoal use for cooking by the 1,126,662 households in Zambia would be about 140 thousand tonnes by 2030, as shown in Figure 4.12. By introducing charcoal substitution with bioethanol, the emissions would drop down to about 10 thousand tonnes. Additional policy measures Additional measures should recognise the prevailing poverty and joblessness in the three countries, the lack of affordability for the people to effectively participate in implementing the policies; the op-

6
portunities to localise renewable energy technologies especially in the wake of created increased economies of scale; and the need to for governments to use renewable industry as an opportunity for propelling citizens on the inclusive growth path. Some of these measures include offering attractive FITs, attractive mandates and producer price of bioethanol, providing incentives to lower production cost of energy, establishing local content policy, and instituting inclusive innovative financing mech-anisms for energy efficiency (EE), renewable energy (RE) and emission savings (ES). Conclusions This study has been demonstrated that by adopting a low-emission development, it is possible for countries to advance a win-win sustainable, climate-resilient development for both pro-poor and pri-vate-sector growth while significantly reducing the greenhouse gas emissions. In all cases, the EE/RE/ES programmes can be country-driven, apart from capacity building and technology transfer which may need external help. Incentives are however necessary to stimulate investment in the pro-grammes. Recommendations The EE/RE economies are low hanging fruits and support sustainable development. Therefore African countries which happen to possess either all or some of the renewable energy resources should em-bark on programmes to develop green economies. To actualise establishment of EE-based green economy, African governments should, among others, Carry out audits of the EE/ES potential for various sectors and promote investment; Concurrently promote EE/RE/ES and RE projects as these are “tri-pillars” of a sustainable energy future, and have synergetic benefits; and Particularly prioritize EE/RE/ES projects (such as residential solar PVs and biofuels) which involve the poor in the value chain as this would raise affordability by the poor, thus meaningfully promoting their access to mod-ern clean energies and participation in economic development on sustainable basis. To attract invest-ment, governments should also remove operational barriers often encountered in EE/RE/ES programs and projects. Development partners should help with networking EE/RE/ES good practices among African coun-tries, facilitating with inter-regional field visits to success-story areas to gain experiences, developing information databases which will help to improve EE/RE/ES planning and development, building ca-pacity in national/regional stakeholder institutions and key CSOs, and help to raise fund for mega projects.

7
Contents ACRONYMS ............................................................................................................................................. 2
EXECUTIVE SUMMARY ........................................................................................................................... 4
1 INTRODUCTION .............................................................................................................................. 9
1.1 Background ............................................................................................................................. 9
1.2 Why Select Morocco, South Africa and Zambia as Case Study Countries .......................... 10
1.2.1 Country briefs................................................................................................................ 10
1.2.1.1 A brief on Morocco ................................................................................................... 10
1.2.1.2 A brief on South Africa ............................................................................................. 11
1.2.1.3 A brief on Zambia ..................................................................................................... 11
1.3 Approach to the Study ......................................................................................................... 13
2 A BRIEF ABOUT THE TARGET RETs AND MARKETS ...................................................................... 13
2.1 Rooftop Solar PV for Electricity ........................................................................................... 13
2.2 Bioethanol, Charcoal and Kerosene for Cooking in Households ........................................ 14
2.2.1 Bioethanol ..................................................................................................................... 14
2.2.1.1 Using bioethanol feedstocks to economically empower rural communities ......... 14
2.2.1.2 Decentralised bioethanol refineries ........................................................................ 14
2.2.1.3 Bioethanol economics for cooking .......................................................................... 15
2.2.2 The economics of charcoal vs bioethanol for cooking .................................................. 16
2.2.3 The economics of kerosene for cooking ....................................................................... 16
2.2.3 Efficiencies and environmental issues associated with targeted cooking fuels ........... 17
2.2.3.1 Efficiencies and environmental issues associated with charcoal ........................... 17
2.2.3.2 Efficiencies and environmental issues associated with kerosene .......................... 19
2.2.3.3 Efficiencies and environmental issues associated with bioethanol ....................... 20
3 METHODOLOGIES TO ASSESS EE AND EMISSIONS SAVINGS ...................................................... 21
4 COUNTRY CASE STUDIES .............................................................................................................. 22
4.1 Morocco ................................................................................................................................ 22
4.1.1 Morocco energy sector brief ......................................................................................... 23
4.1.3 Effects of EE and climate change mitigation policies on electricity scenario ............... 25
4.1.3.1 Policy: All households must have RT solar PVs with net meters ............................ 25
4.1.3.2 Policy: All households to have RT solar PVs, net meters and CFLBs ....................... 26
4.1.4 Carbon dioxide emission savings due to residential RTPV solar system policy ............ 27
4.2 South Africa .......................................................................................................................... 28
4.2.1 South Africa energy sector brief ................................................................................... 28

8
4.2.2 Setting for solar and bioethanol based EE and climate change mitigation .................. 32
4.2.3 Effects of EE and climate change mitigation policies on electricity scenario ............... 32
4.2.3.1 Policy: All households must have RT solar PVs with net meters ............................ 32
4.2.3.2 Policy: All households must have RT solar PVs, net meters and CFLBs .................. 33
4.2.3.3 Policy: Replace kerosene with bioethanol for household cooking ......................... 34
4.2.4 Carbon dioxide emission savings .................................................................................. 37
4.2.4.1 Savings due to residential RT solar PVs policy ........................................................ 37
4.2.4.2 Savings due to replacement of kerosene by bioethanol ........................................ 37
4.3 Zambia ...................................................................................................................................... 38
4.3.1 Zambia energy sector brief ........................................................................................... 38
4.3.2 Setting for bioethanol based EE and climate change mitigation in Zambia ................. 42
4.3.3 Effects of EE and climate change mitigation policies on electricity scenario ............... 42
4.3.3.1 Policy: Replace charcoal with bioethanol for household cooking .......................... 42
4.3.3.2 CO2 emission savings due to replacement of charcoal by bioethanol .................... 44
5 ADDITIONAL POLICY MEASURES .................................................................................................. 45
5.1 Attractive Feed‐in Tariffs and Cost of Bioethanol ............................................................... 45
5.1.1 Attractive Feed‐in Tariffs .............................................................................................. 45
5.1.2 Attractive Cost of Ethanol ............................................................................................. 45
5.2 Lowering Production Cost of Energy ................................................................................... 45
5.3 Job creation and Local Content Policy ................................................................................. 45
5.4 Inclusive Innovative Financing ............................................................................................. 46
5.4.1 Soft loans ....................................................................................................................... 46
5.4.2 On‐bill repayment ......................................................................................................... 46
5.4.3 Guarantee programmes ................................................................................................ 46
5.4.4 Property‐assessed repayment ...................................................................................... 46
5.4.5 Energy service companies ............................................................................................. 46
7 DISCUSSION AND CONCLUSIONS ................................................................................................. 47
8 RECOMMENDATIONS ................................................................................................................... 48
8.1 Actions by Governments and Development Partners ........................................................ 48
8.2 Project target areas with high EE/ES impacts ..................................................................... 48
8.3 Potential EE/RE/ES programs/projects ............................................................................... 48
8.4 Financing EE/RE/ES Programs and Projects ........................................................................ 49
8.5 Technologies and R&D ......................................................................................................... 49
REFERENCES .......................................................................................................................................... 50
APPENDIX: Terms of Reference ........................................................................................................... 53

9
1 INTRODUCTION
1.1 Background Strategies on low-emission development make it possible for countries to advance sustainable, cli-mate-resilient development and private-sector growth while significantly reducing the greenhouse gas emissions traditionally associated with economic growth (Benioff et al 2011). A low emission devel-opment strategy (LEDS) articulates economy-wide development scenarios, and the policies, pro-grams, financing, and implementation plans necessary to achieve those scenarios, guided by each country’s development goals. Successful implementation of LEDS is founded on two factors:
the strategy must be country-driven, and it must be built upon robust analyses, ranging from business-as-usual projections to financing
plans. This approach often requires a fine balancing of the autonomy of a country’s economic planners and the ability of that country to access the resources necessary to conduct analyses. However good energy efficiency (EE) is to clean development, promotion of EE programs might face resistance if not practically clarified. For instance, a business case for EE needs to be demonstrated to decision makers so they understand the implications of EE programs, how EE benefits governments, people, and industry, what financing mechanisms are available, and what barriers to EE exist and how solutions are fashioned. Similarly, tools that demonstrate development impacts of LEDS would help communicate the purpose of LEDS. In recent years, both developed and developing countries are paying greater attention to improving EE, mostly as the result of rising prices of electricity and the growing demand for finite and dimin-ishing fossil fuel resources. Improved energy efficiency is one of the most cost-effective ways to re-duce global greenhouse gas (GHG) emissions. It also enhances energy security of the countries by reducing energy demand. To date, energy efficiency has become one of the priority fields in the en-ergy, economic and climate change policies of many countries globally. It has been demonstrated that energy efficiency markets are mature in developed economies (e.g. Japan, Western European coun-tries, Canada, and the US). In these countries, the energy efficiency markets are dominated by energy efficient technologies and sustainable energy efficiency services (supply and demand) because of the specific energy efficiency policy and regulatory instruments developed and implemented. These in-struments include awareness raising and information campaigns, and capacity building for energy ef-ficiency experts, financial institutions staff and government officials. Energy efficiency improvements are badly needed, also because this is the only self-financing method of reducing GHG emissions. For example, improving the operating efficiency of power utilities through institutional reforms would save Africa $2.7 billion a year (Global Harvest Initiative 2011). Furthermore, if cross-border transaction costs are harmonised and lowered, the regional power trade could save Africa US$2 billion per year in energy costs. Combined, the energy savings and trade amounts give each African country an average of US$88.24 million of business case which can be targeted for EE and emission savings investment. However, at present, financing energy efficiency is still problematic. Projects may have high in-ternal rates of return (IRR), but do not capture the attention of investors or commercial banks because most projects are small and unfamiliar to local lending institutions. Even high IRRs cannot com-pensate for the high transaction costs banks incur to undertake the due diligence for small projects and to establish political, financial and institutional support for them. In addition, many national experts know the technical fixes needed to improve energy efficiency in their municipalities, power stations or factories but they do not know how to formulate investment projects so that they meet banks rules, standards and criteria. Bearing in mind the lack of specific incentives in most of the developing coun-

10
tries to introduce the relevant regulatory, policy and institutional reforms in the energy sector, all these barriers represent a forbidding environment for realizing energy efficiency investments. A number of countries worldwide have expressed interests in adopting energy efficiency measures in sectors with high CO2 emission levels. For this project, each United Nations Regional Commis-sion selects pilot countries that are (i) giving priority to energy efficiency in their national policies and services, and (ii) seeking to participate in the project (these will be the countries with developing en-ergy efficiency markets and products). A regional approach to the project will optimize resources, create synergies and enable the building of partnerships among regional and international experts. Additional resources would have to be leveraged to replicate this project in other countries in different parts of the world. The United Nations Economic Commission for Africa (UNECA) has therefore commissioned this study to prepare three (3) national case studies of policy reforms to promote energy efficiency invest-ments. These studies are to be conducted in Morocco, South Africa and Zambia. The case studies are intended to provide valuable information for demonstration to policy makers at different levels as re-gards what direct social, environmental, and financial benefits could accrue. The proposed reforms may be economic, financial, energy pricing and tariff structure, institutional, or comparatively simple administrative reforms. The case study should contain the following elements: (a) A policy reform that has transformed one or more economically attractive investment projects into a bankable project which has been financed; (b) An assessment of the ‘scaled-up’ potential environmental, economic and financial impact of the case study for selected projects or ‘classes’ of projects including reductions of greenhouse gas emissions; and (c) Recommendations on new reforms to introduce market based energy systems based on case study.
1.2 Why Select Morocco, South Africa and Zambia as Case Study Countries For case studies, Morocco, South Africa and Zambia have been selected. 1.2.1 Country briefs 1.2.1.1 A brief on Morocco Morocco, with a population of about 33 million people, is a North African country. The country’s total area is 446,550 square kilometres, of which 446,300 square kilometres is land area and 250 square kilometres is water2. About 17.79% of the land area is arable, but only 2.6% is under perma-nent crop. Irrigated land is about 15,000 square kilometres. Total renewable water resources amount to about 29 cubic kilometres per year, giving a per capita of 428.1 cubic meters per year. Of this, 12.61 cubic kilometres is withdrawn for domestic (12%), industrial (4%) and agricultural (84%) use. Morocco’s proximity to Europe and relatively low labour costs has helped the country to build a di-verse, open, market-oriented economy. Industrial development strategies and infrastructure improve-ments, including a new port and free trade zone near Tangier, are improving Morocco's competitive-ness. Key sectors of the economy include agriculture, tourism, phosphates, textiles, apparel, and sub-components. The country’s official GDP stood at US$104.8 billion composed of 15.1% agriculture, 31.7% industry and 53.2% services. Despite Morocco's economic progress, the country suffers from high unemployment which now stands at 9.5%, poverty (15% below poverty line), and illiteracy, par-ticularly in rural areas. In 2011 and 2012, high prices on fuel - which is subsidized and almost en-tirely imported - strained the government's budget and widened the country's current account deficit. In the fall of 2013, Morocco capped some of its fuel subsidies in an effort to gradually reduce the country’s large budgetary deficit. Among the key economic challenges for Morocco include reform-ing the government's costly subsidy program. 2 www.cia.gov/library/publications/the‐world‐factbook/geos/mo.html

11
As of 2010, Morocco produced about 21.13 billion kWh of electricity while its consumption stood at 23.61 billion kWh, and the rest had to be imported. In 2011, the carbon dioxide emissions from con-sumption stood at 43.71 million tonnes. Morocco’s per capita GHG emissions stand at 2.8 tCO2/year, but more than half of these is due to the energy sector, mainly from coal and fossil oil based economic activities and power generation (Lahbabi 2013). Morocco intends to increase its current 6 million tonnes per annum of coal imports by 3.5 million tonnes by 2017, in order to meet demand from a 1320 MW coal-fired power plant3. The country has three coal-fired power plants, which produce 26.7% of the country’s total generating capacity, and wants to meet local consumption using thermal power, and export renewable energy to the Euro-pean Union. 1.2.1.2 A brief on South Africa South Africa, with a population of about 48.4 million people, is a member state in the Southern Afri-can Development Community (SADC). The country has an area of 1,219,090 square kilometres, of which land is 1,214,470 square kilometres and water 4,620 square kilometres. South Africa has 9.87% of arable land, but only 0.34% is under permanent crop and 16,700 square kilometres is under irriga-tion4. The total renewable water resources amount 51.4 cubic kilometres, from which fresh water withdrawals is total 12.5 cubic kilometres per year for domestic (36%), industrial (7%) and agricul-ture (57%). The per capita withdrawal was 271.7 cubic metres per year in 2005. South Africa is a middle-income, emerging market with an abundant supply of natural resources; well-developed financial, legal, communications, energy, and transport sectors and a stock exchange that is the 16th largest in the world. In 2013, the estimated official GDP of South Africa stands at US$534 billion, compose of 2.6% agriculture, 29% industry (29%) and 68.4% services. Even though the country's modern infrastructure supports a relatively efficient distribution of goods to major urban centres throughout the region, unstable electricity supplies retard growth. Unemploy-ment (25%), poverty (31.3%), and inequality - among the highest in the world - remain a challenge. Official unemployment is at nearly 25% of the work force, and runs significantly higher among black youth. The country’s labour force is about 18.54 million people, with 9% employed in agriculture, 26% in industry, and the remainder 65% in services. Eskom’s construction delays at two additional power plants have placed South Africa at operating on a razor thin energy margin; economists judge that growth cannot exceed 3% until those plants come on line. The current government faces growing pressure from special interest groups to use state-owned enterprises to deliver basic services to low-income areas and to increase job growth. According estimates, in 2011 South Africa emitted 461.6 million metric tonnes of carbon dioxide from consumption of energy. 1.2.1.3 A brief on Zambia Zambia, with a population of 14.64 million people, is a member of SADC. The country has an area of 752,618 square kilometres of which land is 743,398 square kilometres and water covers 9,220 square kilometres. Only about 1.5 million hectares (0.04%) out of 42 million hectares of the country’s arable land are cultivated every year5. Zambia has currently over 40% of Southern African fresh water with an irrigation potential estimated to be 2.75 million hectares based on water availability and soil irriga-bility (ZNFU 2014). From this potential it is estimated that 523,000ha can be economically devel-oped. However only 340,000 hectares of land is irrigated, which is about 65 % of the economical irri-
3 www.worldcoal.com/news/coal/articles/Morocco_set_to_increase_coal_imports_69.aspx#.U3pX49KSy6c 4 www.cia.gov 5 ZDA. 2011. “Agriculture, Livestock and Fisheries - sector profile 2011”. Published by Zambia Development Agency.

12
gation potential leaving a total of 183,000ha yet to be developed. Of the 340,000 hectares, commercial irrigation is slightly above 70,000 ha while emergent and small-scale irrigation is about 270,000 hec-tares. Zambia is a tropical country modified by altitude and rainy season. In 2011, Zambia’s total renewable water resources stood at 105.2 cubic kilometres. In 2002, fresh water withdrawals were estimated at total 1.57 cubic kilometres comprising of 18% for domestic use, 8% for industry and 73% for agri-culture, while the per capita withdrawal, was 47 cubic meters per year. Zambia's economy has experienced strong growth in recent years, with real GDP growth in 2005 - 13 more than 6% per year6. In 2013, the GDP was 22.24 billion, composed of 19.8% agriculture, 33.8% industry and 46.5% services. Despite a strong economy, unemployment (15%) and poverty (60.5% below poverty line) remain significant problems in Zambia, the latter exacerbated by a high birth rate, relatively high HIV/AIDS burden, and by market distorting agricultural policies. The current major sources of energy in Zambia include mainly biomass, hydropower, and petroleum products. Despite Zambia’s vast hydro and biomass resources, the country is currently experiencing power shortages. Biomass accounts for about 77% of the nation’s energy needs while hydropower contributes about 12%. The carbon dioxide emissions from consumption of energy in 2011 were estimated to be 2.434 mil-lion tonnes. In summary, Morocco, South Africa and Zambia are countries with diverse natural resources, geo-graphical locations, and economic opportunities. However, what is common to all of them are high unemployment and poverty levels despite their relatively good performance in terms of GDP, as shown in Table 1.1.
Table 1.1: A summary of poverty and energy access indicators for case study countries7
Country
Pop
ula
tion
(M
illio
n) Total
Area (Million
Ha)
Land Area(Million
Ha) Un
em-
plo
ymen
t (%
)
Poverty Below Datum Line (%)
Electrification (%)*
Population Without
Electricity (%)*
Morocco 33 44.655 44.63 9.5 15 99
(100 urban, 97 rural)
0
South Africa
48.4 121.909 121.447 25 31.3 85
(96 urban, 67 rural)
8
Zambia 14.64 75.262 74.34 15 60.5 22
(51 urban, 3 rural)
11
(SOURCE: *www.worldenergyoutlook.org) Therefore poverty and unemployment have to be considered when suggesting policy measures for energy efficiency and emission reductions of greenhouse gases. The prime questions are how citizens can take advantage of the broadly available natural resources in their respective countries to partici-pate in power generation, not only to improve their affordabilities (or household economies) but also accessibility to electricity using energy markets as an opportunity. Enabling of citizens to get involved in power generation (or clean fuel production), play a role in energy markets, and access to affordable modern energy will contribute to poverty reduction as well as inclusive growth.
6 www.cia.gov 7 www.cia.gov

13
Apart from a compelling, rather than voluntary, policy for identified players, it will require govern-ments to put in place financing arrangements which those players that cannot afford their own invest-ment can access and pay back over time, since there would be assured markets for the power gener-ated (or fuel produced).
1.3 Approach to the Study Chapter 2 identifies and briefly describes the renewable energy technologies (RETs) targeted for the case study for each of the three countries Morocco, South Africa and Zambia; Chapter 3 describes the method(s) used to analyse energy efficiency and greenhouse gas emissions (GHGs) in the three coun-tries; Chapter 4 describes the energy sector of the case study countries, brief characterisation of en-ergy efficiencies of the target energy producing or consuming areas, and the resulting savings of en-ergy and greenhouse gas emissions; Chapter 5 gives additional policy measures to cement the promo-tion of investments in EE/RE/ES activities; Chapter 6 discusses results and presents conclusions, while recommendations are given in Chapter. 2 A BRIEF ABOUT THE TARGET RETs AND MARKETS Below is a brief description of the renewable energy technologies (RETs) targeted for the case stud-ies.
2.1 Rooftop Solar PV for Electricity A solar panel is a set of solar photovoltaic modules electrically connected and mounted on a sup-porting structure. A photovoltaic module is a packaged, connected assembly of solar cells. A single solar module can produce only a limited amount of power, and therefore most installations contain multiple modules. A photovoltaic system typically includes a panel or an array of solar modules, an inverter, and sometimes a battery and/or solar tracker and interconnection wiring. The number of solar panels depends on the solar installation goals, the roof size, the solar module efficiency and the budget. The efficiency of solar PV panels refers to the proportion of total sunlight falling on the panel that is captured and converted into electricity (Climate Commission 2013). The efficiency of a module de-termines the area of a module given the same rated output. For example, an 8% efficient 230 watt module will have twice the area of a 16% efficient 230 watt module8. Currently the best achieved sun-light conversion rate (solar module efficiency) is around 21.5% in new commercial products. The panels can cover an entire roof and can be designed to meet a desired electrical consumption (kWh) offset or be off the grid completely. Most of the growth in solar PV capacity has been in the residential sector. In South Africa, the Eskom estimated capital cost for solar PV is US$ 2,750/kW (Can et al 2013). Estimates for other RE technol-ogies per kW are Solar CSP (US$ 5,802), wind (US$ 3,258), and Nuclear (US$ 6,131 with fuel cost of US$ 6/MWh). Compare these costs with coal-based power investment at US$ 2,940 with fuel at US$ 20/MWh). There are no direct greenhouse gas emissions from generating energy with solar energy systems. One MWh of solar-derived electricity avoids about one tonne of CO2, when displacing fossil fuel-based electricity (Climate Commission 2013). At the point of electricity generation a 1.5 kilowatt (kW) solar PV system avoids around 2.2 tonnes of CO2 emissions each year. Solar energy already provides, or contributes to, a continuous supply of electricity in many parts of the world because solar energy can be used during the day and captured for use by solar energy sys-
8 http://en.wikipedia.org/wiki/Solar_panel
14
tems at night. Solar hot water systems have in-built heat storage in the form of hot water tanks. For household-level systems, batteries can be used to store excess solar energy for later use. If accessible, the grid can serve as a back-up option. In such cases, many households therefore feed extra power into the electricity grid when they generate an excess, and can then draw power from the electricity grid when the sun goes down. Industrial-scale solar storage is also already in use in a number of places in the world. Solar energy systems work well with a diverse range of other renewable energy sources, such as wind, where the resource may be available at different times and locations, depending on weather condi-tions. By having a diversified energy mix, reliable electricity supply is more easily provided, as illus-trated in Box 2.1 for Germany. The variability of solar energy can also be effectively smoothed by many solar energy systems over larger areas generating electricity at different times. While the output of a single panel may vary significantly minute to minute, when the output of many panels is summed over an area the output varies much less over time. The sun does not always shine, but with effective storage, grid management and a broad electricity grid, a continuous supply of solar power can be achieved. Box 2.1: German leads the world in solar power installed capacity (Climate Commission 2013) Germany receives less sunlight than Morocco, South Africa and Zambia, but has more installed capacity (7,600 MW) than any other country in the world due to a significant program of policy support. At maximum performance on sunny days, the country has generated enough solar electricity to supply about 35% of the nation’s electricity needs, and still maintains grid stability. Solar power generation in Germany coincides with peak daytime electricity demand, when electricity prices are also at their highest. In recent years the increase in Germany’s solar power generation has resulted in reductions in electricity prices for large-scale users, because solar-based electricity can be used instead of electricity from more expensive sources during peak demand periods.
2.2 Bioethanol, Charcoal and Kerosene for Cooking in Households 2.2.1 Bioethanol Bioethanol (also known as ethyl or grain alcohol) is a clear, colourless liquid that can be produced by the fermentation of virtually any source of sugar (such as sugarcane and sweet sorghum) or starch (such as cassava and corn). Cellulosic biomass (e.g. grasses, woody crops, and organic wastes) can also be used to produce bioethanol through advanced processing techniques. Bioethanol, is an equivalent of gasoline used in transport vehicles. Apart from transport vehicles (cars, light trucks, motor cycles and aeroplanes), bioethanol is also used in clean cookstoves, fridges, elec-tric generators and lanterns. 2.2.1.1 Using bioethanol feedstock to economically empower rural communities Feedstock for producing bioethanol can be those suitable to agro-climatic conditions in rural areas, taking into account yields and the economics of their production as well as co-products to elevate backward and forward linkages to increase wealth and jobs in the production areas. As feedstock pro-duction is about 40% to 70% of the cost of producing a litre of bioethanol, a large part of the bioetha-nol production economy would rest with ordinary people if they are directly involved/contract to pro-duce feedstock. 2.2.1.2 Decentralised bioethanol refineries For processing, there are off-shelf decentralised modular bio-refineries that come complete with hy-drolysis, fermentation, distillation and dehydration units all assembled together to produce high qual-ity 200 proof (100%) fuel grade ethanol. The plant is modularly expanded as feedstock availability,

which mlittle as 511 tons o Electricisorghum(LHV) atics of b
Therefoexcess e 2.2.1.3 Bioethanbioethanlined caitself is eto the alusers woAlso, it i BioethanUS$30 tstove haon low, average only 4 li A consewhile thcookstov
9 Accentu10 http://w11 Boma 12 http://s13 http://w14 http://w
minimises sta500 litres peof sweet sorg
ity is also com) during prare 17-18 MJiogas from v
ore, bioethaelectricity s
Bioethanol enol can be unol Clean Coanisters to stoeasily storedlcohol, and tould receiveis easy to ke
nol clean coto US$60, deas a fuel tank
and the stovuses 1 litre
itres of bioet
ervative estimhat of the aves can prov
ure. 2012. “Bwww.projectgAS. 2012. “P
stoves.projectgwww.projectgwww.projectg
art-up costs aer day (a dailghum, or 6 to
o-generated frocessing of J/kg dry basivinasse are 2
Figure 2.1:for e.g. suga
anol producsold to the g
economics fused in cleanookstove (CCore bioethan
d and does nothe jerry cane instructionsep pots clean
ookstoves geepending on k of 1.2 litresve costs aboper day for
thanol used p
mate puts thealuminium-b
vide families
Brazil Feasibiligaia.com/pageroject to promgaia.com/files
gaia.com/pagegaia.com/blog/
as well as impy equivalentons of sugarc
from vinassebioethanol (
is (db) and y1-22 MJ/Nm
Bioethanol parcane/sweet s
ers would ngrid.
for cookingn cookstovesC) stove mannol, minimiziot deterioratenes are clearls on how to n with relativ
enerally comwhether it iss which can out US$6711.cooking for
per week to c
life of the stbody CC at decades of c
ity Study - Int.php?page=ga
mote the use ofs/DometicClea.php?page=ga/2012/07/11/w
prove profitat of 3 tons ofcane).
e and bagass(Figure 2.1)
yields 4.7-5.0m3, yielding 5
processing andsorghum feeds
not only ea
s made of stnufactured bying fire hazae in storage. ly labelled. Astore their e
vely little soa
me with one s locally manburn for abo. In Brazil, a
r a family ofcook meals fo
tainless steel6 years14.
clean cooking
tervention Opallerybrazil#imf ethanol as a anCookBROCallerybrazil#imwhat-is-the-lif
ability. Econf fresh cassav
e (for feedst. Bagasse ch
0 kWh/kg db5.8-6.1 kWh/
d electricity costocks (Sweet
arn money f
tainless steely the Swedishards due to sEthanol fuelAlong with tethanol, espeap after using
or two-burnnufactured orout 4.5 hoursa 2-burner s
f five12. Therfor a family o
l clean cooksIn reality, wg.
ptions”. Globamg/gallery/branew househo
CH2010.pdf mg/gallery/brafe-of-a-cleanco
omical produva, or 1.25 to
ock such as haracteristics
b (Sweethano/Nm3.
o-generation thanol 2011).
from bioeth
l or aluminiuh company Dspillage or leis denatured
training on secially with g them on a C
ners. A 2-bur imported. Is at maximumstove costs are are reporteof seven (7)13
stove (CC) atwhen prope
al Alliance forazil/PonteNovld fuel for Nig
azil/ReginaSalook-stove/
uction rates cons of dry ca
sugarcane as for low he
ol 2011). Cha
hanol but al
um. SpecificDometic AB eakage9. Thed, a blue dyestove usage achildren are
CC stove10.
urner CC cosIn Nigeria, a m heat, up toabout US$60ed Brazilian3.
at more than erly cared fo
r Clean Cookva9.jpg geria”. March
linasFamily.jp
15
can be as assava, or
and sweet eat value aracteris-
lso from
cally, the has fibre
e ethanol e is added and care, e around.
sts about 2-burner
o 9 hours 0, and on
cases of
10 years, or, clean
stoves.
h 2012.
pg
16
In Zambia, the government has set bioethanol producer price at US$1.00/litre. Since government cur-rently does not collect tax from charcoal producers, but will at least be able to collect VAT from bio-ethanol production value chain, government could authorize the buying of bioethanol for charcoal use at this price. This would then be equivalent to what charcoal users spend today, and may thus make bioethanol competitive when benefits of clean cookstoves and bioethanol industry are considered. 2.2.2 The economics of charcoal vs. bioethanol for cooking In Zambia, a large charcoal brazier (mbaula) costs US$3.6 and has a lifespan of 18 months, while a medium charcoal brazier (CB) costs about US$2 with a lifespan of 12 months. To compare the costs, a 2-burner CC costing US$30 to US$60 with 10-year minimum lifespan is equivalent to 2 small CBs together costing US$4. At 1 year lifespan, a family would spend US$40 on CBs in 10 years for constant Dollar strength and CB costs, and would break-even at 7.5 to 15 years of CC lifespan. In Zambia, charcoal usage costs about US$32 per month15. This is almost 1 US$ cost for charcoal per day per household. For example, with more than 210,000 households depending 100% on charcoal for cooking in Lusaka alone16, it means there is a daily market of more than US$210,000 per day, or an annual market of US$76,650,000 per year. 2.2.3 The economics of kerosene for cooking In South Africa, not only one energy carrier is used solely, rather a range of energy carriers are used in low-income communities (PASASA 2012). About 3.4 million households do not have access to electricity and rely on candles, paraffin and firewood for energy. This translates to about 25% of households, of which one-third informal households and two-thirds formal households (PASASA 2012). In 2012, about 57% of low-income households surveyed used paraffin for cooking and 23% used electricity for cooking. When looking at heating, 46% of households surveyed used paraffin and 18% used electricity (with a similar percentage using wood). In a study by the Department of Energy of South Africa (DoE Energy Perceptions 2013), it was found that cooking represents one of the most energy-intensive applications in South Africa, and about 77% of households in South Africa use electricity as the main energy source for cooking. For non-electri-fied households, firewood (54%) and paraffin (38%) predominate as the main energy source for cooking purposes. The energy needs of poor households in South Africa are still inadequately met. The electrification programme has slowed (annual connection rates are now half of those a decade ago) and the original goal of universal access by 2014 is not feasible (Tait et al 2013). The quantity of paraffin used for cooking by the average household that uses paraffin as its primary source of cooking is 5.1 litres per week, or 20.4 litres per month (Smith et al 2013). In terms of appli-ance costs, legal stoves retail for about R100 (about US$10) whereas the illegal ones appear to range between R85 and R100 (Tait et al 2013). In terms of the cost of cooking in South Africa, electricity is currently the cheapest, followed by paraffin and then by liquid petroleum gas (LPG). However, many households actually use paraffin heaters with which to cook, which cost about R400 (US$40). This is more than either an electric two-plate or an LPG stove. Lack of affordability of appliances does not therefore seem to be a major constraining factor. Rather, it is the space heating co-benefit that paraffin stoves and heaters offer households. It means that spending on fuel for space heating is reduced; com-pared to if a household were using electricity or LPG, neither of which offer such a co-benefit. The various energy sources are very useful in the home, but they are also potentially dangerous if they are not used safely and appropriately. South Africa has high rates of energy-related accidents in the
15http://www.cph-nuernberg.de/fileadmin/user_upload/projekte/zambia/JTCR_Pressemitteilungen/Basic_needs_Basket2012.pdf. 16 Central Statistical Office, 2010 Population Census.

17
home, which cause emotional, financial and physical damage to many families and communities (PASASA 2012). Whilst India, for example, has a mandatory efficiency requirement for paraffin burners as 55%17, there was no standard for South Africa found in literature by this author, and users could therefore be using mixed standards, some of which could be very inefficient. 2.2.3 Efficiencies and environmental issues associated with targeted cooking fuels Inefficient cooking methods are not a trivial problem as about 2 billion cook in rudimentary stoves or over open fires. Energy conservation, green energy generation and reducing indoor air pollution are global mandates now, not just needs. The relevance of improved cooking stoves is so encompassing that it can address at least 5 of the 8 Millennium Development Goals that the United Nations is working to meet by 2015. The following are some statistics about the magnitude of the situation18’19:
Carbon dioxide, methane and nitrous oxide, are present in biomass stove emissions; Black carbon, which results from incomplete combustion, is estimated to contribute the
equivalent of 25 to 50 % of CO2 warming globally; Methane emissions are the second largest cause of climate change after carbon dioxide; About 18% of the problem of carbon emissions is caused by stoves; Indoor air pollution is the fourth leading health risk in developing countries; There are premature deaths estimated at 1.6 million people each year due to indoor air pollu-
tion, with the most affected being women and children; and Cooking with wood/charcoal depletes 10% of wood harvested from the world’s forests.
It is therefore clear that inefficient household energy use has adverse consequences for the environ-ment, air quality and human health. There are environmental issues associated with the production and use of bioethanol, charcoal and kerosene cooking fuels. These are briefly discussed here. 2.2.3.1 Efficiencies and environmental issues associated with charcoal Harvesting of wood from forests in Zambia for wood/charcoal energy is largely under poor forest management practices and therefore unstainable, such that areas remain deforested. Consequently, the biomass originating from forests can be considered non-renewable (Chidumayo 2005). The total wood biomass in virgin miombo woodlands of central Zambia is estimated at 90 tons per hectare, on average consisting of 90% cord wood suitable for charcoal production and 10% small stems and twigs (Chidumayo 2005). This amount reduces substantially depending on subsequent na-ture and period of regrowth. Rotation periods for regrowth miombo depend on the purpose of man-agement. For aboveground wood biomass for firewood and charcoal, periods of 10 – 50 years and 31– 50 years respectively, have been proposed. Table 2.1 shows wood biomass in regrowth miombo at different rotation periods.
Table 2.1: Estimated above ground wood biomass at different rotation periods (Chidumayo 2005)
Forest management phase Wood biomass (tonnes/hectare) at different rotation periods
20 years 30 years 40 years 50 years 100 years Good management (pre-1980s) 67 ± 40 85 ± 40 94 ± 41 98 ± 43 103 ± 51 Declining management (1980s) 45 ± 14 57 ± 15 64 ± 15 71 ± 15 90 ± 17 No management (1990s to date) 20 ± 11 27 ± 12 31 ± 13 35 ± 13 46 ± 17 Difference with good (sustainable) management (reference scenario) Declining management 1981 – 1989) 22 28 29 28 14 No management (1990 – 2000) 47 58 62 64 58
According to Chidumayo; 17 http://servalsgroup.blogspot.com/2008/03/energy-efficient-kerosene-burners.html 18 http://servalsgroup.blogspot.com/2010/05/context-of-sapls-innovations.html 19 www.CleanCookstoves.org.

Biomass Where:
(i)
(ii)
(iii)
About 6about 1 tonnes (lis realise2.1, yielerates. Typicallenergy vinsulatedflowing erage cocharcoal1 kg or 2ergy los
Thereforestation land deglivelihoo In Zambcleared (
20 http://
10 KgDriedwood
s non-renewable =
Biomassing areaground wBiomassagricultuBiomassof manastructive2.0 m ta1.3 m absuch a wproducti
6 to 10 tons oto 1.3 tons oless 10% twied per hectarlds can be as
ly wood has value of aroud or not receCO2 gases w
onversion ratl (Luwaya 2028 MJ in thes) (Figure 2.
Figu
re over-depeand land deg
gradation in od and may d
bia, an estim(Kamelarczy
/vuthisa.com/
150 Mg d d
= Biomass kiln
s kiln-area is bioa covered by wood biomas land-use-change ure (about 70s loss-poor manage
agement at a e annual late all) indefinitebove ground)way that theion.
of wood are of charcoal pigs) of woodre, at 10 tonns low as 1.8 t
an energy vund 29 MJ/k
eiving sufficiwill result in tio of 10:1 m011). The 10e form of cha2).
ure 2.2: Useful
endence on cgradation beAfrica has pdrive many p
mated 39.37 yk 2009). W
/2010/09/05/i
MJ
n-area + Bioma
omass loss dkilns within ss per hectaris biomass
0% of area clement is reductgiven rotatidry season f
ely, and Unc) in regrowth
e biomass sto
required forper household used to maknes wood to tonnes per h
alue of betwkg20. This meient air supplless efficien
means that 10 0 kg of air-drarcoal, there
l energy from
charcoal andeing experienpotential to npeople into p
tonnes of cahen the clear
is‐it‐better‐to
Charcoal
1 Kg
ass land-use-chan
due to loss ofn the forest arre in miombo
loss due toleared for chtion in potenion period, infires, regrowcontrolled hah miombo caock stagnate
r every 1 tonld per year (Lke charcoal p1 tonne char
hectare of cha
ween 14 and eans that chly (including
nt cooking dukg of air-dri
ried wood is will be a net
m wood to char
d wood for cnced in in Sunegatively afpoverty.
arbon per heared land is c
‐burn‐wood‐o
28 MJ
nge + Biomass
f regenerationrea cleared fo woodland. o land use charcoal); andntially renewn this case 3
wth may remaarvesting of san also reduces at a certai
n of charcoaLammers 20per virgin hercoal conversarcoal in unm
18 MJ/kg wharcoal burns
g secondary aue to a loweried fuelwoodequivalent t
t energy loss
rcoal used bra
cooking makub-Sahara Afffect the con
ectare is lostconverted to
or‐charcoal/
C
s loss-poor manage
n on kiln sitefor charcoal p
change from
wable biomas30-year perioain in the “firsmall poles (ce wood biomin undesirab
l produced, w012; Gumbo ctare, only 8sion ratio. Bumanaged area
hen burned ws hotter than air), the abser heat transfed is carboniseto 150 MJ, sos of 122 MJ (
zier for cookin
kes it among frica. With inntribution of
t when abovagricultural
•1e
•OM
Charcoal Brazier
ement
es found by mproduction b
forest to n
ss due to poood. In the care-trap” phas(< 8.0 cm diamass accumuble level for
while consuet al 2013).
8.1 tonnes of ut accordingas of 20 yea
while charcowood, but w
ence of flameer efficiencyed to produco when this (or about 81
ing
g the agents ncreasing ponatural reso
ve ground biland, a furth
10% efficient
Only 2.8 MJ useful
18
multiply-by above-
on-forest
or or lack se of de-se (under ameter at ulation in charcoal
umers use For a 90
f charcoal to Table
ars regen-
al has an when not es or fast . The av-
ce 1 kg of produces .33% en-
of defor-opulation, urces for
iomass is her 11.02

tonnes ocarbon l Wood/cha range weight, than 2.4year as aenergy s 2.2.3.2 Kerosention fuedevelopielectricit Kerosenfuel) andthe fuel used becno nozzl Producekerosenelength. Ithat boilburns mtion of king valuuseful en
Althougcookingeral withcluding bons (PApersonalconcentr
21 http://w22 http://e
of carbon perlost per hecta
harcoal use, of health e
cataracts, pn million houa result of thsources or wa
Efficienciesne, also knowl, general soing countriety and LPG
ne stove desid the more eusing manu
cause they arles that can g
ed originally e is a transpIt is a middlls between 1
more efficientkerosene, simue as 46.2 Mnergy per litr
FNB: 1 Lit ker
gh kerosene , the fuel is lh known adParticulate MAH), Sulfurl exposure crations abov
www.cleancooen.wikipedia.o
Kerosene
1 Litre
r hectare is loare.
often burnedffects includ
neumonia, anuseholds are ahat21. Justifiabays of burnin
s and environwn paraffin, olvent, cookies, especiallyare expensiv
igns are broaefficient and ual pumping re cheaper, tget clogged b
from coal (“parent liquid e distillate o145 and 300tly, requiringmilar to that MJ/kg22. Figu
re of kerosen
igure 2.3: Useosene = 35.24 M
is often advladen with riverse healthMatter (PM)r Dioxide, anconcentratione WHO guid
okstoves.org/corg/wiki/Kero
35.24
ost due to be
d indoors witding lung cand tuberculosaffected by inbly, pollutiong biomass m
nmental issuhas numerouing, heating,y in urban pve or unreliab
adly categorihotter burninor heat. In lothey easily pby soot.
“coal oil”), bfuel with a
of the petrole0°C. Keroseng less fuel mof diesel, ha
ure 2.2 showne is 19.38 M
eful energy foJ (SOURCE: http
vocated as a isks. Kerosen
h risks. Both), Carbon Mnd Nitrogen ns suggest thdeline and in
countries/africsene.
MJ
elow ground b
thout chimneancer, chronsis (Lam et andoor air pon from solid
more cleanly
ues associateus commerci, and lightinpopulations, ble.
ized into wicng pressure sow-income h
provide simm
but later frommixture of
eum refiningne has a hig
mass to compas a lower hews that at theMJ (Figure 2.
or kerosene in p://wogone.com/s
cleaner altene is a mixtu
h kerosene stMonoxide, Fo
Oxides (NOhat kerosenenterim target
ca/zambia.htm
KerCoo
biomass. Th
eys or smokenic obstructival 2013). In llution, and m
d fuels has pr.
ed with kerosial and indus
ng. Kerosenewhere biom
ck stoves (wstoves with vhouseholds,
mer heat for s
m the fractiohydrocarbon
g process, deher energy d
plete the sameating valuee 55% Indian3).
a 55% efficiescience/the_energ
ernative to sure of hundretoves and la
ormaldehyde,Ox). Availabe-fueled stovs, while CO
ml
•
•rosene okstove
is brings the
e hoods, has ve pulmonarZambia, it ismore than 8,rovoked effo
sene strial applica cooking is
mass needs to
which rely onvapour-jet nowick stoves some staple
onal distillatin chains 6 toefined as the density than
me cooking taas 43.1 MJ/kn burner effi
ent cookstove gy_and_fuel_data
olid fuels, beds of chemimps emit va, Polycyclic le measurem
ves elevate inmay pose ri
>55% efficient
19.38 MJuseful
total 50.39 t
been associary disease, ls estimated t,600 people d
orts to find al
ations includwidespread
to be purcha
n capillary trozzles that aare more cofoods, and th
tion of petroo 16 carbon
fraction of wood and g
ask. Heat of kg and a higficiency stan
a_sheet.pdf)
biomass and ical compouarious substaAromatic H
ments of kitcndoor respirisks under so
J
19
tonnes of
ated with low birth that more die every lternative
ding avia-in many
ased, and
ransfer of erosolize ommonly hey have
leum oil, atoms in crude oil generally combus-
gher heat-dard, the
coal for nds, sev-ances in-
Hydrocar-chen and rable PM ome con-

20
ditions (Lam et al 2013). Kerosene poisonings make up a significant portion of total poisoning inci-dents each year, particularly in developing countries. Kerosene is also synonymous with many fires and burns, with a variety of contributing factors. Possible adverse health effects include, Respiratory Cancer, Salivary-Gland Cancer, Respiratory Symptoms and/or Spirometry, Asthma and Allergic Dis-eases, Respiratory Infections, and Cataract Effects on the Eye. In South Africa where for cooking 15.20% and 14.8% of the population use wood and paraffin re-spectively, it is estimated that more than 6.65 million people (about 1.4 million households) are af-fected by indoor air pollution, and more than 7,600 people die every year as a result of that23. Justifi-ably, pollution from solid fuels has provoked efforts to find alternative energy sources or ways of burning biomass more cleanly. 2.2.3.3 Efficiencies and environmental issues associated with bioethanol Ethanol is a clean liquid biofuel that can be made from a variety of feedstock including sugary materi-als such as sugar cane, molasses, sugar beet, or sweet sorghum, starchy materials such as cassava, potatoes, or maize. Ethanol burns very cleanly, without the production of harmful gases and fine particulates (soot). Burning ethanol produces significantly less carbon monoxide (CO) than kerosene or solid fuels, and has dramatically reduced indoor air pollution as compared to wood, charcoal and kerosene stoves. Greenhouse gases released in the production and consumption of ethanol fuel are reabsorbed during the growth cycle of the plant material used to make the fuel. Damaging GHGs like CO and volatile organic compounds are produced in negligible amounts. Black carbon aerosols, a potentially potent climate forcer, are essentially not produced by the combustion of ethanol and meth-anol. Ethanol fuel functions in a range of efficiencies when used in alcohol stoves, with gelfuel gener-ally somewhat less efficient and liquid fuel somewhat more efficient. In the most efficient alcohol stoves, ethanol is more efficient than solid fuels and kerosene, and generally comparable to LPG. The clean cookstoves, manufactured by Dometic AB of Sweden24, being proposed here has an efficiency of more than 60%. As illustrated in Figure 2.4, this means that of the 21.2 MJ contained in a litre of bioethanol, 12.72 MJ is directly doing work, and the rest is lost. However, there is also co-production of electricity from vinasse and bagasse (for some feedstocks).
Figure 2.4: Energy derived from e.g. sweet sorghum based bioethanol
NB: 1 Lit ethanol = 21.2 MJ (SOURCE: http://en.wikipedia.org/wiki/Energy_content_of_biofuel).
Although ethanol fuel has a lower energy content by volume than kerosene, ethanol tends to combust more efficiently in a simple cook stove than kerosene does and therefore gains in efficiency what it lacks in energy. Ethanol with lower water content contains more energy; thus 95% ethanol produces more heat per volume of fuel consumed than 80% ethanol, although flame temperature remains rea-sonably constant.
23 http://www.cleancookstoves.org/countries/africa/south-africa.html 24 www.dometic.com/enie/International/Site/CleanCook-Alcohol-Fueled-Stoves/Download-Cleancook-Leaflet
22.2 Kg Sweetsorghum
1 Litre Bioethanol
(21.2 MJ)
Clean Cookstove
(> 60% efficient,
12.72 MJ useful)
Electricity
(Bagasse in boiler & Vinasse in biodigester)
95.76 MJ (26.6 KWh)
21
The proposed bioethanol stove, known as CleanCook stove, is a Swedish innovation manufactured by a company called Dometic AB. It is a stove that burns cleanly and safely, and cooks food quickly, and produces only low levels of greenhouse gases. Pilot studies in Ethiopia, Brazil and Nigeria show that the CleanCook stove is well liked and well used25. The stove is stable, and the fuel is safely stored in a non-spill fuel tank. The studies done in Ethiopia by Gaia have shown that women value the safety of the alcohol-fuelled stove as much as they value the clean kitchens that these stoves make possible. The fuel tanks hold the ethanol in a special adsorptive fibre so that it cannot spill. The tanks are not pressurized so they will not flare and cannot be made to explode. The fuel tank is inserted from un-derneath the stove. Therefore, when refilling it has to first be removed. This makes the stove very safe as it cannot be filled whilst the stove is alight. The stove uses either ethanol or methanol. Recent la-boratory safety tests showed that the CleanCook is ‘very safe,’ scoring 39 out of 40 points (based on a protocol (Johnson 2005; Johnson 2013). The CleanCook has been monitored for pollutants in both the laboratory and in a household survey. Laboratory results have shown that the stove had an average CO/CO2 ratio of 4% at high power and 5% at low power; particle emissions were negligible in all tests; although methane emissions can be highly variable and difficult to measure, methane / CO2 ratio gas chromatograph tests recorded a range of values from 0.02% to 0.35%. The stoves have been used under arduous conditions in refugee camps since 2005, and no breakdown has been reported yet. In total, over 40,000 Dometic CleanCook stoves are in operation globally. The CleanCook stove can use ethanol, methanol or a mix of both, and the fuels themselves can be made from wastes. Therefore, in addition to the health and economic empowerment benefits associated with the use of these stoves, the stoves and bioethanol can also lead to a more sustainable and cleaner environment. They can reduce a large share of emissions from cooking with biomass, and can also bring other bene-fits, such as reduced indoor and outdoor pollution, less pressure on forests, and economic and time savings due to the reduced need to search for or purchase costly fuels. Since they have short life spans – a few days for black carbon, a decade for methane – reducing these gases would bring about a more rapid climate response than reductions in CO2 alone26. For feedstock such as sugarcane and sweet sorghum, the excess co-generated electricity sold to the grid beyond own consumption would not only make it possible for rural people to access modern en-ergy, but for South Africa this would also reduce the requirement to use coal to generate power to meet national demands. Decentralised energy access reduces long-range energy transmission effi-ciency losses. 3 METHODOLOGIES TO ASSESS EE AND EMISSIONS SAVINGS Various tools exist for analysing energy efficiency and greenhouse gas emissions (GHGs) calculated either separately or in combination. Some are simple27 and web-based while others are complex and proprietary, such as the Long-range Energy Alternatives Planning (LEAP) System. The US National Renewable Energy Laboratory (NREL), for example, has models and tools which it has developed or which it supports to assess, analyse and optimize renewable energy and energy efficiency technolo-gies for projects28. Many of these tools can be applied on a global, regional, local, or project basis. NREL models and tools include several designed for the consumer or energy professional. LEAP is fast becoming the de facto standard for countries undertaking integrated resource planning, greenhouse gas (GHG) mitigation assessments, and Low Emission Development Strategies (LEDS) especially in the developing world. Many countries have also chosen to use LEAP as part of their
25 http://sites.duke.edu/adhoc_httpssitesdukeedubioethanolpro/our-product/clean-stove/ 26 www.CleanCookstoves.org. 27 http://cotap.org/carbon-emissions-calculator/ 28 http://www.nrel.gov/analysis/models_tools.html

22
commitment to report to the U.N. Framework Convention on Climate Change (UNFCCC). LEAP works as an integrated modelling tool that can be used to track energy consumption, production and resource extraction in all sectors of an economy. It can be used to account for both energy sector and non-energy sector greenhouse gas (GHG) emission sources and sinks. In addition to tracking GHGs, LEAP can also be used to analyse emissions of local and regional air pollutants, making it well-suited to studies of the climate co-benefits of local air pollution reduction. LEAP has been adopted by thou-sands of organizations in more than 190 countries worldwide and has been used at many different scales ranging from cities and states to national, regional and global applications. (Heaps 2012). Its users include government agencies, academics, non-governmental organizations, consulting compa-nies, and energy utilities. It Therefore, to develop low emissions development strategies (LEDS) for promoting energy efficiency investments for climate change mitigation and sustainable development presented in this report, LEAP tool and, wherever necessary and possible, Microsoft Excel spreadsheets were used to analyse and develop models that demonstrate impacts of renewable energy and energy efficiency measures on climate change mitigation. Energy models were developed for the three selected countries; Morocco, South Africa and Zambia, and the results as well as associated assumptions are presented in the re-port. Specifically, Microsoft Excel spreadsheets were used to develop models to demonstrate the impact of policies which would promote installation of Solar Photovoltaic (PV) systems and Compact Fluores-cent Lights (CFLs) in households in Morocco and South Africa. Similarly, associated GHG emission reductions were analysed using the excel spreadsheets. The LEAP software tool could not be used for this type of analysis due to the nature of the analysis involved which requires data for the whole country including installed capacity, historical generation and planned installations to be available for LEAP to be used for modelling electricity generation. Furthermore, the LEAP modelling tool is data intensive and requires comprehensive data to develop an accurate model for energy demand and en-ergy transformation (electricity generation and distribution). Lack of specific data for the baseline case, business-as-usual and mitigation scenarios proposed was a challenge which hindered the use of LEAP modelling tool. Instead, the model used here focused on a sector (Household Sector) in each of the countries instead of the whole country, and Excel was therefore applied. Similarly, energy efficiency measures of in-stalling CFLs were analysed using Excel spreadsheets in order to compare the impact of CFLs and household PV systems on electricity demand and supply, respectively. However, the LEAP modelling tool was used to model the energy demand scenarios of household sectors in Zambia and South Africa for which all relevant data was available from the World bank data centre and country reports. The model for South Africa considered the total number of low-in-come households (9,936) that use kerosene for cooking, so that the policy would be to replace Kero-sene with Bioethanol. The key assumption was Kerosene and Bioethanol consumption per household per day which was estimated at 0.5 litre and 1 litre, respectively. In Zambia, 39% of the urban popu-lation uses 100% charcoal for cooking. The model considered then is to replace this charcoal with bioethanol in clean cook stoves. 4 COUNTRY CASE STUDIES In this Chapter, energy producing or consuming sectors as well as levels of greenhouse gas emissions in tonnes of CO2 emitted of the case study countries are described, and analyses of energy and emis-sions savings are carried out.
4.1 Morocco Morocco’s planned and anticipated economic projects will increase energy demand by 185% by 2030, and electricity demand by 68% by 2030 (Andriani et al 2013). To support the acceleration of such

23
projects, Morocco has developed an ambitious 2020-2030 energy strategy (the Moroccan Energy Strategy). With no oil resources and relying heavily on energy imports, Morocco intends to make the most of its wind and solar resources to become a top renewable energy producer. The country has therefore significantly reformed its legal and institutional framework to achieve this. 4.1.1 Morocco energy sector brief Energy consumption in Morocco rose at an average annual rate of 5.7% from 2002 to 2011 and the per capita energy consumption in 2011 was 0.52 tonnes oil equivalent (Toe)29. In 2011, the country consumed 17,262 kToe of energy, with petroleum products accounting for 61.9% followed by coal (22.5%), electricity trade (7.2%), natural gas (4.6%), hydropower (3.0%), and wind power (1.0%). In 2012, the country’s installed electricity generation capacity was 6,677 MW, with coal-fired generation being the largest segment at 1,785 MW, followed by hydroelectric at 1,770 MW. Rising oil prices and a rapidly growing population mean that the cost of importing energy is now seri-ously aggravating the country’s trade deficit. Imported energy in 2011 was 95.5%, energy import bill was US$10.1 billion, and subsidies for petroleum products were US$4.8 billion (Lahbabi 2013). In 2012, energy imports accounted for over a quarter of total imports, when the trade deficit grew 8% to a record $23.6 billion. The long term increase in energy needs will mainly be due to energy-inten-sive sectors such as chemicals industry, building infrastructure, and tourism. Through rural electrification programme, the transmission grid owned by the state utility ONEE co-vers the entire country and is connected to the Algerian and Spanish power grids via regional links. In terms of its current installed base, Morocco is already a regional leader, with 32% of its installed capacity derived from renewables, mostly hydropower. Wind in Morocco is highly abundant in nearly all the coastal regions. Wind potential could be of 25,000 MW, and the country is expected to generate more than 2,000 MW in 2020, resulting in 5.6 million tonnes of avoided CO2 emissions (Lahbabi 2013). Moroccan solar resources are significant with an extremely favourable irradiation of more than 2300 kWh/m² per year, which is 30% higher than the best sites in Europe, and is therefore attractive to foreign investors. The country has a US$9bn Solar Plan to develop 2,000 MW by 2020 using 10,000 hectares of solar installations based on concentrated Solar Power and Photovoltaic tech-nologies, and will yield 5.6 million tonnes of avoided CO2 emissions. The predominant use of bio-mass in Morocco is traditional fuels for cooking and heating. Forested areas are estimated at 9 million hectares, while annual consumption is estimated to be 30,000 hectares. An additional 400 MW of co-generation potential is available in the country. Total solid bioenergy potential is estimated at 12,568 GWh/year, with a further 13,055 GWh/year from biogas and biofuels. Significant geothermal poten-tial exists in the north-east, in the form of hot springs, with potential for further utilisation for space heating. There is no current utilisation of the resource in the country. In 2008, 1,360 GWh were pro-duced from hydro power. In addition, hydro power comes partly from a 464 MW pumped storage power plant, and a micro hydro power station is planned for future development. For energy efficiency, the country is targeting optimisation of energy use in buildings including re-ducing consumption through demand-side management measures, and more efficient lighting prac-tices; Efficient use of wood in traditional heating systems in both urban and rural areas; EE knowledge and energy use and carbon emission auditing in industry; Improvement in urban transport efficiency through better governance and increased infrastructure energy performance; and Appliance labelling for EE and low consumption light programme in public housing and government buildings. The EE strategy is to attain EE savings of 12% by 2020 and 15% by 20130, mainly from industry, tertiary and residential buildings, and transport (Lahbabi 2013). Morocco also intends to set-up support funds for energy efficiency programs and has designated the National Agency for the Promotion of Renewable Energy and Energy Conservation (ADEREE) to
29 http://www.reegle.info/policy-and-regulatory-overviews/MA

24
oversee EE programmes. The country has also established an Agency for Solar Energy (MASEN) which is the prime contractor for solar power projects. For EE in residential buildings, Morocco plans to incorporate several measures to incentivize the up-take of solar hot water systems, accelerate the adoption of compact fluorescent light bulbs (CFL), im-plement measures related to the thermal performance of buildings and incorporate energy efficiency labeling of appliances. For the period 2012 – 2014, measures include30: Solar water heater market development aimed at reaching an installed capacity of approximately 1.7 million square meters by 2020; Expanding CFL distribution aimed at distributing some 23 million CFLs to reduce peak load; Implementation and enforcement of residential building codes for a scheme covering 400,000 houses; Energy-saving labelling of domestic appliances, especially for refrigerators and air conditioners; and The "20-20" initiative in which households that achieve a 20% reduction in energy usage benefit from an additional 20% rebate on their bill. The Measurement, Reporting and Verification (MRV) approach still has to be developed. It will draw on CDM whole-building methodologies, either “Energy efficiency technologies or fuel switching in new buildings”, or small scale methodologies for individual actions. The Renewable Energy Law (13.09 of February 11, 2010) aims at fostering and promoting renewable energy and regulates the commercialization and exportation of renewable energy. Furthermore, it out-lines a procedure for the authorization of renewable energy installations. To meet growing electricity demand, Morocco which in 2009 had installed capacity of 6,100 MW plans to invest more than $20 billion over a period of 10 years to increase the installed capacity by about 6,750 MW. By 2020, wind, solar and hydro will each account for 14% of power supply, with the remaining sources oil (14%), gas (11%), nuclear (7%), and coal (26%). The solar and wind in-vestment would lead to savings of 1 million Toe and 3.7 million tonnes of CO2 emissions per year. The new energy strategy that was declared in March 2009 aims at Diversifying the energy mix around reliable and competitive energy technologies, in order to reduce the share of oil to 40% by 2030; De-veloping the national renewable energy potential, with the objectives of increasing the contribution of renewable to 10-15% of primary energy demand by 2012; Making energy efficiency improvements a national priority; Developing indigenous energy resources by intensifying hydrocarbon exploration activities and developing conventional and non-conventional oil sources; and Integrating into the re-gional energy market, through enhanced cooperation and trade with both other Maghreb countries and the EU countries. However, there appears to be no plan to use residential houses for power generation using solar PV and wind, a practice that is entrenched in, for example, Germany (rooftop solar PV) and United King-dom (roof top wind power generation) (Climate Commission 2013). EnergiPro was launched by ONEE and pursuant to which large industrial consumers are offered an incentive in the form of favourable tariffs to invest in renewables. EnergiPro was launched in 2006 to promote independent production of electricity from renewable sources, and offers two key benefits: transmission of electricity produced from renewable energy throughout the grid network at fixed
rate guaranteed repurchase by the ONEE of any surplus electricity produced with a twenty per cent
bonus on top of ONEE peak, and off-peak day ahead tariffs Several major firms have entered into “Energie Pro” agreements. Whilst, EnergiePro is not limited to wind energy, the program is primarily directed at this source. This project could be used to include
30 www.nama-database.org/index.php/Residential_buildings_energy_efficiency_in_Morocco.
25
rooftop solar PV from residential houses to enable ordinary people participate not only in power gen-eration, but as an economic empowerment tool to reduce poverty. Morocco boasts one of the most de-regulated electricity sectors in the MENA region. To implement mandatory rooftop solar PV would however also require an attractive feed-in tariff and a revolving fund or some kind of financial arrangement which will enable households to finance solar PV instal-lations. 4.1.2 Setting for solar based EE and climate change mitigation in Morocco
Current Power Sources Coal, oil, gas, hydro, solar and wind Energy Sufficiency Inadequate Energy Source for Future Expansion Coal power for local use, Renewable energy export to EU EXAMPLE Natural Resource to be Tar-geted for Participatory Energy Produc-tion and Supply
Solar (high insolation levels in Morocco)
Market Opportunity Residential and national consumption, and proximity to EU that is importing clean energy from Morocco
Enabling Participatory Power Genera-tion Technology
Rooftop solar PV
Energy Efficiency Opportunity Decentralised power source (national) and energy efficient bulbs (household)
Rooftop to Grid Power Sales Infrastruc-ture
99% available country-wide grid connection to households
Contribution to Global Concern Reduction in GHG emissions due to use of coal and petroleum energies
4.1.3 Effects of EE and climate change mitigation policies on electricity scenario As summarised in the table above, energy efficiency for the Moroccan case study is in form of energy use and use of CFLs at the point of generation (residential solar PVs) and savings from long-range grid transmission to residential houses. The greenhouse gas emission savings are in form of reduced use of fossil fuels (coal, oil and gas) from either the existing fossil fuel power plants or their possible future expansions. 4.1.3.1 Policy: All households must have RT solar PVs with net meters
(where RT = rooftop, PV = photovoltaic) Morocco has significant potential for electricity generation from Solar PV systems. With an average insolation of 2300 kWh/m² per year, Morocco has the potential to meet its electricity demand from Solar PV technology. The technology is well understood and therefore easy to replicate and scale-up from a small-scale household system to a large-scale solar power plant. In order to realise the impact and benefits of solar systems, favourable policies need to be put in place. One such policy would be promoting the adoption and implementation of a nation-wide project on installing solar PV systems on rooftops of all household units which are connected to the grid. The capacity of solar PV systems suitable for household installation ranges from 2kW to 5kW. Therefore if the policy indicated that all household units install a 5kW solar PV system by 2030, there would be a significant increase in electricity generation which would meet the local demand with a possibility of exporting the surplus to the region. Results of this analysis obtained using Excel is illustrated in Figure 4.1.

The grapand assusumptionstallationelectricitmetering The est26,600 lar PV s 4.1.3.2
(wh
The grabulbs (Chousehoof 3 housumptioFluoresCFLs w Switchipact Flureductiofor the per day
Fi
ph in Figureuming no adn projectionn of solar PVty generatiog where all h
timated numGigawatt-hsystem.
Policy: All h
here RT = roof
aph in FigureCFLBs) as aold sector. Aurs per day, ton in the houcent Lighting
will contribut
ing from stanuorescent ligon in the hou10 standard is 2.46 kWh
igure 4.1: Pow
4.1 presentsdditional elecns based on aV systems sn would out
households w
mber of houhours of elec
households t
ftop, PV = ph
e 4.2 obtainean energy effAssuming a mthe impact ousehold sectog on overall e to substant
ndard lightinght bulbs witusehold sectbulbs is 3 kW
h.
wer generation
s projected ectricity genera business-asso that all grtstrip deman
with solar sys
usehold in ctricity in 2
to have RT s
hotovoltaic, an
ed using Excficiency poliminimum of f such a polior. Also, theelectricity d
tial reduction
ng bulbs withh an averagetor consumptWh while tha
n outlook due
electricity gerating powers-usual scenrid-connectednd by 2016. stems can fee
2030 is 7,62030 if all h
solar PVs, ne
nd CFLBs = c
cel shows theicy measure 10 bulbs per
icy measure we figure illustdemand. It is n in electricit
h an averagee rating of 18tion of electat of CFLs i
to residential
eneration (bar plants are
nario. Assumd householdThis can be
ed the surplu
600,000 wihousing unit
et meters and
ompact fluore
e impact of uon overall e
r household would be sigtrates the proclear that in ty demand.
e rating of 18 Watts by 2tricity. The ds 0.54 kWh.
solar PV poli
sed on curreinstalled bey
ming a graduas install a 5k
e achieved bus power into
ith the potets are instal
d CFLBs
escent light bu
using Compaelectricity cowith an aver
gnificant reduojected impathe medium
00 Watts to 2030 would rdaily consum
The energy
icy
ent installed eyond 2011) al increase ikW system
by implemeno the national
ential of gelled with a 5
ulbs)
act Fluoresceonsumption urage operatinuction in eneact of using
m to long term
energy saviresult in a si
mption per hsaved per h
26
capacity and con-
in the in-by 2030,
nting net-l grid.
nerating 5kW so-
ent Light under the ng period ergy con-Compact
m, the use
ng Com-ignificant ousehold ousehold

Figu
The poliment, joenterpriscent Ligated per sumed bhousehomated caiff, this years for 4.1.4 Obtainedelectricitrocco). Hpower g2030, basaved if By subs3 hours)hours) pfrom coause of Chousehoof CFLB
ure 4.2: Energ
icy measureob creation ases involved
ght bulbs. Sphousehold f
by CFLs perold would selapital cost fowould be anr the 5 kW s
Carbon diod using Excety generationHistorical D
generation inased on the b
f mandatory p
tituting stand) per day, wiper day, woual fired planCFLBs, eacholds in 2030, Bs.
gy outlook due
s presented and poverty ed in installatipecifically, oufrom solar PVr day, leavinll 18,052 kWor solar PV on income of olar PV syst
oxide emissel, the graph n using coal
Data indicatesn 2011. Thesbusiness-as-upolicy to inst
dard 100 W ith 10 x 18Wuld result in
nts, there is 0h household 6.777 millio
e to generation
in this analyeradication aion of Solar ut of 50 kWV systems, anng 49.46 kW
Wh per year, of US$ 2,750US$ 1,805.2em, which lo
sion savingin Figure 4.
l (which is ts that there we emissions usual scenaritall solar PV
bulbs, 10 ofW CFLBs wh
a saving of0.993 Kg CO
would avoion tons Kg C
n by residenti
ysis also havas they woulPV systems
Wh (= 5 kW pand if only 0.Wh extra pow
if all there i0/kW (Can e20. The inveooks good fo
gs due to re.3 below indthe main enewere 19.54 Mare projecteio. Additionsystems per
f which woulhich would cof 2.46 kWh/O2 – equivaleid 2.443 Kg
CO2 equivalen
ial solar PV an
ve the econold create opps as well as dper solar PV 540 kWh (10wer sold to is are CFLBet al 2013), aestment woulor a 20 – year
esidential Rdicates a lineaergy source Million Metd to increaseal 9.18 Milli
r household w
ld consume 3onsume 0.54day. For eveent emitted (g CO2 per dant would be a
nd consumptio
omic benefit portunities fodistribution x 10 hours o
0 bulbs x 18 the networks drawing onand given a Uld thus be rer lifespan of
RTPV solarar increase infor electricitric tons of Ge to 28.72 Mion Metric towere institute
3 kWh (10 b4 kWh (10 buery kWh of Letete et al ay. Thus, foavoided in 20
on by CFLBs
of income ior small andof Compact of generation W x 3 hoursk per day, thn power. FoUS$ 0.10 feeecovered in athe system.
r system pon CO2 emissty generationGHG emissio
Million Metrions of CO2 wed.
bulbs x 100 Wulbs x 18 W/electricity g2007). Ther
or a total 7.6030 alone, d
27
improve-medium Fluores-
n) gener-s) is con-hen each r an esti-ed-in tar-about 7.6
licy sion from n in Mo-ons from ic tons in would be
W/bulb x /bulb x 3
generated efore, by 6 million
due to use

4.2 4.2.1 The Souonly a hciency isat the mthe incluup a far holds is outcomecountry. South Amum castate-owcomes frcountrie South Agenerat5% fromergy indby 2030plans to
31 http://w
F
South Afr
South Afriuth African ehandful of cos on average
moment indususion of comsmaller porteven smaller
e of the ener. Seventy-thr
Africa's nomiapacity (nomwned companfrom indepenes in the regio
Africa plans tion capacity
m hydroelectrdustry is sma0. The nuclea
expand nucl
www.reegle.in
Figure 4.3: Pr
rica
ica energy seconomy is euntries havin
e significantlystry and mini
mmerce takestion of final er. Only 16-1rgy intensiveree (73) perc
inal installedminal capacityny Eskom sundent power on.
to diversify iy is from coaric plants, wall, but the car power plalear power g
nfo/countries/s
rojected emiss
sector brieextremely enng higher inty lower thaning consumes this figure tenergy dema8% of Southe nature of tent of its pop
d electricity y minus the upplies roughproducers (I
its electricityal-fired powe
with a small aountry plansant at Koebeeneration by
south-africa-e
sion reduction
f nergy intensitensities. In an in other coue over 60% oto almost 75and than in oh Africa’s elethe economypulation has
y capacity isamount the
ghly 95% of IPPs) and im
y generation er stations, aamount froms to expand rerg has an in
y 9,600 MW
energy-profile
n due to reside
ive comparedaddition, Souuntries. This of the electri5%31. Therefoother countrieectricity is usy, and the exaccess to ele
about 45,70power statioSouth Afric
mports. Esko
mix. Currenabout 5% fro
m a wind statirenewable elnstalled capaby 2030.
/ZA
ntial solar PV
d to internatuth African inis an importcity produceore, residenties, and demased by residextreme incomectricity.
00 MW, althon uses to opca's electricitm buys and
ntly, about 90om one nuclion. South Alectricity capacity of 1,94
Vs
tional standaindustrial enetant factor, ged in the coutial energy usand from pooential consume differenti
hough total nperate) is lowty and the resells electri
0% of Southlear power p
Africa's renewpacity to 18,240 MW. The
28
ards, with ergy effi-given that ntry, and se makes or house-
umers, an ial in the
net maxi-wer. The emainder city with
h Africa's plant, and wable en-200 MW e country
29
In 2012, 72% of South Africa's total primary energy consumption came from coal, followed by oil (22%), natural gas (3%), nuclear (3%), and renewables (less than 1%, primarily from hydropower). South Africa's dependence on coal has led the country to become the leading carbon dioxide emitter in Africa and the 14th largest in the world. South Africa's total oil consumption was 616,000 bbl/d in 2013. The petroleum consumed in South Africa comes mostly from its domestic refineries that import crude oil and its coal-to-liquid (CTL) and gas-to-liquid (GTL) plants. The country also imports petro-leum products. In 2012, according to the South African Revenue Service as published by Global Trade Atlas (GTA), South Africa imported 110,000 bbl/d of petroleum products. South Africa's electricity system is constrained as the margin between peak demand and available electricity supply has been precariously narrow since 2008. The country’s peak demand was forecast to reach 44,005 MW in 2013, exceptionally close to installed net maximum capacity. The Southern African Power Pool (SAPP) forecast has peak demand growing to almost 53,900 MW (or by 20%) by 2025, and therefore Eskom plans to spend $49 billion to replace aging equipment and add new power stations to meet growing demand. For renewable energy, South Africa has good solar resources with direct normal irradiation aver-aging over 7.0 kWh/m2/day in many areas of the country, particularly in areas with close access to the electricity grid, such as in the Northern Cape. The wind energy potential has average wind speeds at 10 metres range from 4-5 m/s for the majority of the coastal areas of the country, increasing to ap-proximately 8 m/s in some mountainous regions. In the longer term, around 9 to 16% of the total en-ergy demand could be met by biomass sources including agricultural residues, cuttings from forestry operations, as well as dedicated energy crops. Household biogas digesters also have a large potential market share, and landfill gas based on which two projects have recently been commissioned near Durban. Also, wave energy has the potential to contribute 33 TWh per year by 2050, in conjunction with other, less-used renewable energy resources. Other insignificant renewable energy sources in-clude seasonal hydropower, geothermal and waste to energy. With regard to electricity, the South African White Paper on Renewable Energy has set a target of 10,000GWh of energy to be produced from renewable energy sources (mainly from biomass, wind, solar and small-scale hydro) by 201332. Achieving the target will, among others, stimulate additional income that will flow to low-income households. For transport fuel, the regulations published in 2012 for biofuels (bioethanol and biodiesel) have set the minimum concentration to be allowed for biodiesel blending as 5% v/v with diesel while the per-mitted range for bioethanol blending with gasoline as 2% v/v up to 10% v/v (DoESA Biofuels 2012). For part of the South African case study in this project, this could be an avenue for adding bioethanol production targets to meet requirements to substitute paraffin with bioethanol for cooking. South Africa has also developed an Integrated Resource Plan (IRP) 2010-30, dubbed a “living plan”, which was released in March 2011, and updated in 2013 (DoESA Integrated Electricity 2013). The document is to be revised every two years. Of the many forms of embedded power generation, in-cluding biogas, biomass and wind, in this report only photovoltaic is demonstrated in the household policy case study as it is the most likely form of generation to be embedded in the national grid. Also, the policy only considers households in living standard measure (LSM) 7 or higher, each with a ca-pacity of 5kWp. Here lies an opportunity for co-opting net-metred residential solar PVs, a part of the focus for the South African case study. The energy policy document plan called the "National Response to South Africa's Electricity Short-age" released in January 2008 includes work on the country's electricity distribution structure, and the fast-tracking of electricity projects by independent power producers.
32 www.energy.gov.za/files/renewables_frame.html

30
The National Energy Efficiency Agency (NEEA) established in 2006 is responsible for the imple-mentation of demand side management and energy efficiency projects in the country; the management of strategies for improving efficiency; awareness-raising campaigns and training programs in energy efficiency and co-operation with all agencies involved in the sector to ensure best practice. The En-ergy Development Corporation (EDC) established in January 2004 supports the development of renewable energy and alternative fuels through investment. The corporation targets market sectors where there is insufficient private sector activity as well as where the government, for strategic rea-sons, believes state investment is required. The EDC is also involved in sectors where renewable en-ergy and energy efficiency require catalysing and developing. The South African National Energy Development Institute (SANEDI) is an implementing agency of the Department of Energy created to assist the country to reach its energy goals. It focuses on awareness-raising and increased uptake of "green" energy. Its portfolio includes data and knowledge management on energy, energy efficiency, fuel technology, low-carbon energy and transport, carbon capture and storage (CCS), as well as en-ergy end use and infrastructure. For energy efficiency programmes, the country targets Industry (e.g. EE motors, energy audits, and energy managements systems), Utilities (e.g. rebates for energy savings), Transport (e.g. extra levies on inefficient vehicles used to cross-subsidize more efficient vehicles), Residential (e.g. distribution of compact fluorescent lamp (CFLs) at subsidized prices mainly in areas with capacity bottlenecks, mandatory standards and labels for appliances, vehicles and buildings, and promoting use of LPG as a cooking fuel rather than electricity) and Public (e.g. educational campaigns and EE funding for government buildings). One of the significant EE investment barriers in South Africa is the low price of energy. The govern-ment has therefore been progressively increasing the electricity tariff which by 2015 should be cost reflective, and has also included an environmental levy in electricity tariff to fund the implementation of Energy Efficiency Demand-Side Management (EEDSM) programs (Can et al 2013). Energy effi-ciency is now included as a resource of choice in integrated planning for future energy resources. As part of the November 2012 revised energy-efficiency strategy, for example, the Department of En-ergy, in collaboration with the Department of Public Works and Eskom, is retrofitting government buildings to make them more energy efficient. This contributes a saving of about R600,000 (US$ 74,000) in electricity bills a year33. South Africa is one of the pioneering emerging economies to have set up a transparent and systematic mechanism to fund energy efficiency. The National Energy Regulator (NERSA) is the regulatory au-thority in charge of determining electricity tariff increases and energy efficiency goals. Eskom, the national government-owned electricity utility, administers the energy savings programs. Funding for the implementation of energy efficiency is obtained through electricity tariffs. Eskom provides an EEDSM project plan in its MYPD application to NERSA to obtain funding to purchase energy savings and recover the reasonable costs. NERSA makes a final determination of the EEDSM costs that Eskom provides for the MYPD application. The phase of funding allowed in the three-year Multi-Year Price Determination (MYPD) 2 was R 5,445M (US$ 674 million) with the goal of gross saving 1,037 MW and a cumulative annualized total of 4,055GWh (about 0.67% electricity savings relative to retail sales per year) from 2011 to 2013 (Can et al 2013). The MYPD 2 ended in March 2013 with MYPD 3. A new funding of R 5,183M (USD 641 million) as against the request R 13.9 billion (US$ 1.7 billion) for a period of 5 years, 2013 to 2018 was approved in the MYPD 3 (Table 4.1). As can be seen, the annual funding for energy efficiency under the new MPYD 3 has dropped com-pared to the MYPD 2, which has raised concerns about long term commitments and about the possible
33 http://www.gov.za/aboutsa/energy.htm

31
under-appreciation of energy efficiency as a way to meet future demand. During the MYPD 2, tariff increase by an annual average of 22.1% and annual increases of 8% were approved in the MYPD 3, from 65.5 c/Kwh (8.1 US cents) in 2013/14 to 89.13 (11.03 US cents) in 2018.
Table 4.1: Integrated demand management (IDM) costs approved by NERSA (Can et al 2013).
ITEM
Million Rands
2013/14 2014/15 2015/16 2016/17 2017/18
Mu
lti-
Yea
r P
rice
D
e-te
rmin
atio
n
(MY
PD
)3
TO
TA
L
Return 23,477 26,511 26,436 27,657 33,667 137,748 Primary energy costs 51,067 54,966 56,779 62,060 68,620 293,492 Independent power producers 2,686 5,108 14,826 19,269 23,018 64,907 Depreciation 25,733 27,481 28,564 28,911 29,197 139,886 Integrated demand management 1,455 953 819 712 1,244 5,183 Operating costs 45,519 48,565 52,908 57,769 60,576 265,337 Total allowed revenues 149,937 163,584 180,332 196,378 216,322 906,553
A total cumulative savings of 3,072 MW have been achieved through the establishment of its incen-tive programs in the past 10 years (Can et al 2013). About 2/3 of these savings comes from lighting energy efficiency by replacing incandescent bulbs with efficient compact fluorescent light (CFL) bulbs. RSA has also developed solid metrics to support its savings accounting, following the Interna-tional Performance Measurement and Verification Protocol (IPMVP). However, the residential sector remains difficult to reach because of its diffuse nature and, setting appropriate prices for efficiency incentives to attract investment in that sector has also been perceived as challenging. In 2011, the South African Government put forward an Integrated Resource Plan (IRP) to help mini-mize greenhouse gas emissions related to fossil fuels and help boost job creation. The updated IRP 2010-2030 forms a subset of the overall South African Energy Plan, calling for a total installed ca-pacity of 17.8 GW of renewable energy and 42% of all new generation capacity developed up to 2030. The planned capacity comprises 8,400 MW of wind and solar photovoltaic each, and 1,000 MW of concentrated solar thermal. Excluding existing hydro this brings the renewable energy share of power supply to 9%. This is limited compared to the coal generation capacity, which will continue to make up about 60% of the generation fleet. After a nearly 2 year stalemate process of attempting to put in place the Renewable Energy Feed-in Tariff (REFIT), the program was replaced by the competitive bidding process (REBID) in August of 2011, known as the Renewable Energy Independent Power Producer Procurement Programme (REIPPP). The REIPPP has been designed to deliver the target of 3,625 MW of renewable energy to start and stimulate the renewable energy industry in South Africa, where bidders are required to bid on tariff and the identified socio-economic development objectives. The Government has committed to procuring 3,725 MW of RE for the national grid by 2016 and to create at least 50,000 green jobs by 2020. The White Paper on Renewable Energy of 2003 lays the foundation for the widespread implemen-tation of renewable energy and sets a target (currently not mandatory, only a policy objective) of 10,000 GWh of renewable energy contribution to final energy demand by 2013. The Energy Efficiency Strategy of 2005 sets out a national target (currently not mandatory, only a policy objective) for energy efficiency improvement of 12% by 2015 and provides for a number of “enabling instruments”. The Biofuels Industrial Strategy of 2007 proposes the adoption of a 5-year pilot program to achieve a 2% penetration level of biofuels in the national liquid fuel supply. The Strategy recommends the use of a fuel levy exemption for biodiesel and bioethanol.
32
The National Cleaner Production Strategy of 2004 seeks to “enable South African society and in-dustry to develop its long term full potential by... adopting the principles of Cleaner Production... and promoting the practices of sustainable consumption.” South Africa is a member of the Southern African Power Pool (SAPP), which began in 1996 as the first formal international power pool in Africa with a mission to provide reliable and economical electricity supply to consumers in SAPP member countries. This creates an opportunity for the export of residentially generated power from rooftop solar PVs. 4.2.2 Setting for solar and bioethanol based EE and climate change mitigation
Current Power Sources Coal, oil, gas, nuclear, hydro, biomass, solar, wind Energy Sufficiency Inadequate Energy Source for Future Expansion Coal power and Renewable energy EXAMPLE Natural Resources to be Tar-geted for Participatory Energy Produc-tion and Supply
Solar (relatively high insolation levels) and biofuels (relatively high agro potential)
Market Opportunity Residential and national consumption Enabling Participatory Energy Produc-tion Technology
Rooftop solar PV, Available biofuels production technologies
Energy Efficiency Opportunity Decentralised power source (national) and energy efficient bulbs (household), and replacement of inefficient household cooking energies
(i) Rooftop to Grid Power Sales Infra-structure.
(ii) Ethanol Distribution Infrastructure.
(i) 75% available country-wide grid connection to households. (ii) Filling stations, supermarkets, dedicated ethanol outlets
distributed throughout South Africa.
Contribution to Global Concern Reduction in GHG emissions due to use of coal, biomass and petroleum energies.
4.2.3 Effects of EE and climate change mitigation policies on electricity scenario As summarised in the table above, energy efficiency for the South African case study residential solar PVs is in form of energy use and use of CFLs at the point of generation and savings from long-range grid transmission to residential houses. In the case study for replacing kerosene with bioethanol, the EE is in form of using improved cookstoves, reduced indoor air pollution health related energy use for treatments and the switch from inefficient biomass (wood, charcoal, etc.) based cooking and kerosene to electricity and bioethanol by rural communities producing bioethanol due to their newly acquired affluence. The greenhouse gas emission savings are in form of reduced use of fossil fuels (coal, oil and gas) and reduced deforestation. 4.2.3.1 Policy: All households must have RT solar PVs with net meters
(where RTPV = rooftop photovoltaic) In 2012, 74.2% of South Africa’s households were electrified which was approximately 9.8 million households. Assuming a constant electrification rate, the number of electrified households is projected to increase to 12.4 million in 2020 and 16.7 million in 2030. These are the projections considered in this analysis to illustrate the effect of the energy efficiency policy measures. The 16.7 million house-holds would have the potential to generate about 116,000 Gigawatt-hours of electricity if all installed 5kW solar systems by 2030. The graph in Figure 4.4 obtained using Excel indicates projected electricity generation, assuming no additional installations to the current capacity, from current capacity with additional generation from rooftop solar PV systems installed on electrified households as well as electricity consumption pro-jected on a business-as-usual scenario. The policy measure proposed stipulates mandatory installation

of 5kW tering. PPV syste This polpurposes(LSM) 7househo The resurica woustallationthe surptional re
4.2.3.2
(wh Figure 4tricity coerage rat18 Watttricity adaily po0.54kWh
solar PV syPolicy suggeem – hence t
licy measures of estimati
7 or higher wolds would ha
ults obtaineduld not meet n of at least
plus fed into evenue for th
Figure 4.4
Policy: All h
here RT = roof
4.5 obtained onsumption. ting of 100 Wts by 2030, ths a result of
ower consumh. The energ
ystem per hoests that by 2the gradual in
e is in line wing potential would investave installed
d indicate thathe current 5kW Solar Pthe national
he utility.
4: Power gene
households m
ftop, PV = pho
using ExcelWith a poli
Watts to enehere would bf switching f
mption per hogy saved per
ousehold whi2030, all houncrease.
ith the SouthPV rollout i
t in 5 kWp rd the solar sys
at projected demand. HoPV systems grid and po
eration outlook
must have R
otovoltaic, and
l considers ecy of nationrgy saving Cbe significanfrom standarousehold forhousehold p
ich is conneuseholds in S
h African Intein homes tharooftop Sola
ystems.(IRP2
electricity suowever, with per househo
ossibly expor
k due to reside
RT solar PVs,
d CFLBs = co
energy efficie-wide switch
Compact Flunt reduction rd light bulbr the 10 staner day is 2.4
cted to the nSouth Africa
egrated Resoat only housear PV and th010).
upply from cinvestments
old, electricitrted to the re
ential solar PV
, net meters
ompact fluores
ency as a mhing from staorescent lighin the house
bs to CFLBsndard bulbs 6 kWh.
national grida will have in
ource Plan weholds in livinhat by 2020,
current instas in energy ey demand isegion which
V policy in So
and CFLBs
scent light bul
itigation meaandard lightiht bulbs withhold sector cwhich are e
is 3kWh wh
d to facilitateinstalled a 5k
which assumeng standard about 50%
allations in Sefficiency thrs likely to be
would prov
outh Africa
s
lbs)
asure to reduing bulbs wih an average consumptionenergy efficihile that of C
33
e net-me-kW solar
ed for the measure
% of these
South Af-rough in-e met and ide addi-
uce elec-th an av-rating of
n of elec-ient. The CFLBs is

Fig
Like in benefit oties for stion of C22.1% a2013/14of US$ US$ 1,8kW sola 4.2.3.3 Althougonly donfor whicResults o The totashows th2012 is at 0.5 lihousehonario ye
gure 4.5: Ener
the case of Mof income imsmall and meCompact Flu
and annual in4 to 89.13 (112,750/kW (C
805.20 per har PV system
Policy: Replgh the policy ne for low-inch segregatedobtained usin
al number ofhe business-the baseline itres per hou
old per day. Pears.
rgy outlook du
Morocco, thmprovement,edium enterpuorescent Li
ncreases of 81.03 US centCan et al 20ousehold, th
m.
lace kerosentargets kero
ncome housed data was ang LEAP are
f low-incomeas-usual proyear while 2
usehold per Projected gro
ue to generatio
he policy mejob creation
prises involvight bulbs. I% were apprts) in 2018 (C13), and giv
hus making i
ne with bioethsene use in c
eholds that usavailable frome shown in F
e householdsojected scena2013 – 2030day. Bioeth
owth is based
on by resident
easures presen and povertyved in installaIn South Afrroved in the Can et al 201
ven a US$ 0.it possible to
thanol for hocooking and se kerosene m PASASA
Figure 4.6.
s considered ario for Kero0 are projectehanol consumd on a 3% lo
tial solar PV a
ented in this y eradicationation of Solarica, tariff inMYPD 3, fr
13). For an e10 feed-in ta
o recover cap
ousehold coolighting in afor all their c(2012) and
in this analyosene and Bied years. Kemption is esow-income h
and consumpti
analysis alson as they wouar PV systemncrease by arom 65.5 c/Kstimated capariff, this wopital in abou
oking all householdcooking needDoE Energy
ysis is 9,936ioethanol coerosene consutimated at m
household gro
tion by CFLBs
o have the euld create op
ms as well as an annual av
Kwh (8.1 US pital cost for ould be an inut 7.6 years
ds, the compuds. This is a y Perception
. The graph onsumption. sumption is emaximum 1 owth rate for
34
s
economic pportuni-distribu-
verage of cents) in solar PV
ncome of for the 5
utation is category s (2013).
in figure The year estimated
litre per r the sce-

The graptroducekerosenewhile Bi The numby 2030BioethanKerosenGigawat Given than annucommunassumptand thating, brincookingducing fethanol p
Figure 4.6: P
ph in Figure es Bioethanoe Cookstoveioethanol con
mber of low-0. This represnol consump
ne, there is eltt-Hours from
hat the bioethual economy nities engagetion that 25 %t 50% of the nging the to, this would feedstocks foproduction c
Projected kero
4.7 obtainedol Cookstovs by 2013. Knsumption is
income houssents a demaption per holectricity genm vinasse. R
hanol producof US$ 1.8
ed in feedsto% of the 1.73.47 million
otal for the tgenerate a b
or bioethanolcost.
sene consump
d using LEAes to replace
Kerosene cons estimated a
seholds usingand for 22,97ousehold. In neration poteesults obtain
cer price is Umillion due
ock producti8 million ele
n of the non-two categoribioethanol bal. This is bas
ption under bu
AP shows thee the use of
nsumption isat maximum
g Kerosene f70 Litres peraddition to
ential of 223ned using LE
US$ 1/litre ane to bioethanion, to supplectrified hou-electrified hies to 2.18 mased economed on the ass
usiness-as-usu
e impact of af kerosene. T
estimated as1 litre per ho
for cooking ir day of Bioproviding th
.02 GigawattEAP are show
nd that feedsnol alone injly the 9,936 useholds are households armillion hous
my of US$ 39sumption tha
ual scenario in
scenario witThe policy sus 0.5 litres pousehold per
is estimated ethanol, assuhe needed Bt-Hours from
wn in Figure
stock cost is jected in thelow-incomeusing 100% re using 100seholds usin97.850 millioat feedstocks
n South Africa
ith a policy wuggests repl
per householdr day.
to increase tuming 1 litreBioethanol tom bagasse an
4.8.
50%, there we householdse households paraffin for
0% paraffin fng 100% paron to rural as cost 50% of
35
a
which in-lacing all d per day
to 22,970 e per day o replace nd 272.31
would be s of rural s. On the r cooking for cook-raffin for areas pro-f the bio-

Fi
For 26.6nasse, thUS$ 0.1househoducing r
igure 4.7: Proj
Figure 4.8:
6 kWh per lithere would b0/kWh FIT,
olds x 1 litrerural commu
jected kerosen
: Projected bio
tre of bioethbe a total of
this would g/household xnities.
ne replacemen
oethanol consu
hanol co-gene67.2 kWh cogenerate an ax 365 days/y
nt with bioetha
umption in lo
erated from o-generated additional ecyear x 67.2 k
anol for cooki
w-income hou
bagasse and per litre of bconomy workWh/litre x U
ing in low-inc
useholds in So
40.6 kWh cbioethanol prth US$ 5.35 US$0.10/kW
come househo
outh Africa.
co-generated roduced. Ass billion (2.1
Wh) in feedst
36
lds
from vi-suming a 8 million tock pro-

4.2.4 4.2.4.1 The graptricity a2014). Lmetric tmeasure By subs3 hours)hours) pfrom coeach hou14.891 m
4.2.4.2 The grapterms ofClean C(baselineconsumpHowevein 2030.
Carbon dio
Savings dueph in Figure
and heat proLinear projectons of CO2es to install s
tituting stand) per day, wiper day, woual – fired plusehold willmillion tons K
Figu
Savings dueph in Figuref Green Hou
Cookstove wie) indicates ption. The emer, using Bioe
oxide emiss
e to residentie 4.8 obtaineoduction. Hicted amount
2 would be solar PV syst
dard 100 W ith 10 x 18Wuld result in lants, there il avoid 2.443Kg CO2 equi
ure 4.8: Projec
e to replaceme 4.9 obtaineuse Gasses ill significanan increase
missions are ethanol redu
sion saving
ial RT solard using Exceistorical datat is 320.45 msaved if renems per hou
bulbs, 10 ofW CFLBs wh
a saving ofis 0.993 Kg 3 Kg CO2 peivalent would
cted CO2 emis
ment of kerosed using LEA(GHG) emis
ntly reduce gin net GHGprojected toces the emis
gs
PVs policyel indicates
a is up to 229million Metr
newable enersehold are in
f which woulhich would cof 2.46 kWh/CO2 – equiv
er day. Thusd be avoided
ssions from pr
sene by bioeAP shows essions. Repl
greenhouse gG emissions fo increase to ssions from a
a linear incr9.05 million ric tons in 2rgy and enernstituted.
ld consume 3onsume 0.54day. For evevalent emitte, for a total
d in 2030 alo
roduction of e
thanol nvironmentalacement of gas emissionsfrom low-inc33 Metric T
an estimated
ease in CO2metric tons i
2030.The addrgy efficienc
3 kWh (10 b4 kWh (10 buery kWh of ed. Therefor16.7 million ne, due to us
lectricity and
al impact of kerosene by
s. The businecome househonnes of CO19.8 tonnes
2 emission frin 2011 (Wo
dditional 91.4cy mandator
bulbs x 100 Wulbs x 18 W/electricity g
re, by use ofn households se of CFLBs
heat.
the two scey bioethanol
ness-as-usual holds from K
O2 equivalentin 2012 to 3
37
rom elec-orld Bank 4 million ry policy
W/bulb x /bulb x 3
generated f CFLBs, in 2030,
.
narios in l used in scenario
Kerosene t in 2030. .4 tonnes
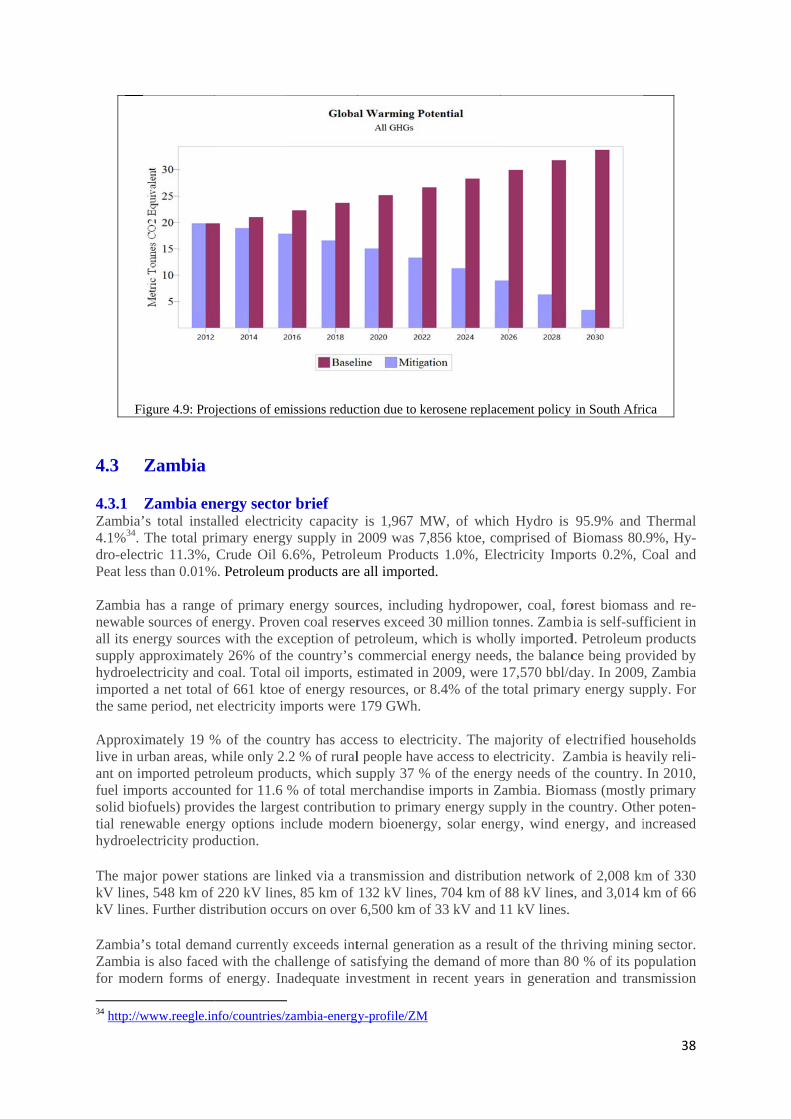
Fi
4.3 4.3.1 Zambia’4.1%34. dro-elecPeat less Zambia newableall its ensupply ahydroeleimportedthe same Approxilive in uant on imfuel impsolid biotial renehydroele The majkV lineskV lines Zambia’Zambia for mod
34 http://w
igure 4.9: Proj
Zambia
Zambia en’s total instaThe total pr
ctric 11.3%, s than 0.01%
has a rangee sources of energy sourceapproximatelectricity and d a net total e period, net
imately 19 %urban areas, wmported petrports accountofuels) proviewable energectricity prod
jor power stas, 548 km of s. Further dis
’s total demais also faced
dern forms o
www.reegle.in
jections of em
nergy sectoralled electricimary energyCrude Oil 6
%. Petroleum
e of primary energy. Proves with the exly 26% of thcoal. Total oof 661 ktoe electricity im
% of the couwhile only 2.roleum produted for 11.6 ides the largegy options induction.
ations are linf 220 kV linestribution occ
and currentlyd with the chof energy. In
nfo/countries/z
missions reduc
r brief city capacityy supply in 2
6.6%, Petroleproducts are
energy sourven coal reserxception of p
he country’s oil imports, eof energy re
mports were
untry has acc.2 % of ruralucts, which s% of total m
est contributinclude mode
nked via a tres, 85 km of curs on over
y exceeds inthallenge of sanadequate inv
zambia-energy
ction due to ke
y is 1,967 M2009 was 7,eum Produce all imported
rces, includinrves exceed 3petroleum, wcommercial estimated in esources, or 179 GWh.
cess to electrl people havesupply 37 %
merchandise ion to primarern bioenerg
ransmission 132 kV lines6,500 km of
ternal generaatisfying thevestment in
y-profile/ZM
erosene replac
MW, of whic,856 ktoe, cots 1.0%, Eled.
ng hydropow30 million to
which is whoenergy need2009, were 8.4% of the
ricity. The me access to el
% of the energimports in Zry energy su
gy, solar ene
and distributs, 704 km off 33 kV and
ation as a rese demand of
recent years
cement policy
ch Hydro is omprised of Bectricity Imp
wer, coal, foonnes. Zambilly imported
ds, the balanc17,570 bbl/dtotal primar
majority of electricity. Zagy needs of t
Zambia. Biomupply in the crgy, wind en
tion networkf 88 kV lines11 kV lines.
sult of the thmore than 80s in generati
in South Afri
95.9% and Biomass 80.
ports 0.2%, C
orest biomassia is self-suf
d. Petroleum ce being proday. In 2009ry energy sup
electrified hoambia is heathe country.
mass (mostlycountry. Othnergy, and i
k of 2,008 kms, and 3,014 k
hriving minin0 % of its poion and tran
38
ica
Thermal .9%, Hy-Coal and
s and re-fficient in products
ovided by , Zambia pply. For
ouseholds avily reli-
In 2010, y primary er poten-increased
m of 330 km of 66
ng sector. opulation nsmission

39
infrastructure has led to deterioration in the power network. Sub-economic power tariffs have been blamed as a reason for lacking financial mobilisation. Sale of electric power tariffs in Zambia are amongst the lowest in the region. In 2008, 450 MW were unavailable from the country’s generating infrastructure, leading to a peak-period deficit of 280 MW. Load-management has been practiced since, in order to maintain the balance of supply and demand. Transmission and distribution losses in 2009 were 23.0%, or approximately 2,407 GWh. As regards renewable energy, average solar insolation is roughly 5.5 kWh/m²/day, with approxi-mately 3,000 sunshine hours annually, providing good potential for solar thermal and photovoltaic exploitation. Wind speeds average 2.5m/s at 10m above the ground, a speed which is mainly suitable for mechanical applications. Seven areas have been identified as viable for off-grid wind power gen-eration, although little development has occurred. There is high potential for biomass based energy as the country’s woodlands and forests are estimated to cover about 50 million hectares or 66 % of Zambia's total land area. About 341,000 units of biogas digesters are currently operational in the country. Sugar cane is being grown in three provinces, and processed by three different companies with a projected capacity of 483,000 tonnes of sugar per year. At present no ethanol is being pro-duced by the main sugar growing companies. Zambia has geothermal energy potential, although it has not been examined in great detail. Geothermal power installation at Kapisha has been constructed, totalling some 200 kW, but only as a means for assessing potential. Over 80 hot springs exist in the country. Small hydro potential stands at 4 MW while large-hydro power potential is 6,000MW, of which less than 2,000MW has been harnessed. Sites yet to be developed include Kafue Gorge Lower, Itezhi Tezhi, Kalungwishi, Mambilima, Batoka Gorge, Devil’s Gorge, Kabompo, and others. The Energy Regulation Board is involved in Regional & Country Energy Efficiency, through Pro-moting energy awareness and disseminating useful information on energy efficiency measures, Car-rying out technical audits on businesses such as farming, and Developing appropriate license condi-tions on EE such as metering all customers. In response to rising industrial consumption and stagnating infrastructure development, demand-side management is seen as a key short-term strategy, and ZESCO has identified the potential for several measures, including increasing compact fluorescent lamp (CFL) use in all sectors through tax breaks and retail partnerships; a prepaid meter installation program,; and public sector energy efficiency measures, for example a metal halide street lighting program. The Zambia Electricity Supply Corporation is Zambia’s largest power utility, and is government-owned. Copperbelt Energy Corporation PLC is a privately owned company that operates and main-tains transmission, distribution and generation assets and a control centre on the copper-belt. Lunsemfwa Hydro Power Corporation is a privately owned independent power producer (IPP) created after the privatisation of the Zambian mining conglomerate, ZCCM. Lunsemfwa has an installed ca-pacity of about 40MW, and currently sells all its power to ZESCO under a power purchase agreement (PPA). In the electricity sector in Zambia, there are 3 operators, ZESCO, CEC and Lunsemfwa. ZESCO is engaged in generation (ZESCO 94%, CEC 4%, Lunsemfwa 2%) and transmission activities (ZESCO 69%, CEC 29%, Lunsemfwa 2%). ZESCO and the Zambian electricity market are vertically inte-grated, with the state company engaging in all sectors of the market. ZESCO is a state owned com-pany whereas CEC and Lunsemfwa are privately financed and operated. Since the dissolution of the former parastatal monopoly, the Zambian Oil Company, private sector participation in the sector has grown, and the number oil distribution companies operating in the country have risen from 5 to 19.

40
The development plans based on the Energy Policy 1994, and the succeeding policy in May 2008, have put more emphasis on grid hydro-electricity compared to other renewable energy technologies. These plans include the Poverty Reduction Strategy Paper (PRSP), Transitional National Devel-opment Plan (TNDP) (2002-2005), the Fifth National Development Plan (FNDP) (2006-2010), and the Sixth National Development Plan (2011-2015). The PRSP acknowledges the importance of har-nessing renewable energy resources to meet the country’s energy needs. However, no investment strategy or targets for renewable energy technologies are defined in the PRSP and the main focus is on hydropower. The Sixth NDP sets out specific goals for the energy sector, including increasing capac-ity by 1,000 MW compared to 2010 levels, improving rural and national electrification to 15% and 40% respectively, and increasing the capacity of petroleum bulk storage facilities, to enable the stor-age of 30 days of strategic stock. Programme goals under the NDP include Implementing a cost-effective electricity tariff regime; Es-tablishing an open and non-discriminatory transmission access regime in the sector; Introducing and appropriate cost-effective renewable energy feed-in tariff; Promoting the use of biogas for cooking, lighting and electricity generation; Increase biofuel substitution for mineral oil (E10 and B5), and De-velop a Biomass Energy Strategy, to improve the sustainability and effectiveness of biomass supply. Also covered under the Sixth NDP are plans to further implement the Rural Electrification Master Plan (REMP), build capacity in the engineering sector for energy efficiency and develop an Energy Efficiency Plan, and further develop the environmental technology industry in the country, with an incentive framework. The National Energy Policy 2008 also sets out a number of policy measures for renewable energy, including the investigation of RE potentials, the strengthening of the institutional framework for RE research and development, and the provision of financial and fiscal implements for the stimulation of RE deployment. The Global Village Energy Partnership (GVEP), in association with the Department of Energy, and the Ministry of Energy and Water Development, are working on a mechanism to increase access to reliable, affordable, and environmentally sustainable energy services as a means of enhancing eco-nomic and social development. Major bottlenecks in applying renewable energy technologies (RETs) in rural settings relate to com-munities’ level of income, policy and planning implications, the nature of the supply networks, and information on RETs. Lack of information on these and other factors inhibits the drive towards appli-cation of RETS. The Zambia Electricity Supply Corporation (ZESCO) has completed feasibility studies for the devel-opment of two hydro power stations with a combined capacity of 870MW and construction is set to begin soon. Both ZESCO and the CEC are members of the Southern African Power Pool (SAPP, http://www.sapp.co.zw/) for Zambia, an organisation dedicated to promoting integration in power networks, to further regional development. The members of the SAPP have undertaken to create a common market for electricity in the SADC region, and to let their customers benefit from the ad-vantages associated with this market. This is an opportunity for Zambia to export excess power. The Ministry of Energy and Water Development (MEWD) has the overall responsibility to develop and implement policy on energy. The Ministry of Tourism, Environment and Natural Resources is responsible for the formulation of policy on forestry and the environment, and works with the Ministry of Energy on issues of biomass, especially on the energy supply side.
41
The Rural Electrification Authority established through an Act of Parliament in 2003, is in charge of developing and implementing master plans for the systematic electrification of rural areas, including developing mechanisms for the operation of a grid extension network for rural electrification, as well as applying a subsidy for capital costs on projects designed to supply energy in rural areas. The Energy Sector Advisory Group is a committee formed under the MEWD, containing representa-tives from government ministries and authorities, development agencies, and commercial enterprises. Its purpose is to encourage harmony between all sectors of the economy in terms of energy policy, and provide an informed opinion on energy matters to policy-makers. The Ministry of Energy and Water Development has a long-term Energy Strategy (2009 – 2030) fo-cusing on electricity, petroleum, and renewable energy. In addition, there are plans for the formula-tion of a RE strategy with focus on solar energy, small hydropower, energy crops, biomass, and an environmental framework for biofuels. Renewable energies have been investigated by the Government through a number of different plans. A position paper on feed-in tariffs is set to be published in June 2012. Currently, no specific regulatory framework for renewable energies exists in the country, and the En-ergy Regulation Act makes limited mention of renewable energy sources. Through the NEP 2008, the creation of a feed-in tariff system is nearing completion. Solar energy regulation is more developed than that for any other source. So far, a licensing regime for solar power operators has been devel-oped, allowing the licensee to engage in the manufacture, supply, installation and maintenance of so-lar systems. In 2008, the Zambian Government revised the energy policy to include biofuels into the national fuel mix. Since then the Government has issued a Statutory Instrument SI 42 of 2008 which lawfully rec-ognizes biofuels in the national energy mix, B5 and E10 blending targets, Standards ZS E100 (for Bi-oethanol) and ZS B100 (for Biodiesel), and Guidelines and Regulations for biofuels. The Government has also recently announced producer prices for bioethanol and biodiesel. The Zambian government’s overall energy policy objectives and measures aim at creating “conditions that will ensure the availability of adequate supply of energy from various sources, which are depend-able, at the lowest economic, financial, social and environmental cost consistent with national devel-opment goals”. In relation to biomass resources, the policy states that “To improve the standard of living there is need to switch from these low quality energy sources to better quality energy re-sources”. Government’s intentions by introducing biofuels are, among others, to mitigate climate change, improve energy security, conserve the environment, promote rural development, foster tech-nological development, create jobs, alleviate poverty, co-generate electricity, empower citizens, and enhance food security. The Energy Regulation Board (ERB) is responsible for ensuring that utilities earn a reasonable rate of return on their investments that is necessary to provide a quality service at affordable prices to the consumer; ensuring that all energy utilities in the sector are licensed, and monitoring levels and structures of competition, including investigations and remedies if necessary. Tariff-setting for the sale of electricity is also the responsibility of the ERB. The ERB safeguards the interests of the consumer, licences energy undertakings, and receives and investigates complaints from consumers on prices and services. The ERB also regulates the refining, marketing of, importation and transportation of crude and finished petroleum products. Implementation to showcase the viability of renewable energy technologies in the country has been limited, with only a few small scale demonstration projects.

42
4.3.2 Setting for bioethanol based EE and climate change mitigation in Zambia
Current Power Sources Biomass, hydro, oil, and coal Energy Sufficiency Inadequate Energy Sources for Future Expansion Hydro, Renewable energy, and Coal EXAMPLE Natural Resource to be Tar-geted for Participatory Energy Produc-tion and Supply
Biofuels (High agro potential)
Market Opportunity Residential for cooking and excess for transport fuel Enabling Participatory Energy Produc-tion Technology
Available biofuels production technologies
Energy Efficiency Opportunity Replacement of inefficient household cooking energies
Biofuels Distribution Infrastructure Pump stations and shops distributed throughout urban areas in Zambia
Contribution to Global Concern Reduction in GHG emissions due to use of wood, charcoal and petroleum energies for cooking.
4.3.3 Effects of EE and climate change mitigation policies on electricity scenario In Zambia’s case study of replacing charcoal with bioethanol, the EE is in form of using improved cookstoves, reduced indoor air pollution health related energy use for treatments and the switch from the inefficient biomass (wood, charcoal, etc) based cooking to electricity and bioethanol by rural communities producing bioethanol due to their newly acquired affluence. The greenhouse gas emis-sion savings are in form of reduced use of charcoal, fossil fuels and deforestation. In this analysis, all results were obtained using LEAP. 4.3.3.1 Policy: Replace charcoal with bioethanol for household cooking Assumptions on energy sources for cooking in the baseline year (2010) include Charcoal consumption 2.5 Kg per day per household, a Corresponding bioethanol consumption of 1 litre per day per house-hold, Electricity consumption of 8.3 kWh per day per household (estimated based on the assumption that electricity consumption per household per month is 500 kWh of which 50% is used for cooking). The number of urban households using 100% charcoal is considered to be 1,020,906 in Zambia in 2010, which is projected to increase to 1,909,598 in 2030. These are urban households and they rep-resent 39% of the total number of urban households in Zambia in 2010, and the same proportion is assumed throughout up to 2030. The graph in Figure 4.10 gives projections for the business-as-usual scenario up to 2013, while Table 4.2 and Figure 4.11 give projected results up to 2030 for the policy of substituting charcoal with bioethanol. There is a very significant reduction in charcoal use. If 1,126,662 households are using bioethanol by 2030, the total annual bioethanol consumption would be 411,231,929 litres, for the 1 litre consumption per household per day. Given a bioethanol producer price of US$1/litre and that 50% would be the cost of feedstock supplied by rural communities, there would be US$ 205.62 million of annual retained economy due to bioethanol alone.
Table 4.2: Projected proportions of households using bioethanol, charcoal and electricity in Zambia
2010 2015 2020 2025 2030
Bioethanol (%) 1 16 30 45 59
Charcoal (%) 63 49 34 20 5
Electricity (%) 36 36 36 36 36
Total (%) 100 100 100 100 100

Figure
ElectricDuring stover/b
Figure 4.1
e 4.11: Project
city Generatproduction oagasse and
10: Projection
ted energy con
tion Potentiaof bioethanovinasse from
ns for the busin
nsumption und
al – Analysisol, there is am the refiner
ness-as-usual
der policy to s
s for 2030 an opportuniry. The assu
energy types
substitute char
ity to co-genumptions her
consumption
rcoal with bio
nerate electrre include 1
in Zambia
oethanol in Za
ricity from f,126,662 ho
43
mbia
feedstock ouseholds

using biconsump411,231 To obtailitre of 2,878,62this is matile mat Overall,which aproducin Togethetained e 4.3.3.2 EnvironUnder Bin Zambcharcoa
Fig
35 Sweeth36 Ibid (P37 Ibid (P
ioethanol by ption per hou,929.3 litres
in amount off bioethanol23,505.1 litre
multiplied by tter37 yields
, the power at a FIT of Ung communi
er with bioetheconomy in f
CO2 emissio
nmental FooBAU, the GHbia would be
al substitution
gure 4.12: Emi
hanol_TechnicPage 50) Page 49)
2030, bringusehold per damounts to a
f power co-gl produced3
es of vinassethe amount
13,357 Giga
co-generatedUS$ 0.10/kWities in the ye
hanol at US$feedstock pro
on savings du
otprint – COHG emissione about 140 n with bioeth
ission projecti
cal_Final (Pag
ing the total day. The powabout 10,939
generated fro5. The 411
e. The rate oof bioethanowatt-hours.
d from both Wh would inear 2030.
$ 205.62 miloducer rural c
ue to replace
O2 Equivalens due to cha
thousand tohanol, the em
ions for the bu
ge 49)
annual conswer generatio9 Gigawatt-h
om vinasse, t1,231,929.3
of power co-gol and assum
bagasse andnject an econ
llion per yeacommunities
ement of cha
ent of All emarcoal use foronnes by 203missions wou
usiness-as-usu
sumption to on potential
hours.
the assumptilitres prod
generation frme 80 % of th
d vinasse is nomy of US
ar would adds.
arcoal by bio
missions r cooking by30, as shown
uld drop dow
ual and under
411,231,929at a rate of 2
on is 7 litresduced will rom vinasse he result to ta
24,296 (13,3$ 2.43 billio
d up to 2.635
oethanol
y the 1,126,6n in Figure 4n to about 10
bioethanol mi
9 litres, for th26.6 kWh/litr
s of vinasse ftherefore ris 5.8 kWh/
take into acco
357 + 10,93on for the bi
5 billion of a
662 urban ho4.12. By int0 thousand to
itigation polic
44
he 1 litre re for the
for every result in /litre36. If ount vol-
9) GWh, ioethanol
nnual re-
ouseholds troducing onnes.
cy.

45
5 ADDITIONAL POLICY MEASURES The policy pronouncements to have all residential houses in Morocco and South Africa fitted with net-metred solar PV systems and to have kerosene in South Africa and charcoal in Zambia replaced by bioethanol are not sufficient unless other practical measures are put in place. The measures should recognise the prevailing poverty and joblessness in the three countries, the lack of affordability for the people to effectively participate in implementing the policies; the opportunities to localise renewable energy technologies especially in the wake of created increased economies of scale; and the need to for governments to use renewable industry as an opportunity for propelling citizens on the inclusive growth path. Some of these measures are outlined below.
5.1 Attractive Feed-in Tariffs and Cost of Bioethanol The cost of power from residential rooftop solar PV (RRS PV) should be lower than the grid power cost. Overall, here is how the system should work: 5.1.1 Attractive Feed-in Tariffs If targeted communities install electricity-generating technology from a renewable or low-carbon source such as solar PV or wind turbine, the Feed-In Tariffs scheme (FITs) should mean that the tar-geted producers get money from energy suppliers (e.g. ESCOs), similar to measures used in, for ex-ample, the UK38. In the UK, You can be paid for the electricity you generate, even if you use it your-self, and for any surplus electricity you export to the grid. And of course you'll also save money on your electricity bill, because you'll be using your own electricity. Most domestic technologies qualify for the scheme, including solar electricity (PV) (roof mounted or stand-alone), wind turbines (building mounted or free standing), hydroelectricity, anaerobic digesters and micro combined heat and power (CHP). 5.1.2 Attractive Cost of Ethanol The cost of bioethanol comprises the cost of production, producer’s mark-up, retailer’s mark-up and government taxes. For charcoal in Zambia government does not collect taxes while in South Africa, the government through the Free Basic Alternative Energy (FBAE) policy programme subsidises the consumption of energy sources such as paraffin, LPG and ethanol gel fuel (Tait et al 2013). The selling price of bioethanol which would be denatured for use in Clean Cookstoves can therefore be kept at retailer’s mark-up, with a government set maximum, so that the bioethanol price remains more attractive. Government would however collect VAT from bioethanol producers. At the same time, the price of kerosene should be raised to an unsubsidised value so that it is economically unat-tractive. The latter is justified owing to the need to reduce deaths and ailments related to indoor air pollution, accidents and deaths, and green-house gas emissions related to kerosene use for cooking and lighting.
5.2 Lowering Production Cost of Energy To lower the cost of energy production, policy measures can include instituting incentives such as lowering import duties for solar and bio-refinery equipment, promoting local manufacturing of pro-duction equipment, and investing in R&D to improve production efficiencies.
5.3 Job creation and Local Content Policy The policies as stated above would create increased and predictable market volumes enough to war-rant local manufacturing of RE technology equipment. The incentives here can therefore include low-ering of the cost of national made RE products and increase jobs in RE manufacturing supply chains, RE manufacturing, design engineering, installation and all the miscellaneous jobs created when an RE
38 www.energysavingtrust.org.uk/Generating-energy/Getting-money-back/Feed-In-Tariffs-scheme-FITs.

46
array is established. This would further promote forward and backward industrial linkages in national economies (Sinkala 2014).
5.4 Inclusive Innovative Financing Barriers to financing mean that, in the past, energy efficiency has not been able to attract significant amounts of private capital. These barriers take a range of well-recognised forms. Financial barriers include the initial cost barrier, high transaction costs, long payback time, and risk exposure (ACE 2013). Furthermore, lack of knowledge among finance providers about energy efficiency prevents customers from accessing capital, and the absence of standardised measurement and verification practice further increases transaction costs. Various innovative ways of financing energy efficiency and clean energy programs exist and they are crafted in various forms including (ACE 2013): 5.4.1 Soft loans These are loans that are enhanced or ‘softened’, for example with low interest rates and/or interest-free periods at the start of the loan term (also called preferential loans). In most cases, preferential loans are delivered through public-private partnerships where the government provides a financial support to the bank, which in turn offers a preferential interest rate to its customers. Loans may be provided to an individual residential or non-residential customer, or to a group of customers, such as an apartment association or micro-finance group. 5.4.2 On-bill repayment This approach uses utility or third-party capital to pay for energy efficiency or renewable energy ret-rofits in a building. The customer repays the cost of this through an additional charge on their utility bill 5.4.3 Guarantee programmes Energy efficiency projects can be structured with various guarantees. Guarantee mechanisms seek to engage financial institutions by supporting and sharing the credit risk of energy efficiency invest-ments. In this way they help financiers to accept the risk for debt lending and act as a catalyst to scale up private investment in energy efficiency. 5.4.4 Property-assessed repayment This is an approach developed in the United States, from 2007, that enables local governments to fi-nance energy efficiency improvements using land-secured special assessment or ‘improvement dis-trict’ structures. Under such authority, local governments issue bonds to finance local improvements that have a public purpose. They then collect the money to repay the bond through assessments levied against properties that receive a benefit from the improvements. In a typical Property assessed clean energy (PACE) program, existing municipal improvement district authority is expanded to include energy efficiency or renewable energy improvements on private property. Property owners voluntarily agree to have assessments levied against their property in exchange for receiving the up-front capital for the energy efficiency improvements. 5.4.5 Energy service companies These are generally companies which offer energy demand reduction services, often financed through so-called ‘performance contracting’, where the energy savings generate cash flow which pays for the installation of the equipment plus a margin. In most developed markets the energy service company (ESCO) assumes the costs of the equipment, process replacement and building retrofit through an en-ergy performance contract (EPC). Payback is defined as a percentage of energy savings as stipulated in the EPC.

47
Establishing a clean energy rate can be justified in various ways. For example, a Value of RE (VoRE) is a rate that includes all of the environmental and financial benefits of establishing RE39. For exam-ple, what is the value of not burning charcoal to cook, or coal and oil to create electricity? What is the value of eliminating high cost infrastructure upgrades like high voltage transmission lines or more power plant upgrades? The VoRE Rate will put a true value on all those benefits accrued when an RE system is established. The VoRE rate will do two things:
It will allow for a guaranteed rate of return for the next XX years of production of an RE sys-tem; and
The VoRE rate encourages lending from financing companies to enable establishment of RE at little to no up-front cost.
7 DISCUSSION AND CONCLUSIONS In this study, it has been demonstrated that by adopting a low-emission development, it is possible for countries to advance a win-win sustainable, climate-resilient development for both pro-poor and pri-vate-sector growth while significantly reducing the greenhouse gas emissions. For Morocco, it has been demonstrated how the country can involve citizens to economically partici-pate in independently generating power using residential net-metered solar PVs which would contrib-ute to meeting power needs for their households and the country as a whole, beyond which there is also an export potential. This policy approach enables people to earn money by selling their excess power to the national grid, thereby reducing poverty. The efficiency is achieved through on-site power generation for residential use, thus avoiding long-range power transmission losses. Furthermore, there is power savings through the use of compact fluorescent energy saving light bulbs. For South Africa, a similar analysis has been demonstrated with residential solar PVs. But, in addi-tion, there is also an illustration where kerosene use for cooking is replaced by bioethanol use in clean cookstoves. Here again, the emphasis is involvement of people in this substitution programme as a way of providing jobs and reducing poverty. People would earn money from selling excess power from their net-metered residential solar PVs, and they would also participate in the bioethanol pro-duction and supply value chain. Since South Africa has issued blending mandates for biofuels, the excess bioethanol produced would be sold for motor transport energy mix. For Zambia where biomass, mainly wood and charcoal, accounts for about 77% of the nation’s en-ergy needs, the demonstration in this study has been to replace charcoal and charcoal braziers (im-babula) with bioethanol use in efficient and clean cookstoves. The example shows that the country can enable people gain access to modern clean energy as they also get economically empowered through participation in the value chain of the bioethanol industry. In particular, as much as 50 to 60% of the cost of producing a litre of bioethanol is attributed to feedstock production. This is the mini-mum size of the economy that would possessed by peoples in rural areas who would be participating in feedstock production and supply to bioethanol refineries. In the cases of Morocco and South Africa, use of solar PVs residential houses would significantly save greenhouse gas emissions by reducing the amount of coal that would be required to generate power to meet household demands, especially for lighting. In South Africa, the emissions related to kerosene use would significantly reduce greenhouse gas emissions and the high levels of accidents, which are sometimes fatal. In Zambia, there would be significant carbon savings both due to reduced charcoal use as well as deforestation. In the cases of South Africa and Zambia who would be producing bioethanol to replace kerosene and charcoal use for cooking in households respectively, producers of bioethanol would also be generating
39 www.trunorthsolar.com/2013/09/the‐new‐minnesota‐solar‐rebate‐menu‐what‐you‐need‐to‐know/

48
electricity to meet production and other local energy demands. The raised affordability for rural peo-ple and the decentralised availability of electricity would increase accessibility to modern energy, which would reduce deforestation due to decreased use of wood/charcoal in households. In all cases, the EE/RE/ES programmes can be country-driven, apart from capacity building and tech-nology transfer which may need external help. In addition to clean energy substitution policies, support policies including access to finance, promo-tion of local content for enhancing forward and backward EE/RE/ES industrial linkages, incentives to promote the EE/RE/ES industry, and attractive feed-in tariffs and innovative lowering of bioethanol prices would be important for these policies to be effective. 8 RECOMMENDATIONS The energy efficiency and renewable energy economies are low hanging fruit and support sustainable development. Therefore African countries which happen to possess either all or some of the renewa-ble energy resources should embark on programmes to develop green economies. To actualise estab-lishment of EE/ES-based green economy, the following are recommended: 8.1 Actions by Governments and Development Partners African governments should Carry out audits of the energy efficiency (EE) and emission savings (ES) potential for various sectors and promote investment; Concurrently promote EE/RE/ES and RE pro-jects as these are “tri-pillars” of a sustainable energy future, and have synergetic benefits; and Partic-ularly prioritize EE/RE/ES projects (such as residential solar PVs and biofuels) which involve the poor in the value chain as this would raise affordability by the poor, thus meaningfully promoting their access to modern clean energies and participation in economic development on sustainable basis. To attract investment, governments should also remove operational barriers often encountered in EE/RE/ES programs and projects. Development partners should help with networking EE/RE/ES good practices among African coun-tries, facilitating with inter-regional field visits to success-story areas to gain experiences, developing information databases which will help to improve EE/RE/ES planning and development, building ca-pacity in national/regional stakeholder institutions and key CSOs, and helping to raise fund for mega projects. 8.2 Project target areas with high EE/ES impacts Project target areas with high EE/ES impacts that can be implemented include lighting (energy saving bulbs and RE energy systems), household appliances and equipment (improved cookstoves, promot-ing pre-paid meters, as well as installing RE systems), buildings envelope (retrofitting, refurbishing, design standards for energy-efficient buildings, as well as installation of RE energy systems), large industries and small and medium enterprises (use of energy-efficient processes, installing better me-ters and sub-meters, fixing leaking steam pipes, reducing use of compressed air, and incentivizing RE consumption), transport (use of public transport and use of biofuels (bioethanol, biodiesel and biogas), electricity utilities and power services companies (installation of energy-efficient power generation and distribution facilities), off-grid power generation and supply (decentralized energy systems), and Research, Development, Demonstration and Deployment to provide local solutions for EE/RE/ES (UNECA 2012). 8.3 Potential EE/RE/ES programs/projects Taking into account the Africa regional situation including availability of energy resources, their dis-tribution, their affordability, on-going RE/EE programs, as well as regional energy disparity factors, the RE/EE/ES programs/projects can be based on energy sources including Solar (popular Solar PV Pico systems, and solar home systems for lighting solutions in urban, peri-urban and rural areas), Bio-

49
fuels (using participatory and drought tolerant feedstocks such cassava and sweet sorghum for multi-ple clean energies and economic empowerment of rural and peri-urban population to improve afford-ability of EE/ES measures), Mini-grids based on PV and hybrid systems (including small hydro and wind), Improved Cook Stoves with use of biomass-waste briquettes, biogas and ethanol), Geothermal Heat and Power, Biomass Power Plants (e.g. use of bagasse), Small Scale Hydro Power Plants to ex-ploit the enormous potential existing mostly in Sub-Sahara Africa, Biogas Digesters (small and large, especially in rural and peri-urban areas). 8.4 Financing EE/RE/ES Programs and Projects Governments should Provide environment for establishing funds to support development of EE/RE industries; Incentivise banks and other financial institutions to consider energy efficiency savings and offtake agreements as tangible collateral since they can be measured and costed over time; Facilitate use of part of EE savings made by ESCOs for (i) expansion of services for RE development and emis-sion savings (ES) projects and (ii) soft loans or similar to be accessed for small-medium RE/EE/ES projects. 8.5 Technologies and R&D All basic EE/RE/ES technologies are mature and their costs are progressively decreasing, thus im-proving affordability. However, their promotion should be country-specific, depending on the RE mix available or viable, as evidence from the three case study countries shows. R&D needs to be sup-ported to internalise the RE/EE/ES industry in Africa, and to also progressively reduce the costs of technologies; Sub-regional and international collaboration should be encouraged to reduce R&D costs, and to avoid costs of “re-inventing the wheel”; Sectoral best-practice networks should be pro-moted to improve information flow and development of sectoral databases, which will also help mon-itor progress in RE/EE/ES implementation.
50
REFERENCES ACE. (2013). “Financing Energy Efficiency in Buildings: an international review of best practice and innova-tion”. A report by the Association for the Conservation of Energy (ACE) to the World Energy Council. October. www.eceee.org/all-news/press/2013/2013-10-22/WEC-EEC-Final. AfDB. (2012). “Itezhi‐Tezhi Hydro Power and Transmission Line Project. Project Appraisal Report, Zambia. 13 June. www.afdb.org. Andriani B, Lignières P, Barges M, Bennis A and Mokhtari G. (2013). “Lighting up the Kingdom of Mo-rocco: Energy strategy and recent developments in power projects”. www.linklaters.com. March. Benioff R, Cochran J and Cox S. (2011). “International Experiences and Frameworks to Support Country-Driven Low-Emissions Development”. National Renewable Energy Laboratory (NREL). USA. www.osti.gov/bridge. Can SR, Letschert V, Leventis G, Covary T and Xia X. (2013). “Energy Efficiency Country Study: Republic of South Africa”. By Ernest Orlando Lawrence Berkeley National Laboratory. http://eetd.lbl.gov/sites/all/files/south_africa_country_study_lbnl_report_final.pdf. Chidumayo EN. (2005). “Determining the Non-renewable Portion of Biomass Utilized in Charcoal Production for Lusaka”. http://cdm.unfccc.int. Cîrlig CC. (2013). “Solar Energy Development in Morocco”. Library Briefing, Library of the European Parlia-ment. 8th May. www.europarl.europa.eu. Climate Commission. (2013). “The Critical Decade: Australia’s future – solar energy”. www.climatecommission.gov.au. DoESA Biofuels. (2012). “Regulations Regarding the Mandatory Blending Biofuels with Petrol and Diesel”. Government Gazette No. 9808, Vol 566, No. 35623, Republic of South Africa. www.energy.gov.za DoESA Integrated Electricity. (2013). “Integrated Resource Plan for Electricity (IRP) 2010-2030”. Update Report 2013. Department of Energy of South Africa (DoESA). www.doe-irp.co.za/content/IRP2010_updatea.pdf. DoESA Energy Perceptions. (2013). “A Survey of Energy Related Behaviour and Perceptions in South Africa: the residential sector”. Department of Energy of South Africa (DoESA). www.energy.gov.za/files/media/Pub/DoE-2013-Survey-of-EnergyRelated-Behaviour-and-Perception-in-SA.pdf. EECG. (2013). “Municipal Energy Efficiency Policy Reforms in Georgia”. Report on Georgia National Case Study for Promoting Energy Efficiency Investment by Energy Efficiency Center Georgia (EECG). www.unece.org/fileadmin/DAM/energy/se/pp/eneff/IEEForum_Tbilisi_Sept13/Day_2/ws3/p3/Abulashvili.pdf. Global Harvest Initiative. 2011. “Global Food and Agriculture Productivity: the investment challenge”. http://www.globalharvestinitiative.org/. GTZ and Probec. (2008). “Baseline Study of the Socio‐economic Patterns of Charcoal, Wood and Stove use in greater Lusaka, Zambia”. German Technical Co‐operation (GTZ) and Programme for Basic Energy and Conser-vation (ProBEC). Report 2007/8. www.probec.net. Gumbo, D. J., Moombe, K. B., Kandulu, M. M., Kabwe, G., Ojanen, M., Ndhlovu, E. and Sunderland, T.C.H. (2013). “Dynamics of the Charcoal and Indigenous Timber Trade in Zambia - a scoping study in East-ern, Northern and Northwestern provinces”. Report produced for Center for International Forestry Research (CIFOR). Occasional Paper 86. ISBN 978-602-1504-02-4. Heaps CG. (2012). “Long-range Energy Alternatives Planning (LEAP) system”. [Software version 2012.0056] Stockholm Environment Institute. Somerville, MA, USA. www.energycommunity.org.
51
IEA. (2013). “Trends 2013 in Photovoltaic Applications”. International Energy Agency (IEA). http://iea-pvps.org/fileadmin/dam/public/report/statistics/FINAL_TRENDS_v1.02.pdf Johnson N. (2013). “Safety Protocols for Biomass Cookstoves”. Stove Safety Testing Webinar. 12 April. Glo-cal Alliance for Clean Cookstoves. http://community.cleancookstoves.org/communities/home/22. Johnson NG. (2005). “Risk Analysis and Safety Evaluation of Household Stoves in Developing Nations,” Masters Thesis, Iowa State University. USA. Kamelarczyk KBF. (2009). “Carbon Stock Assessment and Modelling in Zambia”. UN-REDD programme study. Country study. www.unredd.net. Lahbabi A. (2013). “Scaling up Energy Efficiency in Morocco”. Presented at the conference on Energy Effi-ciency of the SEMED/Arab Region. Crowner Plaza Hotel, Amman, Jordan. www.slideshare.net/rcreee/scaling-up-energy-efficiency-in-morocco. Lam NL, Smith KR, Gauthier A and Bates MN. (2013). “Kerosene: A review of household uses and their hazards in low- and middle-income countries”. In J Toxicol Environ Health B Crit Rev. 2012; 15(6): 396–432. doi:10.1080/10937404.2012.710134. www.ncbi.nlm.nih.gov/pmc/articles/PMC3664014/. Letete T, Guma M and Marquard A. (2007). “Information on climate change in South Africa: greenhouse gas emissions and mitigation options”. Topic 3: Carbon accounting for South Africa. www.erc.uct.ac.za. Luwaya E. (2011). “Improving the Conversion Efficiency of Wood to Charcoal in an Earth Kiln”. Presented at the Energy Regulations Board Energy Forum, Hotel Intercontinental, Lusaka, Zambia. 24th -25th August. Mulenga BP, Tembo S and Sitko N. (2013). “Why is Charcoal Consumption High in Urban Zambia?”. Prsented at the Indaba Agricultural Policy Institute (IAPRI). http://fsg.afre.msu.edu/zambia/Mulenga_charcoalConsumption_Zambia_brownbag_rev.pdf. PASASA. (2012). “Busting Household Energy Myths in SA - Using Research to Inform Action”. Press briefing by the Paraffin Safety Association of South Africa (PASASA). http://hesasa.org/household-energy-sources/. Sinkala T. (2014a). “Status of Bioenergy Industry Development in Zambia”. Presented at the Cassava World Africa, Radisson Blu Hotel Lusaka. 20-21 March. Sinkala T. (2014b). “Making Natural Resources Work for Inclusive Growth and Sustainable Development in Southern Africa”. A consultancy report for the UN Economic Commission for Africa - Southern Africa Sub-regional Office. Smith MT, Goebel JS and Blignaut JN. (2013). The financial and economic feasibility of rural house hold biodigesters for poor communities in South Africa”. www.elsevier.com/locate/wasman; www.rncalliance.org. Sweethanol. (2011). “Diffusion of a Sustainable EU Model to Produce 1st Generation Ethanol from Sweet Sor-ghum in Decentralised Plants: Technical Manual”. http://64.34.211.82/Publications/Sweethanol_Technical_Final.pdf. Tait L, Merven B and Senatla M. (2013). “Investigating the current and future roles of paraffin in South Af-rica “ http://www.erc.uct.ac.za/Research/publications/13Tait-etal_Paraffin_in_SA.pdf UNECA. (2012). “Innovative Financing Mechanisms for Clean Energy with Emphasis on Energy Efficiency and Energy Mix”. United Nations Economic Commission for Africa (UNECA). ZDA. (2011). “Energy - sector profile 2011”. Published by Zambia Development Agency.

52
ZNFU. (2014). “Investment Opportunity in Zambia’s Agriculture Sector”. http://photos.state.gov/libraries/zambia/231771/PDFs/ZambiaNationalFarmersUnionInvestmentOpportunities.pdf.

53
APPENDIX: Terms of Reference
Promoting energy efficiency investments for climate change mitigation and sustainable development
_______________________________________________________________ Case Studies of Policy Reforms and Regulatory Frameworks A. Background In recent years, both developed and developing countries are paying greater attention to im-proving energy efficiency because of the rising prices of electricity and the growing demand for finite and diminishing fossil fuel resources. Improved energy efficiency is one of the most cost-effective ways to reduce global greenhouse gas emissions. It also enhances energy secu-rity of the countries by reducing energy demand. To date, energy efficiency has become one of the priority fields in the energy, economic and climate change policies of many countries globally. Energy efficiency improvements are badly needed, also because this is the only self-financing method of reducing GHG emissions. However, at present, financing energy efficiency, par-ticularly in Africa is still a niche industry. Projects may have high internal rates of return (IRR), but do not capture the attention of investors or commercial banks because most pro-jects are small and unfamiliar to local lending institutions. Even high IRRs cannot compen-sate for the high transaction costs banks incur to undertake the due diligence for small pro-jects and to establish political, financial and institutional support for them. In addition, many national experts know the technical fixes needed to improve energy efficiency in their mu-nicipalities, power stations or factories but they do not know how to formulate investment projects so that they meet banks rules, standards and criteria. Bearing in mind the lack of spe-cific incentives in most of the developing countries to introduce the relevant regulatory, pol-icy and institutional reforms in the energy sector, all these barriers represent a forbidding en-vironment for realizing energy efficiency investments. Moreover, current policy and regulatory frameworks in place fosters the development and introduction of more efficient technologies. Furthermore, economies in transition (particu-larly Eastern European countries, most of the countries in Asia and in Latin America) have established an energy efficiency market which is growing because the governments of these countries have coupled their national initiatives with sub-regional, regional and international cooperation initiatives in the field of energy efficiency. However, in many African countries, the regulatory and policy framework for energy efficiency market formation has not been de-veloped and/or implemented yet. For example, many countries do not have dedicated energy efficiency legislation. These countries need to take appropriate actions, with the technical support of international community in order to create the conditions conducive to energy effi-ciency market development. The overall goal of the project is to strengthen capacities of developing countries and coun-tries with economies in transition to attract investments in energy efficiency projects in the context of climate change mitigation and sustainable development. The expected accom-plishments of this project are as follows:
54
i. Improved capacity of national project developers, energy experts and middle-level managers in developing countries and countries with economies in transition to develop energy efficiency investment projects in private and public sectors;
ii. Improved regulatory and institutional framework for promotion of new financing mechanisms for energy efficiency projects;
iii. Increased financing for investments in energy efficiency projects, including through innovative financing mechanisms.
B. The objective of this Assignment This assignment will help achieve the second expected accomplishment of the overall project which is to develop improved regulatory and institutional framework for promotion of new financing mechanisms for energy efficiency projects. This assignment is to prepare three na-tional Case Studies of policy reforms to promote energy efficiency investments. The case studies will provide value added in which policy makers at different levels can be shown what direct social, environmental and financial benefits will be forthcoming from a specific project or series of projects given that particular policy reforms are made. These may be economic, financial, energy pricing and tariff structure, institutional or comparatively simple administrative reforms. But they are often necessary changes for economically attractive and prefeasibility study business plans to become bankable projects which can be financed. C. The Elements of the Case Studies Each Case Study will contain the following elements:
i. A policy reform that has transformed one or more economically attractive invest-ment projects into a bankable project which has been financed;
ii. ii. An assessment of the ‘scaled-up’ potential environmental, economic and finan-cial impact of the case study for selected projects or ‘classes’ of projects including reductions of greenhouse gas emissions;
iii. iii. Recommendations on new reforms to introduce market based energy systems based on case study.
D. Outline of the Case Studies The Case Study will be around 25 pages long in the English language and structured with the following sections:
(a) Sector Characteristics: a description of the energy producing or consuming sector of the case study including the level of greenhouse gas emissions in tonnes of CO2 emitted;
(b) Current Policy: a summary of the relevant policies in place before the reforms were introduced
(c) Energy Efficiency Potential: an assessment of the energy savings and CO2 emission reductions possible from the envisaged energy management practice, controls, tech-nology or efficiency improvement;

55
(d) Assessment Methodology: a description of the analytical tool or models used to as-sess the potential efficiency improvement and to measure results including energy savings and CO2 reductions;
(e) Economic, Environmental and Policy Analysis: an appraisal of the overall impact of the policy measures;
(f) Policy Design Considerations: implications for promoting this successful policy more widely on a national basis;
(g) Conclusions and Recommendations: for future policy development nationally and implications for adoption of a similar approach in neighbouring countries.
Sections (a) and (b) will be provided by ECA staff to the consultant