mni india consumer report march 2014 - mondo visione€¦ · mni india consumer report - march 2014...
TRANSCRIPT
MNI India Consumer Report March 2014
Insight and data for better decisions

MNI India Consumer Report - March 20142
About MNI Indicators Insight and data for better decisions
MNI Indicators offers unique macro-economic data and insight to businesses and the investment community. We produce data and intelligence that is unbiased, pertinent and responsive. Our data moves markets.
Specialising in business and consumer focused macro-economic reports, we give our customers the ability to make timely and relevant decisions. We strive to provide up-to-date information on business and consumer confidence on the economy.
MNI Indicators publishes data on a monthly basis. Our indicators are based on a unique and proprietary methodology and are designed to present an advance picture of the economic landscape as perceived by businesses and consumers every month.
Our monthly reports explore attitudes, perspectives and confidence across different countries and regions. They deliver in-depth analysis, highlight changing patterns and how these can affect potential developments in business and consumer activities.
MNI Indicators is part of MNI, a leading provider of news and intelligence. MNI is a wholly owned subsidiary of Deutsche Börse Group, one of the largest worldwide exchange organisations.
Written and researched byPhilip Uglow, Chief EconomistShaily Mittal, Economist
MNI Indicators | Deutsche Börse Group Westferry House11 Westferry CircusLondon E14 4HETel: +44 (0)20 7862 7444Email: [email protected]
[email protected]@MNIIndicators
Copyright© 2014 MNI Indicators | Deutsche Börse Group. Reproduction or retransmission in whole or in part is prohibited except by permission. All rights reserved.
Release TimeEmbargoed until 9:45 a.m. New Delhi timeApril 1, 2014

MNI India Consumer Report - March 2014 3
MNI India Consumer Report - March 2014Contents
4 Editorial
6 Executive Summary
12 Economic Landscape
16 Indicators
17 MNI India Consumer Indicator
24 Personal Finances
27 Current Business Conditions
30 Durable Buying Conditions
31 Employment Outlook
33 Prices Sentiment
36 Interest Rate Expectations Indicator
37 Stock Investment Indicator
41 Real Estate Investment Indicator
44 Car Purchase Indicator
46 Consumer Sentiment - Regions
50 Consumer Sentiment - Income Group
52 What the Panel Said
55 Data Tables
63 Methodology

Spitzzeile Titel4
In less than a week’s time, the largest election ever witnessed in the world begins in India and, among businesses and investors alike, there is huge anticipation that the new government will turn around the ailing Indian economy.
A Turning Point?

MNI India Consumer Report - March 2014 5
In less than a week’s time, the largest election ever witnessed in the world begins in India and, among businesses and investors alike, there is huge anticipation that the new government will turn around the ailing Indian economy.
India’s 16th national elections kick off on April 7, and continue in a series of stages around the country before concluding on May 12. There are about 815 million eligible voters, of which a record 120 million are aged between 18-22 years and will vote for the first time this year.
The Indian Congress Party (center left) and the Bharatiya Janata Party, (BJP, center right) are the two main national parties. The BJP is headed by Narendra Modi, who has presided over rapid economic growth for more than 12 years as the chief minister of the state of Gujarat. He has been wooing voters by pointing his track record as a leader who attracts investment, which is critical for India. The Congress party, which has ruled for a decade has yet to name its prime ministerial candidate, and struggles in opinion polls due to public anger over a string of corruption scandals and the sharp slowdown of economic growth. Rahul Gandhi, frontman for the Congress party has been campaigning on a primarily socialist agenda such as providing cheap food and guaranteed employment in rural areas.
While Gandhi has pledged to rout the opposition BJP with “love”, equity markets seem confident that Modi will win. The BSE Sensex has rallied sharply over the past month from 20,193 on February 13 to 22,386 on March 31, a rise of almost 11%. Having fallen to a low of 17905 in August last year, the index is up by over 25% since then.
An influx of foreign investment has buoyed the market too, with global fund managers pouring $937million into Indian equities in March - roughly three times the level of inflows in the previous two months. Some of the mood swing is also due to an improvement in the external environment with better growth prospects of the US and European economies.
If history is a guide to the future then we’re set to see equities rally even more during the election period. The Sensex has risen during the election period in each of the past three elections and in five out of the previous six elections. Our analysis also shows that GDP growth tends to increase in the year after an election, not least due to post election increases in government spending.
Already our sister business survey suggests that companies have turned the corner, so there are some reasons to be optimistic on the economy. Consumers also appear to be optimistic that a new government will turn the economy around.
Equity markets, though, already appear to be pricing in a significant BJP victory and while Modi seems to be the frontrunner now, elections can produce surprises and there are still six weeks until the polls close.
Philip UglowShaily MittalMNI Indicators

MNI China Consumer Report - July 20136
The MNI India Consumer Indicator declined slightly in March led by a decline in optimism about Personal Finances. In spite of the latest fall, consumer sentiment was over 5% above the same level a year ago.
Executive Summary

MNI India Consumer Report - March 2014 7
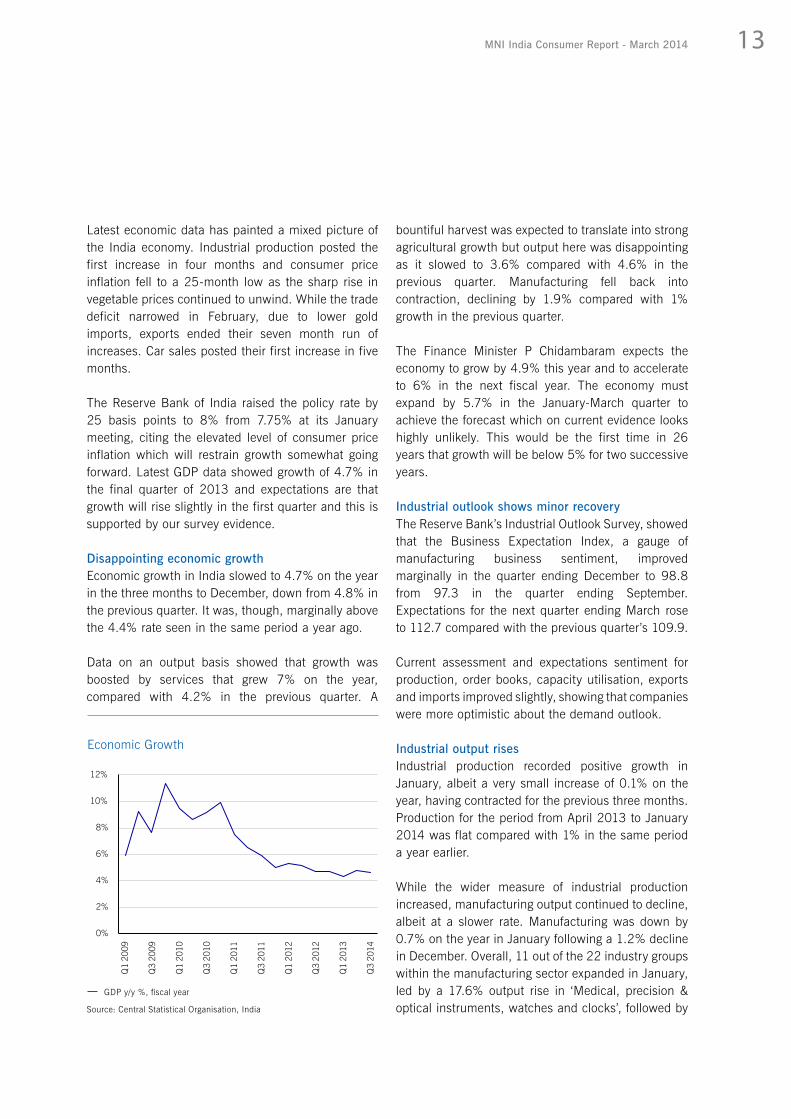
The MNI India Consumer Indicator declined slightly in March driven by a fall in both current and future expectations, following a rise to a 14-month high in February.
The Consumer Indicator fell 1.6% on the month to 125.8 in March from 127.8 in February. In spite of this decline, consumer sentiment was over 5% above the same period a year ago.
Consumer sentiment fell sharply in the summer of 2013 as the Indian economy weakened, inflation rose sharply and the turmoil in emerging markets saw the currency come under intense pressure. Confidence has subsequently improved and stood at 125.0 in the quarter ending March, up from 122.2 in the previous quarter and from 118.0 in the quarter ending September 2013.
The less timely quarterly consumer survey from the Reserve Bank of India showed that consumer’s current sentiment improved marginally in December compared with September, in line with our own survey.
The decline in consumer confidence was led by South and East India while consumers in the North, West and Central regions were more optimistic compared with the previous month.
Consumer sentiment only improved in the oldest age range in March, increasing by 5.7% on the month to hit a series high. In contrast, consumer sentiment declined in the two other age groups, though was still above the levels seen in the same period a year earlier.
Current Personal Finances declined to the lowest level since October 2013 and consumers were also less optimistic about their future personal finances.
Perceptions about the current state of business declined significantly in March while there was higher optimism regarding longer term business conditions.
The Durable Buying Conditions Indicator remained broadly stable at 111.6 in March compared with 111.4 in February, following a sharp decline at the start of the year to 106.0.
Consumers’ satisfaction with the current level of prices declined sharply in March, while expectations for inflation in a year’s time remained broadly stable.
The Stock Investment Indicator, which gauges whether it is a good time to invest in the stock market, declined significantly to 89.7 in March from 105.1 in the previous month, as the continued rise in the stock market put respondents off investing in equities.
The Real Estate Investment Indicator declined in March having risen to a record high level in the previous month.
The Car Purchase Indicator increased to the highest level in 10 months in March, as car purchase expectations improved and expectations for the price of gasoline remained broadly stable.
MNI India Consumer Indicator - Components
Pers
onal
Fin
ance
: Cu
rren
t
Pers
onal
Fin
ance
s:
Expe
cted
Dur
able
Buy
ing
Cond
ition
s
Bus
ines
s Co
nditi
ons
in 1
Ye
ar
Bus
ines
s Co
nditi
ons
in 5
Ye
ars
0
100

MNI India Consumer Report - March 20148
All India - Overview
Jan-14 Feb-14 Mar-14Highest
Since Lowest
Since 3-Month Average
Monthly Change
Monthly % Change
MNI India Consumer Indicator 121.2 127.8 125.8 - Jan-14 124.9 -2.0 -1.6%
Current Indicator 113.2 118.4 115.5 - Jan-14 115.7 -2.9 -2.4%
Expectations Indicator 126.6 134.2 132.8 - Jan-14 131.2 -1.4 -1.0%
Personal Finance: Current 120.5 125.3 119.4 - Oct-13 121.7 -5.9 -4.7%
Personal Finance: Expected 127.8 137.4 133.1 - Jan-14 132.8 -4.3 -3.2%
Business Condition: 1 Year 119.3 128.2 124.5 - Jan-14 124.0 -3.7 -2.9%
Business Condition: 5 Year 132.7 136.9 140.8 series high - 136.8 3.9 2.8%
Durable Buying Conditions 106.0 111.4 111.6 Dec-13 - 109.7 0.2 0.2%
Current Business Conditions Indicator 108.9 116.0 102.9 - series low 109.3 -13.1 -11.3%
Stock Investment Indicator 102.3 105.1 89.7 - series low 99.0 -15.4 -14.7%
Real Estate Investment Indicator 114.2 119.1 117.8 - Jan-14 117.0 -1.3 -1.2%
Car Purchase Indicator 69.2 73.0 75.3 May-13 - 72.5 2.3 3.1%
Employment Outlook Indicator 112.0 121.8 115.7 - Jan-14 116.5 -6.1 -5.0%
Inflation Expectations Indicator 153.6 154.8 154.2 - Jan-14 154.2 -0.6 -0.4%
Current Prices Satisfaction Indicator 75.7 75.4 67.2 - series low 72.8 -8.2 -10.9%
Interest Rates Expectations Indicator 136.3 134.6 133.0 - Jul-13 134.6 -1.6 -1.2%

MNI India Consumer Report - March 2014 9
All India - Summary2013 2014
Mar Apr May Jun Jul Aug Sep Oct Nov Dec Jan Feb Mar
MNI India Consumer Indicator 119.7 123.9 124.5 122.9 119.5 118.7 115.9 120.2 122.5 123.9 121.2 127.8 125.8
Current Indicator 116.8 119.5 120.7 113.7 114.1 113.9 109.3 113.9 117.0 119.0 113.2 118.4 115.5
Expectations Indicator 121.6 126.8 127.0 129.0 123.0 122.0 120.3 124.3 126.2 127.2 126.6 134.2 132.8
Personal Finance: Current 116.6 121.1 122.2 115.8 114.2 116.3 118.0 117.1 123.3 122.5 120.5 125.3 119.4
Personal Finance: Expected 124.0 131.8 131.0 128.3 121.9 122.1 118.4 122.4 125.3 131.0 127.8 137.4 133.1
Business Condition: 1 Year 114.9 117.2 119.4 124.2 121.2 115.3 114.1 119.3 118.2 117.4 119.3 128.2 124.5
Business Condition: 5 Year 126.0 131.6 130.5 134.6 126.0 128.5 128.4 131.3 135.2 133.1 132.7 136.9 140.8
Durable Buying Conditions 117.1 117.9 119.2 111.6 114.0 111.5 100.7 110.7 110.7 115.5 106.0 111.4 111.6
Current Business Conditions Indicator 116.4 120.0 121.0 118.4 113.1 111.4 108.9 108.2 109.1 114.5 108.9 116.0 102.9
Stock Investment Indicator 104.5 102.3 101.4 110.1 105.1 104.5 106.4 96.8 96.8 102.3 102.3 105.1 89.7
Investment Return 110.1 105.1 104.0 102.7 112.7 110.9 125.2 94.0 93.5 100.5 103.0 104.5 82.7
Stock Price Sentiment 104.2 103.7 103.5 100.4 111.9 116.5 124.8 107.5 115.8 105.8 107.4 103.7 128.6
Stock Market Expec-tations 107.5 105.5 103.8 127.8 114.6 119.2 118.8 103.8 112.6 112.1 111.1 114.3 114.9
Real Estate Invest-ment Indicator 119.4 119.9 113.1 115.7 115.1 109.8 109.7 110.4 113.2 114.4 114.2 119.1 117.8
House Price Expec-tations 142.4 139.1 133.3 136.3 135.1 140.8 144.7 148.6 147.9 143.8 143.1 152.6 148.6
House Buying Sen-timent 118.1 121.5 115.5 119.7 114.7 100.6 98.1 95.0 92.8 104.8 94.9 107.7 102.8
House selling Senti-ment 102.2 101.1 109.4 109.0 104.4 111.9 113.6 112.5 101.2 105.4 95.5 102.9 98.2
Car Purchase Indi-cator 76.6 76.4 75.8 69.5 68.5 61.6 60.1 67.1 65.7 73.8 69.2 73.0 75.3
Car Purchase Expec-tations 107.3 109.2 106.0 98.5 105.7 94.3 90.3 98.4 97.7 103.0 99.0 103.2 108.9
Price of Gasoline Expectations 154.0 156.4 154.5 159.5 168.7 171.0 170.2 164.1 166.3 155.4 160.6 157.2 158.3
Employment Outlook Indicator 119.1 123.4 127.9 122.6 120.9 119.2 113.2 114.6 121.0 117.6 112.0 121.8 115.7
Inflation Expectations Indicator 145.6 134.0 136.5 143.9 144.4 152.9 156.1 152.4 159.2 152.6 153.6 154.8 154.2
Current Prices Satisfac-tion Indicator 78.2 96.5 99.7 96.4 93.9 92.6 83.2 90.2 70.2 86.2 75.7 75.4 67.2
Interest Rates Expecta-tions Indicator 116.6 123.0 125.6 120.4 129.6 133.8 136.1 137.5 138.8 140.4 136.3 134.6 133.0

All India - Records2012-Current
Minimum Maximum Mean Median
MNI India Consumer Indicator 115.9 133.7 123.5 122.9
Current Indicator 109.3 128.3 117.4 116.8
Expectations Indicator 120.3 137.3 127.6 127.0
Personal Finance: Current 114.2 135.4 122.1 121.1
Personal Finance: Expected 118.4 141.5 129.3 131.0
Business Condition: 1 Year 114.1 131.8 121.5 119.4
Business Condition: 5 Year 123.9 140.8 132.0 132.0
Durable Buying Conditions 100.7 121.1 112.7 111.6
Current Business Conditions Indicator 102.9 124.9 115.3 116.0
Stock Investment Indicator 89.7 110.1 102.1 102.6
Investment Return 82.7 136.5 107.8 105.1
Stock Price Sentiment 100.4 128.6 109.7 106.6
Stock Market Expectations 103.8 134.4 113.7 112.6
Real Estate Investment Indicator 109.7 119.9 114.9 114.8
House Price Expectations 133.3 152.6 142.5 142.7
House Buying Sentiment 92.8 121.5 107.3 106.1
House Selling Sentiment 95.5 113.6 106.3 105.4
Car Purchase Indicator 60.1 84.0 72.4 73.0
Car Purchase Expectations 90.3 114.8 103.6 105.7
Price of Gasoline Expectations 142.5 171.0 158.7 158.3
Employment Outlook Indicator 112.0 128.3 119.4 119.2
Inflation Expectations Indicator 126.8 159.2 147.3 152.4
Current Prices Satisfaction Indicator 67.2 115.9 87.8 90.2
Interest Rates Expectations Indicator 116.6 140.4 130.5 131.4
MNI India Consumer Report - March 201410

w
Economic growth slowed to 4.7% on the year in the three months to December.
This was below growth of 4.8% in the previous quarter, but up from 4.4% in the same period a year ago.
Spitzzeile Titel12
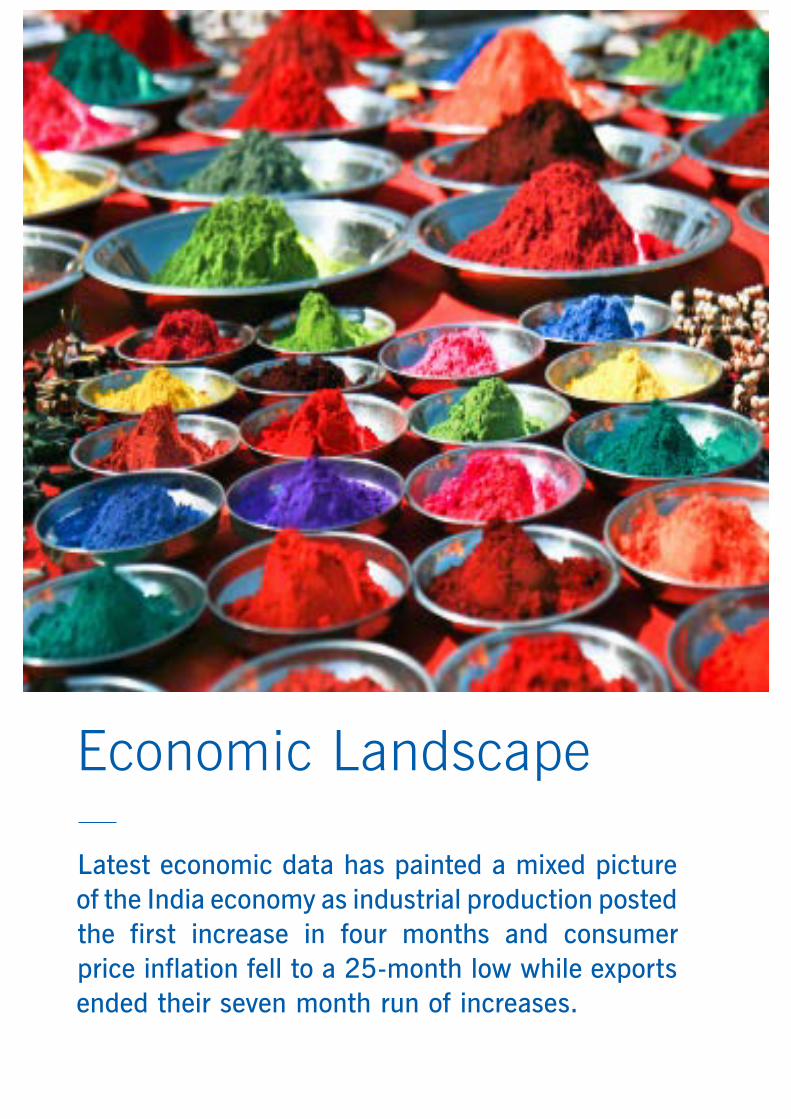
Latest economic data has painted a mixed picture of the India economy as industrial production posted the first increase in four months and consumer price inflation fell to a 25-month low while exports ended their seven month run of increases.
Economic Landscape
MNI India Consumer Report - March 2014 13
Latest economic data has painted a mixed picture of the India economy. Industrial production posted the first increase in four months and consumer price inflation fell to a 25-month low as the sharp rise in vegetable prices continued to unwind. While the trade deficit narrowed in February, due to lower gold imports, exports ended their seven month run of increases. Car sales posted their first increase in five months.
The Reserve Bank of India raised the policy rate by 25 basis points to 8% from 7.75% at its January meeting, citing the elevated level of consumer price inflation which will restrain growth somewhat going forward. Latest GDP data showed growth of 4.7% in the final quarter of 2013 and expectations are that growth will rise slightly in the first quarter and this is supported by our survey evidence.
Disappointing economic growth Economic growth in India slowed to 4.7% on the year in the three months to December, down from 4.8% in the previous quarter. It was, though, marginally above the 4.4% rate seen in the same period a year ago.
Data on an output basis showed that growth was boosted by services that grew 7% on the year, compared with 4.2% in the previous quarter. A
bountiful harvest was expected to translate into strong agricultural growth but output here was disappointing as it slowed to 3.6% compared with 4.6% in the previous quarter. Manufacturing fell back into contraction, declining by 1.9% compared with 1% growth in the previous quarter.
The Finance Minister P Chidambaram expects the economy to grow by 4.9% this year and to accelerate to 6% in the next fiscal year. The economy must expand by 5.7% in the January-March quarter to achieve the forecast which on current evidence looks highly unlikely. This would be the first time in 26 years that growth will be below 5% for two successive years.
Industrial outlook shows minor recovery
Economic Growth
0%
2%
4%
6%
8%
10%
12%
Q1
2009
Q3
2009
Q1
2010
Q3
2010
Q1
2011
Q3
2011
Q1
2012
Q3
2012
Q1
2013
Q3
2014
GDP y/y %, fiscal year
Source: Central Statistical Organisation, India
The Reserve Bank’s Industrial Outlook Survey, showed that the Business Expectation Index, a gauge of manufacturing business sentiment, improved marginally in the quarter ending December to 98.8 from 97.3 in the quarter ending September. Expectations for the next quarter ending March rose to 112.7 compared with the previous quarter’s 109.9.
Current assessment and expectations sentiment for production, order books, capacity utilisation, exports and imports improved slightly, showing that companies were more optimistic about the demand outlook.
Industrial output risesIndustrial production recorded positive growth in January, albeit a very small increase of 0.1% on the year, having contracted for the previous three months. Production for the period from April 2013 to January 2014 was flat compared with 1% in the same period a year earlier.
While the wider measure of industrial production increased, manufacturing output continued to decline, albeit at a slower rate. Manufacturing was down by 0.7% on the year in January following a 1.2% decline in December. Overall, 11 out of the 22 industry groups within the manufacturing sector expanded in January, led by a 17.6% output rise in ‘Medical, precision & optical instruments, watches and clocks’, followed by

MNI India Consumer Report - March 201414
which fell 9.9%.
Although wholesale price inflation fell below the RBI‘s comfort zone of 5%, consumer price inflation remains above 8%.
Repo rate increased to 8%The RBI raised the policy rate by 25 basis points to 8% from 7.75% at its January meeting, citing the elevated level of consumer price inflation.
RBI Governor Raghuram Rajan made clear that inflation needed to be brought down to a low and stable level, so that monetary policy could eventually help to revive consumption and investment in a sustainable way. The RBI, however, said that if retail inflation eases as projected, it does not foresee a need for further monetary policy tightening in the near-term.
15.2% in ‘Electrical machinery & apparatus’ and 14.4% in ‘Wearing apparel; dressing and dyeing of fur’.
After increasing 0.4% on the year in December, mining output growth rose 0.7% in January. Output of consumer durables, a measure of consumer demand, posted the fourteenth consecutive decline, falling 8.3% in January compared with 16.1% decline in December. Capital goods output, a proxy for investments in the economy, fell 4.2% in January compared with a decline of 2.5% in December.
Inflation slows as vegetable prices declineConsumer price inflation eased to a 25-month low of 8.1% in January from 8.8% in the previous month. Food price inflation, which makes up almost half of the basket, eased to 8.6% from 9.9% in January. The moderation was driven by cooling vegetable prices which rose by 14% compared with a year earlier, down from 21.9% in January. Core CPI eased slightly to 8% compared with 8.1% in the previous month and has averaged 8% over three months.
Wholesale price inflation decelerated to a nine month low of 4.7% in February, down from 5% in January. The slowdown was largely driven by vegetable prices
A central bank panel proposed to revamp its policymaking structure by setting a long-term consumer price inflation target of 4%, plus or minus 2%. As inflation remains high, it recommended that the goal should be phased in gradually. It appears that the RBI has already shifted its focus to CPI which it
Industrial Production
-10%
-5%
0%
5%
10%
15%
20%
25%
50
100
150
200
250
2007
2008
2009
2010
2011
2012
2013
Industrial Production y/y % (RHS)
Industrial Production
Source: Central Statistical Organisation, India
0%
2%
4%
6%
8%
10%
12%
Apr-
12
Jun-
12
Aug-
12
Oct
-12
Dec
-12
Feb-
13
Apr-
13
Jun-
13
Aug-
13
Oct
-13
Dec
-13
Wholesale and Consumer Price Inflation
Wholesale Price Inflation*
Consumer Price Inflation**
Source: *Office of the Economic Advisor, India, **MOSPI

MNI India Consumer Report - March 2014 15
aims to reduce to 8% by January 2015 and 6% by January 2016.
Fiscal budget deficitThe government budget deficit stood at Rs.5.3 trillion in the April-January period, or 101.6% of the target for the year ending March 2014, compared with 89.4% at the same point a year ago. Net tax receipts totalled Rs. 5.76 trillion in the first ten months to March 2014, while total expenditure was Rs. 12.7 trillion.
The Finance Minister P Chidambaram will likely tighten spending in what is left of the year to try and bridge the gap in the public finances.
The government has proposed to bring down the fiscal deficit to 4.8% of GDP in 2013-14. The government plans to defer some subsidy payments to next year, while focusing on speeding up the sale of stakes in state-run firms and minority stakes in some private companies. The government raised over Rs. 610 billion from selling licences for mobile internet spectrum in February.
The fiscal deficit for 2014-15 is projected at 4.1% of GDP and 3% of GDP in 2016-17.
Foreign reserves rise Foreign exchange reserves rose to $298.6 billion in the week ending March 21, from $297.3 billion a week earlier. This is the fourth consecutive week of increase in the country‘s forex reserves as overseas investors poured in money in local bonds and stock markets. According to the RBI’s weekly statistical supplement, foreign currency assets, the biggest component of the forex reserves, rose by $1.58 billion to $271.4 billion. These are expressed in dollar terms and include the effect of appreciation or depreciation of the non-US currencies such as the euro, pound and yen, held in its reserves.
Moves by the RBI over the months have greatly strengthened India’s foreign exchange reserve position, leaving it less vulnerable to another run on the currency. The value of India’s gold reserves
remained steady at $20.9 billion.
Trade deficit shrinks in FebruaryIndia’s trade deficit narrowed to $8.1 billion in February, down from a $9.9 billion deficit in January, and more than 40% below the deficit of $14.1 billion seen in the same period last year. Lower imports of gold led the improvement between January and February.
While the trade gap narrowed, exports contracted for the first time in eight months as they fell to $25.7 billion, 3.7% below the level seen last year and 4% below January’s $26.8 billion. Imports fell 17.1% on the year to $33.8 billion in February and 7.8% below January’s $36.7 billion. Oil imports climbed from January’s $13.2 billion to $13.7 in Februray, although were lower than $13.8 billion seen in December and 3.1% below the level in February 2013. Gold imports fell to $1.6 billion from $1.7 billion in January.
The current account deficit narrowed to $4.2 billion, or 0.9% of GDP in the October to December quarter, from $31.9 billion a year earlier. The government expects to keep the current account deficit at $45 billion in the fiscal year that ends in March.
Car sales increasePassenger car sales increased for the first time in five months in February, to 160,718 units, 1.4% above the previous year. For the first 11 months of this fiscal year, though, sales declined 4.6% to 1.61 million cars. Most consumers in India have chosen to defer purchases of vehicles given the slowdown in the economy, higher loan rates and rising fuel prices.
The rise in car sales in Februray was attributed to price discounting from car manufacturers, following the excise duty reduction on small cars, two wheelers and commercial vehicles to 8% from 12%, announced in the interim budget.
There have been reports that various new car models have also generated a lot of interest and are expected to boost sales.

MNI China Consumer Report - July 201316
The MNI India Consumer Indicator declined slightly in March driven by a fall in both current and future expectations, following a rise to a 14-month high in the previous month.
Indicators
MNI India Consumer Report - March 2014 17
The MNI India Consumer Indicator declined slightly in March driven by a fall in both current and future expectations, following a rise to a 14-month high in February.
The Consumer Indicator fell 1.6% on the month to 125.8 in March from 127.8 in February. In spite of this decline, consumer sentiment was over 5% above the same period a year ago.
Consumer sentiment fell sharply in the summer of 2013 as the Indian economy weakened, inflation rose sharply and the turmoil in emerging markets saw the currency come under intense pressure. Confidence has subsequently improved and stood at 125.0 in the quarter ending March, up from 122.2 in the previous quarter and from 118.0 in the quarter ending September 2013.
The Current Indicator decreased by 2.4% to 115.5 in March from 118.4 in February and the Expectations Indicator decreased by 1% to 132.8 in March from 134.2 in February.
In March, three out of the five components which make up the Consumer Indicator declined. Personal Finances, both current and future, fell after rising in the previous month. Business Conditions in One Year dropped for the first time in three months. Consumers were more optimistic about Business Conditions in Five Years, on the belief that the new government would be able to turn the economy around. Consumers’ optimism regarding purchasing a large household
125.8MNI India Consumer Indicator Declines in March
MNI India Consumer Indicator
Mar-13 Oct-13 Nov-13 Dec-13 Jan-14 Feb-14 Mar-14
MNI India Consumer Indicator 119.7 120.2 122.5 123.9 121.2 127.8 125.8
Current 116.8 113.9 117.0 119.0 113.2 118.4 115.5
Expectations 121.6 124.3 126.2 127.2 126.6 134.2 132.8
100
110
120
130
140
Nov-12 Feb-13 May-13 Aug-13 Nov-13 Feb-14
MNI India Consumer Indicator
100
105
110
115
120
125
130
135
140
Nov-12 Feb-13 May-13 Aug-13 Nov-13 Feb-14
Consumer Indicators
Current
Expectations

MNI India Consumer Report - March 201418
125.8
115.5
132.8
Total Indicator Current Indicator Expectations Indicator
All India
123.4120.0
125.7
Total Indicator Current Indicator Expectations Indicator
South India
125.1
112.8
133.3
Total Indicator Current Indicator Expectations Indicator
North India
124.6
112.7
132.5
Total Indicator Current Indicator Expectations Indicator
East India
127.6
115.2
135.9
Total Indicator Current Indicator Expectations Indicator
West India
131.9
116.5
142.1
Total Indicator Current Indicator Expectations Indicator
Central India

MNI India Consumer Report - March 2014 19
item remained broadly stable in March.
The less timely quarterly consumer survey from the Reserve Bank of India showed that consumers’ current sentiment improved marginally in December compared with September, in line with our own survey.
RegionsThe decline in the Consumer Indicator was led by South and East India while consumers in the North, West and Central regions were more optimistic compared with the previous month.
In South India, sentiment declined significantly to 123.4 after hitting a series high in the previous month of 135.1. In East India, confidence fell to a record low in September 2013 and since then has trended upwards. In March, the Consumer Indicator fell to 124.6 from 129.4 in the previous month and was broadly unchanged from the level seen in March a year earlier.
Consumers remained more optimistic about future rather than current conditions. The Current Indicator declined in all regions apart from West and Central India.
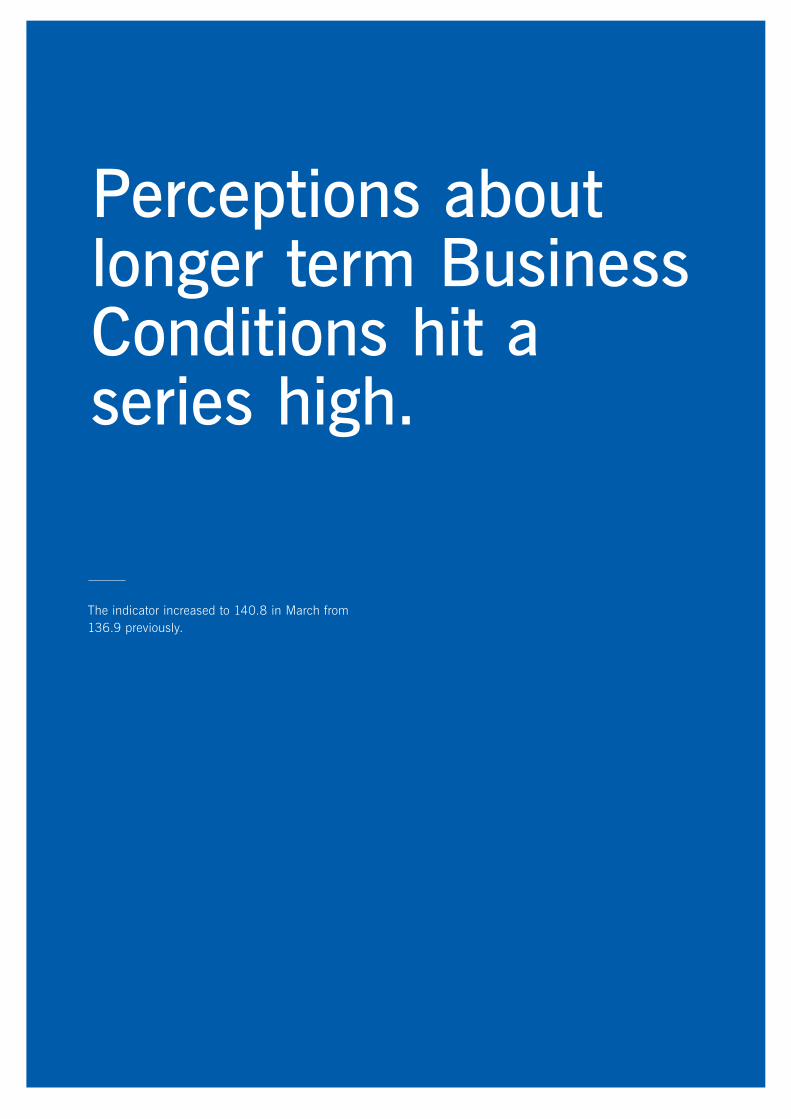
AgeConsumer sentiment only improved in the oldest age range in March, increasing by 5.7% on the month to hit a series high. In contrast, consumer sentiment declined in the two other age groups, though was still above the levels seen in the same period a year earlier.
The Consumer Indicator for the 18-34 age range declined by 2.3% to 124.5 in March from 127.5 in February. All five components of the Consumer Indicator fell apart from Business Conditions in Five Years which rose to a series high on the month. The
-0.9
-0.7
-0.6
0.6
0.0
Personal Finance: Current
Personal Finance: Expected
Business Condition: 1 Year
Business Condition: 5 Year
Durable Buying Conditions
Consumer Indicator: Contribution to Monthly Change (% pt.)
MNI India Consumer Report - March 201420
other two components of the Expectations Indicator, Expected Personal Finances and Business Conditions in One Year declined by 6.9% and 3.5% respectively. Durable Buying Conditions declined for the third consecutive month and there was a dip in Current Personal Finances. After a sharp rise in consumer sentiment among 35-54 age olds to 130.2 in February, confidence fell to 126.6 in March. The decline in sentiment was led by all five components, with Current Personal Finances falling the most. Consumers were least optimistic about buying a large household item, although it fell only slightly from the previous month.
For the oldest age range, 55-64 year olds, sentiment increased for the second month in a row to 127.3 from 120.5 in February. Apart from Current Personal Finances, all the other components increased. There were significant increases in consumers’ expectations about Business Conditions in Five Years and Durable Buying Conditions.
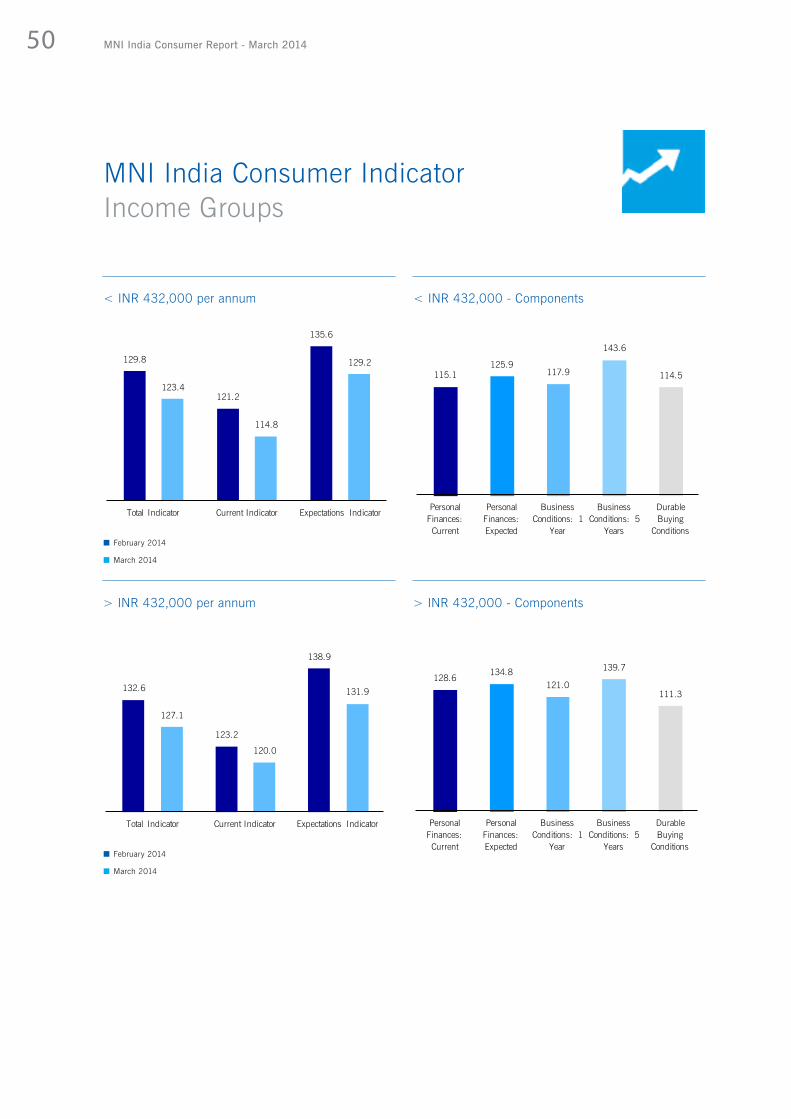
IncomeConsumer confidence declined in both low and high income households.
The Consumer Indicator for households with an average annual income of over INR 432,000 declined 4.2% on the month to 127.1 in March from 132.6 in February. For households with an average annual income under INR 432,000, the indicator fell by 5% on the month to 123.4 from 129.8 in February.
Since March 2013, confidence has increased 5.6% among lower income households, while for higher income households it has risen by less than 1%. On average, though, the level of confidence remains greater for higher income households.
125.8
124.5
126.6
127.3
Total Indicator 18-34 35-54 55-64
Consumer Indicator: Age Groups

MNI India Consumer Report - March 2014 21
123.4
114.8
129.2
Total Indicator Current Indicator Expectations Indicator
< INR 432,000 per annum
127.1
120.0
131.9
Total Indicator Current Indicator Expectations Indicator
> INR 432,000 per annum
MNI India Consumer IndicatorIncome Groups

MNI India Consumer Report - March 201422
MNI India Consumer IndicatorMain Cities
The Consumer Indicator declined in seven out of the ten major Indian cities in March apart from Pune, Su-rat and Visakhapatnam. Successive improvements in consumer sentiment made Pune the most optimistic city in March while Hyderabad was the least.
In the capital Delhi, consumer sentiment was broadly stable at 121.1 compared with 121.4 in the previous month. Of the five components, both Current and Ex-pected Personal Finances and Durable Buying Condi-tions improved while expectations about Business Conditions in One and Five Years deteriorated.
In Mumbai, India‘s most populous city, consumer sentiment remained broadly stable at 124.5 in March as compared with 124.8 in the previous month. Re-spondents were more optimistic about buying large household items and Business Conditions in Five Ye-ars, while they were less optimistic about Business Condition in One Year and Personal Finances.
In contrast to Delhi and Mumbai, confidence in Ban-galore, the third largest city by population in India, declined sharply following a large increase in the pre-vious month. The Consumer Indicator fell to 121.2 from 152.0 in February, led by significant losses in all five components.
Consumer sentiment in Bangalore has been volatile over the past four months and the decline in March was led by almost equal falls in the Current and Ex-pectations Indicators. The Current Conditions Indica-tor declined to 114.0 from 146.0 in February, while the Expectations Indicator declined to 126.0 from 156.0.
In Pune, consumer sentiment rose for the second month in a row to the highest since May 2013. The Consumer Indicator increased from 129.4 in February to 133.4 in March and was 5.4% above the same period a year earlier.
100
105
110
115
120
125
130
135
140
Nov-12 Feb-13 May-13 Aug-13 Nov-13 Feb-14
Consumer Indicator - Mumbai
108.8
135.0
113.8
131.9 126.9
146.3
103.8
Current Indicator
Expectations Indicator
Personal Finances: Current
Personal Finances: Expected
Business Conditions: 1
Year
Business Conditions: 5
Year
Durable Buying
Conditions
Consumer Indicator Components - Mumbai

MNI India Consumer Report - March 2014 23
100
105
110
115
120
125
130
Dec-12 Mar-13 Jun-13 Sep-13 Dec-13 Mar-14
Consumer Indicator - Delhi
80
90
100
110
120
130
140
150
160
Nov-12 Feb-13 May-13 Aug-13 Nov-13 Feb-14
Consumer Indicator - Bangalore
111.1
127.8
112.0
136.1
121.3 125.9
110.2
Current Indicator
Expectations Indicator
Personal Finances: Current
Personal Finances: Expected
Business Conditions: 1
Year
Business Conditions: 5
Year
Durable Buying
Conditions
Consumer Indicator Components - Delhi
114.0126.0 122.0 118.0 123.0
137.0
106.0
Current Indicator
Expectations Indicator
Personal Finances: Current
Personal Finances: Expected
Business Conditions: 1
Year
Business Conditions: 5
Year
Durable Buying
Conditions
Consumer Indicator Components - Bangalore

MNI India Consumer Report - March 201424
Current Personal Finances declined to the lowest level since October 2013 and consumers were also less optimistic about their future personal finances. Current Personal Finances, which measures whether the financial situation of a household is better, the same or worse than a year ago, declined by 4.7% to 119.4 in March, offsetting the previous month’s gain to 125.3. Current Personal Finances hit a low in the summer of 2013, but have subsequently bounced back and were up from 119.7 in March last year.
The percentage of respondents who reported that their current financial situation improved compared with a year ago fell to 43.5% in March from 51.2% in February. Those reporting financial conditions were the same as last year increased to 45.4% from 41.4%, while those reporting a worsening increased from 7.4% to 11.2%.
Out of those who responded that their financial conditions improved, a growing proportion cited better family expenses as the reason for this.
Expected Personal Finances, which measures whether households think their finances will be better in a year’s time, declined to 133.1 from 137.4 in February. The percentage of respondents reporting that they expected their financial situation to improve in a year’s time fell from 65% to 60%. The percentage of respondents reporting that they expected their financial situation to worsen in a year’s time increased to 5.3% from 3.3% in February.
119.4Personal Finances Both Current and Expected Finances Sink
Personal Finances
Mar-13 Oct-13 Nov-13 Dec-13 Jan-14 Feb-14 Mar-14
Current 116.6 117.1 123.3 122.5 120.5 125.3 119.4
Expectations 124.0 122.4 125.3 131.0 127.8 137.4 133.1
100
110
120
130
140
150
Nov-12 Feb-13 May-13 Aug-13 Nov-13 Feb-14
Personal Finances
Current
Expectations
7.6%
35.9%
45.4%
9.9%
1.2%
Current Financial Situation Compared with 1 Year Ago (% of Households)
Much Better
A Little Better
Same
A Little Worse
Much Worse

MNI India Consumer Report - March 2014 25
0.9%
4.8%
17.6%
76.7%
Monthly Household Income Used for Daily Expenses (% of Households)
28.7%
46.7%
18.9%
5.7%
Monthly Household Income Used for Savings (% of Households)
84.5%
9.5%
3.4%
0.4%
Monthly Household Income Used for Large Loan Repayment (% of Households)
90.1%
8.3%
0.9%
Monthly Household Income Used for Investments(% of Households)
How Households Spend their Money
0% - 29% of Income
30% - 49% of Income
0% of Income
1% - 29% of Income
0% of Income
1% - 29% of Income
0% of Income
1% - 29% of Income
50% - 69% of Income
70% - 100% of Income
30% - 49% of Income
50% - 100% of Income
30% - 49% of Income
50% - 100% of Income
30% -49% of Income
50% - 100% of Income
w
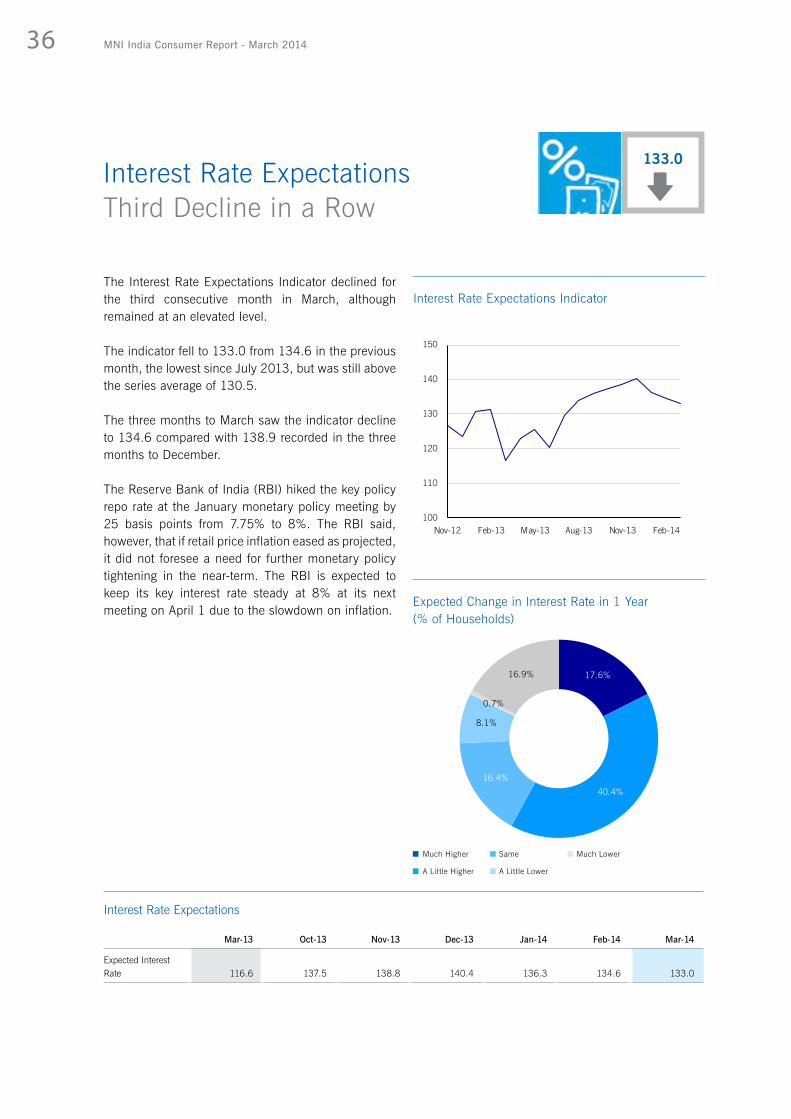
Perceptions about longer term Business Conditions hit a series high.
The indicator increased to 140.8 in March from 136.9 previously.

MNI India Consumer Report - March 2014 27
Perceptions about the current state of business declined significantly in March while there was higher optimism regarding longer term business conditions.
The Current Business Conditions Indicator, which measures respondents’ views on the state of business compared with a year earlier, decreased to a series low of 102.9, 11.3% below the level of 116.0 in February.
The proportion of respondents who were positive about business conditions fell from 44.1% in February to 31.1% in March while the proportion of those who found them “just fair” increased to 39.7% from 36.8% previously. Respondents who said business conditions were “poor” or “very poor” increased significantly to 24.4% from 14.5% previously.
Expectations for Business Conditions in a Year fell after rising for two consecutive months. The indicator declined to 124.5 from 128.2 in February, as the percentage of respondents who reported that business conditions would be better in a year’s time fell from almost 56% to 50.7%.
The majority of respondents who expected business conditions to be better in a year cited economic development as the main reason, although fewer than in the previous month. Many panellists expected business conditions to improve after the national election, in the hope that a new government will push forward with business friendly policies.
102.9Business ConditionsLonger Term Business Expectations Hit Record High
Business Conditions
Mar-13 Oct-13 Nov-13 Dec-13 Jan-14 Feb-14 Mar-14
Current 116.4 108.2 109.1 114.5 108.9 116.0 102.9
In 1 Year 114.9 119.3 118.2 117.4 119.3 128.2 124.5
In 5 Years 126.0 131.3 135.2 133.1 132.7 136.9 140.8
80
90
100
110
120
130
140
Nov-12 Feb-13 May-13 Aug-13 Nov-13 Feb-14
Current Business Conditions Indicator
90
100
110
120
130
140
150
Nov-12 Feb-13 May-13 Aug-13 Nov-13 Feb-14
Expected Business Conditions: 1 Year and 5 Years
1 Year
5 Years

MNI India Consumer Report - March 201428
Business Conditions in 1 YearSelected Reasons
Government/Policy
Econ. Development
Income/Employment
Resource/Environment
Social Stability/ Security
Events
Government/Policy
Econ. Development
Income/Employment
Resource/Environment
Social Stability/ Security
Events
32.3%
47.3%
8.9%7.3%
4.0%0.2%
All India, Reasons for Better
39.8%
29.8%
5.2%8.3%
16.5%
0.5%
All India, Reasons for Worse
70.2% 69.7%
29.8% 30.3%
Feb-14 Mar-14
All IndiaA growing proportion of respondents, who expected business conditions to worsen, cited social stability as the main reason.
Longer term, Expectations for Business Conditions in Five Years have been on an upward trend since July last year and rose to a series high in March. The indicator increased to 140.8 from 136.9 previously. Among the major cities surveyed, Ahmedabad was the most optimistic and witnessed the highest jump from the previous month, probably owing to expectations that Narendra Modi who is the Chief Minister of the state of Gujarat would gain a majority in the national election. Surat, another major city in Gujarat, had higher expectations about long term business conditions.
Better
Worse

MNI India Consumer Report - March 2014 29
Business Conditions in 1 YearRegions
124.5127.4
110.9
130.5128.7 128.0
All India NorthIndia
South India
East India
West India
CentralIndia
Business Expectations
North India South India East India West India Central India
Reasons for Better (% of Respondents)
66.4% 67.1% 71.8% 74.3%66.7%
33.6% 32.9% 28.2% 25.7%33.3%
North India South India East India West India Central India
Business Expectations: Better or Worse?(% of Respondents)
North India South India East India West India Central India
Reasons for Worse (% of Respondents)
Better
Worse
Government/Policy
Econ. Development
Income/Employment
Resource/Environment
Social Stability/ Security
Events
Government/Policy
Econ. Development
Income/Employment
Resource/Environment
Social Stability/ Security
Events

MNI India Consumer Report - March 201430
The Durable Buying Conditions Indicator remained broadly stable at 111.6 in March compared with 111.4 in February, following a sharp decline at the start of the year to 106.0.
The Indicator on Durable Buying Conditions measures whether respondents think it is a good time or bad time to buy a large household good. A rise in the indicator means more respondents said it was a good time to buy a large household good.
Sentiment on buying conditions fell throughout most of last year, signalling pressure on consumers’ disposable income, owing to the weakening of economy and high inflation. The lost ground has not been made up, with the result in March down 4.7% below the same period a year earlier.
Out of the ten largest cities surveyed, respondents from Kolkata were the most optimistic about buying a large household item in March. Compared with last month, consumers from Delhi and Surat, Visakhapatnam thought it was a better time to buy a large household item.
The Indicator increased in all regions apart from South and Central India. Respondents from East India were the most optimistic about buying durable goods as the Indicator rose to 116.4, the first rise in three months.
For all India, the proportion of respondents who said it was an “excellent time” or “good time” to buy large household goods remained broadly stable at 42.5% as compared with 42% in the previous month.
Durable Buying Conditions Remain Broadly Stable
Durable Buying Conditions
Mar-13 Oct-13 Nov-13 Dec-13 Jan-14 Feb-14 Mar-14
Durable Buying Conditions 117.1 110.7 110.7 115.5 106.0 111.4 111.6
111.6
95
100
105
110
115
120
125
Nov-12 Feb-13 May-13 Aug-13 Nov-13 Feb-14
Durable Buying Conditions
1.0%
41.5%
34.1%
17.0%
1.7%
4.8%
Is It a Good or Bad Time to Buy Large Household Goods? (% of Households)
Excellent Time
Good Time
Neutral
Bad Time
Very Bad Time
Don‘t Know/No Answer

MNI India Consumer Report - March 2014 31
The Employment Outlook Indicator declined to 115.7 in March after rising significantly in the previous month, pushing it below the 119.1 outturn seen in March 2013.
The indicator measures opinion on the outlook for the employment market over the next 12 months and the March reading was below the average of the series of 119.4.
Respondents from all regions apart from West India expected a considerable deterioration in the employment situation. In West India, respondents’ expectations remained broadly stable and were the highest since December 2013.
The proportion of respondents who expected an improvement in the Employment Outlook declined to 43.8% in March from almost 52% in February, while those forecasting a worsening increased to 14.4% from 12.3%. Those suggesting there would be no change increased significantly from 35.6% to 41.7%.
Employment Outlook IndicatorDeclines in March
Employment Outlook
Mar-13 Oct-13 Nov-13 Dec-13 Jan-14 Feb-14 Mar-14
Employment Outlook 119.1 114.6 121.0 117.6 112.0 121.8 115.7
100
105
110
115
120
125
130
Nov-12 Feb-13 May-13 Aug-13 Nov-13 Feb-14
Employment Outlook Indicator
3.5%
40.4%
41.7%
13.0%
1.4%
Employment Outlook for the Next 12 Months (% of Households)
115.7
Much Better
A Little Better
Same
A Little Worse
Much Worse
Don‘t Know/No Answer

w
Consumers’ satisfaction with the current level of prices declined sharply.
The increased dissatisfaction with prices came in spite of a decline in India’s official inflation that eased to a 25-month low of 8.1% in January.

MNI India Consumer Report - March 2014 33
Consumers’ satisfaction with the current level of prices declined sharply in March, while expectations for inflation in a year’s time remained broadly stable.
The Current Prices Satisfaction Indicator declined significantly to a series low of 67.2 in March compared with 75.4 in the previous month. A figure below 100 indicates wider dissatisfaction with the current level of prices. The further below 100, the greater the dissatisfaction. The indicator has trended down since the start of the survey in November 2012 and was above 100 in only the first two months of the survey.
The increased dissatisfaction with prices came in spite of a decline in India’s official inflation figures. Consumer price inflation eased to a 25-month low of 8.1% in January from 8.8% in the previous month. Food price inflation, which makes up almost half of the basket, eased to 8.6% from 9.9% in January. Wholesale price inflation also decelerated to a nine month low of 4.7% in February, down from 5% in January.
The Inflation Expectations Indicator, which measures whether respondents think prices will be higher or lower in 12 months’ time, remained broadly stable at 154.2 in March as compared with 154.8 in February. Consumers’ expectations for inflation have remained elevated since November 2012 when the series started. Some respondents said they are looking forward to the national election in May with an expectation that the new government will help bring down price pressures.
Prices SentimentDiscontent Hits a New Low
Prices Sentiment
Mar-13 Oct-13 Nov-13 Dec-13 Jan-14 Feb-14 Mar-14
Satisfaction with Current Prices 78.2 90.2 70.2 86.2 75.7 75.4 67.2
Inflation Expec-tations 145.6 152.4 159.2 152.6 153.6 154.8 154.2
60
70
80
90
100
110
120
Nov-12 Feb-13 May-13 Aug-13 Nov-13 Feb-14
Satisfaction with Current Prices Indicator
110
120
130
140
150
160
170
Nov-12 Feb-13 May-13 Aug-13 Nov-13 Feb-14
Inflation Expectations Indicator
67.2

MNI India Consumer Report - March 201434
1.9%
17.2%
15.8%
43.8%
21.4%
Satisfaction with Current Prices (% of Households)
Very Satisfied
Quite Satisfied
So So
Not Very Satisfied
Not Satisfied At All
Don‘t Know/No Answer
31.6%
52.3%
9.9%5.0%
1.1% 0.1%
Inflation Expectations in 12 Months (% of Households)
Much Higher
A Little Higher
Same
A Little Lower
Much Lower
Don‘t Know/No Answer
The percentage of respondents who believed prices would be higher in a year’s time remained flat at 83.9%, while those saying prices would be about the same fell to 9.9% from 12% in the previous month. A small but rising number of respondents believed prices would be lower in a year’s time and their proportion increased from 4.1% to 6.1%.
Asked about how much they thought prices would increase, a growing proportion of respondents thought that prices would rise by 5%, which was down from expectations of a price rise between 6% and 9% in February and over 25% in January.
Regions Satisfaction with Current Prices worsened significantly in North and South India, hitting a series low in the former. In North India, the proportion of respondents who were satisfied with the current level of prices fell from almost 25% to 17.8%. Respondents from Central India were the least dissatisfied with current prices in March following a sharp decline in February when the indicator hit a series low.
Apart from South and East India, respondents from the other three regions expected prices to rise in a year’s time. Consumers from the Central region had the highest inflation expectations on the month.
Prices SentimentRegions

MNI India Consumer Report - March 2014 35
67.260.8
64.0
72.3 70.676.3
All India NorthIndia
South India
East India
West India
CentralIndia
Current Prices Satisfaction Indicator
154.2
158.3
143.6145.1
160.6163.6
All India NorthIndia
South India
East India
West India
CentralIndia
Inflation Expectations Indicator
All India NorthIndia
South India
East India
West India
CentralIndia
Satisfaction with Current Prices(% of Households)
Very Satisfied
Quite Satisfied
Neutral
Not Very Satisfied
Not Satisfied At All
Don‘t Know/No Answer
NorthIndia
South India
East India
West India
CentralIndia
Inflation Expectations in 12 Months(% of Households)
Much Higher
A Little Higher
Same
A Little Lower
Much Lower
Don‘t Know/No Answer
MNI India Consumer Report - March 201436
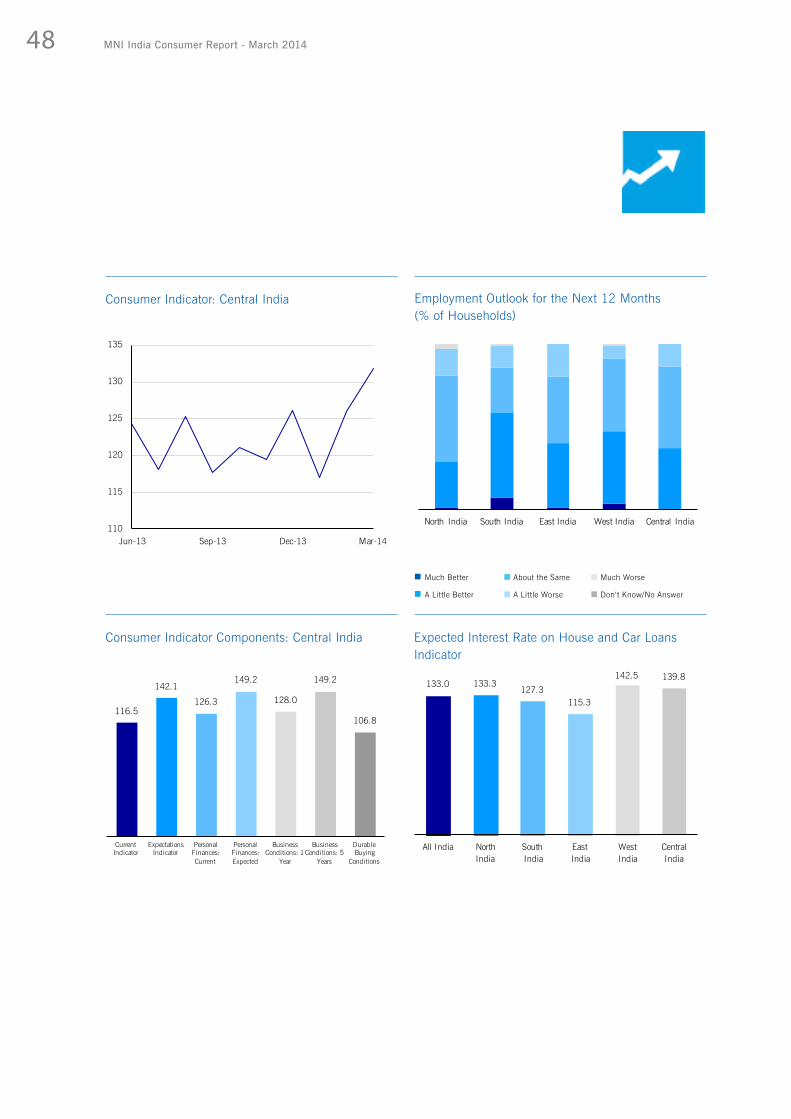
The Interest Rate Expectations Indicator declined for the third consecutive month in March, although remained at an elevated level.
The indicator fell to 133.0 from 134.6 in the previous month, the lowest since July 2013, but was still above the series average of 130.5.
The three months to March saw the indicator decline to 134.6 compared with 138.9 recorded in the three months to December.
The Reserve Bank of India (RBI) hiked the key policy repo rate at the January monetary policy meeting by 25 basis points from 7.75% to 8%. The RBI said, however, that if retail price inflation eased as projected, it did not foresee a need for further monetary policy tightening in the near-term. The RBI is expected to keep its key interest rate steady at 8% at its next meeting on April 1 due to the slowdown on inflation.
Interest Rate ExpectationsThird Decline in a Row
Interest Rate Expectations
Mar-13 Oct-13 Nov-13 Dec-13 Jan-14 Feb-14 Mar-14
Expected Interest Rate 116.6 137.5 138.8 140.4 136.3 134.6 133.0
133.0
100
110
120
130
140
150
Nov-12 Feb-13 May-13 Aug-13 Nov-13 Feb-14
Interest Rate Expectations Indicator
17.6%
40.4%16.4%
8.1%
0.7%
16.9%
Expected Change in Interest Rate in 1 Year (% of Households)
Much Higher
A Little Higher
Same
A Little Lower
Much Lower

MNI India Consumer Report - March 2014 37
The Stock Investment Indicator, which gauges whether it is a good time to invest in the stock market, declined significantly to 89.7 in March from 105.1 in February, as the continued rise in the stock market put respondents off investing in equities.
Indian equities have rallied in recent weeks, helped by a growing expectation that the upcoming general election will help to improve economic growth. Opinion polls have showed that pro-business candidate, Narendra Modi, is expected to form a government. Some improvement in recent macroeconomic data including a narrower current account deficit and easing inflationary pressures have also helped.
The benchmark Sensex breached the 22,000 mark on March 10 and closed at 22,386 on March 31. Analysts expect to see increased volatility in the benchmark index ahead of the general election.
Stock Price Sentiment, which measures whether respondents view equity prices as high or low, rose sharply to a record high in March to 128.6 compared with 103.7 in February. The component has a negative impact on the overall investment indicator.
The Stock Investment Return component declined significantly after rising for three consecutive months to 82.7 in March from 104.5 in the previous month.
Expectations for the stock market in three months’ time remained broadly stable at 114.9 in March compared with 114.3 in the previous month.
Stock Investment IndicatorSeries Low
Investment Sentiment
Mar-13 Oct-13 Nov-13 Dec-13 Jan-14 Feb-14 Mar-14
Investment Sentiment Indicator 104.5 96.8 96.8 102.3 102.3 105.1 89.7
Investment Return 110.1 94.0 93.5 100.5 103.0 104.5 82.7
Stock Price Sentiment 104.2 107.5 115.8 105.8 107.4 103.7 128.6
Stock Market Expectation 107.5 103.8 112.6 112.1 111.1 114.3 114.9
70
80
90
100
110
120
Feb-13 May-13 Aug-13 Nov-13 Feb-14
Stock Investment Indicator
-6.94
-7.91
0.18
Investment Return
Stock Price Sentiment
Stock Market Expectations
Stock Investment Indicator: Contribution to Monthly Change (% pt.)
89.7

MNI India Consumer Report - March 201438
89.782.7
128.6
114.9
Stock Investment Indicator
InvestmentReturn
Stock Price Sentiment
Stock Market Expectations
Stock Investment Indicator - Components
80
90
100
110
120
130
140
Feb-13 May-13 Aug-13 Nov-13 Feb-14
Stock Price Sentiment
70
80
90
100
110
120
130
140
Nov-12 Feb-13 May-13 Aug-13 Nov-13 Feb-14
Investment Return
90
95
100
105
110
115
120
125
130
135
140
Nov-12 Feb-13 May-13 Aug-13 Nov-13 Feb-14
Stock Market Expectations
Stock Investment IndicatorRegions and Components

w
The Stock Investment Indicator declined significantly in March...
...as the continued rise in the stock market put respondents off investing in equities.

w
The Real Estate Investment Indicator declined in March, having risen close to record high levels.
The Indicator fell in all regions apart from West and Central India, driven by a rise in House Price Expectations and a decline in House Selling Sentiment.

MNI India Consumer Report - March 2014 41
The Real Estate Investment Indicator, which gauges whether it is a good time to invest in the housing market, declined in March having risen close to a record high level in the previous month.
The indicator fell to 117.8 in March from 119.1 in February, although the three month trend rose for the fifth consecutive month. Sentiment on real estate dipped in the second half of last year before picking up in 2014.
Indian developers and contractors are reliant on ties with the government to acquire land or win contracts and hence many projects are stalled, at least temporarily, until the conclusion of the upcoming elections.
According to another study by the Federation of Indian Chambers of Commerce and Industry and Knight Frank, India’s real estate market deteriorated in the last quarter of 2013 and current sentiment is pessimistic across the country.
The Real Estate Investment Indicator is composed of three sub-indicators. House Buying Sentiment declined in March to 102.8 after rising sharply in the previous month to 107.7. There was a decline in the proportion of respondents who said it was an excellent or a good time to buy a house from 43.6% to 38.1%. There was a significant rise in the number of responses from people who said they were uncertain.
Since May 2013, increasingly more consumers have expected that prices would rise in the next six months.
Real Estate Investment Indicator Declines Slightly
Real Estate Investment Sentiment
Mar-13 Oct-13 Nov-13 Dec-13 Jan-14 Feb-14 Mar-14
Real Estate Invest-ment Sentiment 119.4 110.4 113.2 114.4 114.2 119.1 117.8
Price Expectations 142.4 148.6 147.9 143.8 143.1 152.6 148.6
House Buying 118.1 95.0 92.8 104.8 94.9 107.7 102.8
House Selling 102.2 112.5 101.2 105.4 95.5 102.9 98.2
117.8
100
105
110
115
120
125
Feb-13 May-13 Aug-13 Nov-13 Feb-14
Real Estate Investment Indicator
-1.11
-1.38
1.33
Price Expectations
House Buying Sentiment
House Selling Sentiment
Real Estate Investment Indicator: Contribution to Monthly Change (% pt.)

MNI India Consumer Report - March 201442
110
120
130
140
150
160
Feb-13 May-13 Aug-13 Nov-13 Feb-14
Real Estate Prices: Expected Changes in Next 6 Months
119.1107.7 102.9
152.6
117.8102.8 98.2
148.6
Real Estate Investment Indicator
House Buying Sentiment
House SellingSentiment
House PriceExpectations
Real Estate Investment Indicator - Components
All India NorthIndia
South India
East India
West India
CentralIndia
Expected Changes in Real Estate Prices in the Next 6 months (% of Households)
Real Estate Investment IndicatorComponents and Balances
After rising to a series high of 152.6 in February, the House Price Expectations component slackened to 148.6. The proportion of respondents who thought house prices would rise in the next six months declined from 78.3% to 73.5%.
The House Selling Sentiment component, which has a negative impact on the Real Estate Investment Indicator, fell below the 100 mark in March to 98.2 from 102.9 in February.
RegionsThe Indicator fell in all regions apart from West and Central India driven by a rise in House Price Expectations and a decline in House Selling Sentiment. Respondents in North, South and East India were less optimistic about future house prices. February 2014
March 2014
Go Up Dramatically
Go Up Slightly
Stay the Same
Gow Down Slightly
Go Down Sharply
Don‘t Know/No Answer

MNI India Consumer Report - March 2014 43
80
90
100
110
120
130
Nov-12 Feb-13 May-13 Aug-13 Nov-13 Feb-14
House Buying Sentiment
90
95
100
105
110
115
120
Nov-12 Feb-13 May-13 Aug-13 Nov-13 Feb-14
House Selling Sentiment
44.4%
30.8%
8.5%
7.8%
4.0%4.5%
Reasons for Buying Houses (% of Households)
1.7%
26.1%
34.4%
25.5%
3.8%8.6%
Timing for Selling Houses (% of Households)
Excellent Time
Good Time
Neutral
Bad Time
Very Bad Time
Don‘t Know/No Answer
Prices
Income/Purchasing Power
Investment Value
Policy/Interest Rate
Supply and Quality
Others

MNI India Consumer Report - March 201444
The Car Purchase Indicator increased to the highest level in 10 months in March, as car purchase expectations improved and expectations for the price of gasoline remained broadly stable.
The indicator rose to 75.3 in March from 73.0 in February. Even though the indicator was above the series average of 72.4, it was still below the level seen during the same month a year earlier.
According to the latest data from the Society of Indian Automobile Manufacturers, passenger car sales increased for the first time in five months in February, to 160,718 units, 1.4% above the previous year. The rise in car sales was attributed to price discounting from car manufacturers, following the excise duty reduction on small cars, two wheelers, and commercial vehicles to 8% from 12%.
The Car Purchase Expectations component, which gauges whether consumers believe it is a good or bad time to purchase a car over the next 12 months, rose by 5.4% on the month to 108.9, from 103.2 in the previous month. Positive expectations led the component to the highest since April 2013, leaving it 1.5% above the level seen in the same period a year earlier. Of those who thought it would be a good time to buy a car, a growing proportion believed it offered good investment value.
The Indicator on Gasoline Prices, which measures expectations for the price of gasoline in a year, has remained reasonably high over the past year and it remained broadly stable at 158.3 in March compared with 157.2 in February.
Car Purchase Indicator Highest Since May 2013
50
60
70
80
90
Nov-12 Feb-13 May-13 Aug-13 Nov-13 Feb-14
Car Purchase Indicator
80
90
100
110
120
130
140
150
160
170
180
Nov-12 Feb-13 May-13 Aug-13 Nov-13 Feb-14
Car Purchase Indicator - Components
Car Purchase Expectations
Price of Gasoline
Car Purchase Sentiment
Mar-13 Oct-13 Nov-13 Dec-13 Jan-14 Feb-14 Mar-14
Car Purchase Sentiment 76.6 67.1 65.7 73.8 69.2 73.0 75.3
Car PurchaseExpectations 107.3 98.4 97.7 103.0 99.0 103.2 108.9
Price of Gasoline 154.0 164.1 166.3 155.4 160.6 157.2 158.3
75.3

MNI India Consumer Report - March 2014 45
Car Purchase IndicatorRegions
108.9111.2
100.6
119.0
108.5111.0
All India NorthIndia
South India
East India
West India
CentralIndia
Car Purchase Expectations - Regions
All India NorthIndia
South India
East India
West India
CentralIndia
Reasons for a Bad Time to Buy a Car(% of Households)
Prices
Income/Purchasing Power
Policy/Interest Rate
Supply and Quality
Cost of Use/Upkeep
Others
Reasons for a Good Time to Buy a Car(% of Households)
All India NorthIndia
South India
East India
West India
CentralIndia
Prices
Income/Purchasing Power
Policy/Interest Rate
Supply and Quality
Cost of Use/Upkeep
Others
0.3%
33.5%
34.6%
13.4%
1.6%
16.5%
Is it a Good Time to Buy a Car?(% of Households)
Excellent
Good Time
Neutral
Bad Time
Very Bad Time
Don‘t Know/No Answer

MNI India Consumer Report - March 201446
MNI India Consumer Indicator Regions
112.8
133.3
115.3
142.4
127.4 130.0
110.4
Current Indicator
Expectations Indicator
Personal Finances: Current
Personal Finances: Expected
Business Conditions: 1
Year
Business Conditions: 5
Years
Durable Buying
Conditions
Consumer Indicator Components: North India
90
100
110
120
130
140
Nov-12 Feb-13 May-13 Aug-13 Nov-13 Feb-14
Consumer Indicator: North India
120.0 125.7 124.5114.6 110.9
151.4
115.5
Current Indicator
Expectations Indicator
Personal Finances: Current
Personal Finances: Expected
Business Conditions: 1
Year
Business Conditions: 5
Years
Durable Buying
Conditions
Consumer Indicator Components: South India
110
115
120
125
130
135
140
Nov-12 Feb-13 May-13 Aug-13 Nov-13 Feb-14
Consumer Indicator: South India

MNI India Consumer Report - March 2014 47
112.7
132.5
109.0
128.2 130.5138.8
116.4
Current Indicator
Expectations Indicator
Personal Finances: Current
Personal Finances: Expected
Business Conditions: 1
Year
Business Conditions: 5
Years
Durable Buying
Conditions
Consumer Indicator Components: East India
100
110
120
130
140
Nov-12 Feb-13 May-13 Aug-13 Nov-13 Feb-14
Consumer Indicator: East India
115.2
135.9
121.7
138.2128.7
140.8
108.7
Current Indicator
Expectations Indicator
Personal Finances: Current
Personal Finances: Expected
Business Conditions: 1
Year
Business Conditions: 5
Years
Durable Buying
Conditions
Consumer Indicator Components: West India
90
100
110
120
130
140
150
Nov-12 Feb-13 May-13 Aug-13 Nov-13 Feb-14
Consumer Indicator: West India
MNI India Consumer Report - March 201448
North India South India East India West India Central India
Employment Outlook for the Next 12 Months (% of Households)
133.0 133.3127.3
115.3
142.5 139.8
All India North India
SouthIndia
EastIndia
WestIndia
Central India
Expected Interest Rate on House and Car Loans Indicator
Much Better
A Little Better
About the Same
A Little Worse
Much Worse
Don‘t Know/No Answer
116.5
142.1
126.3
149.2
128.0
149.2
106.8
Current Indicator
Expectations Indicator
Personal Finances: Current
Personal Finances: Expected
Business Conditions: 1
Year
Business Conditions: 5
Years
Durable Buying
Conditions
Consumer Indicator Components: Central India
110
115
120
125
130
135
Jun-13 Sep-13 Dec-13 Mar-14
Consumer Indicator: Central India

MNI India Consumer Report - March 2014 49
All India North India South India East India West India Central India
Is it a Good/Bad Time to Buy Large Household Goods? (% of Households)
NorthIndia
SouthIndia
EastIndia
WestIndia
CentralIndia
Interest Rates Expectations (% of Households)
75.369.8
84.779.9
71.2 73.7
All India NorthIndia
South India
East India
West India
CentralIndia
Car Purchase Indicator - Regions
Much Higher
A Little HIgher
About the Same
A Little Lower
Much Lower
Don‘t Know/No Answer
Excellent Time
Good Time
Neutral
Bad Time
Very Bad Time
Don‘t Know/No Answer
MNI India Consumer Report - March 201450
MNI India Consumer Indicator Income Groups
115.1125.9
117.9
143.6
114.5
Personal Finances: Current
Personal Finances: Expected
Business Conditions: 1
Year
Business Conditions: 5
Years
Durable Buying
Conditions
< INR 432,000 - Components
129.8
121.2
135.6
123.4
114.8
129.2
Total Indicator Current Indicator Expectations Indicator
< INR 432,000 per annum
128.6134.8
121.0
139.7
111.3
Personal Finances: Current
Personal Finances: Expected
Business Conditions: 1
Year
Business Conditions: 5
Years
Durable Buying
Conditions
> INR 432,000 - Components
132.6
123.2
138.9
127.1
120.0
131.9
Total Indicator Current Indicator Expectations Indicator
> INR 432,000 per annum
February 2014
March 2014
February 2014
March 2014

Consumer confidence declined in both low and high income households.
On average, the level of confidence remains greater for higher income households.

Spitzzeile Titel52
A selection of comments from the panel of consumers surveyed over the past month.
What the Panel Said

“The price of cars is set to come down since the Finance Minister announced a reduction in excise duty on cars.”
“Education and food expenses have gone up so it is not easy to buy goods like TVs and computers.”
“Many companies are opening in Pune, so business conditions are better.”
“After the elections, companies will start investing.”
“People like to have vehicles that are big enough and fuel efficient so many buy diesel cars these days.”
“The price of houses and real estate will increase as the area is more developed now.”
“If Narendra Modi becomes the Prime Minister, then business conditions would improve in the coming year.”
“Most of the companies in Mumbai are moving outside so business conditions will be a little worse over the next year.”
“Because of higher daily expenses, a common man can‘t think about buying a car.”
“Because of the recent riot in Muzzafarnagar, business was affected a lot but it will surely improve next year.”
“Right now the property market is saturated so after six months it will be a good time to buy a house.”
“If the government changes, business conditions might improve.”
“New companies are coming in Patna.”
“The recent rain across India has badly affected vegetable supplies and will lead to higher prices.”
MNI India Consumer Report - March 2014 53

w
Respondents were looking forward to the national elections in May...
...with an expectation that the new government will help bring down price pressures.

Spitzzeile Titel 55
A closer look at the data from the March consumer survey.
Data Tables

MNI India Consumer Report - March 201456
North India Overview
Jan-14 Feb-14 Mar-14Highest
Since Lowest
Since 3-Month Average
Monthly Change
Monthly % Change
NorthI India Consumer Indicator 115.1 122.9 125.1 Nov-12 - 121.0 2.2 1.8%
Current Indicator 105.0 113.7 112.8 - Jan-14 110.5 -0.9 -0.8%
Expectations Indicator 121.9 129.0 133.3 Nov-12 - 128.1 4.3 3.3%
Personal Finance: Current 111.5 121.2 115.3 - Jan-14 116.0 -5.9 -4.9%
Personal Finance: Expected 127.4 133.9 142.4 series high - 134.6 8.5 6.4%
Business Condition: 1 Year 113.2 125.9 127.4 series high - 122.2 1.5 1.2%
Business Condition: 5 Year 125.0 127.2 130.0 Jun-13 - 127.4 2.8 2.2%
Durable Buying Conditions 98.4 106.2 110.4 Aug-13 - 105.0 4.2 3.9%
Current Business Conditions Indicator 98.2 103.3 90.5 - series low 97.3 -12.8 -12.4%
Stock Investment Indicator 105.6 101.6 77.1 - series low 94.8 -24.5 -24.1%
Real Estate Investment Indicator 110.0 120.8 116.8 - Jan-14 115.9 -4.0 -3.3%
Car Purchase Indicator 70.2 74.7 69.8 - Dec-13 71.6 -4.9 -6.6%
Employment Outlook Indicator 107.4 115.3 103.9 - series low 108.9 -11.4 -9.9%
Inflation Expectations Indicator 149.6 156.4 158.3 series high - 154.8 1.9 1.2%
Current Prices Satisfaction Indicator 75.1 71.3 60.8 - Nov-13 69.1 -10.5 -14.8%
Interest Rates Expectations Indicator 133.1 130.7 133.3 Dec-13 - 132.4 2.6 2.0%

MNI India Consumer Report - March 2014 57
South India Overview
Jan-14 Feb-14 Mar-14Highest
Since Lowest
Since 3-Month Average
Monthly Change
Monthly % Change
South India Consumer Indicator 123.1 135.1 123.4 - Jan-14 127.2 -11.7 -8.7%
Current Indicator 118.0 132.2 120.0 - Jan-14 123.4 -12.2 -9.3%
Expectations Indicator 126.5 137.0 125.7 - Nov-13 129.7 -11.3 -8.3%
Personal Finance: Current 123.5 139.2 124.5 - Jan-14 129.1 -14.7 -10.6%
Personal Finance: Expected 120.3 142.0 114.6 - series low 125.6 -27.4 -19.3%
Business Condition: 1 Year 116.6 125.6 110.9 - series low 117.7 -14.7 -11.6%
Business Condition: 5 Year 142.5 143.6 151.4 series high - 145.8 7.8 5.4%
Durable Buying Conditions 112.6 125.3 115.5 - Jan-14 117.8 -9.8 -7.8%
Current Business Conditions Indicator 118.0 138.6 110.7 - series low 122.4 -27.9 -20.1%
Stock Investment Indicator 102.0 104.6 98.2 - Nov-13 101.6 -6.4 -6.1%
Real Estate Investment Indicator 109.0 116.2 114.6 - Jan-14 113.3 -1.6 -1.3%
Car Purchase Indicator 75.4 82.7 84.7 Jun-13 - 80.9 2.0 2.4%
Employment Outlook Indicator 124.0 134.9 125.5 - Jan-14 128.1 -9.4 -7.0%
Inflation Expectations Indicator 166.0 156.7 143.6 - Jul-13 155.4 -13.1 -8.4%
Current Prices Satisfaction Indicator 73.5 96.2 64.0 - Mar-13 77.9 -32.2 -33.4%
Interest Rates Expectations Indicator 137.7 146.8 127.3 - Jun-13 137.3 -19.5 -13.3%

MNI India Consumer Report - March 201458
East India Overview
Jan-14 Feb-14 Mar-14Highest
Since Lowest
Since 3-Month Average
Monthly Change
Monthly % Change
East India Consumer Indicator 119.7 129.4 124.6 - Jan-14 124.6 -4.8 -3.7%
Current Indicator 119.3 116.0 112.7 - Sep-13 116.0 -3.3 -2.9%
Expectations Indicator 120.0 138.3 132.5 - Jan-14 130.3 -5.8 -4.2%
Personal Finance: Current 118.5 122.3 109.0 - Dec-13 116.6 -13.3 -10.9%
Personal Finance: Expected 120.0 139.9 128.2 - Jan-14 129.4 -11.7 -8.4%
Business Condition: 1 Year 116.9 129.0 130.5 May-13 - 125.5 1.5 1.2%
Business Condition: 5 Year 123.1 146.1 138.8 - Jan-14 136.0 -7.3 -5.0%
Durable Buying Conditions 120.1 109.7 116.4 Jan-14 - 115.4 6.7 6.0%
Current Business Conditions Indicator 100.6 113.5 109.3 - Jan-14 107.8 -4.2 -3.7%
Stock Investment Indicator 100.0 - - - - - - -
Real Estate Investment Indicator 115.4 132.4 124.2 - Jan-14 124.0 -8.2 -6.2%
Car Purchase Indicator 68.8 79.4 79.9 May-13 - 76.0 0.5 0.7%
Employment Outlook Indicator 82.5 115.7 111.0 - Jan-14 103.1 -4.7 -4.1%
Inflation Expectations Indicator 135.5 149.8 145.1 - Jan-14 143.5 -4.7 -3.1%
Current Prices Satisfaction Indicator 69.5 65.0 72.3 Oct-13 - 68.9 7.3 11.2%
Interest Rates Expectations Indicator 130.6 120.4 115.3 - Mar-13 122.1 -5.1 -4.2%

MNI India Consumer Report - March 2014 59
West India Overview
Jan-14 Feb-14 Mar-14Highest
Since Lowest
Since 3-Month Average
Monthly Change
Monthly % Change
West India Consumer Indicator 125.8 126.1 127.6 Dec-12 - 126.5 1.5 1.2%
Current Indicator 114.4 113.9 115.2 Nov-13 - 114.5 1.3 1.2%
Expectations Indicator 133.5 134.3 135.9 Nov-12 - 134.6 1.6 1.2%
Personal Finance: Current 126.0 121.6 121.7 Jan-14 - 123.1 0.1 0.1%
Personal Finance: Expected 136.0 136.6 138.2 Jan-13 - 136.9 1.6 1.2%
Business Condition: 1 Year 128.1 131.1 128.7 - Jan-14 129.3 -2.4 -1.8%
Business Condition: 5 Year 136.3 135.2 140.8 Nov-12 - 137.4 5.6 4.1%
Durable Buying Conditions 102.8 106.1 108.7 Nov-13 - 105.9 2.6 2.5%
Current Business Conditions Indicator 115.7 110.9 105.0 - Sep-13 110.5 -5.9 -5.3%
Stock Investment Indicator 99.3 106.6 83.3 - series low 96.4 -23.3 -21.9%
Real Estate Investment Indicator 120.3 114.9 116.8 Jan-14 - 117.3 1.9 1.6%
Car Purchase Indicator 64.4 62.9 71.2 Dec-13 - 66.2 8.3 13.3%
Employment Outlook Indicator 119.3 119.7 120.2 Dec-13 - 119.7 0.5 0.4%
Inflation Expectations Indicator 156.2 153.5 160.6 series high - 156.8 7.1 4.6%
Current Prices Satisfaction Indicator 79.8 69.7 70.6 Jan-14 - 73.4 0.9 1.3%
Interest Rates Expectations Indicator 141.3 134.2 142.5 Nov-13 - 139.3 8.3 6.2%

MNI India Consumer Report - March 201460
Central India Overview
Jan-14 Feb-14 Mar-14Highest
Since Lowest
Since 3-Month Average
Monthly Change
Monthly % Change
Central India Consumer Indicator 117.1 125.9 131.9 Apr-13 - 125.0 6.0 4.7%
Current Indicator 108.6 113.1 116.5 Dec-13 - 112.7 3.4 3.0%
Expectations Indicator 122.7 134.4 142.1 Apr-13 - 133.1 7.7 5.7%
Personal Finance: Current 119.1 113.9 126.3 Apr-13 - 119.8 12.4 10.8%
Personal Finance: Expected 130.0 133.6 149.2 Apr-13 - 137.6 15.6 11.6%
Business Condition: 1 Year 110.9 129.5 128.0 - Jan-14 122.8 -1.5 -1.2%
Business Condition: 5 Year 127.3 140.2 149.2 series high - 138.9 9.0 6.4%
Durable Buying Conditions 98.2 112.3 106.8 - Jan-14 105.8 -5.5 -4.9%
Current Business Conditions Indicator 97.3 114.8 97.5 - Jan-14 103.2 -17.3 -15.1%
Stock Investment Indicator 133.3 116.7 - - - - - -
Real Estate Investment Indicator 115.5 118.3 125.7 series high - 119.8 7.4 6.3%
Car Purchase Indicator 69.1 70.1 73.7 Dec-13 - 71.0 3.6 5.2%
Employment Outlook Indicator 108.2 123.8 111.9 - Jan-14 114.6 -11.9 -9.6%
Inflation Expectations Indicator 147.3 158.2 163.6 series high - 156.4 5.4 3.4%
Current Prices Satisfaction Indicator 77.3 65.6 76.3 Jan-14 - 73.1 10.7 16.3%
Interest Rates Expectations Indicator 129.1 136.1 139.8 Sep-13 - 135.0 3.7 2.8%

MNI India Consumer Report - March 2014 61
All India Overview by Age
Jan-14 Feb-14 Mar-14Highest
Since Lowest
Since 3-Month Average
Monthly Change
Monthly % Change
Age 18-34
MNI India Consumer Indicator 123.4 127.5 124.5 - Jan-14 125.1 -3.0 -2.3%
Current Indicator 118.0 117.1 114.5 - Sep-13 116.5 -2.6 -2.2%
Expectations Indicator 127.0 134.3 131.2 - Jan-14 130.8 -3.1 -2.4%
Personal Finance: Current 124.2 124.6 121.1 - Sep-13 123.3 -3.5 -2.9%
Personal Finance: Expected 130.0 141.1 131.5 - Jan-14 134.2 -9.6 -6.9%
Business Condition: 1 Year 117.3 126.0 121.6 - Jan-14 121.6 -4.4 -3.5%
Business Condition: 5 Year 133.6 135.8 140.4 series high - 136.6 4.6 3.4%
Durable Buying Conditions 111.8 109.7 108.0 - Sep-13 109.8 -1.7 -1.5%
Age 35-54
MNI India Consumer Indicator 121.4 130.2 126.6 - Jan-14 126.1 -3.6 -2.8%
Current Indicator 112.6 121.7 117.1 - Jan-14 117.1 -4.6 -3.8%
Expectations Indicator 127.2 135.9 133.0 - Jan-14 132.0 -2.9 -2.2%
Personal Finance: Current 121.3 127.9 119.4 - Aug-13 122.9 -8.5 -6.7%
Personal Finance: Expected 128.2 137.0 134.7 - Jan-14 133.3 -2.3 -1.7%
Business Condition: 1 Year 120.2 130.4 124.0 - Jan-14 124.9 -6.4 -4.9%
Business Condition: 5 Year 133.1 140.2 140.1 - Jan-14 137.8 -0.1 -0.1%
Durable Buying Conditions 104.0 115.5 114.8 - Jan-14 111.4 -0.7 -0.6%
Age 55-64
MNI India Consumer Indicator 116.9 120.5 127.3 series high - 121.6 6.8 5.7%
Current Indicator 106.2 109.8 114.1 Dec-13 - 110.0 4.3 3.9%
Expectations Indicator 124.0 127.6 136.1 series high - 129.2 8.5 6.7%
Personal Finance: Current 109.9 117.8 113.6 - Jan-14 113.8 -4.2 -3.5%
Personal Finance: Expected 119.8 128.6 131.9 Dec-12 - 126.8 3.3 2.5%
Business Condition: 1 Year 122.8 126.1 133.1 series high - 127.3 7.0 5.5%
Business Condition: 5 Year 129.5 128.0 143.3 series high - 133.6 15.3 12.0%
Durable Buying Conditions 102.6 101.9 114.6 Jul-13 - 106.4 12.7 12.5%

MNI India Consumer Report - March 201462
All India - Overview by Income
Jan-14 Feb-14 Mar-14Highest
Since Lowest
Since 3-Month Average
Monthly Change
Monthly % Change
< INR 432,000 per annum
MNI India Consumer Indicator 120.7 129.8 123.4 - Jan-14 124.6 -6.4 -5.0%
Current Indicator 114.8 121.2 114.8 - Jan-14 116.9 -6.4 -5.3%
Expectations Indicator 124.6 135.6 129.2 - Jan-14 129.8 -6.4 -4.8%
Personal Finance: Current 121.9 127.0 115.1 - Jul-13 121.3 -11.9 -9.4%
Personal Finance: Expected 121.9 139.1 125.9 - Jan-14 129.0 -13.2 -9.5%
Business Condition: 1 Year 118.1 130.5 117.9 - Dec-13 122.2 -12.6 -9.6%
Business Condition: 5 Year 133.9 137.3 143.6 series high - 138.3 6.3 4.6%
Durable Buying Conditions 107.6 115.4 114.5 - Jan-14 112.5 -0.9 -0.8%
> INR 432,000 per annum
MNI India Consumer Indicator 120.9 132.6 127.1 - Jan-14 126.9 -5.5 -4.2%
Current Indicator 111.5 123.2 120.0 - Jan-14 118.2 -3.2 -2.6%
Expectations Indicator 127.1 138.9 131.9 - Jan-14 132.6 -7.0 -5.1%
Personal Finance: Current 114.1 134.1 128.6 - Jan-14 125.6 -5.5 -4.2%
Personal Finance: Expected 124.1 142.9 134.8 - Jan-14 133.9 -8.1 -5.6%
Business Condition: 1 Year 121.6 128.0 121.0 - Sep-13 123.5 -7.0 -5.4%
Business Condition: 5 Year 135.7 145.9 139.7 - Jan-14 140.4 -6.2 -4.2%
Durable Buying Conditions 108.8 112.2 111.3 - Jan-14 110.8 -0.9 -0.8%

MNI India Consumer Report - March 2014 63
Methodology
The MNI India Consumer Sentiment Survey is a wide ranging monthly survey of consumer confidence across India.
Data is collected via telephone interviews. At least 1,000 interviews are conducted each month across the country.
The survey adopts a similar methodology to the University of Michigan survey of U.S. consumer sentiment.
The main MNI India Consumer Indicator is derived from five questions, two on current conditions and three on future expectations:
1) Current personal financial situation compared to a year ago2) Current willingness to buy major household items3) Personal financial situation one year from now4) Overall business conditions one year from now5) Overall business conditions for the next 5 years
Indicators relating to specific questions in the report are diffusion indices with 100 representing a neutral level, meaning positive and negative answers are equal. Values above 100 indicate increasing positivity while values below show increasing negativity.

Published byMNI Indicators | Deutsche Börse GroupWestferry House11 Westferry CircusLondon E14 [email protected]
Copyright© 2014 MNI Indicators | Deutsche Börse Group. Reproduction or retransmission in whole or in part is prohibited except by permission. All rights reserved.