mn afp today’s vision. tomorrow’s reality. · treasury key performance indicators cash forecast...
TRANSCRIPT
MN AFP Today’s Vision. Tomorrow’s Reality.
Metrics That Matter - Key Performance Indicators/Working Capital
Cathy Conto, Bank of America Merrill Lynch Kyle Mekemson, Bank of America Merrill Lynch
May 2, 2017

2
Introductions
Working capital overview
Key performance indicator (KPI) overview
Treasury KPIs
Accounts payable KPIs
Accounts receivable KPIs
Reporting, communication plan and on-going process
Financial benchmarking & working capital analysis
Q&A
Agenda

3 3
Working Capital – a holistic view
Working Capital
Management
DSO
DPO
Inventory
Cash Management
Control
Visibility
Forecasts
Financial Processes
A/R
A/P
Reconciliation
Liquidity
Financial Risk Management
Interest Rate Counterparty
Sovereign/ Country
Systems & Processes
ERP
TMS
T&E
Working Capital Metrics
Cost of Capital
FX
Market
SOX
Payroll
Legal & Tax
Rationalize/ Standardize/
Automate
Pooling/ Netting
Investing
Repatriation
Access to Capital
Leasing
Capital Markets
Lines of Credit
Supply Chain Financing
Trade Solutions
Purchasing
4
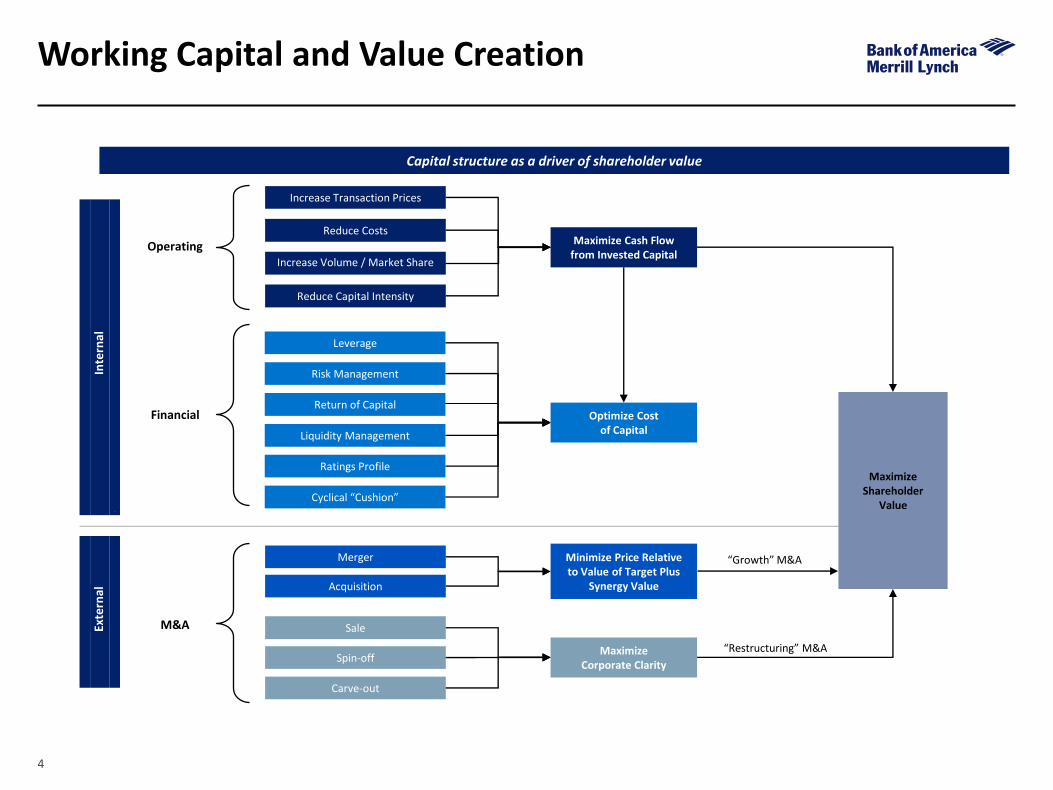
Working Capital and Value Creation
Increase Transaction Prices
Reduce Costs
Increase Volume / Market Share
Reduce Capital Intensity
Merger
Acquisition
Sale
Spin-off
Carve-out
Maximize Cash Flow from Invested Capital
Minimize Price Relative to Value of Target Plus
Synergy Value
Maximize Shareholder
Value
Operating
Financial
M&A
Maximize Corporate Clarity
“Growth” M&A
“Restructuring” M&A
Inte
rnal
Exte
rnal
Leverage
Risk Management
Liquidity Management
Optimize Cost of Capital
Cyclical “Cushion”
Ratings Profile
Return of Capital
Capital structure as a driver of shareholder value

5
Strategic Working Capital: beyond CCC
New Leadership
Capex Expansion
Fraud Prevention
“Lean” Finance
M&A Integration
Global Expansion
New ERP
Working Capital
Opportunities Maintain control/ visibility on international ops
Capture cost synergies so deal becomes accretive and adds value sooner
Focus on how future additional volume will be managed
Review policies and ensure tight controls are in place
Establish goals/ priorities given culture and ownership of firm
Incorporate “lean” Finance/Treasury concepts to lower costs
Build better, automated processes rather than replicate old processes

6 6
Metrics • A numerical measure designed to identify and help manage specific activities,
financial line items or risk present in ordinary operations.
• Provide an unbiased means of measuring the performance and activities of an organization.
KPIs • All KPIs are metrics.
• Represent the ‘critical few’ metrics that are the most important to achieving success.
• Measures how effective an organization is at achieving the business targets or strategy.
A KPI is a metric that you have chosen, and agreed with your
business partners, that will determine whether you are
meeting your critical success factors.
What gets measured, gets managed
Metrics vs. KPIs

7 7
You can’t get from there to here without the right tools.
Key performance indicators (KPIs)
CONTROL EFFECIENCY SUPPORT
Navigation: To plan, monitor and control the course and position of someone or something from one place to another.

8 8
Treasury’s transformation
Evolve from a tactician to a strategic advisor.
Link treasury performance
to corporate goals
Increase transparency across the organization
Identify shortfalls and inefficient processes
Analyze and optimize processes
Maintain
1 2
3 4 5

9 9
Improved performance metrics establish treasury’s commitment to excellence.
Transformation and transparency
Transformation involves lifting the veil of secrecy surrounding treasury.
Increased transparency may be uncomfortable at first.

10 10
What are you trying to measure and why?
Metrics shouldn’t exist in a vacuum.
Is the effort linked to a new strategy?
Are there issues facing the department/company?
What are the end goals of the effort?
What do you hope to accomplish through metrics?
What will you be comparing the results to?
What will you do with the results?
Metrics are a powerful tool that can transform how your team functions.

11 11
Nature of metrics
Track treasury’s contribution to a new project or objective
Develop on an “as needed” basis
Not relevant once project or objective is complete
Track the efficiency of processes, minimization of error rates and achievement of returns on assets
Activities are recurring
Strategic Tactical

12 12
Treasury key performance indicators
Cash forecast accuracy Investment income, interest expense, bank fees, trustee fees, etc.
Liquidity and cash Percent of daily cash balances vs. forecast Percent of non-interest bear cash vs. total cash Percent of restricted cash vs. total cash Days cash available Percent of committed credit vs. total credit available
Exposure management Variance to market rate at time of trade (trade rate – market rate at time of trade)/ market rate Fixed / Floating rate mix Hedge percent
− principle value of identified hedged exposures/principle value of total identified exposures
Debt management Short term vs. long term debt mix Debt vs. Equity mix All-in interest rate vs. benchmark
Investment performance Portfolio credit rating (weighted average credit ratings vs. stated policy target) Maturity structure/schedule

13 13
Accounts payable key performance indicators
Measuring success
Process efficiency: − % Invoices straight-through
processing (3 way match) − % Electronic invoices − % Electronic payments (ACH,
card) − % Cash discounts available that
are taken Other: − % Vendor portal utilization
Working capital optimization: − Average days payment
outstanding (DPO) − $ cash discounts taken − $ rebates Cycle time: − Invoice cycle time (receipt to
scheduled for payment) Cost effectiveness: − $ Unit cost to process an invoice − $ Unit cost to process a payment Staff productivity: − # Invoices processed per
Accounts Payable FTE − # Payments per Accounts Payable
FTE

14
Procure to pay metrics
New vendor contracts approved/signed #
Met
rics
P
roce
ss o
utp
uts
K
ey
ou
tpu
ts
New vendors entered #
Active vendors #
Preferred suppliers #,%
Vendor scorecards #,%
Vendor reviews #,%
Met
rics
p
roce
ss in
pu
ts
Ke
y in
pu
ts
POs #
ASN #
PO invoices #
Non PO invoices #
Time to approve # (days)
AP Invoice processing FTEs #
Electronic invoices #,%
Invoice cycle time # (days)
Invoices per FTE #
Payments by type (check, ACH, card, wire) #, $
Payments on time based on terms %
Cash discounts available that were taken %
Payments per FTE #
Reconciling items #, $
Escheatment items #, $
Vendor Portal utilization %
Met
rics
E2
E o
utp
uts
Auto match “no touch” (2/3 way) % Average Days Payable Outstanding DPO
Cash forecast variance % 2 way match % (PO, ASN) 3 way match % (PO, receipt, invoice)
Unit cost: Cost per invoice $
Purchase orders (paper & electronic)
Contract terms and pricing
Goods sent/services performed
Advanced Shipping Notice (ASN)
Vendor contracts
Procurement polices
Vendor master data procedures
Procurement system
AP system
Reports
On line bank access and reports
Vendor Portal & data updates
Payments issued
Checks cleared
AP transactions
On line bank access and reports
Escheatment policy
Cash forecast template
PO invoices (paper & electronic)
Non PO invoices (paper & electronic)
3 way match capabilities
Approval hierarchy/policy & routing process
Terms, due date, payment method, bank info & cash discounts offered per vendor master
Final payment review/approval
Check pre-register
Payment files created
Payment cycle runs #
Invoices ready to pay based on terms #, %
Disbursement FTEs #
New and updated vendor master data
Payment terms & cash discounts determined
Invoice format and payment information entered
Vendor performance
AP sub ledger reconciled to GL
GL reconciled to bank
Checks outstanding
Accruals
Escheatment items submitted
Monthly AP Mgmt reporting
Cash forecast for payables
Payment cycle runs
Checks issued & mailed
ACH file sent
Wires processed
Credit card payments sent
Positive pay file sent
Invoice discrepancies resolved
Invoices approved
Invoices set to pay
Goods received
ASN matched to goods
Inventory updated
Vendor inquires & problems resolved
Vendor Portal data accurate & available 24/7
PO & receipt Invoicing Payments sent Customer service Reconciliation & reporting Vendor management
Electronic payments %
Unit cost: Cost per payment $
Cash discounts taken $
Rebates $
# of inquires and problems
Root cause analysis of inquires and problems
Vendors with standard terms #, %
Vendor payment methods #,%
Vendors with cash discounts %
Vendor phone calls #
Vendors with access to Portal #, %
POs electronic #, %
ASN #, %
Vendor phone calls
Vendor correspondence
Vendor Portal data files

15 15
Accounts receivable key performance indicators
Measuring success
Staff productivity: − # Receipts processed per
Accounts Receivable FTE − # Active customers per
Credit/Collections FTE Process efficiency: − % Electronic invoices − % Electronic payments − % Payment application auto hit
rate (no touch) − # incurred deductions − % collection effectiveness index Other: − Cash tolerance (small balance)
write offs #, $, average amount
Working capital optimization: − Average days sales outstanding
(DSO) measured against best possible days sales outstanding (BPDSO)
Cycle time: − # days to resolve payment
discrepancies (deductions) Cost effectiveness: − % Invoice accuracy − $ Unit cost to apply a payment − $ Unit cost to collect − % Invoices over 60 days − $ Bad debt/write-off expenses

16
Order to cash metrics
New /existing customer credit apps received #
Set up/amendments #
Met
rics
P
roce
ss O
utp
uts
K
ey
Ou
tpu
ts
New/existing credit apps processed #
Set up/ Amendments processed #
Denied # and reasons
Met
rics
P
roce
ss In
pu
ts
Ke
y In
pu
ts
Billing FTEs #
Time to invoice # (days)
Total daily receipts #, $ Average Days Delinquent ADD # (days)
Collectors FTEs #
Incurred deduction #, $
Invoices created #, $
Paper invoices #
Electronic invoices #
Errors by reason #, $, %
Weighted average days unbilled
ACH, credit card, check, wire #, $, %
Total unapplied cash coded by type and aging #, $, %
Total applied by pay type #, $
Payment application cycle time # (days)
Receipts per FTE #
Open AR past due $, %
% Current
Repays #, $, %
Deductions closed by reason #, $
Deductions per FTE #
Collections per FTE #
Bad Debt to Sales %
Bad Debts #, $
Cash forecast variance %
Met
rics
E2
E O
utp
uts
Invoice accuracy % Average Days Sales Outstanding DSO (compared to best
possible DSO) Accounts Receivable Turnover ART ratio %
Collection Effectiveness Index CEI
Unit cost: Collections $
Average Days Deductions Outstanding DDO
Unit cost: Deductions $
EDI %
Unit cost: Cost to invoice $
ACH %
Sales orders
Credit limit and terms
Contract terms and pricing
Billing information
Billing procedures
Completed customer application
Credit polices
Master data procedures
AR transactions
On line bank access and reports
Cash forecast template
Write off account detail
Aged trial balance
Customer billing info and credit terms
Collection and deduction procedures
Open invoices, payments and deductions
Checks
ACH payments
Wires
Credit card charges
Customer remit detail
Payment instructions
Bank files
Payment file to HighRadius
MICR table to HighRadius
Cash application procedures, business & customer specific application rules
Cash and deduction reason codes
Total daily receipts sent to HighRadius #, $
Total daily receipts applied manually #,$
Payment application FTEs #
New and updated customer master data
Credit terms determined
Billing and payment information entered
Collection letters generate; phone calls made; activities documented
Invoices paid
Invoices marked for write off/bad debt
Deductions written off or credit memos issued
Over payments applied or written off or refunded
Applied items closed automatically (STP)
Items on account
Items unprocessed
Over/short pays coded
Small balance auto write off
Payments processed & electronic file transmitted
ACH remit data transmitted
Files uploaded
File created and transmitted to HighRadius
List of payments to be applied manually (wires, credit cards)
Electronic or paper invoice sent to customer
Reconcile billing & AR
AR sub ledger reconciled to GL
GL reconciled to bank
Reserve and write off analysis
Bad debt reserve updated
Monthly AR Mgmt reporting
Cash forecast for receivables
Fulfillment & invoicing
Payments received
Payment application
Reconciliation & reporting
Deduction management & collections
Credit & customer Set up
Auto hit rate “no touch” %
Unit cost: Payment application $
Reconciling items #, $
Cash tolerance write offs #, $, average amount
Customers with standard terms %

17 17
Management reporting
Scorecard example
Reporting & dashboard examples Scorecard
Management report
Dashboard

18 18
Communication plan
Gather input from stakeholders
Revise KPIs & performance targets
Communicate change
Ongoing feedback loop:
Only include metrics that are meaningful to the audience.
Stakeholders Make sure the message is
easy to understand
Visuals Reporting that show performance against
goals/benchmarks
Focus Limit the number of
metrics to eight or fewer
What: How: Who:
19 19
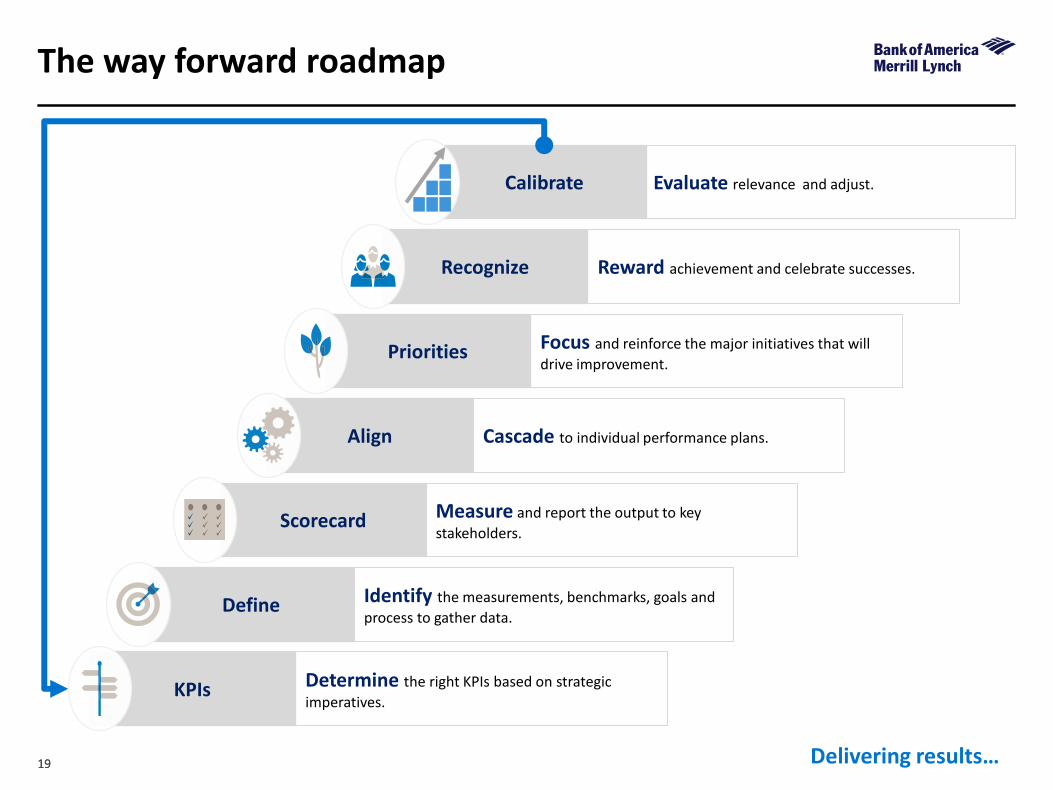
The way forward roadmap
Delivering results…
Scorecard Measure and report the output to key
stakeholders.
Calibrate Evaluate relevance and adjust.
Recognize Reward achievement and celebrate successes.
Priorities Focus and reinforce the major initiatives that will
drive improvement.
KPIs Determine the right KPIs based on strategic
imperatives.
Define Identify the measurements, benchmarks, goals and
process to gather data.
Align Cascade to individual performance plans.

20 20
Summary
Tracking and communicating KPIs is critical to
transformation and success.
Reward achievements and celebrate successes.
Periodically reassess relevance of measures and
revise goals.
Measure, monitor and reward!!!
Financial benchmarking & working capital analysis

22
Benefits of benchmarking versus peer companies:
Financial Benchmarking Value Proposition
Create sense of urgency Identify best in class Establish clear targets with measurable results Facilitate out of the box thinking and new ideas
Source: Sustainability Advantage: Benefits of a Gold standard Benchmark

23
Five stages of benchmarking:
Source: Company Benchmarking for Competitive Advantage by Terry Pilcher Assistant Director – Department of Trade and Industry, UK
Planning Analysis Integration Action Maturity
Step 1: Indentify what is to be benchmarked Step 2: Identify comparable companies Step 3: Determine data collection method and collect data
Step 4: Determine current performance ‘gap’ Step 5: Project future performance levels
Step 6: Communicate benchmark findings and gain acceptance Step 7: Establish functional goals
Step 8: Develop action plans Step 9: Implement specific action and monitor progress Step 10: Recalibrate benchmarks
Leadership position attained Best practices fully integrated into process
Financial Benchmarking Typical Progression

24
Financial benchmarking resources for middle market companies:
Industry Trade Associations
Vendors (D&B / Hoovers)
Banking Partners
(RMA data)
Public Comps (CapIQ/Fact
Set)
CPAs / Consultants
IRS and other Government
Sources
Financial Benchmarking Resources for Information

25 25
Credit Profile
Efficiency
Risk Management
Debt / EBITDA
Interest Coverage Ratio
Cash Liquidity Profile
Bank and Credit Ratings
Effective Borrowing Rate
Invested Capital
Cash Conversion Cycle
Working Capital (DPO, DSO, DIO)
Fixed / Floating debt mix
Currency of Debt vs. Currency of Earnings
Foreign Exchange
Metrics that Drive Corporate Decision Making & Behavior Financial Benchmarking

26
Financial Benchmarking Output Example Market Trends Overview & Peer Analysis
Source: First Research
Competitive Landscape: US Specialty Equipment Market
Demand is driven by consumer spending
The profitability of individual companies depends on effective marketing, efficient production, and product innovation
Large companies have economies of scale in purchasing and production
Small firms can compete by making specialty products
The industry is highly concentrated with the top 50 companies accounting for more than 95% of industry revenue
U.S. exports of specialty equipment are small; imports come primarily from China, Japan, Canada and Taiwan
Client Type: Public Client Industry: Specialty Equipment Manufacturing
27 27
Specialty Equipment Manufacturing
Factors Driving the
Industry
Opportunities
Challenges
Trends
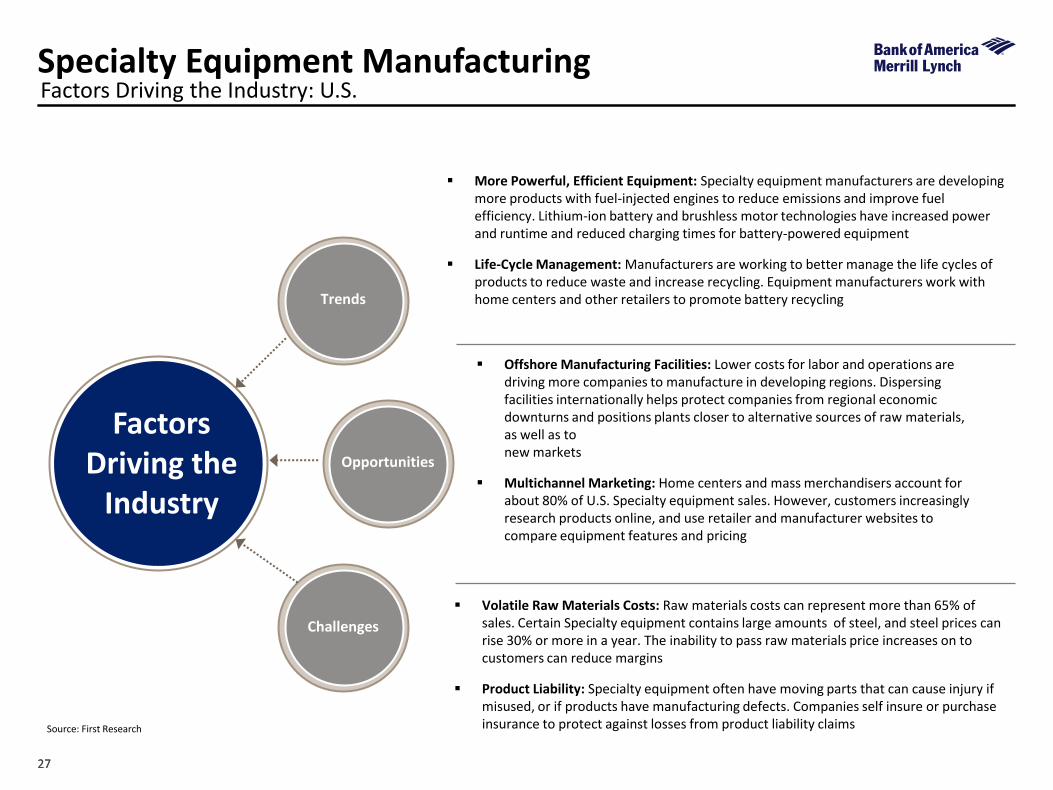
Offshore Manufacturing Facilities: Lower costs for labor and operations are driving more companies to manufacture in developing regions. Dispersing facilities internationally helps protect companies from regional economic downturns and positions plants closer to alternative sources of raw materials, as well as to new markets
Multichannel Marketing: Home centers and mass merchandisers account for about 80% of U.S. Specialty equipment sales. However, customers increasingly research products online, and use retailer and manufacturer websites to compare equipment features and pricing
More Powerful, Efficient Equipment: Specialty equipment manufacturers are developing more products with fuel-injected engines to reduce emissions and improve fuel efficiency. Lithium-ion battery and brushless motor technologies have increased power and runtime and reduced charging times for battery-powered equipment
Life-Cycle Management: Manufacturers are working to better manage the life cycles of products to reduce waste and increase recycling. Equipment manufacturers work with home centers and other retailers to promote battery recycling
Volatile Raw Materials Costs: Raw materials costs can represent more than 65% of sales. Certain Specialty equipment contains large amounts of steel, and steel prices can rise 30% or more in a year. The inability to pass raw materials price increases on to customers can reduce margins
Product Liability: Specialty equipment often have moving parts that can cause injury if misused, or if products have manufacturing defects. Companies self insure or purchase insurance to protect against losses from product liability claims
Factors Driving the Industry: U.S.
Source: First Research
28
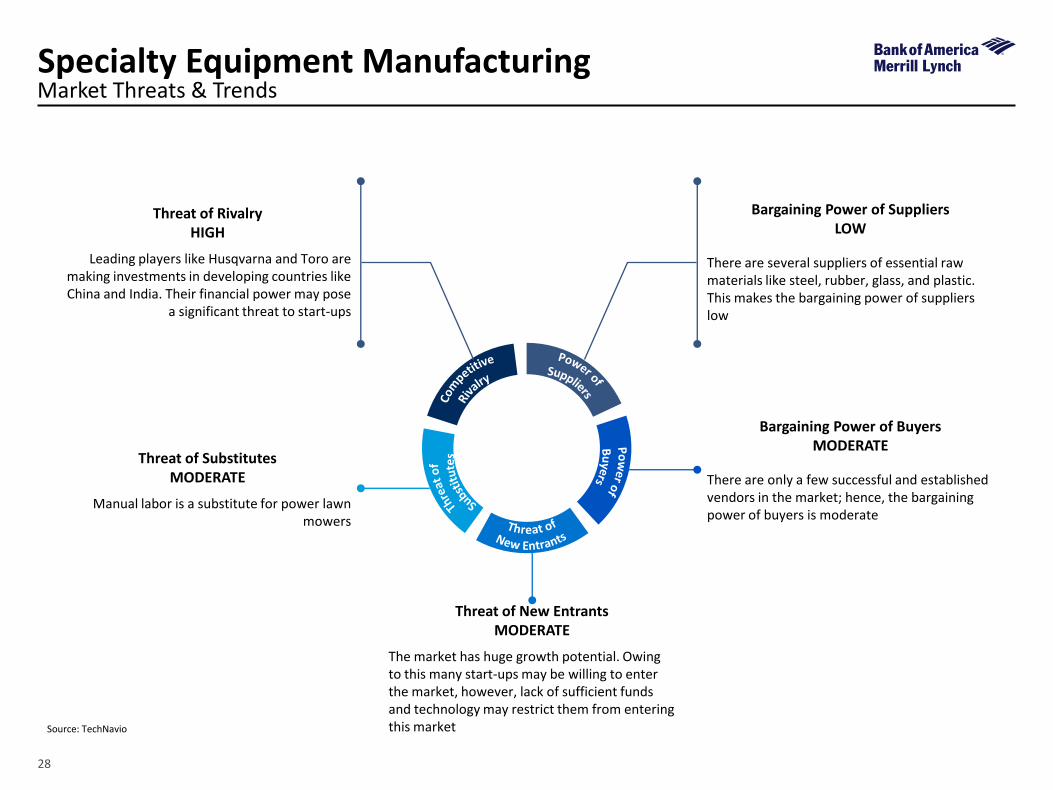
Threat of New Entrants MODERATE
The market has huge growth potential. Owing to this many start-ups may be willing to enter the market, however, lack of sufficient funds and technology may restrict them from entering this market Source: TechNavio
Bargaining Power of Suppliers LOW
There are several suppliers of essential raw materials like steel, rubber, glass, and plastic. This makes the bargaining power of suppliers low
Bargaining Power of Buyers MODERATE
There are only a few successful and established vendors in the market; hence, the bargaining power of buyers is moderate
Threat of Substitutes MODERATE
Manual labor is a substitute for power lawn mowers
Threat of Rivalry HIGH
Leading players like Husqvarna and Toro are making investments in developing countries like China and India. Their financial power may pose
a significant threat to start-ups
Specialty Equipment Manufacturing Market Threats & Trends

29
Operational Benchmarking Example 1
Operational Growth
2013A – 2015A EBITDA CAGR
2013A – 2015A Revenue
CAGR
2015A EBITDA Margin
2014A EBITDA Margin
EBITDA Margin Performance
Median: 10.5% Average: 11.4%
Median: 12.2% Average: 12.7%
Median: 5.1% Average: 4.3%
Median: 18.6% Average: 19.7%
6.4%
10.6%
2.8%5.3%
9.4%7.9%
1.5%
-4.0%
8.8%
5.0%
-3.8%-5%
0%
5%
10%
15%
9.6% 10.9%
29.2%
16.5%
33.7%
12.1% 13.8%18.7% 20.0%
24.1%18.5%
0%
10%
20%
30%
40%
12.02%
22.88%
10.45%8.22%
10.90%
17.45% 17.29%
10.56%5.71% 6.37%
4.01%
0%
10%
20%
30%
11.98%
24.80%
12.36%10.23% 12.08%
18.53% 17.29%13.72%
6.11% 7.37%4.66%
0%
10%
20%
30%
Co A Co B Co C Co D Co E Co F Co G Co H Co I Co J Co K
Co A Co B Co C Co D Co E Co F Co G Co H Co I Co J Co K

30 30
Operational Benchmarking Example 2
LQTR Unused Revolver % of LTM Revenue
LTM Free Cash Flow / Revenue LTM Working Capital Cycle
LQTR Cash % of LTM Revenue (1)
42%
28% 28%24%
15% 15% 15% 14%9%
2%6%
0%
5%
10%
15%
20%
25%
30%
35%
40%
45%
28%
13%9% 9%
5% 5% 4%2% 2% 1%
7%
0%
5%
10%
15%
20%
25%
30%
71%
17% 14% 13% 13% 9% 7% 7% 5% 4%14%
0%
10%
20%
30%
40%
50%
60%
70%
80%
Co A Co A
Co A Co A
Co C
Co C Co C
Co C Co D
Co D Co D
Co D Co E
Co E Co E
Co E Co G Co F
Co F Co F
Co F Co G
Co G Co G
Co H Co H
Co K Co H Co H
Co I
Co I Co I
Co I
Co J Co J
Co J Co J
Co B Co B
Co B Co B Co K Co K
Co K
Receivables Inventory Payables
2860 62 47
70114
6630 28 34
53
96
118
6960
58
107
64115
35
77
88
55
24
4452
123
35
3942
21
20
72
0
50
100
150
200
250
300

31 31
Individual Company Trends Benchmarking
Peer Working Capital Development
Peer Historical Cash Conversion Cycle
Company A Total Working Capital View
Receivables Inventory Payables
424.37 423.76 $429.8$468.6 $483.3
$513.0
-500
0
500
1000
FY 2011 FY 2012 FY 2013 FY 2014 FY 2015 Latest QTR
-44 -46 -47 -46 -43 -47
64 67 67 71 72 79
56 58 57 58 55 56
-100
-50
0
50
100
150
FY 2011 FY 2012 FY 2013 FY 2014 FY 2015 Latest QTR
Net Working Capital
Net Working Capital
Receivables Inventory Payables
-35 -35 -38 -32 -36 -55
65 71 66 71 79 9627 27 27 25 26
28
-100
-50
0
50
100
150
FY 2011 FY 2012 FY 2013 FY 2014 FY 2015 Latest QTR
$247.4 $270.6
$252.5 $301.8 $353.7 $301.8
Receivables Inventory Payables

32 32
Impact Analysis for DPO Extension - example
Balance Sheet Improvement Return of Capital Business Investment
Improvement in Days Payable
2 Days 4 Days 6 Days 8 Days 10 Days
1/31/17 Trade Payables 232.4 232.4 232.4 232.4 232.4
Adjutsed Days Payable 57.3 59.3 61.4 63.4 65.4
Adjusted Trade Payables $241.0 $249.5 $258.0 $266.5 $275.1
Impact on Cash Flow (1)$8.5 $17.0 $25.6 $34.1 $42.6
% of LTM FCF 2.6% 5.1% 7.7% 10.2% 12.8%
Impacts
Consideration...... With Strategic Payable Extension, leadership teams have the ability to redeploy found capital in various ways.....

33
Typical priorities and challenges for middle market companies:
Financial Benchmarking Working Capital
Financing growth and
strategic investments
Reducing debt/ increasing liquidity
Funding
day-to-day operations
Reducing costs
Increasing margins
Managing
risks
Doing business globally
A focus on working capital management can positively impact business objectives

34
Why Working Capital Matters
1
2
3
5
6
Generates increased cash flow in the business
Reduces funding requirements, and interest expenses
Creates rating headroom and debt capacity
Reduces leverage – alleviates ratings pressure
Increases cash conversion – an important valuation metric
Reduces the level of invested capital, enhancing Return on Invested capital 7
4 Provides funding for growth & increased capital expenditures


Appendix Treasury metrics

37 37
Error rate
Accuracy of cash forecasts
(Actual cash balance minus forecasted cash balance) / forecasted cash balance
Accuracy of forecasted investment income
(Actual interest investment income minus forecasted investment income) / forecasted investment income
Accuracy of forecasted interest expense
(Actual interest expense minus forecasted interest expense) / forecasted interest expense
Accuracy of trustee/issuing, paying agent fees
(Actual fees minus forecasted fees) / forecasted fees
Percentage of payments containing errors
Number of payments by type containing errors / total number of payments by type
Number of payments containing errors / number of payments Total number of payments released on time / total number of released payments
Best practices in managing corporate liability

38 38
Liquidity and cash management
Percentage daily cash balances vs. forecast
Sum of daily cash balances / forecasted total cash balances
Percentage of non-interest bearing cash vs. total cash
Total balances in non-interest bearing accounts or instruments / total cash
Percentage of restricted cash vs. total cash
Total restricted cash / total cash
Days cash available Total available cash / average value of disbursements per day
Percentage of committed credit
Total principal value of committed credit facilities / total principal value of all credit facilities
Best practices in managing corporate liability

39 39
Best practices in managing corporate liability
Liquidity and cash management
Portfolio credit rating Weighted average of issuer credit ratings vs. stated policy benchmark
Maturity structure Principal value of investments at stated maturity intervals / principal value of
entire portfolio
Return vs. benchmark Portfolio’s weighted average return vs. benchmark
Segmentation of portfolio investment
Total principal of investments by maturity / total Investment portfolio Total principal of investments by issuer / total investment portfolio Total principal of investments by type of investment / total investment portfolio Total principal of investments by issuer credit rating / total investment portfolio
40 40
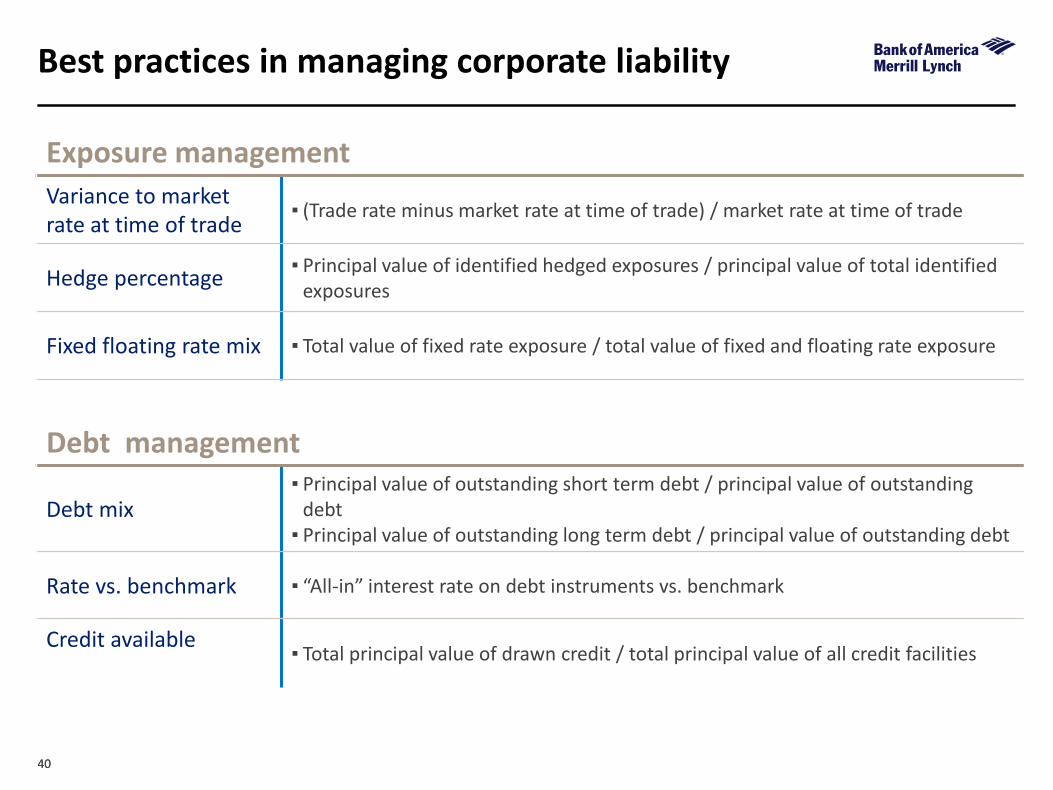
Exposure management
Variance to market rate at time of trade
(Trade rate minus market rate at time of trade) / market rate at time of trade
Hedge percentage Principal value of identified hedged exposures / principal value of total identified
exposures
Fixed floating rate mix Total value of fixed rate exposure / total value of fixed and floating rate exposure
Debt management
Debt mix Principal value of outstanding short term debt / principal value of outstanding
debt Principal value of outstanding long term debt / principal value of outstanding debt
Rate vs. benchmark “All-in” interest rate on debt instruments vs. benchmark
Credit available
Total principal value of drawn credit / total principal value of all credit facilities
Best practices in managing corporate liability

41 41
Biography
Cathy Conto Director; Engagement Executive GTS Advisory Office: +1. 980.387.8222 Mobile: +1.704.905.3532 [email protected]
As part of the GTS Advisory team, Cathy is dedicated to helping companies improve working capital and
end-to-end processes. Her expertise in unit costing, operational strategies, capacity management and
shared service models has enabled companies to optimize their procure-to-pay, order-to-cash and
business performance while improving customer satisfaction.
Cathy joined the bank in 2004 as a Quality & Productivity Engineer and was instrumental in developing strategic planning and benchmarking
processes to align with enterprise goals. Promoted to lead Global Credit Operations Business Performance Management, Cathy provided
product expertise, risk mitigation and flawless execution to corporate and commercial credit clients.
Prior to joining the bank, Cathy led accounts receivable, revenue accounting and management at various companies in the consumer package
goods, food, media and healthcare industries. During this period, Cathy led 10 multi-geographic business consolidations and optimization
initiatives.
Cathy received her Bachelor’s degree from Gustavus Adolphus College. She resides in Charlotte, North Carolina with her family.
GTS Advisory

42 42
Biography
Kyle Mekemson Senior Vice President; Sr Treasury Sales Officer GTS Sales Office: + 1.612.656.3619 [email protected]
Kyle Mekemson is a Senior Vice President in the Global Transaction Services organization at Bank of
America Merrill Lynch. In his current role, Kyle is responsible for providing working capital and liquidity
management strategies to middle market companies located in Minnesota.
Kyle joined Bank of America in 2005 within the Global Risk Management Department.
Kyle graduated from Indiana University in 2004. He is a Certified Treasury Professional and a participant in the Association for Financial
Professionals. He resides in Minneapolis, Minnesota with his family.
GTS Sales

43
Notice to Recipient
“Bank of America Merrill Lynch” is the marketing name for the global banking and global markets businesses of Bank of America Corporation. Lending, derivatives, and other commercial banking activities are performed globally by banking affiliates of Bank of America Corporation, including Bank of America, N.A., Member FDIC. Securities, strategic advisory, and other investment banking activities are performed globally by investment banking affiliates of Bank of America Corporation (“Investment Banking Affiliates”), including, in the United States, Merrill Lynch, Pierce, Fenner & Smith Incorporated and Merrill Lynch Professional Clearing Corp., both of which are registered broker-dealers and Members of SIPC, and, in other jurisdictions, by locally registered entities. Merrill Lynch, Pierce, Fenner & Smith Incorporated and Merrill Lynch Professional Clearing Corp. are registered as futures commission merchants with the CFTC and are members of the NFA. Investment products offered by Investment Banking Affiliates: Are Not FDIC Insured • May Lose Value • Are Not Bank Guaranteed. ©2017 Bank of America Corporation. This document is intended for information purposes only and does not constitute a binding commitment to enter into any type of transaction or business relationship as a consequence of any information contained herein.
These materials have been prepared by one or more subsidiaries of Bank of America Corporation solely for the client or potential client to whom such materials are directly addressed and delivered (the “Company”) in connection with an actual or potential business relationship and may not be used or relied upon for any purpose other than as specifically contemplated by a written agreement with us. We assume no obligation to update or otherwise revise these materials, which speak as of the date of this presentation (or another date, if so noted) and are subject to change without notice. Under no circumstances may a copy of this presentation be shown, copied, transmitted or otherwise given to any person other than your authorized representatives. Products and services that may be referenced in the accompanying materials may be provided through one or more affiliates of Bank of America, N.A.
We are required to obtain, verify and record certain information that identifies our clients, which information includes the name and address of the client and other information that will allow us to identify the client in accordance with the USA Patriot Act (Title III of Pub. L. 107-56, as amended (signed into law October 26, 2001)) and such other laws, rules and regulations.
We do not provide legal, compliance, tax or accounting advice.
For more information, including terms and conditions that apply to the service(s), please contact your Bank of America Merrill Lynch representative.
Investment Banking Affiliates are not banks. The securities and financial instruments sold, offered or recommended by Investment Banking Affiliates, including without limitation money market mutual funds, are not bank deposits, are not guaranteed by, and are not otherwise obligations of, any bank, thrift or other subsidiary of Bank of America Corporation (unless explicitly stated otherwise), and are not insured by the Federal Deposit Insurance Corporation (“FDIC”) or any other governmental agency (unless explicitly stated otherwise).
This document is intended for information purposes only and does not constitute investment advice or a recommendation or an offer or solicitation, and is not the basis for any contract to purchase or sell any security or other instrument, or for Investment Banking Affiliates or banking affiliates to enter into or arrange any type of transaction as a consequent of any information contained herein.
With respect to investments in money market mutual funds, you should carefully consider a fund’s investment objectives, risks, charges, and expenses before investing. Although money market mutual funds seek to preserve the value of your investment at $1.00 per share, it is possible to lose money by investing in money market mutual funds. The value of investments and the income derived from them may go down as well as up and you may not get back your original investment. The level of yield may be subject to fluctuation and is not guaranteed. Changes in rates of exchange between currencies may cause the value of investments to decrease or increase.
We have adopted policies and guidelines designed to preserve the independence of our research analysts. These policies prohibit employees from offering research coverage, a favorable research rating or a specific price target or offering to change a research rating or price target as consideration for or an inducement to obtain business or other compensation.
Copyright 2017 Bank of America Corporation. Bank of America N.A., Member FDIC, Equal Housing Lender.