mixed-frequency signals - ibiblio.org · mixed-frequency signals ... what is a harmonic frequency?...
TRANSCRIPT

Mixed-frequency signals
This worksheet and all related files are licensed under the Creative Commons Attribution License,version 1.0. To view a copy of this license, visit http://creativecommons.org/licenses/by/1.0/, or send aletter to Creative Commons, 559 Nathan Abbott Way, Stanford, California 94305, USA. The terms andconditions of this license allow for free copying, distribution, and/or modification of all licensed works bythe general public.
Resources and methods for learning about these subjects (list a few here, in preparation for yourresearch):
1

Questions
Question 1
The following circuit is a simple mixer circuit, combining three AC voltage signals into one, to bemeasured by an oscilloscope:
Hz
FUNCTION GENERATOR
1 10 100 1k 10k 100k 1M
outputDCfinecoarse
Hz
FUNCTION GENERATOR
1 10 100 1k 10k 100k 1M
outputDCfinecoarse
Hz
FUNCTION GENERATOR
1 10 100 1k 10k 100k 1M
outputDCfinecoarse
trigger
timebase
s/divDC GND AC
X
GNDDCV/div
vertical
OSCILLOSCOPE
Y
AC
Draw a schematic diagram of this circuit, to make it easier to analyze.Is it possible to filter the three constituent input signals from each other in the resulting output signal,
or are they irrevocably affected by one another when they ”mix” together in this resistor network? Howdoes the superposition principle relate to the operation of a mixer circuit like this?
What if the mixing circuit contains capacitors and inductors rather than resistors? Does the sameprinciple apply? Why or why not?
file 00648
Question 2
What is a musical chord? If viewed on an oscilloscope, what would the signal for a chord look like?file 00647
2

Question 3
What is a harmonic frequency? If a particular electronic system (such as an AC power system) has afundamental frequency of 60 Hz, calculate the frequencies of the following harmonics:
• 1st harmonic =• 2nd harmonic =• 3rd harmonic =• 4th harmonic =• 5th harmonic =• 6th harmonic =
file 01890
Question 4
What is a harmonic frequency? If an oscillator circuit outputs a fundamental frequency of 12 kHz,calculate the frequencies of the following harmonics:
• 1st harmonic =• 2nd harmonic =• 3rd harmonic =• 4th harmonic =• 5th harmonic =• 6th harmonic =
file 02255
Question 5
An octave is a type of harmonic frequency. Suppose an electronic circuit operates at a fundamentalfrequency of 1 kHz. Calculate the frequencies of the following octaves:
• 1 octave greater than the fundamental =• 2 octaves greater than the fundamental =• 3 octaves greater than the fundamental =• 4 octaves greater than the fundamental =• 5 octaves greater than the fundamental =• 6 octaves greater than the fundamental =
file 01891
3

Question 6
An interesting thing happens if we take the odd-numbered harmonics of a given frequency and add themtogether at certain diminishing ratios of the fundamental’s amplitude. For instance, consider the followingharmonic series:
(1 volt at 100 Hz) + (1/3 volt at 300 Hz) + (1/5 volt at 500 Hz) + (1/7 volt at 700 Hz) + . . .1st harmoni 1st + 3rd1st + 3rd + 5th 1st + 3rd + 5th + 7th
Here is what the composite wave would look like if we added all odd-numbered harmonics up to the13th together, following the same pattern of diminishing amplitudes:1st + 3rd + 5th + 7th + 9th + 11th + 13th
If we take this progression even further, you can see that the sum of these harmonics begins to appearmore like a square wave:
4

All odd-numbered harmoni s up to the 35th
This mathematical equivalence between a square wave and the weighted sum of all odd-numberedharmonics is very useful in analyzing AC circuits where square-wave signals are present. From the perspectiveof AC circuit analysis based on sinusoidal waveforms, how would you describe the way an AC circuit ”views”a square wave?
file 01597
Question 7
In the early 1800’s, French mathematician Jean Fourier discovered an important principle of waves thatallows us to more easily analyze non-sinusoidal signals in AC circuits. Describe the principle of the Fourier
series, in your own words.file 00650
5
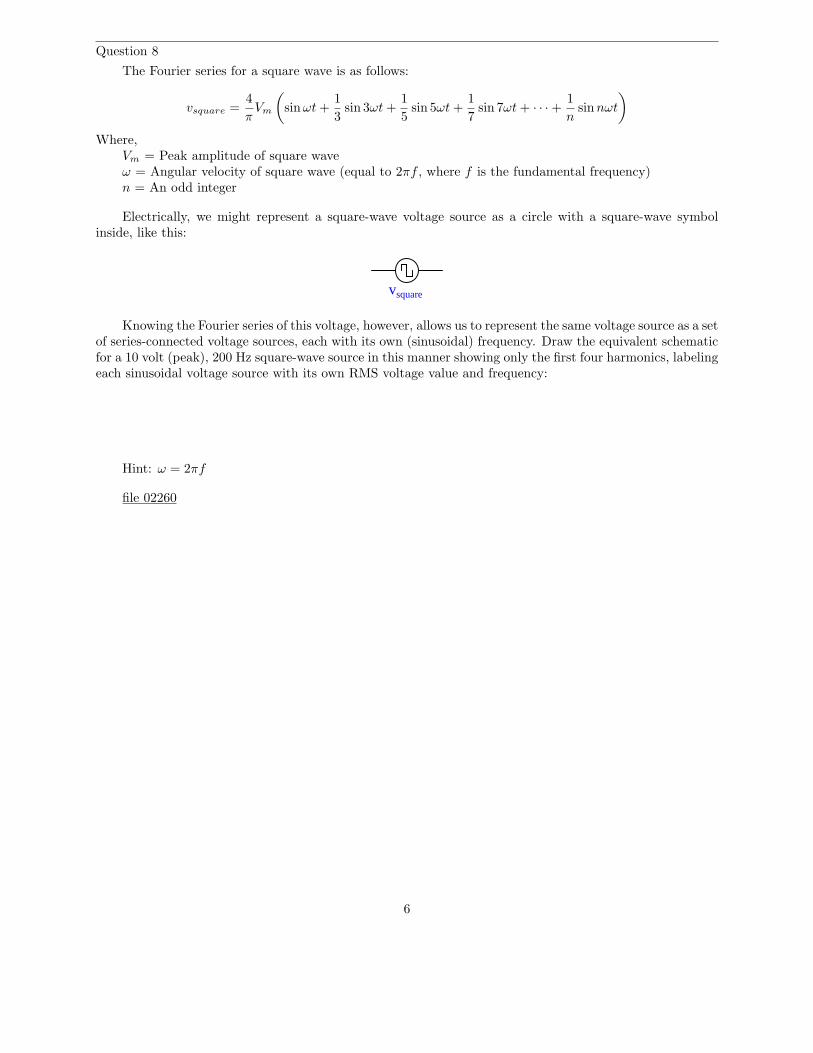
Question 8
The Fourier series for a square wave is as follows:
vsquare =4
πVm
(
sin ωt +1
3sin 3ωt +
1
5sin 5ωt +
1
7sin 7ωt + · · · +
1
nsin nωt
)
Where,Vm = Peak amplitude of square waveω = Angular velocity of square wave (equal to 2πf , where f is the fundamental frequency)n = An odd integer
Electrically, we might represent a square-wave voltage source as a circle with a square-wave symbolinside, like this:
vsquare
Knowing the Fourier series of this voltage, however, allows us to represent the same voltage source as a setof series-connected voltage sources, each with its own (sinusoidal) frequency. Draw the equivalent schematicfor a 10 volt (peak), 200 Hz square-wave source in this manner showing only the first four harmonics, labelingeach sinusoidal voltage source with its own RMS voltage value and frequency:
Hint: ω = 2πf
file 02260
6
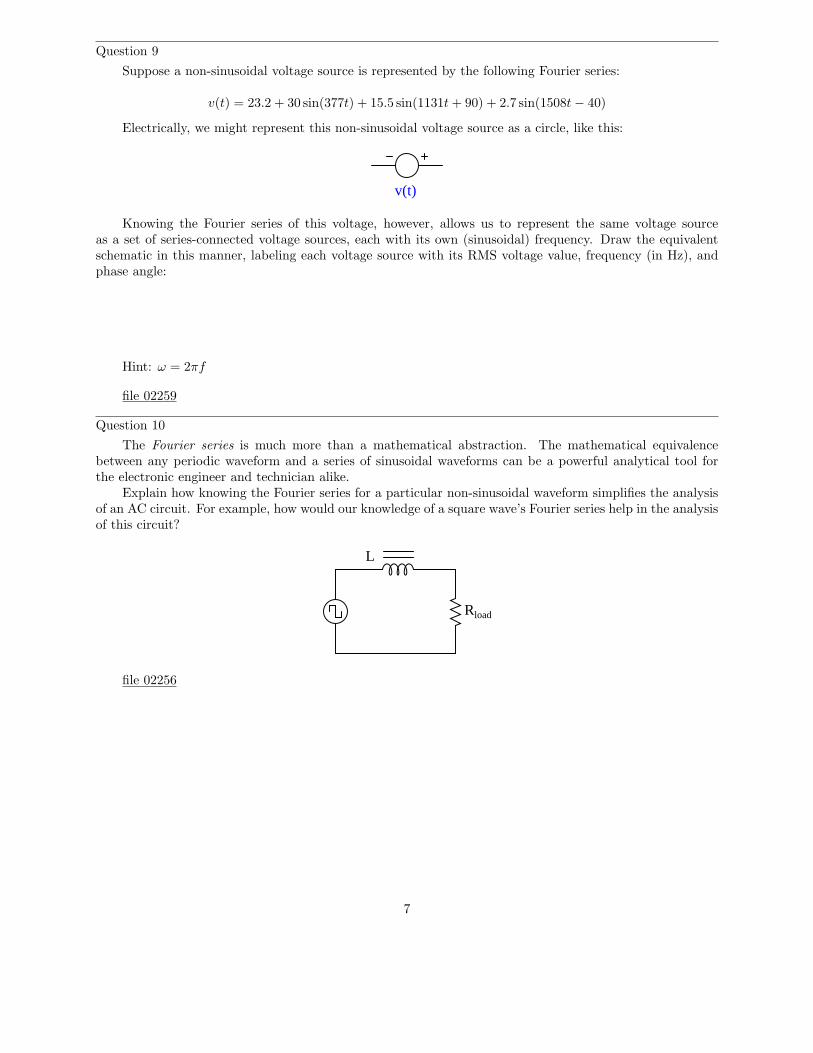
Question 9
Suppose a non-sinusoidal voltage source is represented by the following Fourier series:
v(t) = 23.2 + 30 sin(377t) + 15.5 sin(1131t + 90) + 2.7 sin(1508t − 40)
Electrically, we might represent this non-sinusoidal voltage source as a circle, like this:
v(t)
Knowing the Fourier series of this voltage, however, allows us to represent the same voltage sourceas a set of series-connected voltage sources, each with its own (sinusoidal) frequency. Draw the equivalentschematic in this manner, labeling each voltage source with its RMS voltage value, frequency (in Hz), andphase angle:
Hint: ω = 2πf
file 02259
Question 10
The Fourier series is much more than a mathematical abstraction. The mathematical equivalencebetween any periodic waveform and a series of sinusoidal waveforms can be a powerful analytical tool forthe electronic engineer and technician alike.
Explain how knowing the Fourier series for a particular non-sinusoidal waveform simplifies the analysisof an AC circuit. For example, how would our knowledge of a square wave’s Fourier series help in the analysisof this circuit?
L
Rload
file 02256
7

Question 11
Calculate the power dissipated by a 25 Ω resistor, when powered by a square-wave with a symmetricalamplitude of 100 volts and a frequency of 2 kHz:
25 Ω
+100 V
-100 V
file 00651
Question 12
Calculate the power dissipated by a 25 Ω resistor, when powered by a square-wave with a symmetricalamplitude of 100 volts and a frequency of 2 kHz, through a 0.22 µF capacitor:
25 Ω
+100 V
-100 V
0.22 µF
No, I’m not asking you to calculate an infinite number of terms in the Fourier series – that would becruel and unusual. Just calculate the power dissipated in the resistor by the 1st, 3rd, 5th, and 7th harmonicsonly.
file 00652
8

Question 13
A clever way to produce sine waves is to pass the output of a square-wave oscillator through a low-passfilter circuit:
Square-waveoscillator LP filter
Explain how this principle works, based on your knowledge of Fourier’s theorem.file 03754
Question 14
Identify the type of electronic instrument that displays the relative amplitudes of a range of signalfrequencies on a graph, with amplitude on the vertical axis and frequency on the horizontal.
file 00649
Question 15
Ideally, a sinusoidal oscillator will output a signal consisting of a single (fundamental) frequency, withno harmonics. Realistically, though, sine-wave oscillators always exhibit some degree of distortion, and aretherefore never completely harmonic-free.
Describe what the display of a spectrum analyzer would look like when connected to the output ofa perfect sinusoidal oscillator. Then, describe what the same instrument’s display would look like if theoscillator exhibited substantial distortion.
file 02258
9

Question 16
Suppose an amplifier circuit is connected to a sine-wave signal generator, and a spectrum analyzer usedto measure both the input and the output signals of the amplifier:
0 dB
-20 dB
-40 dB
-60 dB
-80 dB
-100 dB
-120 dB
1 2 3 4 5 6 7 8 9 10
0 dB
-20 dB
-40 dB
-60 dB
-80 dB
-100 dB
-120 dB
1 2 3 4 5 6 7 8 9 10
Amplifier
Input Output
Power
1 kHz
Interpret the two graphical displays and explain why the output signal has more ”peaks” than the input.What is this difference telling us about the amplifier’s performance?
file 03307
10

Question 17
An electronics technician connects the input of a spectrum analyzer to the secondary winding of an ACpower transformer, plugged into a power receptacle. He sets the spectrum analyzer to show 60 Hz as thefundamental frequency, expecting to see the following display:
0 dB
-20 dB
-40 dB
-60 dB
-80 dB
-100 dB
-120 dB
1 2 3 4 5 6 7 8 9 10
Instead, however, the spectrum analyzer shows more than just a single peak at the fundamental:
0 dB
-20 dB
-40 dB
-60 dB
-80 dB
-100 dB
-120 dB
1 2 3 4 5 6 7 8 9 10
Explain what this pattern means, in practical terms. Why is this power system’s harmonic signaturedifferent from what the technician expected to see?
file 03695
Question 18
Ideally, an amplifier circuit increases the amplitude of a signal without altering the signal’s wave-shapein the least. Realistically, though, amplifiers always exhibit some degree of distortion.
Describe how harmonic analysis – either with a spectrum analyzer or some other piece of test equipmentcapable of measuring harmonics in a signal – is used to quantify the distortion of an amplifier circuit.
file 02257
Question 19
What causes harmonics to form in the output of a transistor amplifier circuit, if the input waveform isperfectly sinusoidal (free from harmonics)? Be as specific as you can in your answer.
file 03746
11

Question 20
What causes harmonics to form in the output of a transistor oscillator circuit such as a Colpitts or aHartley, which is designed to produce a sinusoidal signal? Be as specific as you can in your answer.
file 03747
Question 21
What causes harmonics to form in AC electric power systems?file 00653
Question 22
Under certain conditions, harmonics may be produced in AC power systems by inductors andtransformers. How is this possible, as these devices are normally considered to be linear?
file 00655
Question 23
Identify some ways in which harmonics may be mitigated in AC power systems, since they tend to causetrouble for a variety of electrical components.
file 02261
12

Question 24
Explain how the following power-line harmonic analyzer circuit works:
AC input(60 Hz fundamental)
V
L1 C1
L2 C2
L3 C3
L4 C4
L5 C5
R1
R2
R3
R4
R5
1 kΩ
1 kΩ
1 kΩ
1 kΩ
1 kΩ
1st
2nd3rd
4th
5th
Harmonic # L# value C# value1st 20 to 22 H 0.33 µF2nd 11 to 12 H 0.15 µF3rd 5 to 6 H 0.15 µF4th 1.5 to 2.5 H 0.22 µF5th 1 to 1.5 H 0.27 µF
file 03694
13
Question 25
Radio communication functions on the general principle of high-frequency AC power being modulated
by low-frequency data. Two common forms of modulation are Amplitude Modulation (AM) and Frequency
Modulation (FM). In both cases, the modulation of a high frequency waveform by a lower-frequency waveformproduces something called sidebands.
Describe what ”sidebands” are, to the best of your ability.file 00654
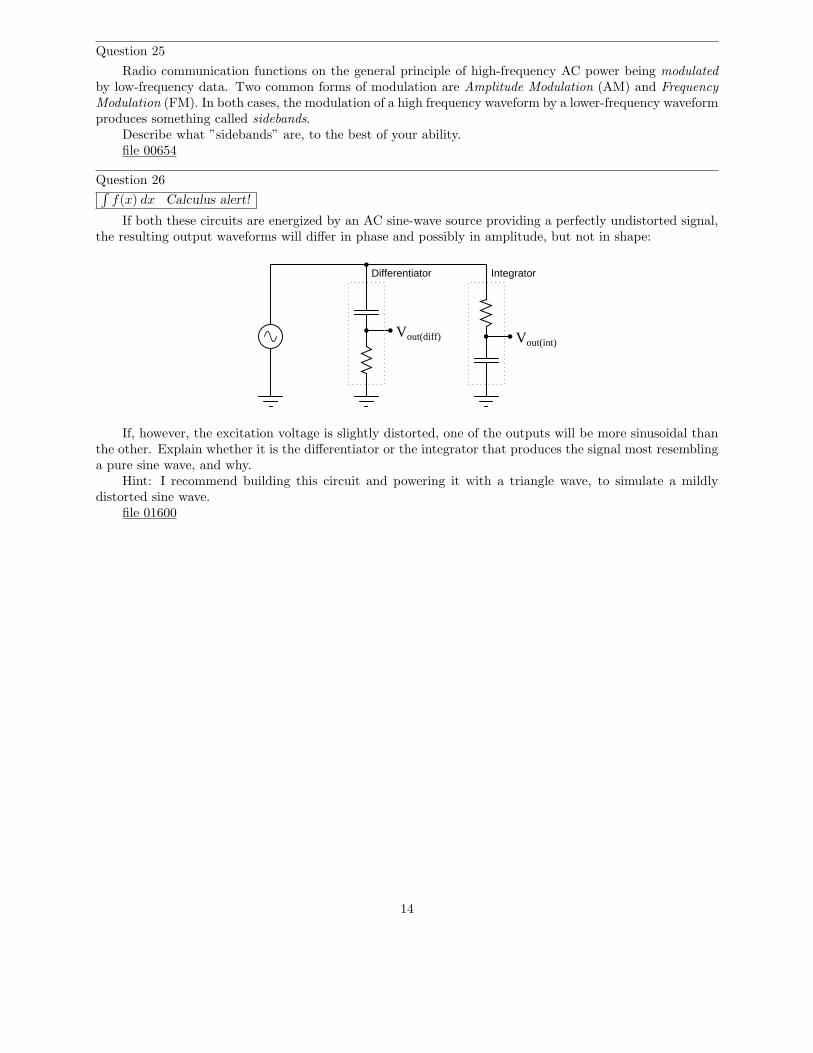
Question 26∫
f(x) dx Calculus alert!
If both these circuits are energized by an AC sine-wave source providing a perfectly undistorted signal,the resulting output waveforms will differ in phase and possibly in amplitude, but not in shape:
Vout(diff) Vout(int)
Differentiator Integrator
If, however, the excitation voltage is slightly distorted, one of the outputs will be more sinusoidal thanthe other. Explain whether it is the differentiator or the integrator that produces the signal most resemblinga pure sine wave, and why.
Hint: I recommend building this circuit and powering it with a triangle wave, to simulate a mildlydistorted sine wave.
file 01600
14

Question 27
Note the effect of adding the second harmonic of a waveform to the fundamental, and compare thateffect with adding the third harmonic of a waveform to the fundamental:1st + 2nd Sum
1st + 3rd SumNow compare the sums of a fundamental with its fourth harmonic, versus with its fifth harmonic:1st + 4th Sum
1st + 5th SumAnd again for the 1st + 6th, versus the 1st + 7th harmonics:
15
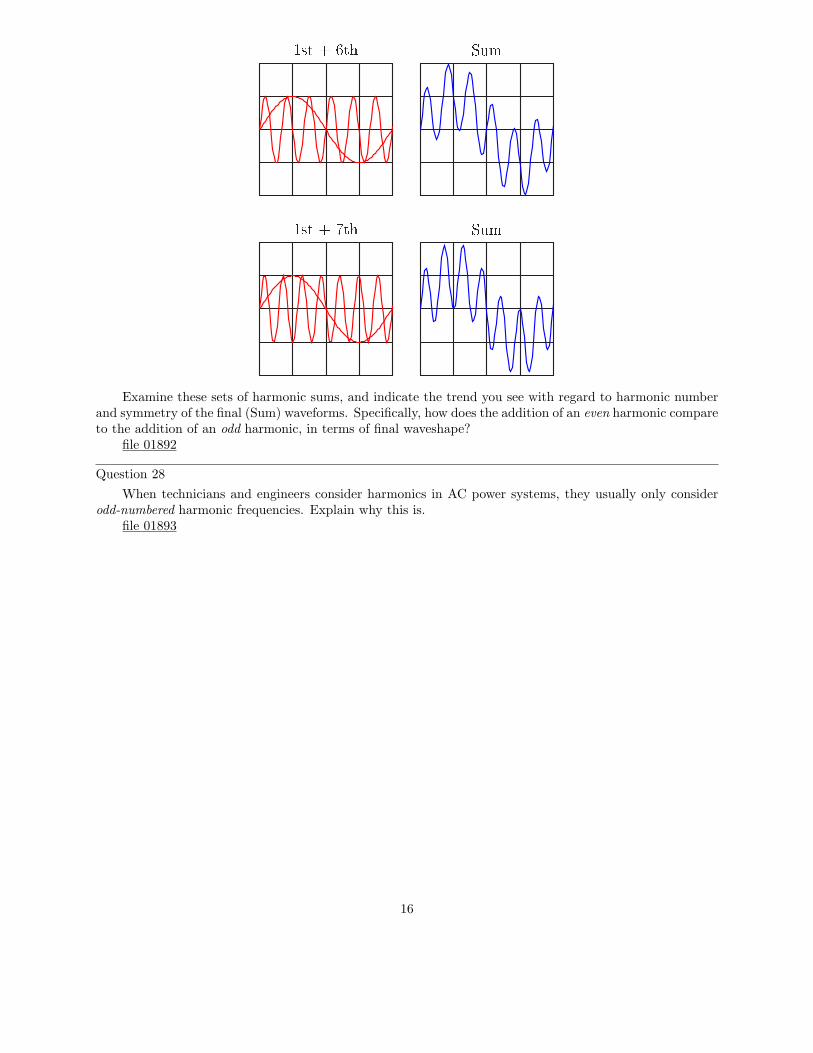
1st + 6th Sum1st + 7th Sum
Examine these sets of harmonic sums, and indicate the trend you see with regard to harmonic numberand symmetry of the final (Sum) waveforms. Specifically, how does the addition of an even harmonic compareto the addition of an odd harmonic, in terms of final waveshape?
file 01892
Question 28
When technicians and engineers consider harmonics in AC power systems, they usually only considerodd-numbered harmonic frequencies. Explain why this is.
file 01893
16

Question 29
By visual inspection, determine which of the following waveforms contain even-numbered harmonics:
A
E
B C
D F
G H I
Note that only one cycle is shown for each waveform. Remember that we’re dealing with continuouswaveforms, endlessly repeating, and not single cycles as you see here.
file 01894
Question 30
By visual inspection, determine which of the following waveforms contain even-numbered harmonics:
A
E
B C
D F
G H I
Note that only one cycle is shown for each waveform. Remember that we’re dealing with continuouswaveforms, endlessly repeating, and not single cycles as you see here.
file 03306
17
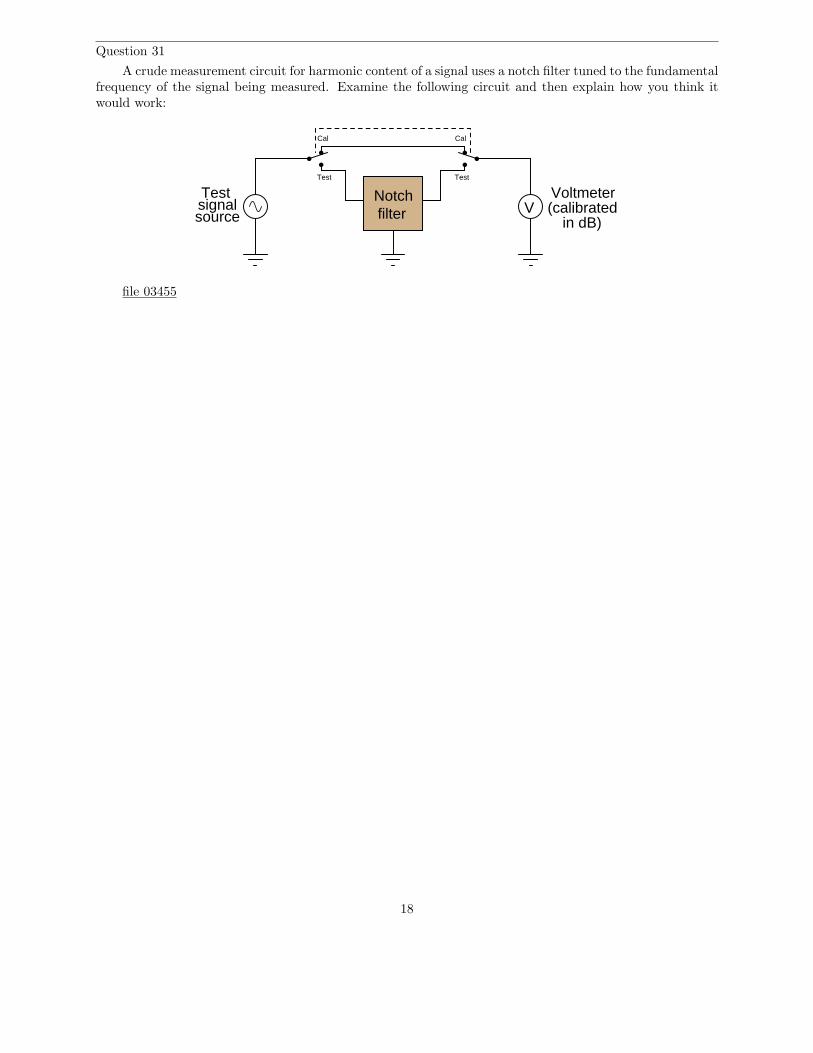
Question 31
A crude measurement circuit for harmonic content of a signal uses a notch filter tuned to the fundamentalfrequency of the signal being measured. Examine the following circuit and then explain how you think itwould work:
VVoltmeter(calibrated
in dB)
Cal
Test
Cal
Test
Notchfilter
Testsignalsource
file 03455
18
Answers
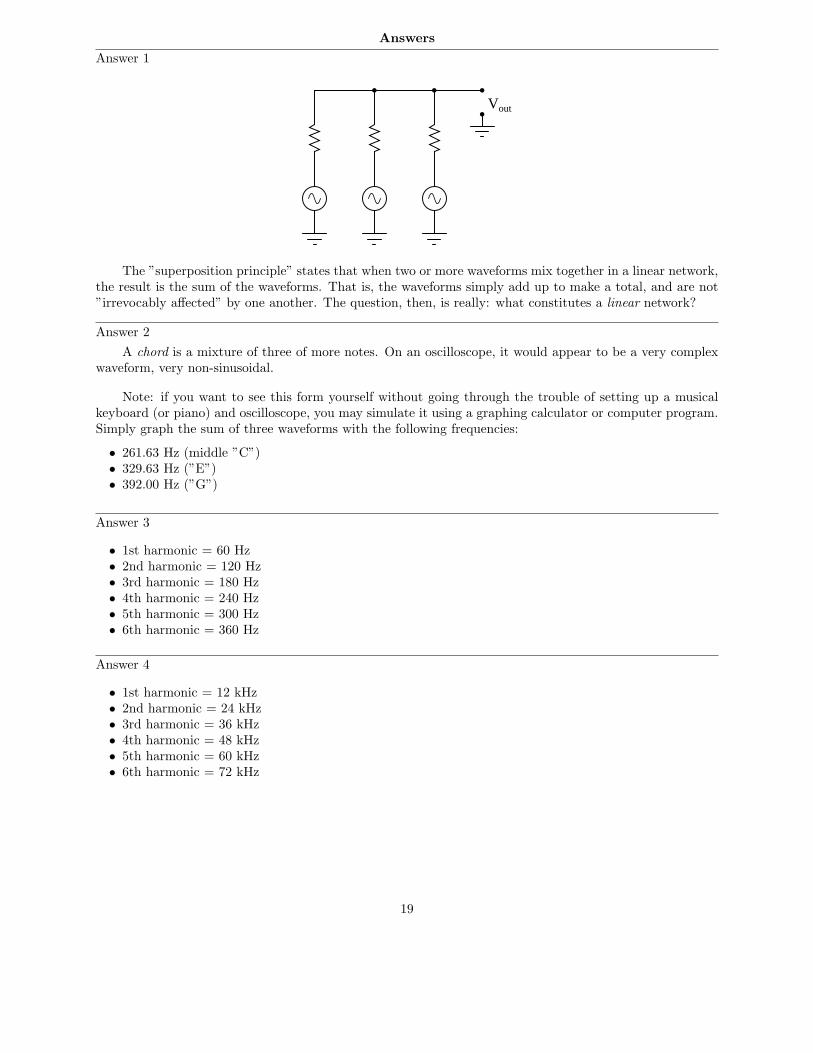
Answer 1
Vout
The ”superposition principle” states that when two or more waveforms mix together in a linear network,the result is the sum of the waveforms. That is, the waveforms simply add up to make a total, and are not”irrevocably affected” by one another. The question, then, is really: what constitutes a linear network?
Answer 2
A chord is a mixture of three of more notes. On an oscilloscope, it would appear to be a very complexwaveform, very non-sinusoidal.
Note: if you want to see this form yourself without going through the trouble of setting up a musicalkeyboard (or piano) and oscilloscope, you may simulate it using a graphing calculator or computer program.Simply graph the sum of three waveforms with the following frequencies:
• 261.63 Hz (middle ”C”)• 329.63 Hz (”E”)• 392.00 Hz (”G”)
Answer 3
• 1st harmonic = 60 Hz• 2nd harmonic = 120 Hz• 3rd harmonic = 180 Hz• 4th harmonic = 240 Hz• 5th harmonic = 300 Hz• 6th harmonic = 360 Hz
Answer 4
• 1st harmonic = 12 kHz• 2nd harmonic = 24 kHz• 3rd harmonic = 36 kHz• 4th harmonic = 48 kHz• 5th harmonic = 60 kHz• 6th harmonic = 72 kHz
19

Answer 5
• 1 octave greater than the fundamental = 2 kHz• 2 octaves greater than the fundamental = 4 kHz• 3 octaves greater than the fundamental = 8 kHz• 4 octaves greater than the fundamental = 16 kHz• 5 octaves greater than the fundamental = 32 kHz• 6 octaves greater than the fundamental = 64 kHz
Answer 6
Though it may seem strange to speak of it in such terms, an AC circuit ”views” a square wave as aninfinite series of sinusoidal harmonics.
Follow-up question: explain how this equivalence between a square wave and a particular series of sinewaves is a practical example of the Superposition Theorem at work.
Answer 7
“Any periodic waveform, no matter how complex, is equivalent to a series of sinusoidalwaveforms added together at different amplitudes and different frequencies, plus a DC component.”
Follow-up question: what does this equation represent?
f(t) = A0 + (A1 sin ωt) + (B1 cos ωt) + (A2 sin 2ωt) + (B2 cos 2ωt) + . . .
Answer 8
200 Hz 600 Hz 1 kHz 1.4 kHz9 V RMS 3 V RMS 1.8 V RMS 1.29 V RMS
≈ vsquare
Answer 9
v(t)
23.2 V21.21 V ∠ 0o
60 Hz 180 Hz 240 Hz10.96 V ∠ 90o 1.909 V ∠ -40o
20

Answer 10
The circuit could be analyzed one harmonic at a time, the results combined via the Superposition
Theorem:
L
RloadV0
L
RloadV1 sin ωt
1st harmonicDC (0th harmonic)
L
Rload
L
RloadV2 V3sin 2ωt sin 3ωt
2nd harmonic 3rd harmonic
L
Rload
L
Rload
4th harmonic
V4 V5
5th harmonic
sin 4ωt sin 5ωt
Answer 11
PR = 400 watts
Answer 12
PR(1st) = 1.541 wattsPR(3rd) = 1.485 wattsPR(5th) = 1.384 wattsPR(7th) = 1.255 wattsPR(1+3+5+7) = 5.665 watts
Answer 13
The LP filter blocks all harmonics of the square wave except the fundamental (1st harmonic), resultingin a sinusoidal output.
21
Answer 14
A spectrum analyzer.
Challenge questions: two similar instruments are the wave analyzer and the Fourier analyzer. Explainhow both these instruments are similar in function to a spectrum analyzer, and also how both differ.
Answer 15
I’ll let you figure out the answer to this question on your own.
Answer 16
The input signal is clean: a single peak at the 1 kHz mark. The amplifier’s output, on the other hand,is a bit distorted (i.e. no longer a perfect sine-wave shape as the input is).
Answer 17
What this pattern means is the power-line voltage waveform is distorted from what should be a perfectsine-wave shape.
Answer 18
A pure sine wave is input to the amplifier under test, and a spectrum analyzer is connected to theamplifier’s output.
Answer 19
Any feature (or fault) of the circuit causing imperfect signal reproduction will necessarily createharmonics, for it will turn a perfectly sinusoidal input signal into a distorted (non-perfect-sinusoidal) signal.
Answer 20
Any feature (or fault) of the amplifier portion of the oscillator circuit causing imperfect signalreproduction will necessarily create harmonics, for it will turn a perfectly sinusoidal input signal (fromthe LC network) into a distorted (non-perfect-sinusoidal) output signal.
Challenge question: Colpitts oscillators tend to produce ”purer” sine-wave outputs than Hartleyoscillators, all other factors being equal. Explain why.
Answer 21
Nonlinear loads.
Answer 22
I’ll answer this question with another question: is the ”B-H” plot for a ferromagnetic material typicallylinear or nonlinear? This is the key to understanding how an electromagnetic device can produce harmonicsfrom a ”pure” sinusoidal power source.
Answer 23
Filter circuits may be employed to block harmonic frequencies from reaching certain sensitivecomponents.
22

Answer 24
Each series LC section is a resonant band-pass filter, tuned to successive harmonics of a 60 Hz sinewave. The selector switch enables a single voltmeter to measure the RMS amplitude of each harmonic.
Follow-up question: calculate the exact inductance values necessary for precise tuning of the five LCfilters, for the first five harmonics of a 60 Hz waveform.
Challenge question: the voltmeter in this circuit would not have to be a true-RMS meter. It couldsimply be an average-responding (RMS-calibrated) voltmeter and it would work the same. Explain why.
Answer 25
”Sidebands” are sinusoidal frequencies just above and just below the carrier frequency, produced as aresult of the modulation process. On a spectrum analyzer, they show up as peaks to either side of the main(carrier) peak. Their quantity, frequencies, and amplitudes are all a function of the data signals modulatingthe carrier.
Answer 26
The differentiator circuit will output a much more distorted waveshape, because differentiation magnifiesharmonics:
d
dt(sin t) = cos t
d
dt(sin 2t) = 2 cos 2t
d
dt(sin 3t) = 3 cos 3t
d
dt(sin 4t) = 4 cos 4t
· · ·
d
dt(sin nt) = n cos nt
Answer 27
The addition of an even harmonic introduces asymmetry about the horizontal axis. The addition of oddharmonics does not.
Challenge question: explain why this is the case, any way you can.
Answer 28
Nonlinear loads are usually (but not always!) symmetrical in their distortion.
Answer 29
The following waveforms contain even-numbered harmonics: B, C, D, F, and I. The rest only containodd harmonics of the fundamental.
23

Answer 30
The following waveforms contain even-numbered harmonics: C, D, G, and I. The rest only contain oddharmonics of the fundamental.
Answer 31
If the signal source is pure (no harmonics), the voltmeter will register nothing (negative infinite decibels)when the switch is flipped to the ”test” position.
24

Notes
Notes 1
It is no coincidence that the ”superposition principle” sounds a lot like the ”superposition theorem”learned as a network analysis technique: consider the effects of all power sources one at a time, and addthose effects together to determine the final result.
The matter of ”irrevocable influence” is important to us because it dictates how difficult it would beto separate the mixed signals from each other. When external noise couples to a circuit through capacitiveor inductive coupling, can we filter out the noise and obtain the true signal again, or has the signal beencorrupted in such a way that restoration is impossible by mere filtering? The key to answering this questionis whether or not the ”network” formed from parasitic capacitive/inductive coupling is linear. Discusswith your students what determines linearity in a math equation, and apply these criteria to the equationsdescribing resistor, capacitor, and inductor behavior.
Notes 2
Students with a musical background (especially piano) should be able to add substantially to thediscussion on this question. The important concept to discuss here is that multiple frequencies of anysignal form (AC voltage, current, sound waves, light waves, etc.) are able to exist simultaneously along thesame signal path without interference.
Notes 3
Ask your students to determine the mathematical relationship between harmonic number, harmonicfrequency, and fundamental frequency. It isn’t difficult to figure out!
Notes 4
Ask your students to determine the mathematical relationship between harmonic number, harmonicfrequency, and fundamental frequency. It isn’t difficult to figure out!
Notes 5
Ask your students if they can determine the mathematical relationship between octave number, octavefrequency, and fundamental frequency. This is a bit more difficult to do than for integer harmonics, but notbeyond reason if students are familiar with exponents.
Clarify for your students the fact that ”octave” is not just a musical term. In electronic circuit analysis(especially filter circuits), the word ”octave” is often used to represent multiples of a given frequency, usuallyin reference to a bandwidth (i.e. ”This filter’s passband response is essentially flat over two octaves!”).
Notes 6
If you have access to a graphing calculator or a computer with graphing software installed, and aprojector capable of showing the resulting graph(s), you may demonstrate this square-wave synthesis infront of the whole class. It makes an excellent illustration of the concept.
Discuss this with your students: that the relatively simple rules of AC circuit analysis (calculatingreactance by ωL and 1
ωC, calculating impedance by the trigonometric sum of reactance and resistance,
etc.) can be applied to the analysis of a square wave’s effects if we repeat that analysis for every harmoniccomponent of the wave.
This is truly a remarkable principle, that the effects of a complex waveform on a circuit may bedetermined by considering each of that waveform’s harmonics separately, then those effects added together(superimposed) just as the harmonics themselves are superimposed to form the complex wave. Explain toyour students how this superposition principle is not limited to the analysis of square waves, either. Any
complex waveform whose harmonic constituents are known may be analyzed in this fashion.
25
Notes 7
So far, all the ”tools” students have learned about reactance, impedance, Ohm’s Law, and such inAC circuits assume sinusoidal waveforms. Being able to equate any non-sinusoidal waveform to a series ofsinusoidal waveforms allows us to apply these ”sinusoidal-only” tools to any waveform, theoretically.
An important caveat of Fourier’s theorem is that the waveform in question must be periodic. That is,it must repeat itself on some fixed period of time. Non-repetitive waveforms do not reduce to a definiteseries of sinusoidal terms. Fortunately for us, a great many waveforms encountered in electronic circuits areperiodic and therefore may be represented by, and analyzed in terms of, definite Fourier series.
It would be good to mention the so-called FFT algorithm in this discussion while you’re on this topic: thedigital algorithm that computers use to separate any sampled waveform into multiple constituent sinusoidalfrequencies. Modern computer hardware is able to easily implement the FFT algorithm, and it finds extensiveuse in analytical and test equipment.
Notes 8
To be honest, the four-harmonic equivalent circuit is a rather poor approximation for a square wave.The real purpose of this question, though, is to have students relate the sinusoidal terms of a common Fourierseries (for a square wave) to a schematic diagram, translating between angular velocity and frequency, peakvalues and RMS values.
Please note that the voltage magnitudes shown in the answer are RMS and not peak! If you were tocalculate peak sinusoid source values, you would obtain these results:
• 1st harmonic: 40π
volts peak = 12.73 volts peak
• 3rd harmonic: 403π
volts peak = 4.244 volts peak
• 5th harmonic: 405π
volts peak = 2.546 volts peak
• 7th harmonic: 407π
volts peak = 1.819 volts peak
Notes 9
The purpose of this question is to have students relate the sinusoidal terms of a particular Fourier seriesto a schematic diagram, translating between angular velocity and frequency, peak values and RMS values.
Notes 10
At first, some students have trouble understanding exactly how Fourier analysis is helpful in any practicalway as an analytical tool. The purpose of this question is to have them see how it might be applied tosomething they are familiar with: an LR circuit.
Notes 11
To calculate this power figure, students have to determine the RMS value of the square wave. Thankfully,this is not difficult.
Notes 12
To calculate this power figure, students have to research the Fourier series for a square wave. Manytextbooks use square waves to introduce the subject of Fourier series, so this should not be difficult forstudents to find.
Ask your students how the real power dissipated by this resistor compares with the final figure of 5.665watts. Is the real power dissipation more, less, or equal to this figure? If not equal, what would we have todo to arrive at a more precise figure?
26
Notes 13
Ask your students what they think about the rolloff requirement for this LP filter. Will any LP filterwork, or do we need something special?
Notes 14
Spectrum analyzers capable of analyzing radio-frequency signals are very expensive, but low-costpersonal computer hardware and software does a good job of analyzing complex audio signals. It wouldbe a benefit to your class to have a low-frequency spectrum analyzer setup available for student use, andpossible demonstration during discussion.
Notes 15
The purpose of this question is to get students to think about how a spectrum analyzer would be usedin a practical scenario, and what the spectrum would look like for a couple of different scenarios. Really, itfocuses more on the harmonic analysis instrument (the spectrum analyzer) more than the oscillator circuit.
Notes 16
The purpose of this question is to get students to realize the presence of harmonics means a departurefrom a once-perfect sinusoidal wave-shape. What used to be free of harmonics now contains harmonics, andthis indicates distortion of the sine wave somewhere within the amplifier.
By the way, the perfectly flat ”noise floor” at -120 dB is highly unusual. There will always be a ”rough”floor shown on the display of a spectrum analyzer, but this is not pertinent to the question at hand so Iomitted it for simplicity’s sake.
Notes 17
Note to your students that this is quite typical for modern power systems, due to the prevalence ofswitching power supply circuits and other ”non-linear” electrical loads. The presence of harmonic frequenciesin significant quantity can cause severe problems for power systems, including transformer overheating,motor overheating, overloaded neutral conductors (especially in three-phase, four-wire ”Wye” systems), andexcessive currents through power-factor correction capacitors.
Notes 18
The answer given is purposefully vague. All I did is describe what gets connected to the amplifier, nothow to interpret the measurements. Ask your students to explain why a pure sine wave is chosen as the testsignal, and what sort of response would be considered ideal to see on the spectrum analyzer.
Notes 19
Discuss with your students the nature of harmonics: how multiple sinusoidal waveforms are necessarilycontained in any periodic waveform that is not perfectly sinusoidal itself.
Notes 20
Discuss with your students the nature of harmonics: how multiple sinusoidal waveforms are necessarilycontained in any periodic waveform that is not perfectly sinusoidal itself.
Notes 21
My answer to this question is intentionally vague. It is correct, but does not reveal anything about thereal nature of the cause, or more importantly, why a ”nonlinear” load would cause harmonics. Discuss withyour students what a ”nonlinear” device is, and what it does to a sinusoidal signal to generate harmonics.
27

Notes 22
Ask your students what it means for an electrical or electronic device to be ”linear.” How many devicesqualify as linear? And of those devices, are they always linear, or are they capable of nonlinear behaviorunder special conditions?
Use the discussion time to review B-H curves for ferromagnetic materials with your students, askingthem to draw the curves and point out where along those curves inductors and transformers normally operate.What conditions, specifically, would make an iron-core device act nonlinearly?
On a similar note, the (slightly) nonlinear nature of ferromagnetic core transformers is known to permitsignals to modulate each other in certain audio amplifier designs, to produce a specific kind of audio signaldistortion known as intermodulation distortion. Normally, modulation is a function possible only in nonlinearsystems, so the fact that modulation occurs in a transformer is proof positive of (at least some degree of)nonlinearity.
Notes 23
The answer given here is correct, but vague. I did not specify the type of filter or exactly how it mightbe connected to a load. These are questions to ask your students during discussion.
Notes 24
This question provides students with some review of passive filter circuit theory, as well as insight intoa practical circuit they could conceivably build as a project.
A very important design feature of this circuit is the narrow bandwidth of each harmonic ”channel.”The filter pass-bands must not come close to overlapping, or else the meter response will not be exclusivelyindicative of the harmonic it is switched to. High Q values for each filter section ensure that the meter willonly register the particular harmonic that is selected for measurement.
Notes 25
Be sure to ask your students what ”AM” and ”FM” mean, before they present their answers onsidebands.
The answer makes frequent use of the word carrier without defining it. This is another intentional”omission” designed to make students do their research. If they have taken the time to find informationon sidebands, they will surely discover what the word ”carrier” means. Ask them to define this word, inaddition to their description of sidebands.
Notes 26
As an interesting footnote, this is precisely why differentiation is rarely performed on real-world signals.Since the frequency of noise often exceeds the frequency of the signal, differentiating a ”noisy” signal willonly lead to a decreased signal-to-noise ratio.
For a practical example of this, tell your students about vibration measurement, where it is more commonto calculate velocity based on time-integration of an acceleration signal than it is to calculate accelerationbased on time-differentiation of a velocity signal.
28

Notes 27
Although the sequence of images presented in the question by no means constitutes a formal proof, itshould lead students to observe a trend: that odd harmonics do not make a waveform unsymmetrical aboutthe horizontal axis, whereas even harmonics do. Given these two facts, we may make qualitative judgmentsabout the harmonic content of a waveform simply by visually checking for symmetry about the horizontalaxis.
Incidentally, some students have a difficult time grasping the concept of symmetry about the horizontalaxis of a waveform. Take this simple example, which is symmetrical about its horizontal centerline:
(Flipping waveform about the axis)
Some students will protest that this waveform is not symmetrical about its centerline, because it doesnot look exactly the same as before after flipping. They must bear in mind, though, that this is just onecycle of a continuous waveform. In reality, the waveform looks like this before and after flipping:
(Flipping waveform about the axis)
All one needs to do to see that these two waveforms are indeed identical is to do a 180 degree phaseshift (shifting either to the left or to the right):
(After the phase shift)
By contrast, a waveform without symmetry about the horizontal axis cannot be made to look the sameafter flipping, no matter what subsequent phase shift is given to it:
29
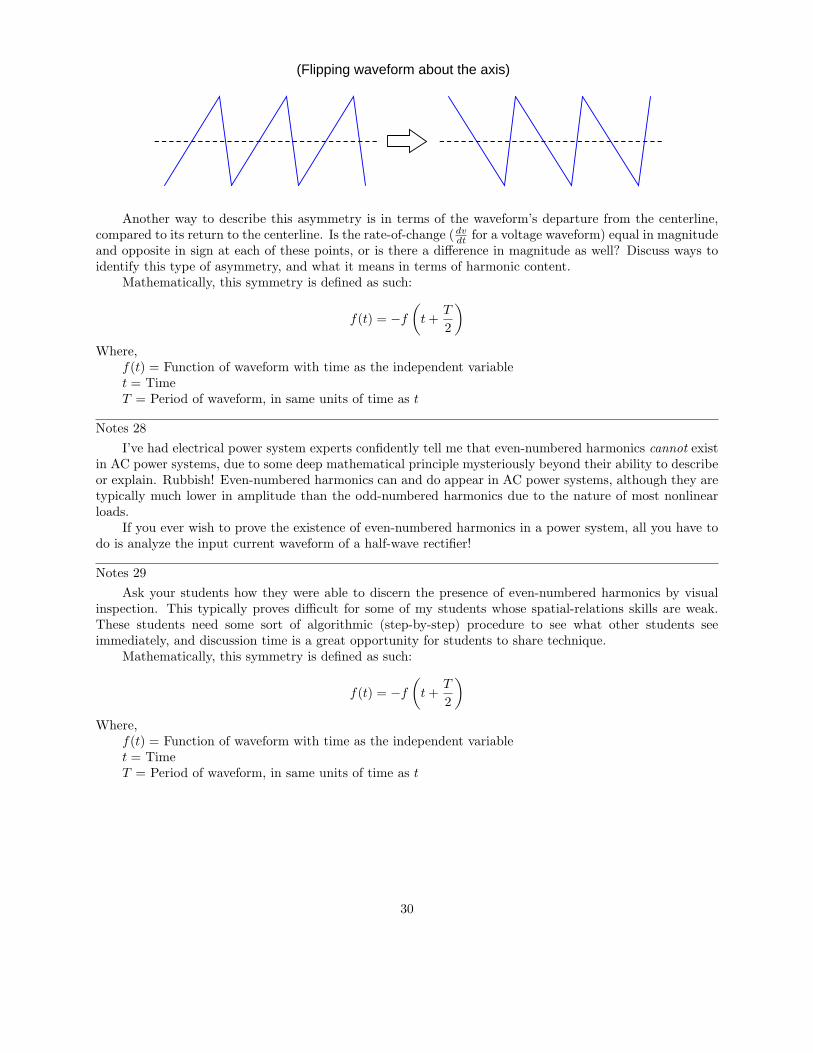
(Flipping waveform about the axis)
Another way to describe this asymmetry is in terms of the waveform’s departure from the centerline,compared to its return to the centerline. Is the rate-of-change (dv
dtfor a voltage waveform) equal in magnitude
and opposite in sign at each of these points, or is there a difference in magnitude as well? Discuss ways toidentify this type of asymmetry, and what it means in terms of harmonic content.
Mathematically, this symmetry is defined as such:
f(t) = −f
(
t +T
2
)
Where,f(t) = Function of waveform with time as the independent variablet = TimeT = Period of waveform, in same units of time as t
Notes 28
I’ve had electrical power system experts confidently tell me that even-numbered harmonics cannot existin AC power systems, due to some deep mathematical principle mysteriously beyond their ability to describeor explain. Rubbish! Even-numbered harmonics can and do appear in AC power systems, although they aretypically much lower in amplitude than the odd-numbered harmonics due to the nature of most nonlinearloads.
If you ever wish to prove the existence of even-numbered harmonics in a power system, all you have todo is analyze the input current waveform of a half-wave rectifier!
Notes 29
Ask your students how they were able to discern the presence of even-numbered harmonics by visualinspection. This typically proves difficult for some of my students whose spatial-relations skills are weak.These students need some sort of algorithmic (step-by-step) procedure to see what other students seeimmediately, and discussion time is a great opportunity for students to share technique.
Mathematically, this symmetry is defined as such:
f(t) = −f
(
t +T
2
)
Where,f(t) = Function of waveform with time as the independent variablet = TimeT = Period of waveform, in same units of time as t
30

Notes 30
Ask your students how they were able to discern the presence of even-numbered harmonics by visualinspection. This typically proves difficult for some of my students whose spatial-relations skills are weak.These students need some sort of algorithmic (step-by-step) procedure to see what other students seeimmediately, and discussion time is a great opportunity for students to share technique.
Mathematically, this symmetry is defined as such:
f(t) = −f
(
t +T
2
)
Where,f(t) = Function of waveform with time as the independent variablet = TimeT = Period of waveform, in same units of time as t
Notes 31
This test circuit relies on the assumption that the notch filter is perfect (i.e. that its attenuation in thestop-band is complete). Since no filter is perfect, it would be a good idea to ask your students what effectthey think an imperfect notch filter would have on the validity of the test. In other words, what will a notchfilter that lets a little bit of the fundamental frequency through do to the ”test” measurement?
31