mitogenomic meta-analysis identifies two phases of
TRANSCRIPT

Article
FastT
rackMitogenomic Meta-Analysis Identifies Two Phases of Migrationin the History of Eastern Eurasian SheepFeng-Hua Lv,y,1 Wei-Feng Peng,y,1,2 Ji Yang,y,1 Yong-Xin Zhao,1,2 Wen-Rong Li,3 Ming-Jun Liu,3
Yue-Hui Ma,4 Qian-Jun Zhao,4 Guang-Li Yang,1,5 Feng Wang,6 Jin-Quan Li,7 Yong-Gang Liu,8
Zhi-Qiang Shen,9 Sheng-Guo Zhao,10 EEr Hehua,11 Neena A. Gorkhali,4,12 S. M. Farhad Vahidi,13
Muhammad Muladno,14 Arifa N. Naqvi,15 Jonna Tabell,16 Terhi Iso-Touru,16 Michael W. Bruford,17
Juha Kantanen,16,18 Jian-Lin Han,*,4,19 Meng-Hua Li*,1
1CAS Key Laboratory of Animal Ecology and Conservation Biology, Institute of Zoology, Chinese Academy of Sciences (CAS),Beijing, China2University of Chinese Academy of Sciences (UCAS), Beijing, China3Animal Biotechnology Research Institute, Xinjiang Academy of Animal Science, Urumqi, China4CAAS-ILRI Joint Laboratory on Livestock and Forage Genetic Resources, Institute of Animal Science, Chinese Academy ofAgricultural Sciences (CAAS), Beijing, China5College of Life Sciences, Shangqiu Normal University, Shangqiu, China6Institute of Sheep and Goat Science, Nanjing Agricultural University, Nanjing, China7College of Animal Science, Inner Mongolia Agricultural University, Hohhot, China8College of Animal Science and Technology, Yunnan Agricultural University, Kunming, China9Shandong Binzhou Academy of Animal Science and Veterinary Medicine, Binzhou, China10College of Animal Science and Technology, Gansu Agricultural University, Lanzhou, China11Grass-Feeding Livestock Engineering Technology Research Center, Ningxia Academy of Agriculture and Forestry Sciences,Yinchuan, China12Animal Breeding Division, National Animal Science Institute, Nepal Agriculture Research Council, Kathmandu, Nepal13Agricultural Biotechnology Research Institute of Iran-North Branch (ABRII), Rasht, Iran14Department of Animal Technology and Production Science, Bogor Agricultural University, Darmaga Campus, Bogor, Indonesia15Faculty of Life Sciences, Karakoram International University, Gilgit, Baltistan, Pakistan16Green Technology, Natural Resources Institute Finland (LUKE), Jokioinen, Finland17School of Biosciences and Sustainable Places Research Institute, Cardiff University, Cardiff, United Kingdom18Department of Biology, University of Eastern Finland, Kuopio, Finland19International Livestock Research Institute (ILRI), Nairobi, KenyayThese authors contributed equally to this work.
*Corresponding author: E-mail: [email protected]; [email protected].
Associate editor: David Irwin
Abstract
Despite much attention, history of sheep (Ovis aries) evolution, including its dating, demographic trajectory andgeographic spread, remains controversial. To address these questions, we generated 45 complete and 875 partialmitogenomic sequences, and performed a meta-analysis of these and published ovine mitochondrial DNA se-quences (n = 3,229) across Eurasia. We inferred that O. orientalis and O. musimon share the most recent femaleancestor with O. aries at approximately 0.790 Ma (95% CI: 0.637–0.934 Ma) during the Middle Pleistocene, sub-stantially predating the domestication event (~8–11 ka). By reconstructing historical variations in effectivepopulation size, we found evidence of a rapid population increase approximately 20–60 ka, immediately beforethe Last Glacial Maximum. Analyses of lineage expansions showed two sheep migratory waves at approximately4.5–6.8 ka (lineages A and B: ~6.4–6.8 ka; C: ~4.5 ka) across eastern Eurasia, which could have been influenced byprehistoric West–East commercial trade and deliberate mating of domestic and wild sheep, respectively. A con-tinent-scale examination of lineage diversity and approximate Bayesian computation analyses indicated that theMongolian Plateau region was a secondary center of dispersal, acting as a “transportation hub” in eastern Eurasia:Sheep from the Middle Eastern domestication center were inferred to have migrated through the Caucasus andCentral Asia, and arrived in North and Southwest China (lineages A, B, and C) and the Indian subcontinent
� The Author 2015. Published by Oxford University Press on behalf of the Society for Molecular Biology and Evolution.This is an Open Access article distributed under the terms of the Creative Commons Attribution Non-Commercial License(http://creativecommons.org/licenses/by-nc/4.0/), which permits non-commercial re-use, distribution, and reproduction in anymedium, provided the original work is properly cited. For commercial re-use, please contact [email protected] Open AccessMol. Biol. Evol. 32(10):2515–2533 doi:10.1093/molbev/msv139 Advance Access publication June 16, 2015 2515
at Acquisitions on M
arch 14, 2016http://m
be.oxfordjournals.org/D
ownloaded from
(lineages B and C) through this region. Our results provide new insights into sheep domestication, particularlywith respect to origins and migrations to and from eastern Eurasia.
Key words: wild ancestor, domestication, gene flow, mitogenome, Ovis aries, meta-analysis, colonization simulation.
IntroductionAs one of the first animals ever domesticated, sheep (Ovisaries) have played an important role in human society andhave spread almost globally, following human migrations(Colledge et al. 2005; Chessa et al. 2009). Early evidence impliedthat modern sheep breeds were first domesticated from Asianmouflon (O. orientalis) in the Fertile Crescent approximately8–11 thousand years ago (ka) (Ryder 1984). Following domes-tication, as many as 1,400 sheep breeds have been developedfrom their wild ancestors after long-term natural and intenseartificial selection (Scherf 2000). During this process, humanactivities have played a significant role in determining thepatterns of gene flow among breeds and populations (e.g.,Warmuth et al. 2012). Thus, an examination of continent-wide genetic variability among modern native sheep breedscan provide a comprehensive, in-depth understanding of theirgenetic origins and dispersal, as well as insight into the impactof human activities on sheep throughout history.
In recent decades, remarkable analytical advances in pale-ontological and molecular genetics have transformed our un-derstanding of the origins and regional expansion of domesticsheep (Poplin 1979; Hiendleder, Mainz, et al. 1998; Pedrosaet al. 2005; Chessa et al. 2009; Meadows et al. 2007, 2011; Kijaset al. 2009, 2012; Demirci et al. 2013). Morphological changeand demographic analysis implied that sheep were likelybrought under domestication in a region that stretchesfrom northern Zagros to southeastern Anatolia, approxi-mately 10.5–11 ka or perhaps even earlier (Peters et al.2005). In addition, a recent investigation on endogenous re-troviral sequences revealed a remarkable secondary popula-tion expansion of improved domestic sheep, most likely outof Southwest Asia (i.e., the Middle East; Chessa et al. 2009).Mitochondrial DNA (mtDNA) sequence analyses have iden-tified a general phenomenon of multiple maternal lineages(i.e., A, B, C, D, and E), some with specific geographic ranges,implying multiple maternal origins and possibly independentdomestication events in sheep (Wood and Phua 1996;Hiendleder, Mainz, et al. 1998; Guo et al. 2005; Pedrosaet al. 2005; Tapio et al. 2006; Meadows et al. 2007; Singhet al. 2013).
Estimates from complete and/or partial mtDNA sequenceshave enabled various divergence time estimates between do-mestic and wild sheep as well as among the five major ma-ternal lineages of O. aries (e.g., Hiendleder, Mainz, et al. 1998;Pedrosa et al. 2005; Chen et al. 2006; Meadows et al. 2011). Ingeneral, the estimated divergence times among the five majorlineages have been much earlier than the domesticationperiod inferred from archeological evidence (Bar-Yosef andMeadow 1995; Zeder 2008). For example, the divergence timebetween the two most common lineages (i.e., A and B) wasestimated to be as early as 1.6–1.7 Ma based on cytochrome b(Cyt-b) sequences (Hiendleder, Mainz, et al. 1998). In addition,
Pedrosa et al. (2005) and Chen et al. (2006) suggested thedivergence time of lineage C from lineages A and B to beapproximately 0.42–0.76 Ma and approximately 0.45–0.75 Mafrom the analysis of control region and Cyt-b sequences, re-spectively. However, a more recent study (Meadows et al.2011) using 12 protein-coding genes from complete mitoge-nomes implied more recent divergence between the lineages:For example, 0.590� 0.17 Ma between A and B and0.26� 0.09 Ma between C and E.
So far, most ovine mtDNA investigations have only fo-cused on one or two segments within Cyt-b gene and thecontrol region (including the hypervariable region; e.g.,Pedrosa et al. 2005); nevertheless, high levels of recurrentmutations observed in the short segment within controlregion in many mammal species may bias dating estimates(e.g., Achilli et al. 2009, 2012; see also the reviews in Torroniet al. 2006; Taberlet et al. 2008). Moreover, previous sheepmtDNA studies have merely included breeds at a regional(e.g., Pedrosa et al. 2005; Chen et al. 2006; Wang et al. 2006;Meadows et al. 2007) or subcontinental scale (e.g., Tapio et al.2006), whereas maternal lineages of domestic sheep, particu-larly for breeds in Southwest, Central, East and South Asia,including the Caucasus, Iran, Pakistan, Nepal, Indonesia,Mongolia, China, and India, have been largely excludedfrom integrated analyses. In addition, the divergence scenarioshave not been fully evaluated based on complete mitogen-omes either, which could have provided refined phylogeniesof maternal lineages and robust estimations of genetic vari-ability and divergence time in domestic animals (see thereview in Wang et al. 2014). Therefore, although these earlymtDNA studies have provided useful insights into the historyof sheep domestication in Eurasia, answers to some basicquestions surrounding the domestication process are farfrom being settled. For example, phylogenetic relationshipsamong wild and domestic sheep (e.g., Hiendleder, Lewalski,et al. 1998; Meadows et al. 2007), divergence times betweenthe major maternal lineages (e.g., Pedrosa et al. 2005; Zeder2008; Meadows et al. 2011), demographic history and popu-lation recolonization (Dobney and Larson 2006; Zeder 2008),and origins of different mtDNA lineages (Tapio et al. 2006;Meadows et al. 2007; Demirci et al. 2013; Singh et al. 2013), aswell as the continent-wide patterns of gene flow from thepostulated Middle Eastern domestication center to Central,East and South Asia (see, e.g., Tapio et al. 2006, 2010; Cai et al.2007, 2011) remain provisional or unaddressed.
The main objective of our study was to better understandthe domestication and expansion of O. aries across Eurasiathrough a meta-analysis of complete and partial ovine mito-genomic sequences. More specifically, we aimed to refine andchallenge existing paradigms on the wild origin, lineage diver-gence, demographic history and population recolonization ofmodern sheep, particularly the breeds present in easternEurasia. For these purposes, we sequenced the complete
2516
Lv et al. . doi:10.1093/molbev/msv139 MBE at A
cquisitions on March 14, 2016
http://mbe.oxfordjournals.org/
Dow
nloaded from

mitogenomes of 45 individuals (including O. orientalis, O.vignei, and 42 native breeds of O. aries) and the controlregion of a total of 875 animals (including 51 native breeds)from eastern Eurasia (fig. 1 and supplementary tables S1 andS2, Supplementary Material online). Together with the se-quences retrieved from GenBank, we analyzed 85 completemitogenomes of domestic sheep including each of the 5lineages and 10 complete mitogenomes of O. orientalis, O.musimon, O. vignei, O. ammon, and O. canadensis using phy-logenetics, molecular-dating, and demographic-reconstruc-tion approaches. Full control region and Cyt-b sequences ofseven extant wild sheep species (O. orientalis, O. musimon, O.vignei, O. ammon, O. canadensis, O. dalli, and O. nivicola) werealso included in phylogenetic reconstructions. Furthermore,we carried out a meta-analysis and a simulation of coloniza-tion (e.g., approximate Bayesian computation, ABC) ofmtDNA sequences, including 547 partial Cyt-b and 1,470
partial control region sequences published previously (sup-plementary tables S2 and S3, Supplementary Material online),from native sheep breeds across Eurasia. We tried to addressthese questions and test two hypotheses on domesticationand migrations of sheep distributed particularly in easternEurasia. One is the more recent origin and dispersal of lineageC when compared with those of the two widely distributedlineages A and B (Bruford 2005; Tapio et al. 2006). Another isthat the arrival of some Indian sheep from the Middle Easterndomestication center could be through the MongolianPlateau region, where archeological remains showed anearly presence of domestic sheep in ancient history (e.g.,Kuo et al. 1999; see also Yang et al. 2015). Our results couldhelp researchers better understand the demographic forcesand human practice associated with animal domesticationand migration in history (e.g., Hodges 1999; Larson et al.2007, 2010; Larson and Burger 2013).
FIG. 1. Geographic distribution of the samples in this and early ovine mtDNA studies.
2517
Ovine Mitogenomic Variations across Eastern Eurasia . doi:10.1093/molbev/msv139 MBE at A
cquisitions on March 14, 2016
http://mbe.oxfordjournals.org/
Dow
nloaded from

Results
Geographic Patterns of mtDNA Variation
The 45 complete domestic (GenBank accession numbersKF938317–KF938359) and wild (KF938360–KF938361)sheep mitogenomes (supplementary table S1,Supplementary Material online) sequenced in this studyshowed considerable sequence variability as well as variationin diversity among different regions (supplementary table S4and fig. S1, Supplementary Material online). Also, we detecteda large number of variable sites in the integrated data of
partial Cyt-b and control region (supplementary tables S2and S3, Supplementary Material online). Full description of thecomplete mitogenome and partial mtDNA sequence varia-tions is in supplementary information S1, SupplementaryMaterial online.
All control region and Cyt-b sequences analyzed in thisstudy can be assigned to the five previously defined lineages(supplementary tables S2 and S3; see also supplementary figs.S2 and S3, Supplementary Material online). The two partialmtDNA fragments displayed similar geographic patterns(fig. 2B and C). For control region sequences, lineages A and
FIG. 2. Geographic distribution of the five major maternal lineages across Eurasia based on sequences obtained in this study and retrieved fromGenBank. (A) Phylogenetic tree inferred from partial control region sequences (left) and lineage composition of sheep in different geographic regions atdifferent time points (right) based on ancient specimens (Cai et al. 2007, 2011; Demirci et al. 2013; Niemi et al. 2013); (B) lineage frequency distribution ofpartial control region sequences; previously reported lineage frequencies in 12 regions (I–XII) are detailed in supplementary table S17, SupplementaryMaterial online; (C) lineage frequency distribution of partial Cyt-b sequences; (D) geographic distribution of fat-tailed native sheep breeds (regions withblack lines) and lineage C (region colored in purple). Pie plots show the proportions of the five distinct lineages (A–E) of domestic sheep in the differentgeographic regions (for the details of the geographic regions, see supplementary tables S5 and S6, Supplementary Material online). In the phylogenetictree, diagnostic mutations are showed on the branches and are named according to their nucleotide positions relative to the reference sequenceAF010406; amino acid replacements are underlined and synonymous replacements are marked in black. Control region mutations (15,437–16,616 bp)are shown in blue. Insertions are indicated by a “+” after the position number and followed by the type of inserted nucleotide(s). Mutations with prefix“�” indicate identical variable sites found in Meadows et al. (2007), which are used to define the five major lineages.
2518
Lv et al. . doi:10.1093/molbev/msv139 MBE at A
cquisitions on March 14, 2016
http://mbe.oxfordjournals.org/
Dow
nloaded from
B were the most common and most widely distributed, with amean combined frequency of approximately 89% (fig. 2B andC). Lineage A was extremely frequent (~77%) in the Indiansubcontinent, although its frequency was less than 10% inEurope. In contrast, lineage B was found mostly in Europe,with its highest frequency (4 90%) in Southwest Europe(fig. 2B and C). Lineage C occurred mainly in the MiddleEast, the Caspian Sea region, North China, and theMongolian Plateau, with a mean frequency of approximately18% (fig. 2B), whereas a few haplotypes of lineage C were alsofound in the Iberian Peninsula, India, Nepal, and SouthwestChina. A majority of the breeds harboring lineage C were fat-tailed (including fat-rump; 73.1%), higher than the proportionof fat-tailed breeds having lineage A (50.8%) or B (44.8%)(supplementary tables S5 and S6, Supplementary Materialonline). In addition, we found a significantly higher meanfrequency of lineage C in fat-tailed breeds than in short-tailed breeds (fat-tailed: fC = 0–0.50, mean fC = 0.19; short-tailed: fC = 0–0.40, mean fC = 0.05; two-sample Kolmogorov–Smirnov test: P< 0.01; supplementary fig. S4, SupplementaryMaterial online). Of the total 149 breeds studied here, 66 arefat-tailed, 78 harbor lineage C, and 57 are fat-tailed sheepcarrying lineage C. Compared with the overlap expected bychance, there is a large and significant excess of breeds thatare fat-tailed harboring linages C (lineage C: observed n = 57,expected by chance n = 34.65, P< 0.001; supplementary fig.S5; Supplementary Material online). Lineages D and E ac-counted for approximately 1% of the total samples andwere only found in the Middle East (see fig. 2B and C).
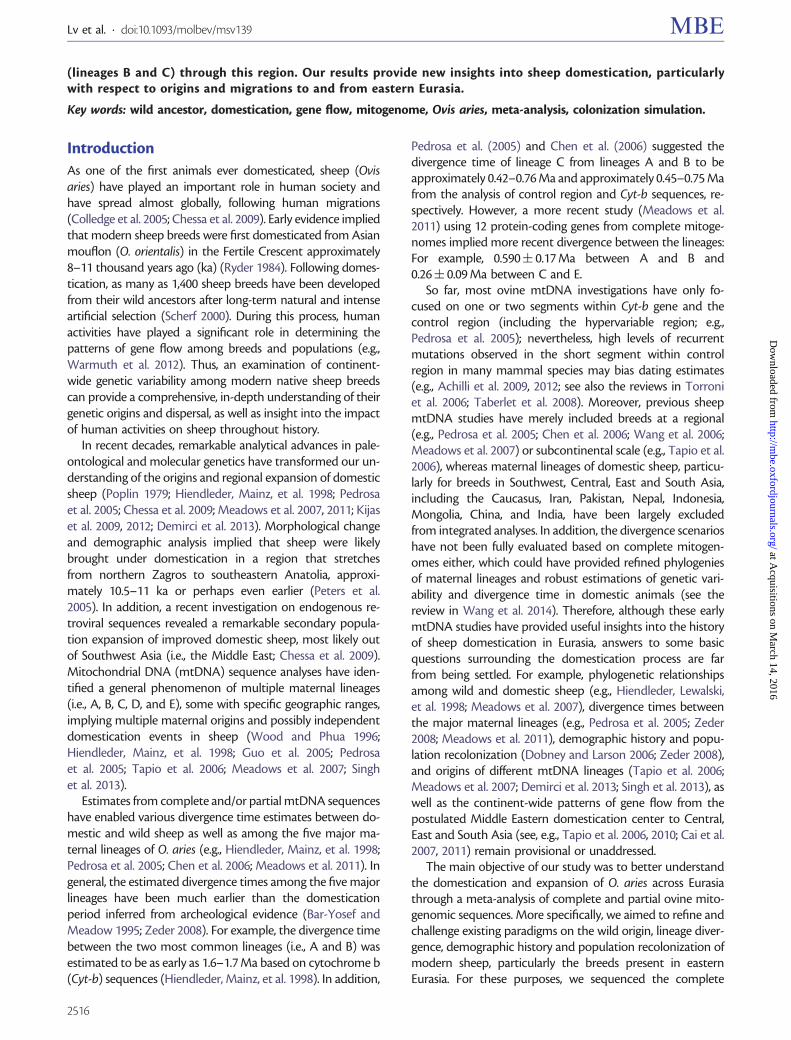
A synthetic map across Eurasia showed that the breeds inthe Mongolian Plateau region had the highest genetic vari-ability (�) of control region in Asia (fig. 3A; supplementarytable S7, Supplementary Material online). For lineages A andB, a relatively high level of nucleotide diversity was found inthe Indian subcontinent (fig. 3B and C). In addition, the syn-thetic map revealed the highest level of lineage C variability inthe breeds of North China, even higher than that of thebreeds in the Middle East (fig. 3D), the presumed domestica-tion center of modern sheep (Ryder 1984).
Phylogenetic Relationships
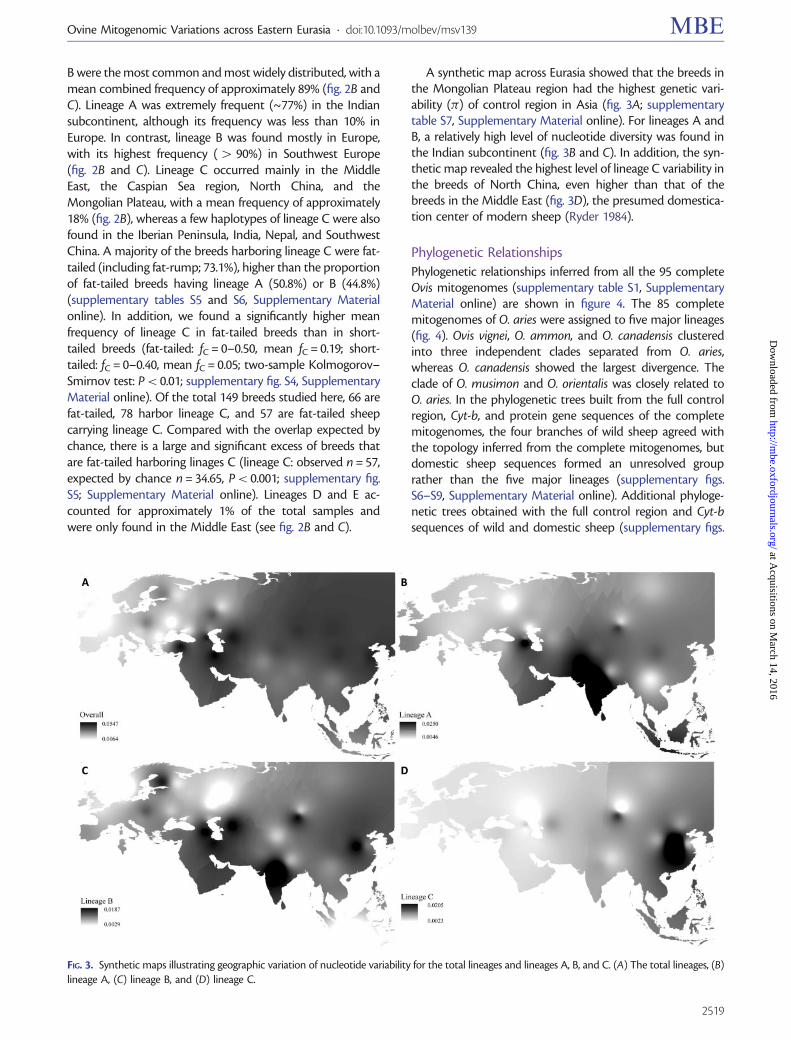
Phylogenetic relationships inferred from all the 95 completeOvis mitogenomes (supplementary table S1, SupplementaryMaterial online) are shown in figure 4. The 85 completemitogenomes of O. aries were assigned to five major lineages(fig. 4). Ovis vignei, O. ammon, and O. canadensis clusteredinto three independent clades separated from O. aries,whereas O. canadensis showed the largest divergence. Theclade of O. musimon and O. orientalis was closely related toO. aries. In the phylogenetic trees built from the full controlregion, Cyt-b, and protein gene sequences of the completemitogenomes, the four branches of wild sheep agreed withthe topology inferred from the complete mitogenomes, butdomestic sheep sequences formed an unresolved grouprather than the five major lineages (supplementary figs.S6–S9, Supplementary Material online). Additional phyloge-netic trees obtained with the full control region and Cyt-bsequences of wild and domestic sheep (supplementary figs.
FIG. 3. Synthetic maps illustrating geographic variation of nucleotide variability for the total lineages and lineages A, B, and C. (A) The total lineages, (B)lineage A, (C) lineage B, and (D) lineage C.
2519
Ovine Mitogenomic Variations across Eastern Eurasia . doi:10.1093/molbev/msv139 MBE at A
cquisitions on March 14, 2016
http://mbe.oxfordjournals.org/
Dow
nloaded from
S10 and S11 and tables S8 and S9, Supplementary Materialonline) showed different topologies from that inferred fromthe complete mitogenomes (fig. 4 and supplementary fig. S6,Supplementary Material online). Specifically, instead of
showing close relationships only to lineage B as inferredfrom the complete mitogenomes (fig. 4), the haplotypes ofO. musimon and O. orientalis clustered with lineages A, B, andC of O. aries control region sequences (supplementary fig. S10,
AF010406KF938353EF490452EF490456KF938341KF938346KF938358KF977845HM236176-HM236177KF302461KF302462KF302460KF302447KF302448KF938340KF938351KF302452KF302453KF977846EF490451KF938355-KF938356KF938350KF938347KF938352KF938348KF938357EF490455KF302450-KF302451KF302449KF302454KF302455KF302456-KF302457KF302458KF302459KF938354KF938343KF938344EF490453EF490454KF938360HM236184HM236185KF938328KF938329KF938339KF938349KF938359KF938333KF938335KF938325KF938334KF938321KF938324KF938322KF938323KF938319KF938317KF938337KF938326KF938345KF977847KF302440-KF302444KF302445KF302446KF938330HM236175KF938332KF938336KF938338KF938342KF938331HM236174HM236180HM236181KF938320KF938318KF938327HM236178HM236179HM236182HM236183HM236186HM236187HM236189KF938361HM236188JX101654JN181255
\\
\\
\\
0.52(0.346-0.694)
0.69(0.494-0.887)
0.80(0.583- 1.018)
0.31(0.200-0.418)
2.60
2.93(2.453-3.413)
8.31(6.182-10.436)
BA
DE
C
A’B
AB’D
C’E
AB
D’C
E
A1
7777
VIVIVIIIIII PLEISTOCENEPLIOCENE
NEOGENE QUATERNARYI: The late MIOCENE; II: ZANCLEAN; III: PIACENZIAN; IV: GELASIAN; V: CALABRIAN; VI: IONIAN
1.00100
1.0073
1.00100
1.00100
1.0077
1.0097
ABCDEOvis orientalisOvis
Ovis ammon
musimonOvis vignei
Ovis canadensisOvis ammonOvis vigi ngg ei
Ovis canadedd n
O i i i
n
A2
A1a
A1b
B2
B1b
B1
B1a
B1a1
B1a2
B1a3
B1a4
B1a5
B1a6
B1a7
B1a8
B1a9
B1a10
B1a1
2
B1a11
FIG. 4. Phylogeny of domestic and wild sheep inferred from a total of 95 complete mitogenomes (supplementary table S1, Supplementary Materialonline) using BI and ML methods with posterior probability (the first value) and bootstrap values (the second value) on the nodes, respectively.Divergence times for the lineages (Ma) were estimated only based on the 61 complete mitogenomes of native domestic sheep breeds and wild sheepspecies (see supplementary table S1, Supplementary Material online).
2520
Lv et al. . doi:10.1093/molbev/msv139 MBE at A
cquisitions on March 14, 2016
http://mbe.oxfordjournals.org/
Dow
nloaded from

Supplementary Material online), and they even shared someCyt-b haplotypes of lineages A, B, C, and E (supplementary fig.S11, Supplementary Material online).
The reduced median network analysis of partial controlregion sequences showed several major radiating nodes at afew mutation steps within lineages A and B. Different contri-butions of breeds to different regions were evident, but noneof the major nodes consisted of apparent region-specific hap-lotypes (supplementary fig. S2, Supplementary Materialonline). In addition, analysis of molecular variance and pair-wise-population FST values indicated genetic differentiationbetween European and Asian breeds, whereas considerablematernal gene flow was found among the breeds within Asiaand Europe, respectively (supplementary figs. S12–S13 andtables S10 and S11, Supplementary Material online).
Selective Pressure on Different Lineages
The log-likelihood values (ln L) under the one-, two-, three-and four-ratio models were ln L =�18,462.81, �18,454.79,�18,419.46 and �18,413.27, respectively (table 1). The !ratio differed between the branches under the same modeland varied for the same branches under different models(table 1). The likelihood ratio tests (LRTs) revealed that thedifferences between two models for all the pairwisecomparisons were significant (P< 0.01) and that the four-ratio model (free-ratio model) best fit the data, whichindicated different ! ratios among the lineages. Mean !values for the lineages were !A = 0.0457, !B = 0.0775,!D = 0.0494, and !C + E = 0.0496 (supplementary fig. S14,Supplementary Material online); note that these values areall much lower than 1. This observation indicates that thematernal lineages (A, B, D, and C + E) have been under strongbut variable intensity of purifying selection: Purifying selectionon amino acid changes in lineage B has been slightly weakerthan that on the other lineages. Thus, divergence time esti-mation (see below) based on the protein-coding genes wouldbe biased. Instead, using the synonymous sites might be abetter choice for divergence time estimation.
Divergence Times for the Nodes
The estimated divergence times within the comprehen-sive evolutionary framework of the Cetartiodactyla areshown in supplementary figure S15, SupplementaryMaterial online. The O. vignei/O. aries split, which is thecalibration point applied to estimate the divergence timesbetween extant O. aries lineages, was 2.6 � 0.9 Ma. Thattime is far earlier than the most recent common ancestor(TMRCA) of domestic sheep (~0.79 Ma; 95% CI: 0.64–0.93 Ma; table 2), and even older than the O. ammon/O.aries split (2.13 � 0.29 Ma) estimated by Meadows et al.(2011). The Capra/Ovis split was estimated to be14.7� 2.1 Ma (supplementary fig. S15, SupplementaryMaterial online), and is much older than the date basedon the ungulate fossil record (~5.00–7.0 Ma; Luikart et al.2001). Using the calibration point, we obtained a substi-tution rate of 0.70� 10�8 substitutions per nucleotide/year for complete mitogenome, 3.12� 10�8 substitutionsper nucleotide/year for control region, and 0.49� 10�8
per nucleotide/year for Cyt-b without partitions.The divergence times for each node were mostly concor-
dant under global and local clock models when estimatedfrom the complete mitogenomes, the synonymous muta-tions or the third-codon positions (table 2). The earliestsplit was estimated to be approximately 0.73–0.93 Ma forthe divergence of C and E from A, B, and D (see the node 4in table 2), whereas the most recent split was between line-ages C and E at approximately 0.29–0.36 Ma (see the node 1in table 2), greatly predating sheep domestication (~8–11 ka;Ryder 1984). The time to TMRCA of the two most commonlineages (A and B) was estimated to be approximately 0.50–0.53 Ma (see node 2 in table 2). Under the relaxed molecularclock, we also obtained similar estimates of divergence timesfor the nodes based on different data sets (i.e., completemitogenomes, synonymous, and third-codon positions; seetable 2). However, divergence times for nodes 2, 3, and 4estimated from synonymous mutations by the BayesianInference (BI) approach were significantly (P< 0.05) higherthan those by the global and local maximum likelihood (ML)
Table 1. Number of Parameters Fitted, dN/dS Ratios, Log-Likelihood Scores, and Their Differences under Different Models.
Model p ln L x Models Compared 2�ln L
A: One x ratio x0 102 �18,462.81 x0 = 0.0563
B: Two x ratios xB 103 �18,454.79 xB = 0.0702x0 x0 = 0.0436 A versus B 16.04**
C: Three x ratios xA 104 �18,419.46 xA = 0.0447 A versus C 86.70**xB xB = 0.0744 A versus D 99.08**x0 x0 = 0.0486 B versus C 70.66**
D: Four x ratios xA 105 �18,413.27 xA = 0.0457 B versus D 83.04**xB xB = 0.0775 C versus D 12.38**xD xD = 0.0494x0 x0 = 0.0496
NOTE.—p, number of parameters in the model; ln L, log-likelihood score; !, the dN/dS ratio for the branches; !A, !B, and !D are the dN/dS ratios for branches lineages A, B, andD, respectively (see supplementary fig. S14, Supplementary Material online); !0 is the background dN/dS ratio for the rest branch(es); 2�ln L, twice the log-likelihood difference ofthe models compared.
**Very significant (P< 0.01).
2521
Ovine Mitogenomic Variations across Eastern Eurasia . doi:10.1093/molbev/msv139 MBE at A
cquisitions on March 14, 2016
http://mbe.oxfordjournals.org/
Dow
nloaded from

approaches, respectively (supplementary fig. S16,Supplementary Material online).
Prehistoric Population Expansions
Bayesian skyline plot (BSP) reconstructions of historical po-pulation expansions using the complete mitogenomes re-vealed the profile of predomestic change in Ne over largetime scales. Based on the estimated TMRCA for the lineages(~0.79 Ma) from complete mitogenomes, the ovine lineagesshowed a steep increase in Ne at approximately 20–60 ka(supplementary fig. S17, Supplementary Material online). Aprehistoric steep increase in Ne was also identified in thesimulations of the partial Cyt-b and control region sequences(supplementary fig. S18, Supplementary Material online).However, population growth was found to have occurredat approximately 50–300 ka, much earlier than the time ob-tained from simulations of the complete mitogenomes (~20–60 ka; supplementary fig. S17, Supplementary Materialonline).
Postdomestic Lineage Expansions
A synthetic map constructed with the use of interpolated �1
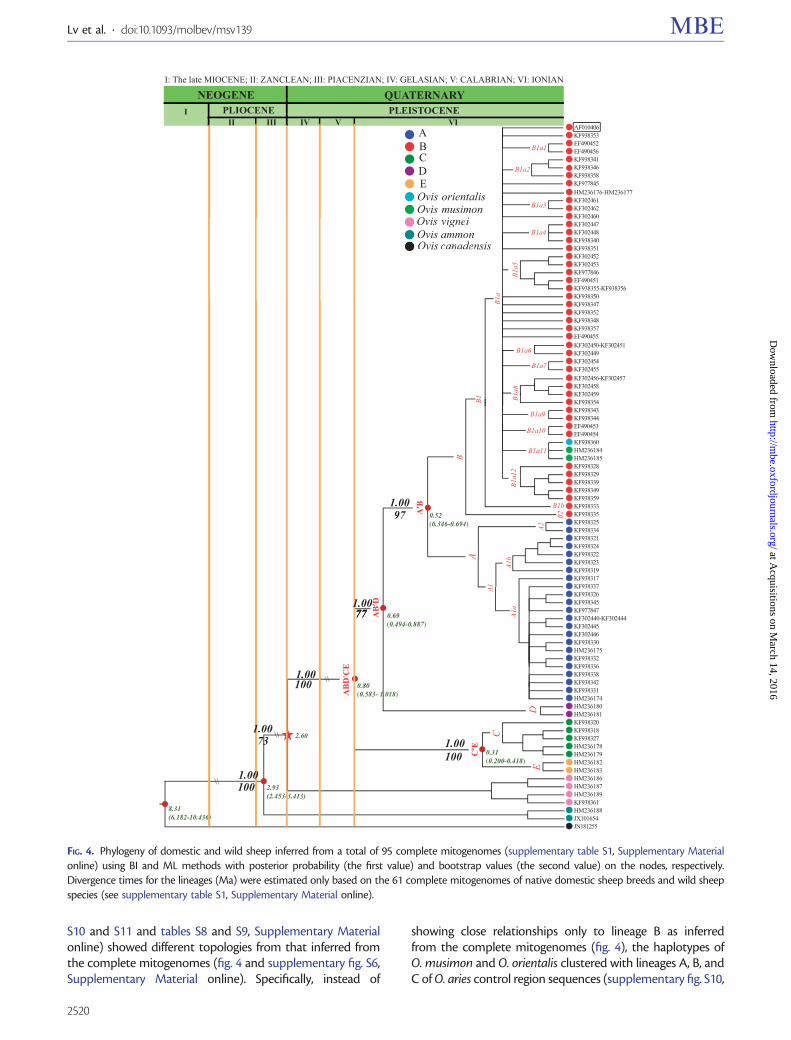
values, the eigenvalues for the first multidimensional scaling(MDS) plot dimension, allows us to examine the gradients ofcolonization out of the sheep domestication center that peakin the Middle East (fig. 5A; supplementary table S12,Supplementary Material online). �1 explains 69.3% of thetotal variation. We observe a significant correlation betweenthe �1 eigenvalues of Asian populations and their geographicdistances from the domestication center (lineages A, B, and Cof Central and East Asian populations: r = 0.201; P< 0.05;lineage A of Arabian and Indian populations: r = 0.547;P< 0.01; see fig. 5C and D). This suggests that the majorcolonization process of the Middle Eastern sheep to easternEurasia (including Mongolia, China, and India) was throughthe Caucasus and Central Asia. The interpolation map of the�2 eigenvalues suggests that the second MDS dimensioncould represent genetic influence from the MongolianPlateau region in China and the Indian subcontinent (fig.5B). �2 explains 27.3% of the total variation. Its rankingshows the Mongolian Plateau region at one extreme, whereasthe Indian subcontinent at the other extreme. This is sup-ported by a strong and significant correlation observed be-tween geographic distances from the putative region of initialcolonization (i.e., the Mongolian Plateau region) and�2 valuesacross eastern Eurasian populations (r = 0.372; P< 0.01; fig.5E). Eigenvalues �1 and �2 for all the populations are shown insupplementary table S12, Supplementary Material online.
The star-like median-joining networks (supplementary fig.S2, Supplementary Material online) and mismatch distribu-tions (supplementary fig. S19, Supplementary Materialonline) revealed genetic signatures of postdomestic demo-graphic population expansions in lineages A, B, and C. Theinference was corroborated by Fs (Fu 1997), Tajima’s D (1989),and scaled effective population size statistics (2Nu; N repre-sents the effective population size and u denotes the muta-tion rate). Both Fu’s Fs and Tajima’s D statistics showedT
able
2.D
iver
gen
ceT
ime
Esti
mat
edby
the
Sequ
ence
sof
Com
ple
teM
itog
enom
esan
dth
ePr
otei
n-C
odin
gG
enes
(syn
onym
ous
mut
atio
nan
dth
eth
ird-
codo
np
osit
ion
)U
sin
gM
Lan
dBI
Met
hods
.
Met
hod
Dat
aSe
tM
odel
Nod
eN
ode
1(T
C/E
)Ma
Nod
e2
(TA
/B)M
aN
ode
3(T
AB
/D)M
aN
ode
4(T
AB
D/C
E)M
aN
ode
5(T
O.a
ries
/O.v
ign
ei)M
aT
O.a
ries
/O.a
mm
on
Ma
TO
.ari
es/O
.canaden
sisM
a
ML
Mit
ogen
ome
Glo
bal
Tim
e0.
360.
510.
740.
882.
603.
007.
7295
%(C
I)(0
.278
–0.
439)
(0.4
02–
0.61
6)(0
.613
–0.
867)
(0.7
43–
1.01
3)—
(2.6
73–
3.32
3)(6
.567
–8.
883)
Loca
lT
ime
0.34
0.53
0.78
0.93
2.60
3.06
8.15
95%
(CI)
(0.2
76–
0.47
2)(0
.397
–0.
668)
(0.6
00–
0.95
6)(0
.721
–1.
131)
—(2
.697
–3.
419)
(6.6
35–
9.66
4)Sy
non
ymou
sG
lob
alT
ime
0.31
0.52
0.68
0.79
2.60
2.92
8.36
95%
(CI)
(0.2
17–
0.40
5)(0
.373
–0.
661)
(0.5
36–
0.82
9)(0
.637
–0.
934)
—(2
.535
–3.
312)
(6.4
41–
10.2
86)
Loca
lT
ime
0.31
0.52
0.69
0.80
2.60
2.93
8.31
95%
(CI)
(0.2
00–
0.41
8)(0
.346
–0.
694)
(0.4
94–
0.88
7)(0
.583
–1.
018)
—(2
.453
–3.
413)
(6.1
82–
10.4
36)
Th
ird
cod
onG
lob
alT
ime
0.29
0.50
0.64
0.73
2.60
2.81
7.47
95%
(CI)
(0.1
90–
0.39
0)(0
.361
–0.
639)
(0.4
97–
0.78
3)(0
.579
–0.
881)
—(2
.418
–3.
202)
(6.1
57–
8.78
3)Lo
cal
Tim
e0.
290.
500.
640.
732.
602.
817.
4795
%(C
I)(0
.190
–0.
390)
(0.3
59–
0.63
6)(0
.498
–0.
783)
(0.5
81–
0.88
2)—
(2.4
14–
3.20
0)(6
.158
–8.
786)
BI
Mit
ogen
ome
Rel
axed
-mol
ecu
lar
cloc
kM
edia
n0.
350.
550.
850.
922.
602.
686.
1395
%H
PD
(0.1
30–
0.64
1)(0
.266
–0.
913)
(0.3
90–
1.41
3)(0
.464
–1.
498)
—(2
.462
–3.
031)
(2.4
64–
11.6
18)
Syn
onym
ous
Med
ian
0.41
0.61
0.96
1.06
2.60
2.62
5.89
95%
HP
D(0
.147
–0.
772)
(0.2
91–
1.01
3)(0
.478
–1.
604)
(0.5
41–
1.71
6)—
(2.4
58–
3.33
8)(5
.456
–11
.598
)T
hir
dco
don
Med
ian
0.36
0.57
0.87
0.94
2.60
2.62
6.49
95%
HP
D(0
.142
–0.
656)
(0.2
7–0.
912)
(0.4
21–
1.42
8)(0
.472
–1.
496)
—(2
.461
–3.
083)
(2.4
78–
12.6
47)
NO
TE.—
“—,”
not
avai
labl
e.
2522
Lv et al. . doi:10.1093/molbev/msv139 MBE at A
cquisitions on March 14, 2016
http://mbe.oxfordjournals.org/
Dow
nloaded from
significant (PF< 0.001; PD< 0.001; table 3) departures fromneutrality in the three lineages. Additionally, the observedmismatch distributions of the lineages were fitted to thesudden population expansion models with very low valuesof the sum of squared deviation (SSD� 0.005; table 3) statisticand Harpending’s Raggedness index (Harpending 1994;rH = 0.021–0.031; PR< 0.5; table 3). Furthermore, the esti-mated pre- and postexpansion scaled effective populationsizes (2Nu) indicated an increase in the effective populationsize for each of the lineages (A: 0.0–77.81; B: 0.04–16.63, and C:0.00–15.77; table 3). The postdomestic expansion time ex-pressed in twice the number of generations multiplied bythe mutation rate (� = 2 ut) was found to be 6.443 ka (90%CI = 4.279–7.569 ka), 6.811 ka (90% CI: 3.502–9.706 ka), and4.549 ka (90% CI = 2.402–6.652 ka) for lineages A, B, and C,respectively, when assuming an initial expansion (i.e., lineageA involving European sheep; Tapio et al. 2006) to equal 9 ka(table 3 and fig. 6). Separate analyses for the four major geo-graphic areas (the Middle East, India, East Asia, and Europe)resulted in wider confidence intervals than those for the com-bined analysis and showed somewhat different estimates of �(table 3). In particular, the expansion time for lineage C in theMiddle East (3.910 ka; 90% CI: 2.818–5.120 ka) was morerecent than that in East Asia (4.967 ka; 90% CI: 1.893–7.842ka), whereas relatively earlier expansions in the Middle East
were inferred for lineages A and B (table 3). Additionally, wefound much later expansions of lineages A and B in India(lineage A: 4.033 ka: 90% CI: 1.517–23.100 ka; lineage B:3.393 ka; 90% CI: 0.961–16.311 ka) than those in East Asia(lineage A: 5.877 ka; 90% CI: 5.216–6.681 ka; lineage B: 7.008 ka;90% CI: 3.030–16.348 ka), respectively.
ABC analyses based on the control region sequences iden-tified an optimal model for each of the five sets of candidatecolonization models (lineage A first-step, lineage A second-step, lineage B first-step, lineage B second-step, and lineage C;supplementary information S4, Supplementary Materialonline). The optimal models exhibited much higher posteriorprobability and nonoverlapped 95% CIs as compared withother candidate models (table 4). These optimal models in-dicated that 1) lineage A first colonized from the Middle Eastto the Mongolian Plateau region and the Indian subcontinentseparately, and later from the Mongolian Plateau region toNorth China, and then to Southwest China (fig. 6); 2) lineageB first colonized from the Middle East to the MongolianPlateau region, and then from the Mongolian Plateauregion to North and Southwest China and the Indiansubcontinent separately (fig. 6); and 3) Lineage C first colo-nized from the Middle East to the Mongolian Plateau region,and later from the Mongolian Plateau region to North China,and then to the Indian subcontinent (e.g., Nepal) (fig. 6).
AA
B
-1.0-0.50.00.51.01.52.02.53.0
0 2000 4000 6000 8000
λ1 (d
imen
s ion
1)
Distance (km)
-0.04-0.020.000.020.040.060.080.10
0 2000 4000 6000
λ1 (d
imen
sion
1)
Distance (km)
-2.0-1.00.01.02.03.04.05.06.0
0 500 1000 1500 2000 2500 3000
λ2 ( d
imen
sio n
2)
C
D
E
Distance (km)
FIG. 5. Synthetic maps illustrating geographic variation of eigenvalues (�) for the first two MDS dimensions (�1 and �2) and regression of � versusgeographic distance from the putative original site of colonization process. (A) synthetic map for �1, (B) synthetic map for �2, (C) regression of �1 versusgeographic distances from the domestication center of sheep (represented by the geographic distance from the Kilis province of Turkey, where ancientdomestic sheep are located; Demirci et al. 2013) for Asian populations (r = 0.201; P< 0.05); (D) regression of �1 (based on lineage A only) versusgeographic distances from the domestication center of sheep (represented by the geographic distance from the Kilis province of Turkey, where ancientdomestic sheep are located; Demirci et al. 2013) for sheep populations from the Indian subcontinent (r = 0.547; P< 0.01); and (E) regression of �2 versusgeographic distances from a putative “transportation hub” of the Mongolian Plateau region (represented by the geographic distance from thenorthernmost population [Transbaikal Finewool] sampled) for eastern Eurasian (including China, Mongolia, and India) populations (r = 0.372; P< 0.01).
2523
Ovine Mitogenomic Variations across Eastern Eurasia . doi:10.1093/molbev/msv139 MBE at A
cquisitions on March 14, 2016
http://mbe.oxfordjournals.org/
Dow
nloaded from
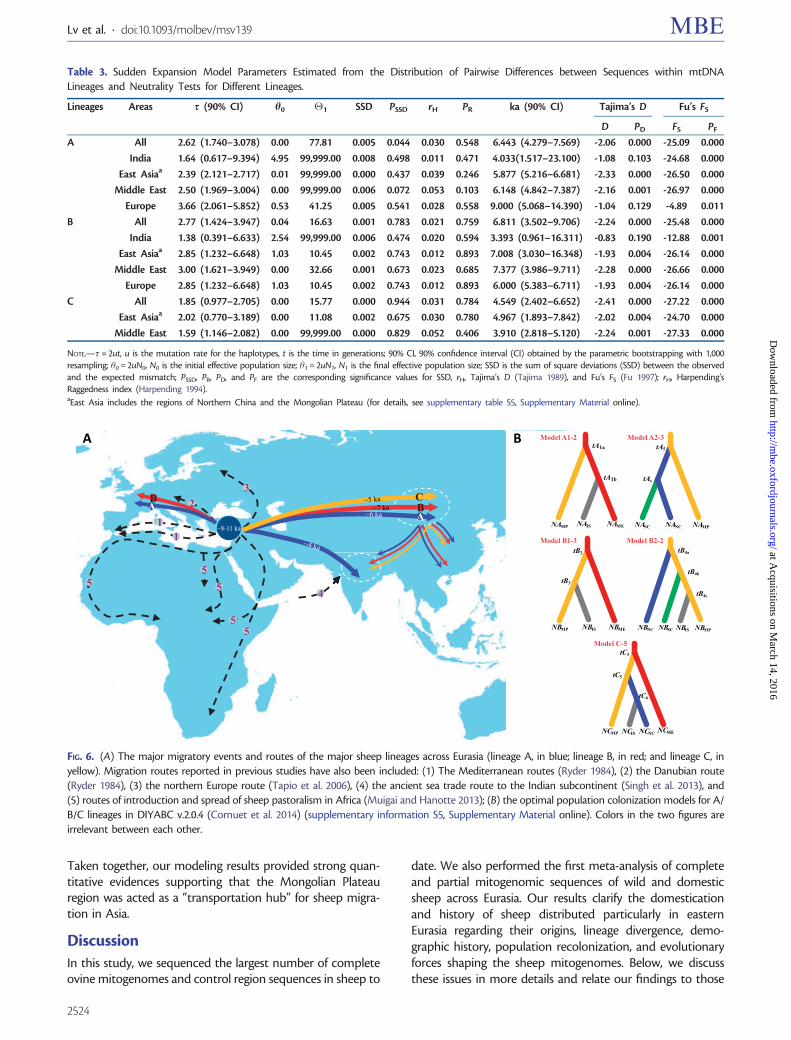
Taken together, our modeling results provided strong quan-titative evidences supporting that the Mongolian Plateauregion was acted as a “transportation hub” for sheep migra-tion in Asia.
DiscussionIn this study, we sequenced the largest number of completeovine mitogenomes and control region sequences in sheep to
date. We also performed the first meta-analysis of completeand partial mitogenomic sequences of wild and domesticsheep across Eurasia. Our results clarify the domesticationand history of sheep distributed particularly in easternEurasia regarding their origins, lineage divergence, demo-graphic history, population recolonization, and evolutionaryforces shaping the sheep mitogenomes. Below, we discussthese issues in more details and relate our findings to those
3
4
1
2
1
5 5
5 5
5
A B
A B C ~5 ka
~7 ka~6 ka
~4 ka
~8-11 ka
tA1a
tA1b
NAMENAMP NAIS NASC
tA5
tA6
NANC NAMP
tB2
tB3
NBMENBMP NBIS
tB4a
tB4b
tB4c
NBNC NBSC NBIS NBMP
Model C-5tC3
tC5
tC6
NCMENCMP NCNCNCIS
Model A1-2 Model A2-3
Model B1-3 Model B2-2
BA
FIG. 6. (A) The major migratory events and routes of the major sheep lineages across Eurasia (lineage A, in blue; lineage B, in red; and lineage C, inyellow). Migration routes reported in previous studies have also been included: (1) The Mediterranean routes (Ryder 1984), (2) the Danubian route(Ryder 1984), (3) the northern Europe route (Tapio et al. 2006), (4) the ancient sea trade route to the Indian subcontinent (Singh et al. 2013), and(5) routes of introduction and spread of sheep pastoralism in Africa (Muigai and Hanotte 2013); (B) the optimal population colonization models for A/B/C lineages in DIYABC v.2.0.4 (Cornuet et al. 2014) (supplementary information S5, Supplementary Material online). Colors in the two figures areirrelevant between each other.
Table 3. Sudden Expansion Model Parameters Estimated from the Distribution of Pairwise Differences between Sequences within mtDNALineages and Neutrality Tests for Different Lineages.
Lineages Areas s (90% CI) h0 �1 SSD PSSD rH PR ka (90% CI) Tajima’s D Fu’s FS
D PD FS PF
A All 2.62 (1.740–3.078) 0.00 77.81 0.005 0.044 0.030 0.548 6.443 (4.279–7.569) -2.06 0.000 -25.09 0.000
India 1.64 (0.617–9.394) 4.95 99,999.00 0.008 0.498 0.011 0.471 4.033(1.517–23.100) -1.08 0.103 -24.68 0.000
East Asiaa 2.39 (2.121–2.717) 0.01 99,999.00 0.000 0.437 0.039 0.246 5.877 (5.216–6.681) -2.33 0.000 -26.50 0.000
Middle East 2.50 (1.969–3.004) 0.00 99,999.00 0.006 0.072 0.053 0.103 6.148 (4.842–7.387) -2.16 0.001 -26.97 0.000
Europe 3.66 (2.061–5.852) 0.53 41.25 0.005 0.541 0.028 0.558 9.000 (5.068–14.390) -1.04 0.129 -4.89 0.011
B All 2.77 (1.424–3.947) 0.04 16.63 0.001 0.783 0.021 0.759 6.811 (3.502–9.706) -2.24 0.000 -25.48 0.000
India 1.38 (0.391–6.633) 2.54 99,999.00 0.006 0.474 0.020 0.594 3.393 (0.961–16.311) -0.83 0.190 -12.88 0.001
East Asiaa 2.85 (1.232–6.648) 1.03 10.45 0.002 0.743 0.012 0.893 7.008 (3.030–16.348) -1.93 0.004 -26.14 0.000
Middle East 3.00 (1.621–3.949) 0.00 32.66 0.001 0.673 0.023 0.685 7.377 (3.986–9.711) -2.28 0.000 -26.66 0.000
Europe 2.85 (1.232–6.648) 1.03 10.45 0.002 0.743 0.012 0.893 6.000 (5.383–6.711) -1.93 0.004 -26.14 0.000
C All 1.85 (0.977–2.705) 0.00 15.77 0.000 0.944 0.031 0.784 4.549 (2.402–6.652) -2.41 0.000 -27.22 0.000
East Asiaa 2.02 (0.770–3.189) 0.00 11.08 0.002 0.675 0.030 0.780 4.967 (1.893–7.842) -2.02 0.004 -24.70 0.000
Middle East 1.59 (1.146–2.082) 0.00 99,999.00 0.000 0.829 0.052 0.406 3.910 (2.818–5.120) -2.24 0.001 -27.33 0.000
NOTE.—� = 2ut, u is the mutation rate for the haplotypes, t is the time in generations; 90% CI, 90% confidence interval (CI) obtained by the parametric bootstrapping with 1,000resampling; �0 = 2uN0, N0 is the initial effective population size; �1 = 2uN1, N1 is the final effective population size; SSD is the sum of square deviations (SSD) between the observedand the expected mismatch; PSSD, PR, PD, and PF are the corresponding significance values for SSD, rH, Tajima’s D (Tajima 1989), and Fu’s FS (Fu 1997); rH, Harpending’sRaggedness index (Harpending 1994).aEast Asia includes the regions of Northern China and the Mongolian Plateau (for details, see supplementary table S5, Supplementary Material online).
2524
Lv et al. . doi:10.1093/molbev/msv139 MBE at A
cquisitions on March 14, 2016
http://mbe.oxfordjournals.org/
Dow
nloaded from

that have emerged from early mtDNA studies on the ovinespecies.
Phylogenies
Phylogenetic analyses of complete mitogenomes showed ahigh resolution among wild sheep as well as among themajor lineages of domestic sheep (fig. 4). The complete mito-genomes of O. orientalis and O. musimon formed a mono-phyletic group (fig. 4) that was incorporated within lineage Bof domestic sheep. However, the analysis of full control regionand Cyt-b fragments showed that O. orientalis is also closelyrelated to other lineages (e.g., lineages A, C, and E) of O. aries(supplementary figs. S10 and S11, Supplementary Materialonline). This difference could be ascribed to the smallnumber (n = 3) of O. musimon and O. orientalis completemitogenomes available in this study (fig. 4).
Full control region and Cyt-b fragments from the completemitogenomes produced similar phylogenies with fully re-solved phylogenetic relationships of wild sheep, but theyfailed to define the phylogenetic relationships among themajor lineages of domestic sheep (supplementary figs. S7and S8, Supplementary Material online). Our results suggestthat partial fragments of the complete mitogenomes wouldbe problematic when making phylogenetic inferences about
domestic sheep. This problem arises due to diagnostic sub-stitutions located elsewhere in the mitogenome (fig. 4; sup-plementary table S13, Supplementary Material online). Thus,the diagnostic substitutions for species and lineages presentedhere (fig. 4; supplementary table S13, Supplementary Materialonline) can serve as an important resource for maternal ge-netic differentiation between domestic and wild sheep as wellas between the lineages within domestic sheep. Also, theymight be helpful for addressing certain conflicts describedabove in future.
Origins and Migrations of Lineage C
Lineage C showed a restricted distribution in semidesert andsteppe regions, 30–45�N. Given the limited geographic range,lineage C in domestic sheep may represent a recent geneticintrogression from wild ancestors, rather than an indepen-dent domestication event. This hypothesis is supported by atleast three lines of evidence: 1) lower mean frequency of lin-eage C (~10.36%) across the global breeds, and absence orextremely low frequency of lineage C (e.g., due to a recentexpansion process; fig. 2B) in native breeds in Europe, theIndian subcontinent (including India and Pakistan),Southwest China, South Asia (including Indonesia), andAfrica; 2) the extensive human practice of mating domesticewes and wild rams documented in Central Asia and NorthChina (Carruthers 1949; Aniwashi et al. 2007); and 3) lineage Cshows an even earlier population expansion in East Asia(4.967 ka; 90% CI: 1.893–7.842 ka) than that in the presumedsheep domestication center of the Middle East (3.910 ka; 90%CI: 2.818–5.120 ka). High frequency and genetic variability (hand �) of lineage C were observed in breeds of northerncentral China (figs. 2B and 4D). These observations suggestthat North China could be one of the origin regions for lineageC sheep, where sheep farming has been dated to approxi-mately 5–8 ka at an early Neolithic site (Chen 1990; Cai et al.2011; Yang et al. 2015). Nevertheless, we note that lineage Cwas not detected in earlier ancient DNA analyses of arche-ological sheep remains (~3.5–4.5 ka; n = 8, Cai et al. 2007;n = 14, Cai et al. 2011; Yang et al. 2015; see also fig. 2A),which could be due to sampling effects.
Interestingly, lineage C co-occurs with indigenous fat-tailedbreeds in Eurasia (fig. 2D), and our results suggest that theprevalence of lineage C could be probably linked to geo-graphic range of fat-tailed breeds (see also Bruford 2005;Tapio et al. 2006), as deserving further investigations. Fat-tailed sheep was first recorded on an ancient Uruk II (~5ka) and Ur stone vessel and mosaics in Iraq (~4.4 ka) byarcheological evidence (Ryder 1983; see also Muigai andHanotte 2013). However, we observed very few or not at alllineage C in sheep from Pakistan, India, Southwest China, andIndonesia (fig. 2, supplementary tables S2 and S3,Supplementary Material online). These observations, togetherwith the colonization scenarios of lineage C reconstructedusing ABC, suggested that lineage C first colonized from theMiddle East to the Mongolian Plateau region through theCaucasus, east of the Caspian Sea and Central Asia, then
Table 4. Results of Model Choice for the Colonization Scenarios ofSheep Lineages A, B, and C Tested in the ABC Analyses.
Scenarios PosteriorProbability
95% ConfidenceIntervals
The models of lineage A in the first step
A1-1 0.120 0.015� 0.224
A1-2 0.842 0.822� 0.862
A1-3 0.038 0.020� 0.056
The models of lineage A in the second step
A2-1 0.215 0.168� 0.263
A2-2 0.060 0.016� 0.105
A2-3 0.725 0.707� 0.742
The models of lineage B in the first step
B1-1 0.253 0.245� 0.261
B1-2 0.258 0.245� 0.272
B1-3 0.489 0.481� 0.497
The models of lineage B in the second step
B2-1 0.043 0.038� 0.048
B2-2 0.939 0.933� 0.945
B2-3 0.004 0.003� 0.004
B2-4 0.005 0.005� 0.006
B2-5 0.009 0.008� 0.010
The models of lineage C
C-1 0.158 0.149� 0.167
C-2 0.079 0.069� 0.088
C-3 0.207 0.200� 0.215
C-4 0.138 0.128� 0.147
C-5 0.418 0.407� 0.430
NOTE.—The best-supported model with the highest posterior probability is indicatedin italics.
2525
Ovine Mitogenomic Variations across Eastern Eurasia . doi:10.1093/molbev/msv139 MBE at A
cquisitions on March 14, 2016
http://mbe.oxfordjournals.org/
Dow
nloaded from
dispersed to North China and the Qinghai-Tibetan Plateau,and finally arrived in Nepal.
Our results imply that the five maternal lineages evolved atdifferent times before domestication (table 2). Zeder et al.(2006) suggested that independent domestication events indomestic animals might represent the introduction of foun-ders that were subsequently submerged in the recruitment oflocal wild animals. Larson and Burger (2013) recently pro-posed that hybridization between local wilds and introduceddomestic populations was common in a wide range of plantand animal species. Here, the extremely low occurrence oflineages D and E in domestic sheep and their restricted geo-graphical distributions indicate that these lineages most likelyrepresent additional two introgression events rather than in-dependent domestication events.
Population Expansions and Migrations in EasternEurasia
We observed both prehistoric (~20–60 ka) and postdomes-tication (~3.5–9 ka) demographic expansions for the threemajor lineages (A, B, and C). Thus, the wild ancestors of do-mestic sheep underwent a major population expansionbefore the Last Glacial Maximum (~19.0–26.5 ka). Resultsof the BSP inferences on demographics should be interpretedwith caution due to the confounding effect of populationstructure (e.g., Grant et al. 2012) and uncertainty in timeestimation (e.g., Heller et al. 2013; see also the review by Hoand Shapiro 2011). Nevertheless, the worldwide collection ofsamples from a large number of populations and the appli-cation of multiple approaches in molecular clock calibrationshould minimize these effects.
We observed high levels of diversity (�) for lineage B in thebreeds from Central Asia, with a decreasing gradient to theeast (fig. 3C). This geographic pattern could be interpreted asthe genetic introgression of Middle Eastern (rather thanEuropean) lineage B sheep into East Asian breeds throughthe Caucasus (Tapio et al. 2006) and Central Asia (fig. 6).This explanation is supported by the similar expansion timeof lineage B sheep in the Middle East and East Asia but a laterexpansion of lineage B in Europe (the Middle East: 7.377 ka,90% CI: 3.986–9.711 ka; East Asia: 7.008 ka, 90% CI: 3.030–16.348 ka; Europe: 6.000 ka, 90% CI: 5.383–6.711 ka; table 3).We also observed a high level of nucleotide diversity (�) forlineage A in the Caucasus, following a west–east decreasinggradient. In addition, decrease with geographic distance east-wards for the �1 eigenvalues is significant across East Asian(including China and Mongolia) populations with its peak inthe Middle Eastern domestication center (r = 0.201; P< 0.05;fig. 5A and C). Moreover, East Asian breeds showed closergenetic relationships with the breeds in Central Asia,Caucasus, and Turkey than those in Europe, as indicated bythe MDS plot and pairwise genetic differentiation (supple-mentary figs. S12 and S13 and table S12, SupplementaryMaterial online). Thus, the maternal lineages in the MiddleEastern sheep may have been introduced to East Asia throughthe Caucasus and Central Asia by commercial trade betweenthe West and East (e.g., Cai et al. 2011). Recent archeological
studies in North China suggest that the West–East tradecontact could be traced back to the prehistoric periodthrough the “Bronze Road” across the vast Eurasian landmassapproximately 4.5–5.3 ka (Yi 2004). Also, at this time milletwas transported from its domestication site in North China tothe Caucasus region approximately 7 ka (Hunt et al. 2008;Jones and Liu 2009). However, regression analysis (fig. 5C) andBayesian simulations (fig. 6B) of lineage A identified its south-eastwards migration from the Middle East to the Indiansubcontinent through Arabia (and/or the Arabian Sea; see,e.g., Singh et al. 2013), which could be due to ancient overland(and/or maritime) trade (e.g., the Silk Road) between Arabiaand India dated as early as approximately 4.5 ka (e.g., Gauri2013).
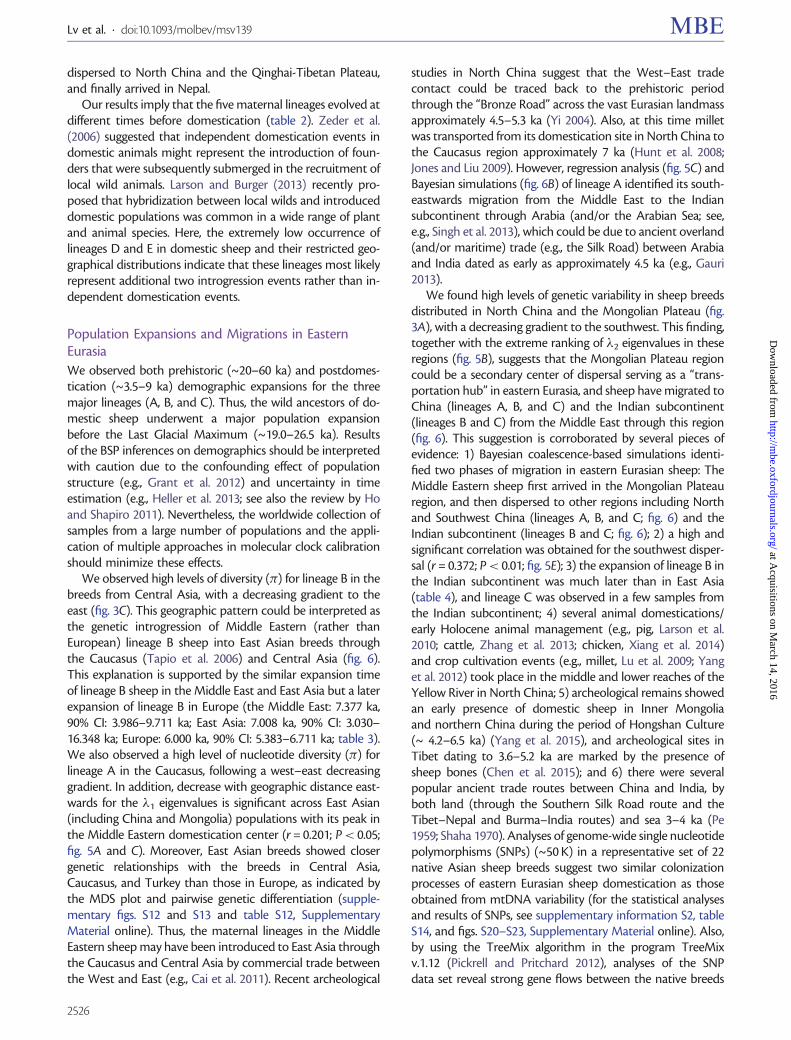
We found high levels of genetic variability in sheep breedsdistributed in North China and the Mongolian Plateau (fig.3A), with a decreasing gradient to the southwest. This finding,together with the extreme ranking of �2 eigenvalues in theseregions (fig. 5B), suggests that the Mongolian Plateau regioncould be a secondary center of dispersal serving as a “trans-portation hub” in eastern Eurasia, and sheep have migrated toChina (lineages A, B, and C) and the Indian subcontinent(lineages B and C) from the Middle East through this region(fig. 6). This suggestion is corroborated by several pieces ofevidence: 1) Bayesian coalescence-based simulations identi-fied two phases of migration in eastern Eurasian sheep: TheMiddle Eastern sheep first arrived in the Mongolian Plateauregion, and then dispersed to other regions including Northand Southwest China (lineages A, B, and C; fig. 6) and theIndian subcontinent (lineages B and C; fig. 6); 2) a high andsignificant correlation was obtained for the southwest disper-sal (r = 0.372; P< 0.01; fig. 5E); 3) the expansion of lineage B inthe Indian subcontinent was much later than in East Asia(table 4), and lineage C was observed in a few samples fromthe Indian subcontinent; 4) several animal domestications/early Holocene animal management (e.g., pig, Larson et al.2010; cattle, Zhang et al. 2013; chicken, Xiang et al. 2014)and crop cultivation events (e.g., millet, Lu et al. 2009; Yanget al. 2012) took place in the middle and lower reaches of theYellow River in North China; 5) archeological remains showedan early presence of domestic sheep in Inner Mongoliaand northern China during the period of Hongshan Culture(~ 4.2–6.5 ka) (Yang et al. 2015), and archeological sites inTibet dating to 3.6–5.2 ka are marked by the presence ofsheep bones (Chen et al. 2015); and 6) there were severalpopular ancient trade routes between China and India, byboth land (through the Southern Silk Road route and theTibet–Nepal and Burma–India routes) and sea 3–4 ka (Pe1959; Shaha 1970). Analyses of genome-wide single nucleotidepolymorphisms (SNPs) (~50 K) in a representative set of 22native Asian sheep breeds suggest two similar colonizationprocesses of eastern Eurasian sheep domestication as thoseobtained from mtDNA variability (for the statistical analysesand results of SNPs, see supplementary information S2, tableS14, and figs. S20–S23, Supplementary Material online). Also,by using the TreeMix algorithm in the program TreeMixv.1.12 (Pickrell and Pritchard 2012), analyses of the SNPdata set reveal strong gene flows between the native breeds
2526
Lv et al. . doi:10.1093/molbev/msv139 MBE at A
cquisitions on March 14, 2016
http://mbe.oxfordjournals.org/
Dow
nloaded from
of different geographic regions and forward and backwardmovements as well (supplementary information S3 and fig.S24; Supplementary Material online).
Multiple Forces Acting on the Maternal GeneticMakeup of Eastern Eurasian Sheep
Frequent animal exchange, particularly of breeding ewes, be-tween the breeds in different regions through ancient traderoutes (e.g., the Silk Road) could have contributed to thegeographic patterns observed in this study (figs. 2 and 3). Inaddition to the initial population expansion during theNeolithic, sheep maternal lineages could also have spreadto East Asia and the Indian subcontinent through theMongolian invasions. Overall, our findings suggest strong his-torical human-mediated gene flow between breeds acrossEurasia (supplementary figs. S12, S13, and S20–S24,Supplementary Material online; see also, e.g., Kijas et al.2009, 2012). This hypothesis is also compatible with thehigh level of genetic admixture revealed by a recentgenome-wide analysis of sheep breeds across the world(Kijas et al. 2012).
In addition to the ancient haplotypes (e.g., a1, b1, and c1),we also detected several derived predominant haplotypes(e.g., a2 and b2) composing apparent substructures withinthe lineages (supplementary fig. S2, Supplementary Materialonline). During the initial population expansion, a variety ofnew haplotypes might have appeared in different regions,resulting from local evolutionary dynamics, for example, se-lective constraints imposed by the regional environments(Zhang et al. 2013). In the Indian subcontinent, we foundhigh levels of nucleotide diversity of lineages A and B (fig.3B and C). Because the expansion times of lineages A and B inthe Middle East greatly predate those in India, this observa-tion implies that some new haplotypes could have arisenunder secondary domestication in India (Singh et al. 2013),driven by local population dynamics.
The ! ratios (!= dN/dS; dN, nonsynonymous substitu-tions; dS, synonymous substitutions; see Materials andMethods) of lineages A–E ranged from 0.0457 to 0.0775and were lower than those of other domestic animals suchas goat (!= 0.123–0.387; Nomura et al. 2013), dog (!= 0.183;Bj€ornerfeldt et al. 2006), and yak (!= 0.231; Wang et al. 2011).It is reasonable to expect a stronger purifying pressure onsheep than some other domestic animals, as the sheephave often been subject of highly industrialized agriculturalpractice. Widely variable pastoral environments, such as high-land plateau, areas of high precipitations (Joost et al. 2007),and dry desert regions, may have also maintained relativelyintense selection pressures on sheep throughout history (e.g.,Lv et al. 2014). The low ! values and significant differencesbetween them (table 2) suggest that severe selective pressureshave continued to operate on these lineages.
Approaches for Estimating Divergence Time
The use of molecular clock methods to infer date of evolu-tionary divergence events should be cautioned because a di-verse range of available molecular clock methods and models
can yield different estimates of ages (e.g., the reviews in Kumar2005; Ho 2014; Ho and Duchene 2014). Here, the divergencesbetween domestic lineages dated by BI were much earlierthan those by ML (table 2). The difference was consistentwith that in an early study on complete mitogenomes frommodern horses using external calibration points (Achilli et al.2012), but contrasted with that of a study on human mtDNAusing internal calibration points (Pereira et al. 2010). Achilliet al. (2012) suggested that the BI method behaves betterwhen inferring the ages of nodes for any given lineagesusing internal calibration points. However, ML should be amore appropriate method by which to estimate the diver-gence time without a fossil record as internal calibrationpoint. Nomura et al. (2013) argued that the fossil record ingeneral does not always point to the “real” divergence time,but rather that the split of two lineages was older than the ageof the first fossil record. In this study, we used a paleontolo-gical calibration point (i.e., the divergence time of 2.6 Mabetween O. aries and O. vignei) applied to archeological time-frames. Early studies indicated that the paleontological cali-bration is more reasonable and if this younger fossil age hadbeen used as the calibration point, divergence times wouldhave been grossly underestimated (e.g., Nomura et al 2013;Jiang et al. 2014). Although the approach has been successfulin dating interspecies divergence based on mtDNA (e.g.,Nomura et al. 2013) and gene sequences (e.g., Jiang et al.2014), we should be also aware of the uncertainties fromsuch analyses associated with the impact of different time-scales (e.g., the reviews in Ho et al. 2011; Ho and Duchene2014). The local clock, a more complex model than the globalclock model, allows for different molecular clocks for thebranches. Because there was genetic differentiation betweenwild and domestic sheep (p distance = 0.025, data notshown), the evolutionary times estimated under the localclock model with an assumption of different molecularclocks for domestic and wild sheep should be more reason-able (table 2).
Also, several biological and methodological factors canaffect time estimation, including natural selection and accu-rate characterizations of time-dependent molecular evolu-tionary rate and timescale (e.g., Ho et al. 2011; Ho andDuchene 2014). We estimated that the oldest split for lineagesC and E from A, B, and D in domestic sheep occurred atapproximately 0.790 Ma (95% CI: 0.634–0.934 Ma) based onsynonymous substitutions, which is more recent than thatestimated using a small number of complete mitogenomes inan early study (0.920 Ma, n = 16; Meadows et al. 2011). Thismay be because molecular clocks at synonymous sites displayless time dependence and should be closer to the neutralmolecular clock than those at nonsynonymous sites (e.g.,the reviews in Kumar 2005; Ho et al. 2011; Ho 2014). Ourdetection of strong purifying selection on the protein-codingregions of the O. aries lineages (supplementary fig. S14,Supplementary Material online) also suggests that the diver-gence time estimation based on complete mitogenomescould be biased (see also the reviews in Ho et al. 2011; Hoand Duchene 2014). Instead, using only synonymous sitesmight be a better choice for divergence time estimation.
2527
Ovine Mitogenomic Variations across Eastern Eurasia . doi:10.1093/molbev/msv139 MBE at A
cquisitions on March 14, 2016
http://mbe.oxfordjournals.org/
Dow
nloaded from
Moreover, a variety of molecular evolution rates for differentcomponents of mtDNA may also have contributed to thebias in the estimation of divergence time using completemitogenomes (Torroni et al. 2006; Taberlet et al. 2008;Achilli et al. 2009; see also the reviews in Ho and Shapiro2011; Ho 2014; Ho and Duchene 2014). Similar differenceswere also observed in the mtDNA studies of other domesticanimals, such as horse (e.g., Lippold et al. 2011; Achilli et al.2012) and goat (e.g., Naderi et al. 2008; Nomura et al. 2013).
ConclusionsIn conclusion, the first meta-analysis of complete and partialmtDNA sequences of wild and domestic sheep throughoutEurasia reveals that 1) the most common female ancestor ofthe five O. aries lineages lived at approximately 0.79 Ma (95%CI: 0.637–0.934 Ma) during the Middle Pleistocene, beingmuch earlier than their domestication event (~8–11 ka); 2)the ancestor of O. aries experienced a rapid increase in Ne
immediately before the Last Glacial Maximum (~19.5–26 ka);3) two migratory waves (the first wave: lineages A and B; thesecond wave: lineage C) at approximately 4.5–6.8 ka alongdifferent routes created the original maternal genetic make-ups of modern sheep across Eurasia, with the influence ofprehistoric human activities, and North China could be anorigin region for lineage C sheep; 4) the Mongolian Plateauregion was a secondary zone/center of sheep dispersal as a“transportation hub” in eastern Eurasia: Sheep from theMiddle Eastern domestication center were inferred to havemigrated through Caucasus and Central Asia, and arrived inNorth and Southwest China (lineages A, B, and C) and theIndian subcontinent (lineages B and C) through this region;and 5) lineage A was inferred to have been introduced intothe Indian subcontinent from the Middle East throughArabia. The results of this study significantly improve ourunderstanding of sheep domestication across Eurasia, parti-cularly the dispersal to and from eastern Eurasia.
Materials and Methods
Samples, DNA Extraction, mtDNA Sequencing, andSequence Quality Trimming
Complete mitogenomes of 45 animals representing 42modern native breeds (O. aries) from Azerbaijan, Moldova,Serbia, Ukraine, Russia, Kazakhstan, Poland, Finland, China,and United Kingdom and two wild species (O. orientalisand O. vignei) from Kazakhstan were sequenced (fig. 1 andsupplementary table S1, Supplementary Material online). Inaddition, the control region of 875 animals representing 51eastern Eurasian (including 41 Chinese, 3 Iranian, 3 Pakistani, 2Indonesian, and 2 Siberian [the Republic of Buryatia, Russia])native breeds was also sequenced (fig. 1 and supplementarytables S2, Supplementary Material online). In all the cases,pedigree information and knowledge of local herdsmenwere used to ensure that animals were purebred and unre-lated. Summary of sample information, including species/breed names and codes, sites with their geographic coordina-tes, and sample sizes are detailed in supplementary tables S1(complete mitogenomes) and S2 (control region),
Supplementary Material online. Genomic DNA was extractedfrom whole blood or marginal ear tissue using a standardphenol–chloroform method (Sambrook and Russell 2001).
Twenty-one primer pairs, including 18 used in Meadowset al. (2011) and three new pairs (supplementary table S15,Supplementary Material online) designed from the O. ariescomplete mitogenome reference sequence AF010406(Hiendleder, Mainz, et al. 1998) in this study, were used toamplify the complete mitogenome of domestic and wildsheep. Polymerase chain reaction (PCR) products from the43 domestic and two wild individuals were produced follow-ing Meadows et al. (2007). In addition, a pair of primers, for-ward primer MSD-F 50-ACAACACGGACTTCCCACTC-30
(map positions 15522–15541 bp of AF010406) and reverseprimer MSD-R 50-CCAAGCATCCCCAAAAATTA-30 (map po-sitions 16299–16318 bp of AF010406), was designed to am-plify a 749-bp fragment of the control region. PCRamplification was conducted in 20ml containing 30 ng oftotal DNA, 0.4mM of each primer, and 2� Es Taq MasterMix (ComWin Biotech, Beijing, China) with an initial dena-turation at 95�C for 5 min, followed by 35 cycles of 30 s at95�C, 30 s at 58�C and 1 min at 72�C, and a final 10-minextension at 72�C. All products were sequenced directly inthe forward and reverse directions using the amplificationprimers on an ABI 3730 capillary sequencer (AppliedBiosystems, Life Technologies, NY). Homologous sequencesof control region in Indonesian, Iranian, Mongolian,Nepalese, and Pakistani sheep were obtained following Luoet al. (2005).
All the reads were assessed manually and aligned usingCLUSTAL_X v.2.1 (Larkin et al. 2007). Complete mitogenomeswere assembled and aligned to AF010406 using SeqMan IIsoftware in the Lasergene package v.12 (DNASTAR, Inc.,Madison), and they were further trimmed to exclude the75/76 bp tandem repeats (Lancioni et al. 2013) from bp15650 to 15905. After trimming, the complete mitogenomeswere fractionated into four portions, including the concate-mers of tRNA, rRNA, 13 protein-coding genes with the ND6gene readjusted to the same reading direction as the othergenes (e.g., Peng and Zhang 2011), and the control region.
mtDNA Data Sets and Sequence Alignment
Fifty complete mitogenomic sequences were retrieved fromGenBank, including 42 from O. aries, 2 from O. musimon, 3from O. vignei, 2 from O. ammon, and 1 from O. canadensis(supplementary table S1, Supplementary Material online). Inaddition, a total of 2,017 partial O. aries mtDNA sequences(1,470 partial control region sequences from 98 breeds and547 partial Cyt-b sequences from 50 breeds; supplementarytables S2 and S3, Supplementary Material online) of nativeEurasian breeds (covering the Indian subcontinent, theMiddle East, the Caucasus, Southwest Asia, Central Asia,Mongolia, and Europe) were extracted from GenBank. Wealso collected full control region (number of sequences = 346;supplementary table S8, Supplementary Material online) andCyt-b (number of sequences = 271; supplementary table S9,Supplementary Material online) sequences of domestic and
2528
Lv et al. . doi:10.1093/molbev/msv139 MBE at A
cquisitions on March 14, 2016
http://mbe.oxfordjournals.org/
Dow
nloaded from

wild sheep (including O. orientalis, O. musimon, O. vignei, O.ammon, O. canadensis, O. dalli, and O. nivicola) fromGenBank. All sequences were screened for quality using theapproach of Yao et al. (2009) and Shi et al. (2014), and prob-lematic sequences were discarded in downstream analysis.
After quality trimming and filtering, all the complete andpartial mitogenomic fragments obtained in this study werecompared with the respective sequences collected fromGenBank using the nucleotide BLAST (Basic LocalAlignment Search Tool) program (Altschul et al. 1997).Common fragments of 506 bp (map positions 14453–14958of AF010406) for Cyt-b and 292 bp (15541–15654 and 15955–16132 of AF010406) for control region were aligned andedited for analysis using ClustalX v.2.1 (Larkin et al. 2007).
Sequence Variation and Phylogenetic Analyses
Measures of sequence variation, including number and pro-portion of substitutions (s), transition/transversion ratio, andnucleotide (�) and haplotype diversity (h), were computedusing the program DnaSP v.5.1 (Rozas et al. 2003). Estimatesof � and h were corrected for sample size using rarefaction.The five major maternal lineages (A–E) of O. aries are definedby specific diagnostic mutations common to the individuallineages (e.g., Meadows et al. 2007, 2011), and the lineagefrequencies in each breed/population (or group of breeds/populations) were estimated by counting.
Pairwise-population fixation index (FST) values (Reynoldset al. 1983) and analysis of molecular variation were calculatedbased on the 2,345 partial control region sequences acrossEurasia using Arlequin v.3.5 (Excoffier and Lischer 2010). Theobtained genetic distances were used to draw MDS plots inthe R package v. 3.1.2 (R Core Team 2014), and eigenvalues(�) for the first two dimensions (dimensions 1 and 2) werecalculated in each breed/population. To visualize the geo-graphic distribution patterns of � and �, interpolationmaps were constructed using the ArcMap program inArcGIS v.10.0 software. The inverse distance weightedoption with a power of 2 was selected for the interpolationof the surface (e.g., Hanotte et al. 2002). Regression of �1
versus geographic distance from the domestication centerof sheep (represented by the geographic distance from theKilis province of Turkey, where ancient domestic sheep arelocated; Demirci et al. 2013), and �2 versus geographic dis-tance from a putative “transportation hub” of the MongolianPlateau region (represented by the geographic distance fromthe northernmost population [Transbaikal Finewool] sam-pled) were conducted separately for populations throughvarious migration routes using SPSS v. 18.0.
Phylogenetic relationships among haplotypes were in-ferred from the complete mitogenomes using the BI ap-proach within MrBayes v.3.2.2 (Ronquist et al. 2011) andthe ML approach within PhyML v.3.0 (Guindon andGascuel 2003). Hierarchical LRTs were implemented toselect a best-fit model of nucleotide substitution in the phy-logenetic analysis using the program jModelTest v.2.1.4(Darriba et al. 2012). Out of 88 candidate models, the best-fit models under the Bayesian information criterion,
HKY85 + I + G, HKY + G + I, HKY + G, and TN93 + H + G (fordetails of the models, see Hasegawa et al. 1985; Tamura andNei 1993; Posada 2008), were selected for the data sets ofprotein-coding genes, control region, Cyt-b, and completesequences of the mitogenomes, respectively. Bootstrap sup-port values for the ML analysis were generated with 1,000replicates (Felsenstein 1985). The BI analysis was run with foursimultaneous Markov chains for 20 million generations, star-ting from a random tree. The sampling frequency was set to1/1,000, and the first 20% of trees obtained were discarded asa burn-in. In addition, we reconstructed phylogenetic treesbased on the full control region (1,105–1,333 bp) and Cyt-bsequences (1,063–1,143 bp) of wild and domestic sheep (sup-plementary tables S7 and S8, Supplementary Material online).Phylogenetic trees were inferred using the BI, ML, maximumparsimony (MP), and neighbor-joining methods with theHKY + G model as described in Rezaei et al. (2010). We alsoconstructed median-joining networks from the full controlregion and Cyt-b sequences of domestic and wild sheep (in-cluding the hybrids), and attempted to assign each Cyt-b orcontrol region sequence to the specific lineages defined pre-viously using diagnostic mutations and the near-matchingstrategy (e.g., Wu et al. 2007; Achilli et al. 2012). Similarly,median-joining networks (Bandelt et al. 1999) were builtbased on the partial control region or Cyt-b sequencesseparately.
Detection of Signatures of Selection on Protein-Coding Genes
Signatures of selection on the protein-coding genes of the fivelineages were detected using the branch-site models of !(!= dN/dS; dN, nonsynonymous substitutions; dS, synony-mous substitutions) implemented in the CODEML programof the package PAML v.4.7 (Yang 2007). ! is an indicator ofnatural selection. Values of != 1, !< 1 and ! 4 1 indicateneutral evolution, purifying and diversifying positive selection,respectively (Goldman and Yang 1994; Crandall et al. 1999).Values of ! were estimated for the codons of differentbranches (lineages A–E) that were assumed to have evolvedindependently of one another. Four codon-substitutionmodels were used to investigate the signature of selection.The phylogenetic tree for protein-coding genes was con-structed using the MP method as implemented in MEGAv.5.2.2 (Tamura et al. 2011).
First, we tested the simplest branch, which assumed thesame! ratio for all the branches in the entire tree. Second, weassumed a two-ratio model that assigned a ! ratio for thetested branch and a background ! ratio for all the otherbranches. Third, we tested the three-ratio model, which al-lowed two different! ratios on the two tested branches and abackground ! ratio for the other branches. Finally, weadopted a free-ratio model, which assumed a different !ratio for each of the four branches in the phylogenetic tree.Log-likelihood scores (ln L) evaluated the quality of the fit ofthe tested data to the conditions of the model; a higherlog-likelihood value (close to zero) was a “better”-fittingmodel (Yang 1998). LRTs were further employed to compare
2529
Ovine Mitogenomic Variations across Eastern Eurasia . doi:10.1093/molbev/msv139 MBE at A
cquisitions on March 14, 2016
http://mbe.oxfordjournals.org/
Dow
nloaded from
the fit of the models to the data by comparing twice the log-likelihood difference (2�ln L) to a �2 distribution with de-grees of freedom equal to the difference in the number ofparameters between the two models (Yang 1998).
Divergence Time Estimation
Phylogenetic relationships within the genus Ovis (see Results)inferred in previous analyses were used to estimate the diver-gence times between the major O. aries lineages using PAMLv.4.7 (Yang 2007) and BEAST v.1.7.5 (Drummond and Rambaut2007). Due to the lack of an exact fossil record between Ovisspecies for the calibration, we used a comprehensive evolu-tionary framework (see Nomura et al. 2013; Jiang et al. 2014)to estimate the divergence time between O. aries and O. vignei. Aphylogenetic tree including 24 species (supplementary table S16,Supplementary Material online) was inferred based on the 13mtDNA protein-coding genes using the GTR + I + G model inMrBayes v.3.2.2 (Ronquist et al. 2011). The divergence times wereestimated based on five fossil calibration points (18.3–28.5 Mabetween Bovinae and Caprinae, 52–58 Ma between Cetaceaand hippopotamus, 4 34.1 Ma between baleen and toothedwhales, 42.8–63.8 Ma between Caniformia and Feliformia, and62.3–71.2 Ma between Carnivora and Perissodactyla; seeNomura et al. 2013; Jiang et al. 2014). We applied the ob-tained O. aries/O. vignei divergence time (2.6 Ma; see Results)and three models to estimate the divergence times betweenthe five O. aries mtDNA lineages. Global and local clockmodels were implemented using the ML in PAML v.4.7(Yang 2007) and the uncorrelated relaxed-clock modelwas implemented using BEAST v.1.7.5 (Drummond andRambaut 2007).
We only considered the 61 complete mitogenomes of wildsheep species and native breeds of domestic sheep (supple-mentary table S1; Supplementary Material online) and ap-plied three strategies in the ML analysis: One consideredthe complete mitogenomes under the TN93 model, thesecond considered the synonymous mutations under theHKY85 model, and the third considered only the third-codon positions under the HKY85 model. Similarly,Bayesian Markov chain Monte Carlo (MCMC) analysis of mo-lecular sequences was performed by applying the three stra-tegies in the program BEAST v.1.7.5 (Drummond andRambaut 2007). Parameters of prior distributions, includingmodels of nucleotide substitution and the divergence timebetween O. aries and O. vignei, were set the same as in the MLanalyses described above. Three independent runs were per-formed with 50 million iterations. Samples were drawn every5,000 MCMC steps, with the first 25% samples discarded asburn-in. The results of the three independent runs were com-bined using the LogCombiner program (available at http://beast.bio.ed.ac.uk/LogCombiner, last accessed October 16,2014) from BEAST v.1.7.5 (Drummond and Rambaut 2007).Convergence was confirmed by effective sampling size (ESS)greater than 200 using the program Tracer v.1.5 (Drummondand Rambaut 2007; available at http://beast.bio.ed.ac.uk/Tracer, last accessed December 26, 2014).
BI of Population Expansions
Based on the divergence time of internal nodes estimatedabove and the 51 complete mitogenomes of native domesticsheep breeds, we reconstructed the change in Ne of O. ariesthrough time using BSPs (Drummond et al. 2005). The ana-lyses were also performed on the partial Cyt-b and controlregion sequences. We ran three independent chains in eachanalysis using BEAST v.1.7.5 (Drummond and Rambaut 2007),with 50 million generations (after discarding the first 10% ofsampled generations as burn-in) and samples drawn every5,000 steps. We applied the HKY85 and TN93 modelsunder relaxed-clock model for complete mitogenomes andpartial Cyt-b sequences, respectively. In the analysis of controlregion sequences, we set similar parameter values of 200 mil-lion generations (after discarding the first 10% of sampledgenerations as burn-in) with samples drawn every 2,000steps under the HKY85 and relaxed-clock models. The com-bination of three independent results and checks of conver-gence were performed following the same procedures asdescribed above.
Signatures of population expansions were examined usingArlequin v.3.5 (Excoffier and Lischer 2010). First, the observedand expected mismatch distributions of pairwise differencesbetween haplotypes were compared using Tajima’s D (Tajima1989) and Fu’s Fs (Fu 1997) tests of neutrality. Furthermore,we estimated the parameters for the sudden population ex-pansion model (Rogers 1995), and the fit of the data to thesudden population expansion model was tested.Harpending’s raggedness index (rH; Harpending 1994) of theobserved mismatch distribution was also calculated. P valuesof the SSDs test to evaluate the fit and significance for theparameters (rH, D, and Fs) were determined with 1,000 coa-lescent simulations using Arlequin v.3.5 (Excoffier and Lischer2010). All the partial control region sequences were includedin the calculations.
Further, to corroborate our inference that the MongolianPlateau region serves as a “transportation hub” in easternEurasia (see Results), we distinguished several candidate co-lonization scenarios for the three main O. aries lineages (A, B,and C) using the ABC (Beaumont et al. 2002) procedure inDIYABC v.2.0.4 (Cornuet et al. 2014). By incorporating all theO. aries control region sequences of a 292-bp-long hyperva-riable fragment, we tested six, eight, and five colonizationmodels regarding potential migration routes from theMiddle Eastern domestication center to different regions ineastern Eurasia (e.g., the Mongolian Plateau region, NorthChina, Southwest China, and the Indian subcontinent) forthe lineages A, B, and C, respectively (supplementary fig.S25, Supplementary Material online). Detailed informationabout the ABC analyses including the candidate colonizationmodels tested was provided in supplementary informationS4, Supplementary Material online.
Supplementary MaterialSupplementary information S1–S4, figures S1–S25, and tablesS1–S19 are available at Molecular Biology and Evolution online(http://www.mbe.oxfordjournals.org/).
2530
Lv et al. . doi:10.1093/molbev/msv139 MBE at A
cquisitions on March 14, 2016
http://mbe.oxfordjournals.org/
Dow
nloaded from
Acknowledgments
The authors thank San-Gang He, Ya-Wei Sun, NurbiMarzanov, Mikhail Ozerov, Maciek Murawski, TatianaKiseleva, and the late Mirjana Cinkulov for help in samplecollection, Anneli Virta for technical assistance, and DrAlessandro Achilli (Universit�a di Perugia, Perugia, Italy) forhis comments on an earlier version of the manuscript. Thiswork was supported by the 100-talent Program of ChineseAcademy of Sciences (CAS), the National High TechnologyResearch and Development Program of China (i.e., 863Program, grant No. 2013AA102506), the BreakthroughProject of Strategic Priority Program of the ChineseAcademy of Sciences (grant No. XDB13000000), the grantsfrom National Natural Science Foundation of China (grantsNos. 31272413 and U1303284), and Academy of Finland(grants Nos. 250633 and 256077) as well as ChineseGovernment contribution to CAAS-ILRI Joint Laboratory onLivestock and Forage Genetic Resources in Beijing. The papercontributes to the CGIAR Research Program on Livestock andFish.
ReferencesAchilli A, Bonfiglio S, Olivieri A, Malus�a A, Pala M, Kashani BH, Perego
UA, Ajmone-Marsan P, Liotta L, Semino O, et al. 2009. The multi-faceted origin of taurine cattle reflected by the mitochondrialgenome. PLoS One 4:e5753.
Achilli A, Olivieri A, Soares P, Lancioni H, Kashani BH, Perego UA,Nergadze SG, Carossa V, Santagostino M, Capomaccio S, et al.2012. Mitochondrial genomes from modern horses reveal themajor haplogroups that underwent domestication. Proc Natl AcadSci U S A. 109:2449–2454.
Altschul SF, Madden TL, Sch€affer AA, Zhang J, Zhang Z, Miller W,Lipman DJ. 1997. Gapped BLAST and PSI-BLAST: a new generationof protein database search programs. Nucleic Acids Res.25:3389–3402.
Aniwashi J, Jiahan K, Hakaimofu H, Sulaiman Y, Xi S-Y, Du M, Hailati,Tuersenhali, Ayinuer. 2007. Study on hybridication of wild argali andBashibai sheep. Xinjiang Agric Sci. 44:702–705 (in Chinese).
Bandelt HJ, Forster P, R€ohl A. 1999. Median-joining networks for infer-ring intraspecific phylogenies. Mol Biol Evol. 16:37–48.
Bar-Yosef O, Meadow R. 1995. The origins of agriculture in the Near East.In: Price T, Gebauer A-B, editors. Last hunters, first farmers. Santa Fe:School of American Research Press. p. 39–94.
Beaumont MA, Zhang W, Balding DJ. 2002. Approximate Bayesian com-putation in population genetics. Genetics 162:2025–2035.
Bj€ornerfeldt S, Webster MT, Vil�a C. 2006. Relaxation of selective con-straint on dog mitochondrial DNA following domestication.Genome Res. 16:990–994.
Bruford MW. 2005. Molecular approaches to understanding animaldomestication: what have we learned so far? World PoultryScience Association, 4th European Poultry Genetics Symposium.Dubrovnik, Croatia, 6–8 October, 2005
Cai DW, Han L, Zhang XL, Zhou H, Zhu H. 2007. DNA analysis ofarchaeological sheep remains from China. J Archaeol Sci.34:1347–1355.
Cai DW, Tang ZW, Yu HX, Han L, Ren XY, Zhao XB, Zhu H, Zhou H.2011. Early history of Chinese domestic sheep indicated by ancientDNA analysis of Bronze Age individuals. J Archaeol Sci. 38:896–902.
Carruthers D. 1949. Beyond the Caspian. A naturalist in Central Asia.Edinburgh: Oliver and Boyd.
Chen FH, Dong GH, Zhang DJ, Liu XY, Jia X, An CB, Ma MM, Xie YW,Barton L, Ren XY, et al. 2015. Agriculture facilitated permanenthuman occupation of the Tibetan Plateau after 3600 B.P. Science347:248–250.
Chen SY, Duan ZY, Sha T, Xiangyu J, Wu SF, Zhang YP. 2006. Origin,genetic diversity, and population structure of Chinese domesticsheep. Gene 376:216–223.
Chen WH. 1990. Index to data of agricultural archaeology-farm-tools.Agric Archaeol. 1:425–427. (in Chinese)
Chessa B, Pereira F, Arnaud F, Amorim A, Goyache F, Mainland I, KaoRR, Pemberton JM, Beraldi D, Stear MJ, et al. 2009. Revealing thehistory of sheep domestication using retrovirus integrations. Science324:532–536.
Colledge S, Conolly J, Shennan S. 2005. The evolution of Neolithic far-ming from SW Asian origins to NW European limits. Eur J Archaeol.8:137–156.
Cornuet J-M, Pudlo P, Veyssier J, Dehne-Garcia A, Gautier M,Leblois R, Marin J-M, Estoup A. 2014. DIYABC v2.0: a softwareto make approximate Bayesian computation inferencesabout population history using single nucleotide polymor-phism, DNA sequence and microsatellite data. Bioinformatics30:1187–1189.
Crandall KA, Kelsey CR, Imamichi H, Lane HC, Salzman NP. 1999. Parallelevolution of drug resistance in HIV: failure of nonsynonymous/sy-nonymous substitution rate ratio to detect selection. Mol Biol Evol.16:372–382.
Darriba D, Taboada GL, Doallo R, Posada D. 2012. jModelTest 2:more models, new heuristics and parallel computing. NatMethods. 9:772.
Demirci S, Koban Bastanlar E, Da�gtas ND, Piskin E, Engin A, €Ozer F,Y€unc€u E, Do�gan SA, Togan _I. 2013. Mitochondrial DNA diversity ofmodern, ancient and wild sheep (Ovis gmelinii anatolica) fromTurkey: new insights on the evolutionary history of sheep. PLoSOne 8:e81952.
Dobney K, Larson G. 2006. Genetics and animal domestication: newwindows on an elusive process. J Zool. 269:261–271.
Drummond AJ, Rambaut A. 2007. BEAST: Bayesian evolutionary analysisby sampling trees. BMC Evol Biol. 7:214.
Drummond AJ, Rambaut A, Shapiro B, Pybus OG. 2005. Bayesian coa-lescent inference of past population dynamics from molecular se-quences. Mol Biol Evol. 22:1185–1192.
Excoffier L, Lischer HEL. 2010. Arlequin suite ver 3.5: a new series ofprograms to perform population genetics analyses under Linux andWindows. Mol Ecol Resour. 10:564–567.
Felsenstein J. 1985. Confidence limits on phylogenies: an approach usingthe bootstrap. Evolution 39:783–791.
Fu Y-X. 1997. Statistical tests of neutrality of mutations against popula-tion growth, hitchhiking and background selection. Genetics147:915–925.
Gauri FN. 2013. Indo-Saudi trade relation. Arabian Journal of Businessand Management Review (Nigerian Chapter) 1(2):45–57.
Goldman N, Yang Z. 1994. A codon-based model of nucleotidesubstitution for protein-coding DNA sequences. Mol Biol Evol.11:725–736.
Grant WS, Liu M, Gao T, Yanagimoto T. 2012. Limits of Bayesian skylineplot analysis of mtDNA sequences to infer historical demographiesin Pacific herring (and other species). Mol Phylogenet Evol.65:203–212.
Guindon S, Gascuel O. 2003. A simple, fast, and accurate algorithm toestimate large phylogenies by maximum likelihood. Syst Biol.52:696–704.
Guo J, Du LX, Ma YH, Guan WJ, Li HB, Zhao QJ, Li X, Rao SQ. 2005. Anovel maternal lineage revealed in sheep (Ovis aries). Anim Genet.36:331–336.
Hanotte O, Bradley DG, Ochieng JW, Verjee Y, Hill EW, Rege JEO. 2002.African pastoralism: genetic imprints of origins and migrations.Science 296:336–339.
Harpending H. 1994. Signature of ancient population growth in a low-resolution mitochondrial DNA mismatch distribution. Hum Biol.66:591–600.
Hasegawa M, Kishino H, Yano T-A. 1985. Dating of the human-apesplitting by a molecular clock of mitochondrial DNA. J Mol Evol.22:160–174.
2531
Ovine Mitogenomic Variations across Eastern Eurasia . doi:10.1093/molbev/msv139 MBE at A
cquisitions on March 14, 2016
http://mbe.oxfordjournals.org/
Dow
nloaded from

Heller R, Chikhi L, Siegismund HR. 2013. The confounding effect ofpopulation structure on Bayesian skyline plot inferences of demo-graphic history. PLoS One 8:e62992.
Hiendleder S, Lewalski H, Wassmuth R, Janke A. 1998. The completemitochondrial DNA sequence of the domestic sheep (Ovis aries)and comparison with the other major ovine haplotype. J Mol Evol.47:441–448.
Hiendleder S, Mainz K, Plante Y, Lewalski H. 1998. Analysis of mitochon-drial DNA indicates that domestic sheep are derived from two dif-ferent ancestral maternal sources: no evidence for contributionsfrom urial and argali sheep. J Hered. 89:113–120.
Ho SYW. 2014. The changing face of the molecular evolutionary clock.Trends Ecol Evol. 29:496–503.
Ho SYW, Duchene S. 2014. Molecular-clock methods for estimatingevolutionary rates and timescales. Mol Ecol. 23:5947–5965.
Ho SYW, Lanfear R, Bromham L, Phillips MJ, Soubrier J, Rodrigo AG,Cooper A. 2011. Time-dependent rates of molecular evolution. MolEcol. 20:3087–3101.
Ho SYW, Shapiro B. 2011. Skyline-plot methods for estimating demo-graphic history from nucleotide sequences. Mol Ecol Resour.11:423–434.
Hodges J. 1999. Animals and values in society. Livest Res Rural Dev.11:1–6.
Hunt HV, Vander Linden M, Liu X, Motuzaite-Matuzeviciute G, ColledgeS, Jones MK. 2008. Millets across Eurasia: chronology and context ofearly records of the genera Panicum and Setaria from archaeologicalsites in the Old World. Veg Hist Archaeobot. 17:5–18.
Jiang Y, Xie M, Chen W, Talbot R, Maddox JF, Faraut T, Wu C, MuznyDM, Li Y, Zhang W, et al. 2014. The sheep genome illuminatesbiology of the rumen and lipid metabolism. Science 344:1168–1173.
Jones MK, Liu X. 2009. Origins of agriculture in East Asia. Science324:730–731.
Joost S, Bonin A, Bruford MW, Despres L, Conord C, Erhardt G, TaberletP. 2007. A spatial analysis method (SAM) to detect candidate loci forselection: towards a landscape genomics approach to adaptation.Mol Ecol. 16:3955–3969.
Kijas JW, Lenstra JA, Hayes B, Boitard S, Neto LRP, San Cristobal M,Servin B, McCulloch R, Whan V, Gietzen K, et al. 2012. Genome-wide analysis of the world’s sheep breeds reveals high levels of his-toric mixture and strong recent selection. PLoS Biol. 10:e1001258.
Kijas JW, Townley D, Dalrymple BP, Heaton MP, Maddox JF, McGrath A,Wilson P, Ingersoll RG, McCulloch R, McWilliam S, et al. 2009. Agenome wide survey of SNP variation reveals the genetic structure ofsheep breeds. PLoS One 4:e4668.
Kumar S. 2005. Molecular clocks: four decades of evolution. Nat RevGenet. 6:654–662.
Kuo F, Needham J, Chheng CT. 1999. The history of zoology in China.Beijing (China): Science Press. (in Chinese)
Lancioni H, Di Lorenzo P, Ceccobelli S, Perego UA, Miglio A, Landi V,Antognoni MT, Sarti FM, Lasagna E, Achilli A. 2013. Phylogeneticrelationships of three Italian Merino-derived sheep breeds evaluatedthrough a complete mitogenome analysis. PLoS One 8:e73712.
Larkin MA, Blackshields G, Brown NP, Chenna R, McGettigan PA,McWilliam H, Valentin F, Wallace IM, Wilm A, Lopez R, et al.2007. Clustal W and Clustal X version 2.0. Bioinformatics23:2947–2948.
Larson G, Albarella U, Dobney K, Rowley-Conwy P, Schibler J, Tresset A,Vigne J-D, Edwards CJ, Schlumbaum A, Dinu A, et al. 2007. AncientDNA, pig domestication, and the spread of the Neolithic intoEurope. Proc Natl Acad Sci U S A. 104:15276–15281.
Larson G, Burger J. 2013. A population genetics view of animal dome-stication. Trends Genet. 29:197–205.
Larson G, Liu R, Zhao X, Yuan J, Fuller D, Barton L, Dobney K, Fan Q, GuZ, Liu X-H, et al. 2010. Patterns of East Asian pig domestication,migration, and turnover revealed by modern and ancient DNA. ProcNatl Acad Sci U S A. 107:7686–7691.
Lippold S, Matzke NJ, Reissmann M, Hofreiter M. 2011. Whole mito-chondrial genome sequencing of domestic horses reveals
incorporation of extensive wild horse diversity during domestica-tion. BMC Evol Biol. 11:328.
Lu H, Zhang J, Liu K-B, Wu N, Li Y, Zhou K, Ye M, Zhang T, Zhang H,Yang X, et al. 2009. Earliest domestication of common millet(Panicum miliaceum) in East Asia extended to 10,000 years ago.Proc Natl Acad Sci U S A. 106:7367–7372.
Luikart G, Gielly L, Excoffier L, Vigne J-D, Bouvet J, Taberlet P. 2001.Multiple maternal origins and weak phylogeographic structure indomestic goats. Proc Natl Acad Sci U S A. 98:5927–5932.
Luo Y-Z, Cheng S-R, Lkhagva B, Badamdorj D, Hanotte O, Han J-L. 2005.Study on origin and genetic diversity of Mongolian and Chinesesheep. Acta Genet Sin. 32:1256–1265. (in Chinese)
Lv F-H, Agha S, Kantanen J, Colli L, Stucki S, Kijas JW, Joost S, Li M-H,Marsan PA. 2014. Adaptations to climate-mediated selective pres-sures in sheep. Mol Biol Evol. 31:3324–3343.
Meadows JR, Cemal I, Karaca O, Gootwine E, Kijas JW. 2007. Five ovinemitochondrial lineages identified from sheep breeds of the NearEast. Genetics 175:1371–1379.
Meadows JRS, Hiendleder S, Kijas JW. 2011. Haplogroup relationshipsbetween domestic and wild sheep resolved using a mitogenomepanel. Heredity 106:700–706.
Muigai AT, Hanotte O. 2013. The origin of African sheep: archaeologicaland genetic perspectives. Afr Archaeol Rev. 30:39–50.
Naderi S, Rezaei H-R, Pompanon F, Blum MGB, Negrini R, Naghash H-R,Balkız €O, Mashkour M, Gaggiotti OE, Ajmone-Marsan P, et al. 2008.The goat domestication process inferred from large-scale mitochon-drial DNA analysis of wild and domestic individuals. Proc Natl AcadSci U S A. 105:17659–17664.
Niemi M, Bl€auer A, Iso-Touru T, Nystr€om V, Harjula J, Taavitsainen J-P,Stora J, Lid�en K, Kantanen J. 2013. Mitochondrial DNA and Y-chro-mosomal diversity in ancient populations of domestic sheep (Ovisaries) in Finland: comparison with contemporary sheep breeds.Genet Sel Evol. 45:2.
Nomura K, Yonezawa T, Mano S, Kawakami S, Shedlock AM, HasegawaM, Amano T. 2013. Domestication process of the goat revealed byan analysis of the nearly complete mitochondrial protein-encodinggenes. PLoS One 8:e67775.
Pe H. 1959. G. H. Luce and Pe Maung Tin (ed.): Inscriptions of Burma.Portfolio IV. Down to 702 B.E. (1340 A.D.).—Portfolio V. 703–726B.E. (1341–1364 A.D.). (University of Rangoon Oriental StudiesPublication No. 5, No. 6.) 63 pp., plates 346–462; 38 pp., plates463–609. Oxford: University Press, 1956. Bull Sch Orient Afr Stud.22:177.
Pedrosa S, Uzun M, Arranz JJ, Gutierrez-Gil B, San Primitivo F, Bayon Y.2005. Evidence of three maternal lineages in Near Eastern sheepsupporting multiple domestication events. Proc R Soc Lond B BiolSci. 272:2211–2217.
Peng M-S, Zhang Y-P. 2011. Inferring the population expansions inpeopling of Japan. PLoS One 6:e21509.
Pereira L, Silva NM, Franco-Duarte R, Fernandes V, Pereira JB, Costa MD,Martins H, Soares P, Behar DM, Richards MB, et al. 2010. Populationexpansion in the North African Late Pleistocene signalled by mito-chondrial DNA haplogroup U6. BMC Evol Biol. 10:390.
Peters J, von den Driesch A, Helmer D. 2005. The upper Euphrates-Tigrisbasin: cradle of agro-pastoralism. In: Vigne JD, Peters J, Helmer D,editors. The first steps of animal domestication. Oxford: Oxbow. pp.96–124.
Pickrell JK, Pritchard JK. 2012. Inference of population splits and mixturesfrom genome-wide allele frequency data. PLoS Genet. 8:e1002967.
Poplin F. 1979. Origine du mouflon de Corse dans une nouvelle per-spective pal�eontologique: par marronnage. Ann G�en�et S�el Anim.11:133–134.
Posada D. 2008. jModelTest: phylogenetic model averaging. Mol BiolEvol. 25:1253–1256.
R Core Team. 2014. R: a language and environment for statistical com-puting. Vienna (Austria): R Foundation for Statistical Computing.
Reynolds J, Weir BS, Cockerham CC. 1983. Estimation of the co-ancestrycoefficient—basis for a short-term genetic-distance. Genetics105:767–779.
2532
Lv et al. . doi:10.1093/molbev/msv139 MBE at A
cquisitions on March 14, 2016
http://mbe.oxfordjournals.org/
Dow
nloaded from
Rezaei HR, Naderi S, Chintauan-Marquier IC, Taberlet P, Virk AT,Naghash HR, Rioux D, Kaboli M, Pompanon F. 2010. Evolutionand taxonomy of the wild species of the genus Ovis (Mammalia,Artiodactyla, Bovidae). Mol Phylogenet Evol. 54:315–326.
Rogers AR. 1995. Genetic evidence for a Pleistocene population explo-sion. Evolution 49:608–615.
Ronquist F, Huelsenbeck J, Teslenko M. 2011. Draft MrBayes version 3.2Manual: tutorials and model summaries. Available from:http://mrbayes.sourceforge.net/.
Rozas J, S�anchez-DelBarrio JC, Messeguer X, Rozas R. 2003. DnaSP, DNApolymorphism analyses by the coalescent and other methods.Bioinformatics 19:2496–2497.
Ryder ML. 1983. Sheep and man. London: Duckworth.Ryder ML. 1984. Sheep. In: Mason IL, editor. Evolution of domesticated
animals. London/New York: Longman. pp. 63–85.Sambrook J, Russell DW. 2001. Molecular cloning: a laboratory manual.
3rd ed. New York: Cold Spring Harbor Laboratory Press.Scherf BD, editor. 2000. World watch list for domestic animal diversity.
In: Food and Agriculture Organization of the United Nations. Rome:Food and Agriculture Organization of the United Nations. p. 58.
Shaha R. 1970. Nepal, Tibet and China. J Nepal Council World Aff.3:13–82.
Shi N-N, Fan L, Yao Y-G, Peng M-S, Zhang Y-P. 2014. Mitochondrialgenomes of domestic animals need scrutiny. Mol Ecol.23:5393–5397.
Singh S, Kumar S Jr, Kolte AP, Kumar S. 2013. Extensive variation andsub-structuring in lineage A mtDNA in Indian sheep: genetic evi-dence for domestication of sheep in India. PLoS One 8:e77858.
Taberlet P, Valentini A, Rezaei HR, Naderi S, Pompanon F, Negrini R,Ajmone-Marsan P. 2008. Are cattle, sheep, and goats endangeredspecies? Mol Ecol 17:275–284.
Tajima F. 1989. Statistical method for testing the neutral mutation hy-pothesis by DNA polymorphism. Genetics 123:585–595.
Tamura K, Nei M. 1993. Estimation of the number of nucleotide sub-stitutions in the control region of mitochondrial DNA in humansand chimpanzees. Mol Biol Evol. 10:512–526.
Tamura K, Peterson D, Peterson N, Stecher G, Nei M, Kumar S. 2011.MEGA5: molecular evolutionary genetics analysis using maximumlikelihood, evolutionary distance, and maximum parsimony me-thods. Mol Biol Evol. 28:2731–2739.
Tapio M, Marzanov N, Ozerov M, Cinkulov M, Gonzarenko G, KiselyovaT, Murawski M, Viinalass H, Kantanen J. 2006. Sheep mitochondrialDNA variation in European, Caucasian, and Central Asian areas. MolBiol Evol. 23:1776–1783.
Tapio M, Ozerov M, Tapio I, Toro MA, Marzanov N, Cinkulov M,Goncharenko G, Kiselyova T, Murawski M, Kantanen J. 2010.Microsatellite-based genetic diversity and population structure ofdomestic sheep in northern Eurasia. BMC Genet. 11:76.
Torroni A, Achilli A, Macaulay V, Richards M, Bandelt H-J. 2006. Harvestingthe fruit of the human mtDNA tree. Trends Genet. 22:339–345.
Wang G-D, Xie H-B, Peng M-S, Irwin D, Zhang Y-P. 2014. Domesticationgenomics: evidence from animals. Annu Rev Anim Biosci. 2:65–84.
Wang X, Ma Y-H, Chen H. 2006. Analysis of the genetic diversity and thephylogenetic evolution of Chinese sheep based on Cyt b gene se-quences. Acta Genet Sin. 33:1081–1086.
Wang Z, Yonezawa T, Liu B, Ma T, Shen X, Su J, Guo S, Hasegawa M, LiuJ. 2011. Domestication relaxed selective constraints on the yak mito-chodrial genomes. Mol Biol Evol. 28:1553–1556.
Warmuth V, Eriksson A, Bower MA, Barker G, Barrett E, Hanks BK, Li S,Lomitashvili D, Ochir-Goryaeva M, Sizonov GV, et al. 2012.Reconstructing the origin and spread of horse domestication inthe Eurasian steppe. Proc Natl Acad Sci U S A. 109:8202–8206.
Wood NJ, Phua SH. 1996. Variation in the control region sequence of thesheep mitochondrial genome. Anim Genet. 27:25–33.
Wu GS, Yao YG, Qu KX, Ding ZL, Li H, Palanichamy MG, Duan ZY, Li N,Chen YS, Zhang YP. 2007. Population phylogenomic analysis of mi-tochondrial DNA in wild boars and domestic pigs revealed multipledomestication events in East Asia. Genome Biol. 8:R245.
Xiang H, Gao J, Yu B, Zhou H, Cai D, Zhang Y, Chen X, Wang X, HofreiterM, Zhao X. 2014. Early Holocene chicken domestication in northernChina. Proc Natl Acad Sci U S A. 111:17564–17569.
Yang X, Scuderi LA, Wang X, Scuderi LJ, Zhang D, Li H, Forman S, XuQ, Wang R, Huang W, et al. 2015. Groundwater sapping as thecause of irreversible desertification of Hunshandake Sandy Lands,Inner Mongolia, northern China. Proc Natl Acad Sci U S A.112:702–706.
Yang X, Wan Z, Perry L, Lu H, Wang Q, Zhao C, Li J, Xie F, Yu J, Cui T,et al. 2012. Early millet use in northern China. Proc Natl Acad Sci U SA. 109:3726–3730.
Yang Z. 1998. Likelihood ratio tests for detecting positive selection andapplication to primate lysozyme evolution. Mol Biol Evol.15:568–573.
Yang Z. 2007. PAML 4: phylogenetic analysis by maximum likelihood.Mol Biol Evol. 24:1586–1591.
Yao Y-G, Salas A, Logan I, Bandelt H-J. 2009. mtDNA data mining inGenBank needs surveying. Am J Hum Genet. 85:929–933.
Yi H. 2004. Bronze roads: a introduction to archaic cultural exchange inEurasia. In: Department of Cultural Heritage and Museum Studies,editor. Antiquities of Eastern Asia. Beijing (China): Cultural RelicsPress. (in Chinese)
Zeder MA. 2008. Domestication and early agriculture in theMediterranean Basin: origins, diffusion, and impact. Proc NatlAcad Sci U S A. 105:11597–11604.
Zeder MA, Emshwiller E, Smith BD, Bradley DG. 2006. Documentingdomestication: the intersection of genetics and archaeology. TrendsGenet. 22:139–155.
Zhang H, Paijmans JLA, Chang F, Wu X, Chen G, Lei C, Yang X, Wei Z,Bradley DG, Orlando L, et al. 2013. Morphological and geneticevidence for early Holocene cattle management in northeasternChina. Nat Commun. 4:2755.
2533
Ovine Mitogenomic Variations across Eastern Eurasia . doi:10.1093/molbev/msv139 MBE at A
cquisitions on March 14, 2016
http://mbe.oxfordjournals.org/
Dow
nloaded from