mitchell adair january, 2014 - computer science,...
TRANSCRIPT
Mitchell Adair
January, 2014
Know Owen from our time at Sandia National Labs
Currently work for Raytheon
Founded UTDallas’s Computer Security Group (CSG) in
Spring 2010
Reversing, binary auditing, fuzzing, exploit dev, pen testing…
Python


At the end of this, you should feel comfortable
o Being handed a binary
o Examining a binaries sections, imports, strings
o Renaming and simplifying the disassembly
o Converting from assembly to source, where needed
o Understanding process memory layout
o Figuring out function arguments and local variables
• How many and what types
o Using a debugger to fill in the gaps or manipulate program execution

Static vs Dynamic (overview)
PE and ELF
Assembly
Registers
The Stack
Functions
IDA
Debugging
Note on Bytecode
Conclusion
Try to reverse
Learn something new
Apply the new knowledge

Static
o Looking at the code, figure things out
o It’s all there, but possibly more complicated
o A safer approach
• Not running the code!
Dynamic
o Examine the process during execution
o Can see the values in real time
• Registers, memory contents, etc.
o Allows manipulation of the process
o Should run in a VM!

Disassemblers are usually the tool of choice for static
o IDA Pro, objdump, etc.
Debuggers are used for dynamic analysis
o Windows
• WinDBG, Immunity, OllyDBG, IDA
o Linux
• GDB

A good disassembler will have several useful features
o Commenting
o Renaming variables
o Changing function prototypes
o Coloring, grouping and renaming nodes (IDA)
o …
A good debugger will have several useful features
o Set breakpoints
o Step into / over
o Show loaded modules, SEH chain, etc.
o Memory searching
o …

Okay, no more!
We’ll be going into each of these heavily.
That was just a high level overview to understand
o The difference between static and dynamic analysis
o The general approach taken between the two


PE (Portable Executable)
o “File format for executables, object code and DLLs, used in 32-bit
and 64-bit versions of Windows operating systems” – wikipedia
ELF (Executable and Linkable Format)
o “A common standard file format for executables, object code,
shared libraries, and core dumps” – wikipedia
o Linux, Unix, Apple OS

Image from http://software.intel.com/sites/default/files/m/d/4/1/d/8/keep-memory-002.gif

We could go very, very deep into file formats… but let’s not
Each format is just a big collection of fields and sections
Fields will have a particular meaning and hold a particular
value
o Date created, last modified, number of sections, image base, etc.
A section is, generally, a logical collection of code or data
o Has permissions (read/write/execute)
o Has a name (.text, .bss, etc.)

Okay, so what? Why is this useful?
Can get an overview of what the binary is doing
o Can look at what libraries the binary is loading
o Can look at what functions are used in a library
• Find vulns
o Can parse data sections for strings
• Very helpful on CTFs
o Can help determine if a binary is packed
• Weird section names or sizes, lack of strings, lack of imports
How do we analyze them?
o PE : CFF Explorer, IDA, pefile (python library), …
o ELF : readelf, objdump, file, …
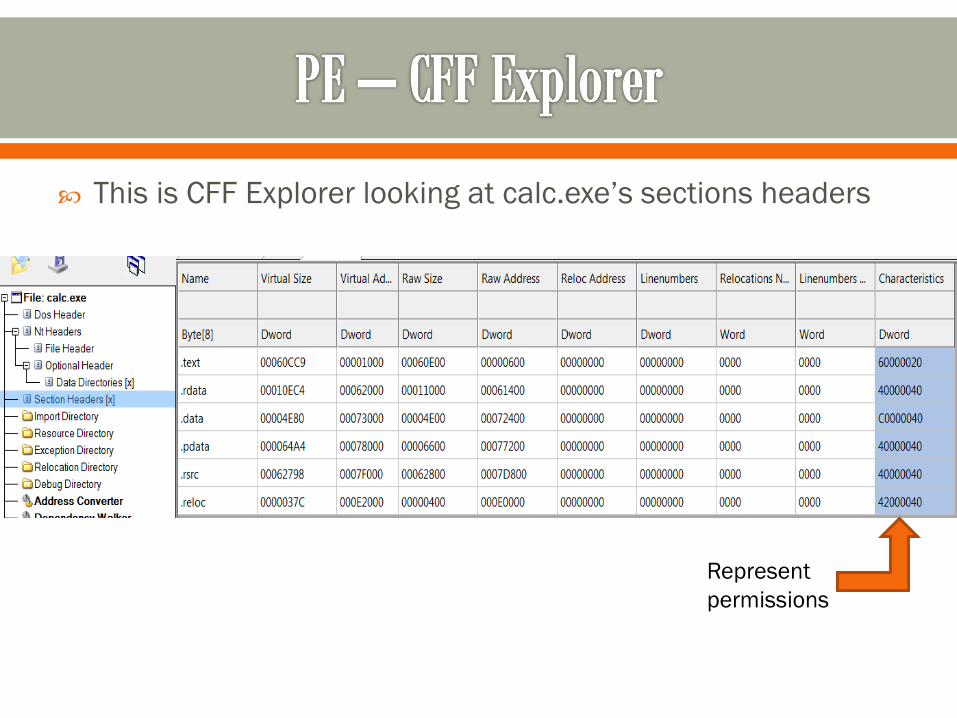
This is CFF Explorer looking at calc.exe’s sections headers
Represent
permissions

This is CFF Explorer looking at a UPX packed executable
from a recent CTF
Huge red flag with section names like this

This is using readelf to look at section headers
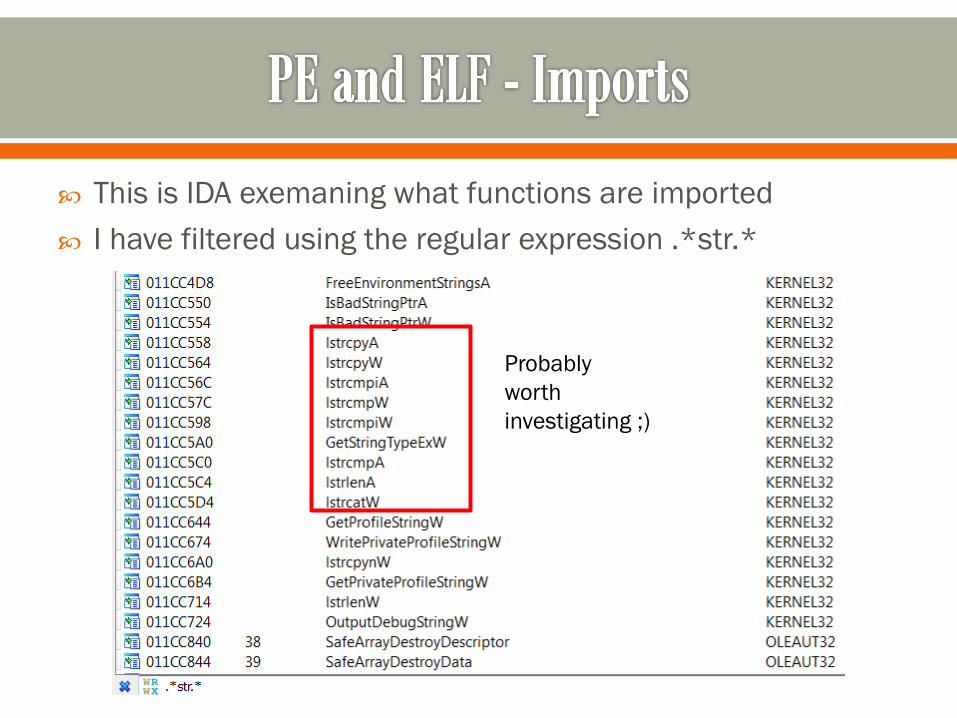
This is IDA exemaning what functions are imported
I have filtered using the regular expression .*str.*
Probably
worth
investigating ;)

This is IDA examining strings it has found for a recent CTF problem
Probably want to start from the “Get your flag %s\n” string and work backwards ;)

Open number_checker.exe and
number_checker_packed.exe
Compare these two!
In CFF Explorer
o Look at different fields in the PE format
o Look at sections
o Just explore
In IDA
o Look at strings (shift+f12)
o Look at imports (view->open subviews->imports)
o Look at sections (shift+f7)

Two syntax options
o ATT
o Intel
ATT
o instruction source, dest
o mov %eax, %edx
o “Move eax into edx”
Intel
o instruction dest, source
o mov edx, eax
o “Move into edx, eax”

It’s a known fact that Intel’s syntax > ATT’s, so we’ll be using
Intels ;)
mov eax, ecx
o Move into eax, the contents of ecx
mov eax, [ecx]
o Move into eax, the contents of what ecx points to
o The brackets, […], mean dereference the value between them
o In C, this is like a pointer dereference
o eax = *ecx

Memory values and immediates can be used as well
mov eax, 5
o Move into eax, the value 5
mov edx, [0x12345678]
o Move into edx, what 0x12345678 points to

A very small handful of instructions will get you a long way
o call, mov, cmp, jmp
call 0x12345678
o Call the function at 0x12345678
cmp eax, 8
o Compare eax to 8
o Compare left to right
jmp 0x12345678
o Unconditional jump to 0x12345678
jle 0x12345678
o Jump to 0x12345678 if eax is less than or equal to 8
jg 0x12345678
o Jump to 0x112345678 if eax is greater than 8


Let’s focus on the instructions we know
o mov, cmp, jmp, call
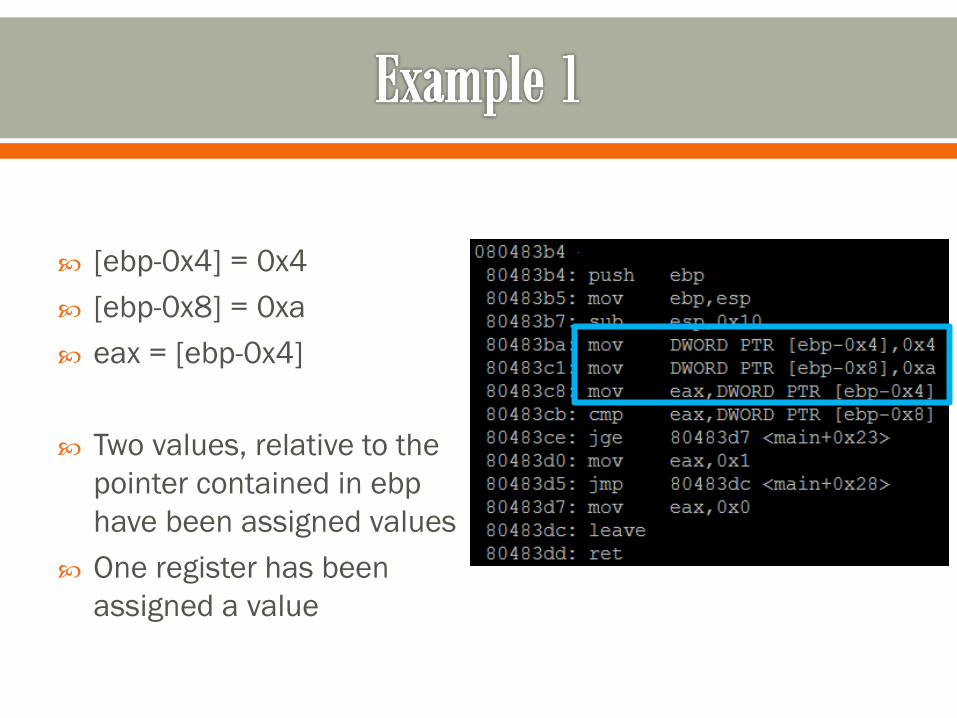
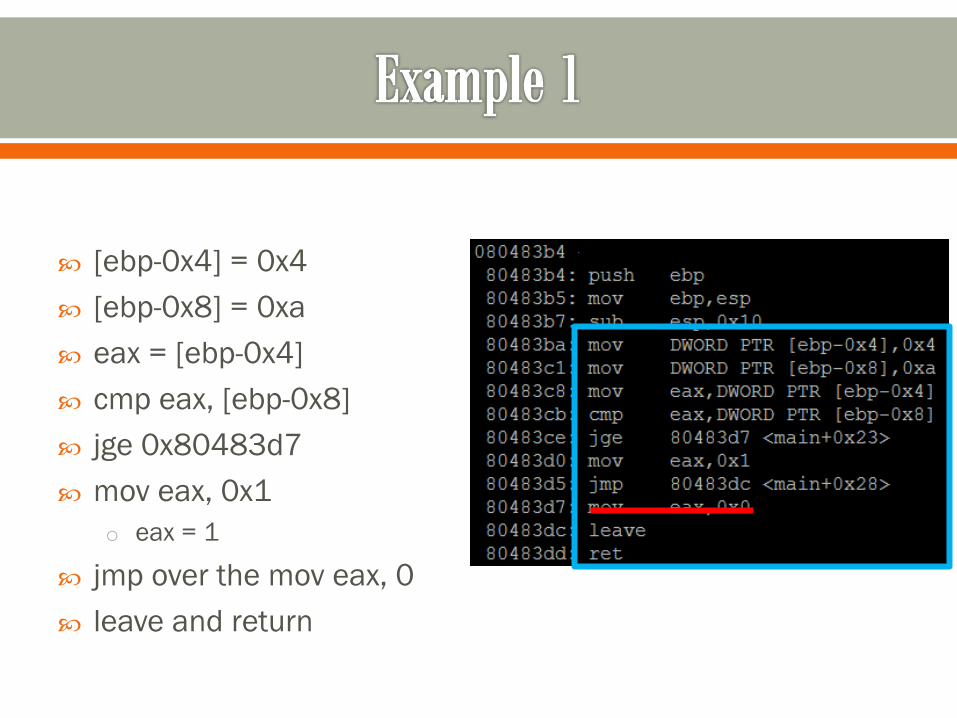
[ebp-0x4] = 0x4
[ebp-0x8] = 0xa
eax = [ebp-0x4]
Two values, relative to the
pointer contained in ebp
have been assigned values
One register has been
assigned a value

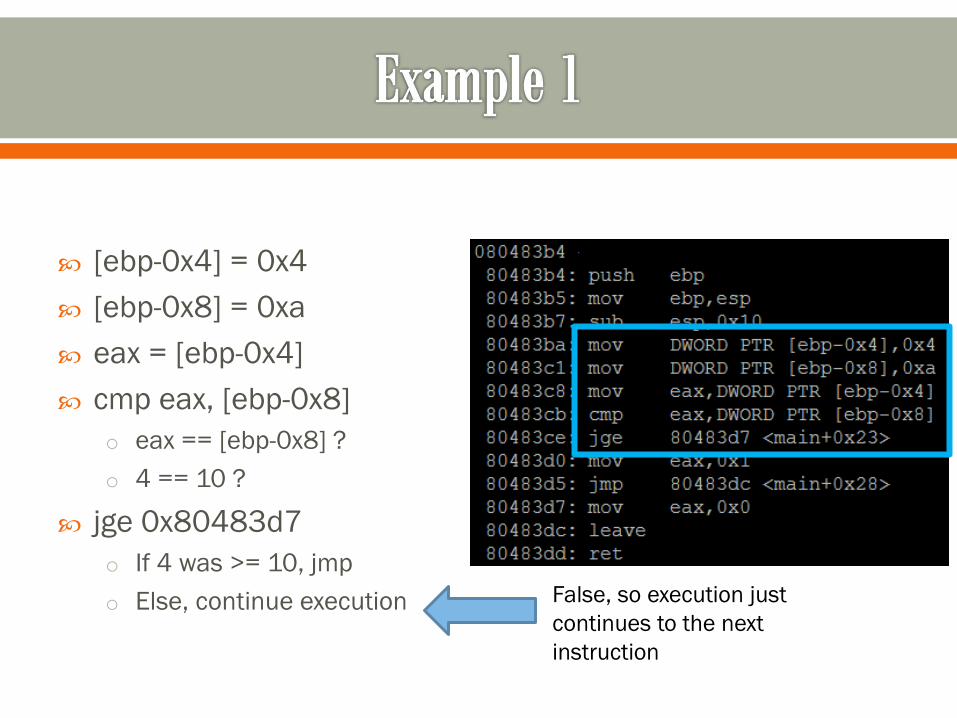
[ebp-0x4] = 0x4
[ebp-0x8] = 0xa
eax = [ebp-0x4]
cmp eax, [ebp-0x8]
o eax == [ebp-0x8] ?
o 4 == 10 ?
jge 0x80483d7
o If 4 was >= 10, jmp
o Else, continue execution
[ebp-0x4] = 0x4
[ebp-0x8] = 0xa
eax = [ebp-0x4]
cmp eax, [ebp-0x8]
o eax == [ebp-0x8] ?
o 4 == 10 ?
jge 0x80483d7
o If 4 was >= 10, jmp
o Else, continue execution False, so execution just
continues to the next
instruction
[ebp-0x4] = 0x4
[ebp-0x8] = 0xa
eax = [ebp-0x4]
cmp eax, [ebp-0x8]
jge 0x80483d7
mov eax, 0x1
o eax = 1
jmp over the mov eax, 0
leave and return

So two memory addresses, relative to the pointer contained
in ebp, have values. One has 4, one has 10.
There is a comparison
If operand 1 >= operand 2, take the jump
If not, continue execution
Eax gets assigned the value of 1
The function returns
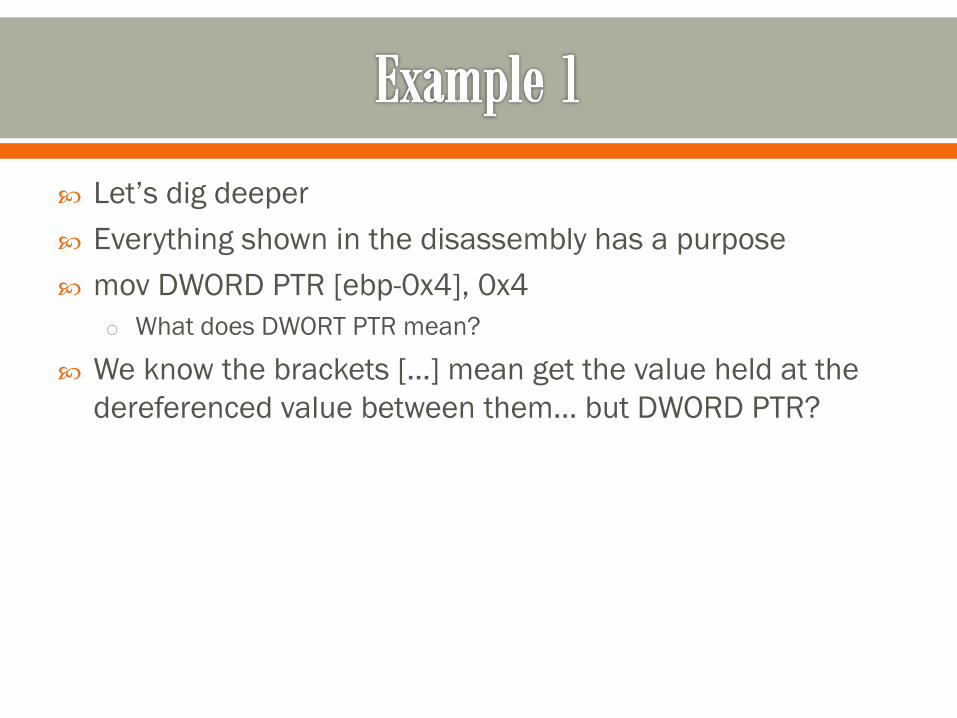
Let’s dig deeper
Everything shown in the disassembly has a purpose
mov DWORD PTR [ebp-0x4], 0x4
o What does DWORT PTR mean?
We know the brackets […] mean get the value held at the
dereferenced value between them… but DWORD PTR?
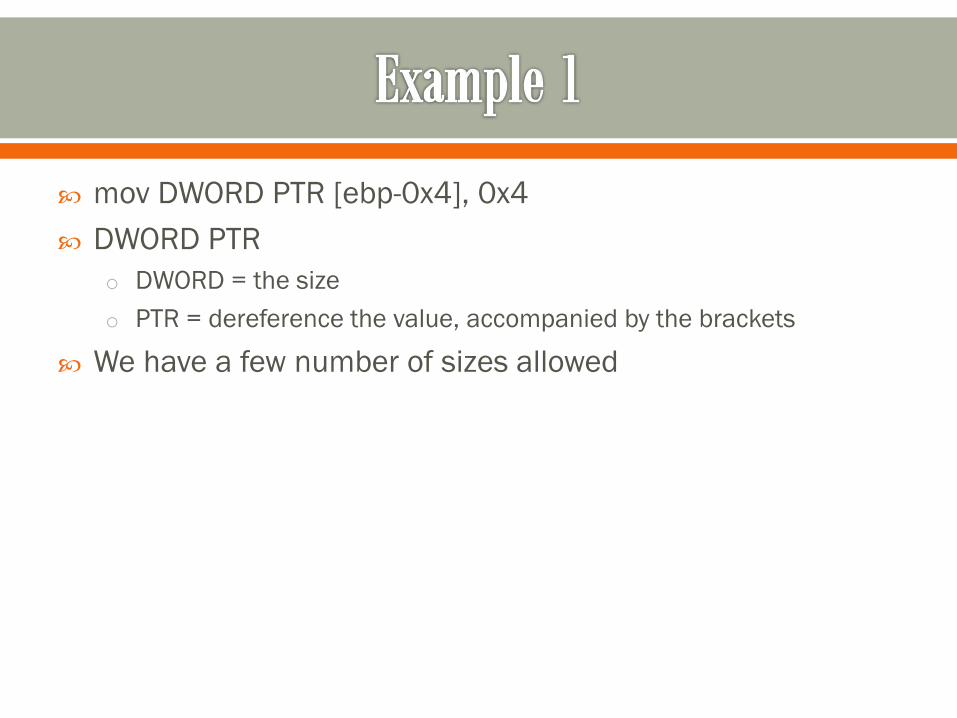
mov DWORD PTR [ebp-0x4], 0x4
DWORD PTR
o DWORD = the size
o PTR = dereference the value, accompanied by the brackets
We have a few number of sizes allowed
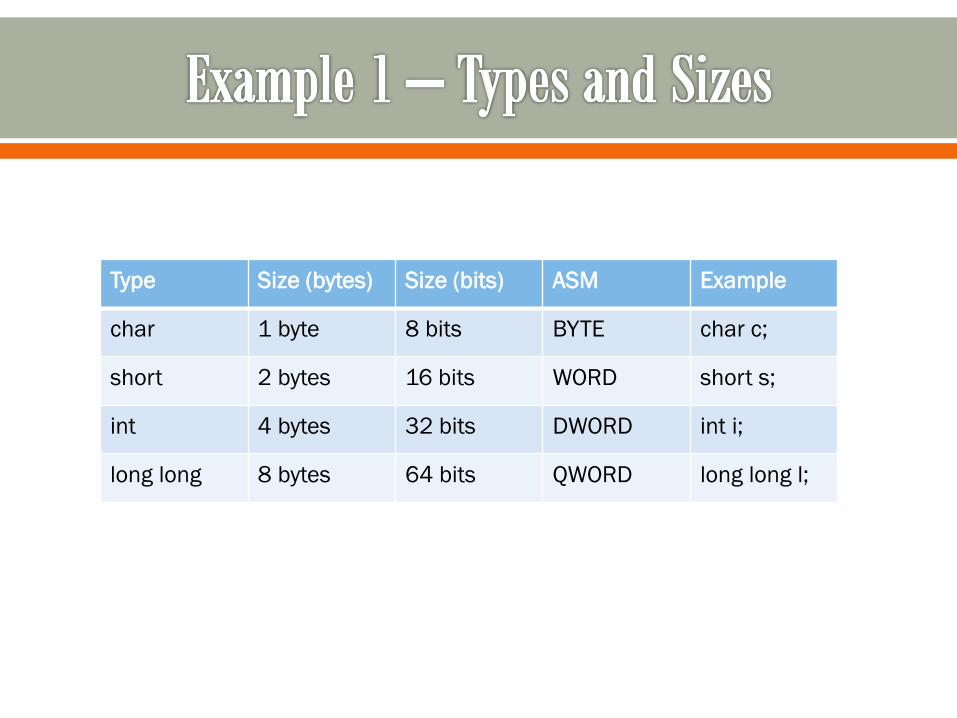
Type Size (bytes) Size (bits) ASM Example
char 1 byte 8 bits BYTE char c;
short 2 bytes 16 bits WORD short s;
int 4 bytes 32 bits DWORD int i;
long long 8 bytes 64 bits QWORD long long l;

So…
mov DWORD PTR [ebp-0x4], 0x4
The address pointed to by the dereferenced value of [ebp-4]
is getting 4 bytes moved into it, with the value of 4.
[ebp-4] is an int
So our source code probably has some int value and hard
codes a value of 4 to it

mov DWORD PTR [ebp-0x4], 0x4
mov DWORD PTR [ebp-0x8], 0xa
This leaves us with 2 ints being assigned a hard coded
value
o int x = 4;
o int y = 10;
Are these locals, globals, static variables???
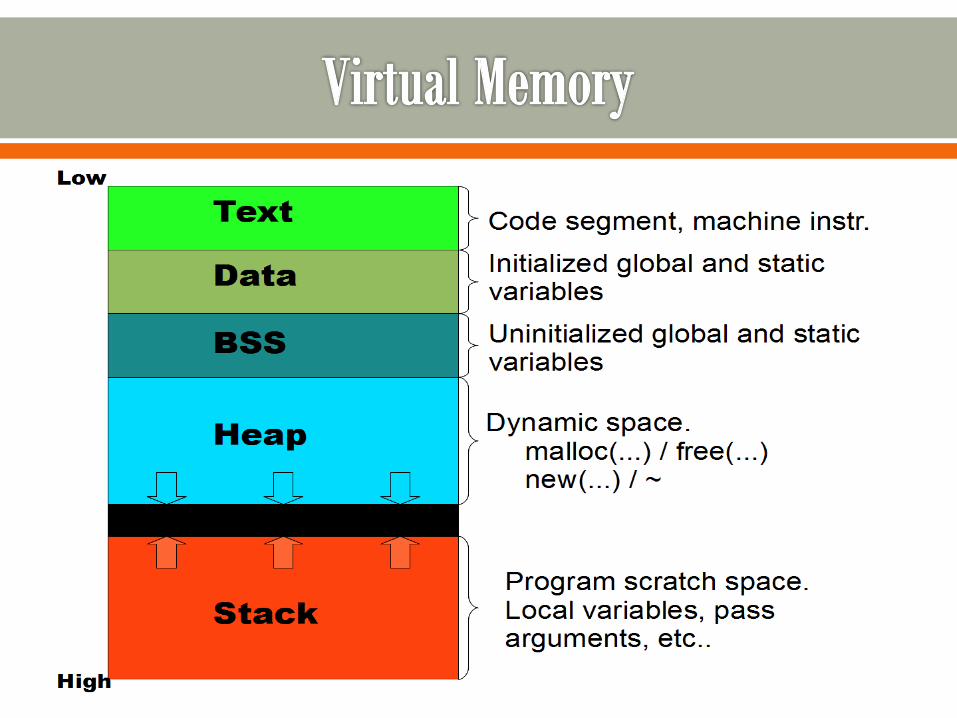
We need a little background on process memory layout.
int x = 4;
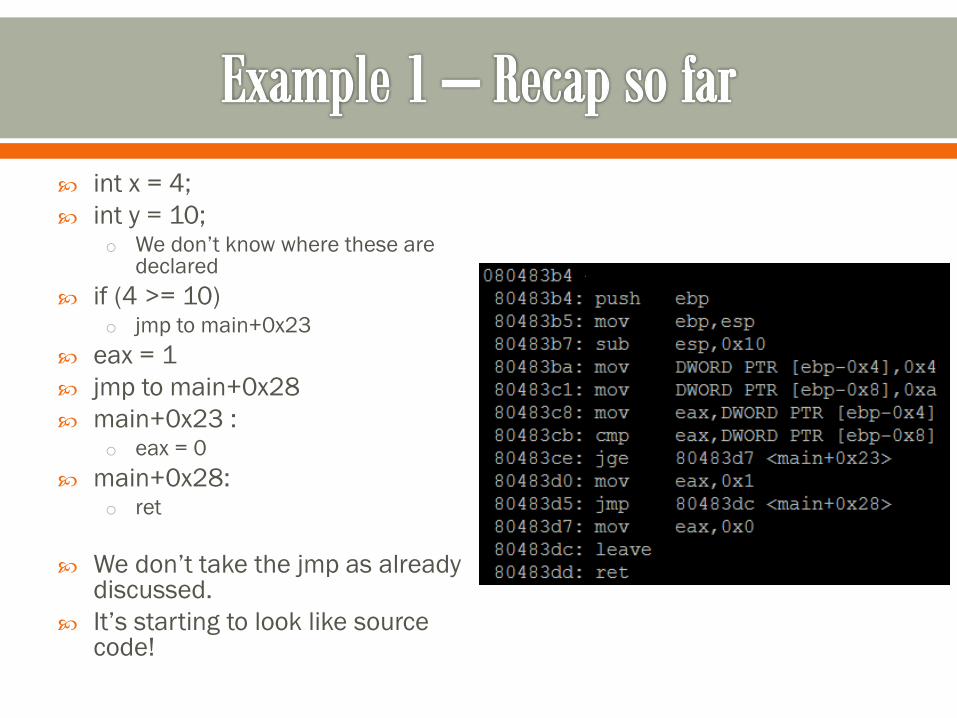
int y = 10; o We don’t know where these are
declared
if (4 >= 10) o jmp to main+0x23
eax = 1
jmp to main+0x28
main+0x23 : o eax = 0
main+0x28: o ret
We don’t take the jmp as already discussed.
It’s starting to look like source code!

Let’s do a quick introduction to process memory layout,
then we’ll continue with the first example
We want to know
o Why things are relative to esp/ebp?
o What are the push/pop instructions doing?
o What about the leave/ret instructions?

Image from https://www.corelan.be/wp-
content/uploads/2010/08/image_thumb3.png
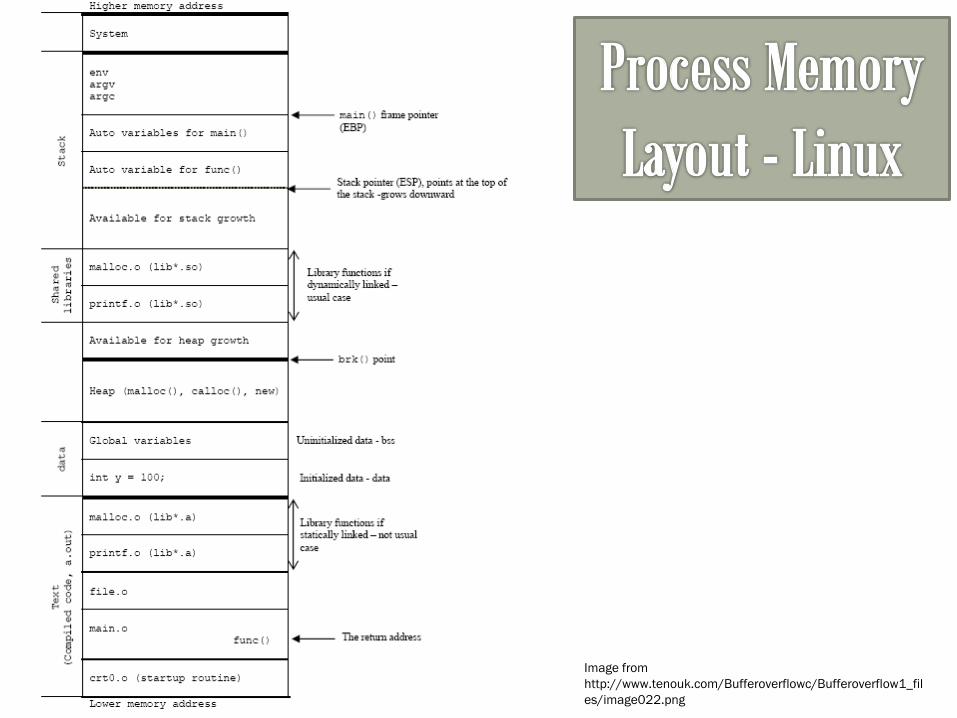
Image from
http://www.tenouk.com/Bufferoverflowc/Bufferoverflow1_fil
es/image022.png


Register Name Description
EIP Next instruction executed
*Want to hijack during exploitation
ESP Stack pointer
EBP Base pointer
EAX Accumulation
*Holds the return value, usually.
EBX Base
ECX Counter
EDX Data
ESI Source index
EDI Destination index


Okay, we have some background on the registers, the stack,
and process layout
Let’s try to figure out what this code’s stack layout would
look like
Then, we’ll look back at the code and what we know
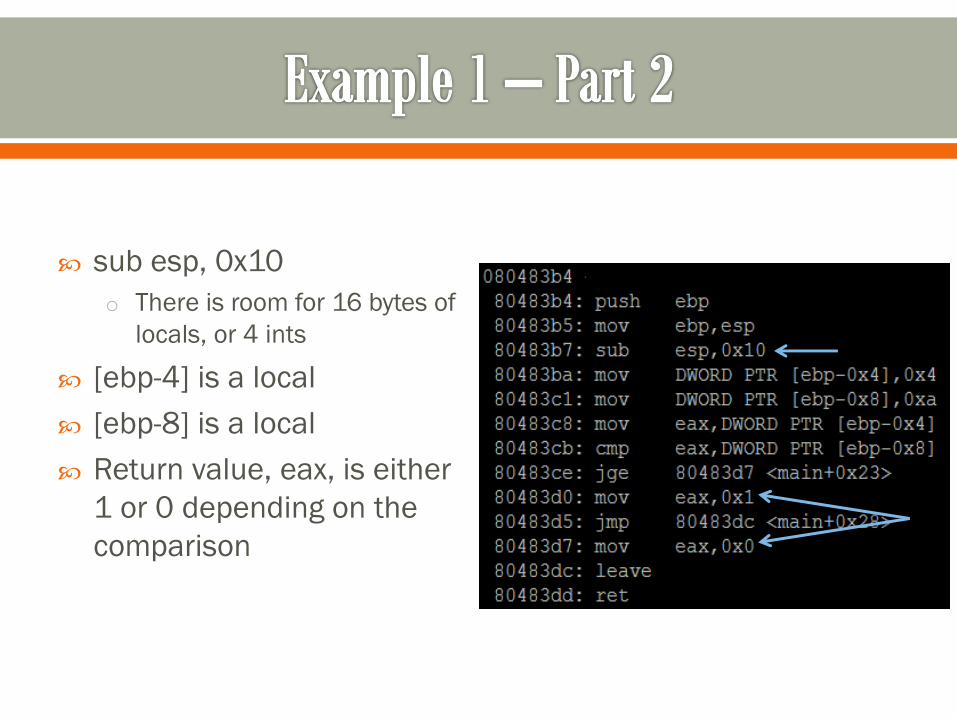
sub esp, 0x10
o There is room for 16 bytes of
locals, or 4 ints
[ebp-4] is a local
[ebp-8] is a local
Return value, eax, is either
1 or 0 depending on the
comparison

…
RET
EBP
ESP
EBP-4
EBP-8
4
10
No [ebp+x], no arguments to
the function
EBP-16
args start at
EBP+8
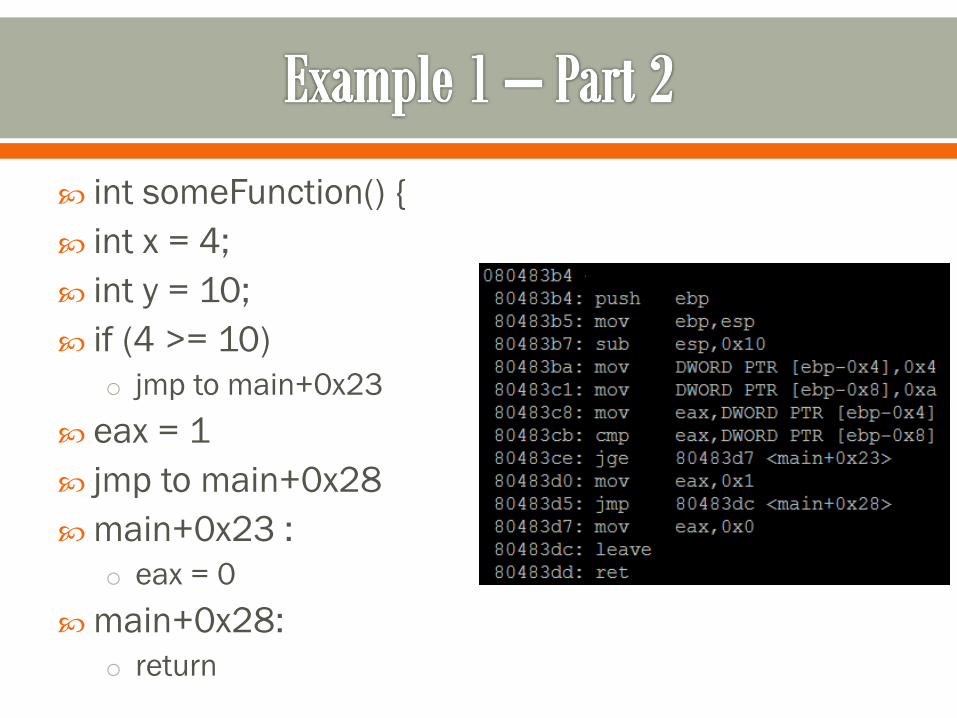
int someFunction() {
int x = 4;
int y = 10;
if (4 >= 10)
o jmp to main+0x23
eax = 1
jmp to main+0x28
main+0x23 :
o eax = 0
main+0x28:
o return

‘if’ comparisons get translated opposite from source to
assembly
if x > y
Will become
o cmp x, y
o jle 0x12345678 (jump less than or equal)
o If some condition is *not true*, jump over it
If x <= y
Will become
o cmp x, y
o ja 0x12345678 (jmp above)
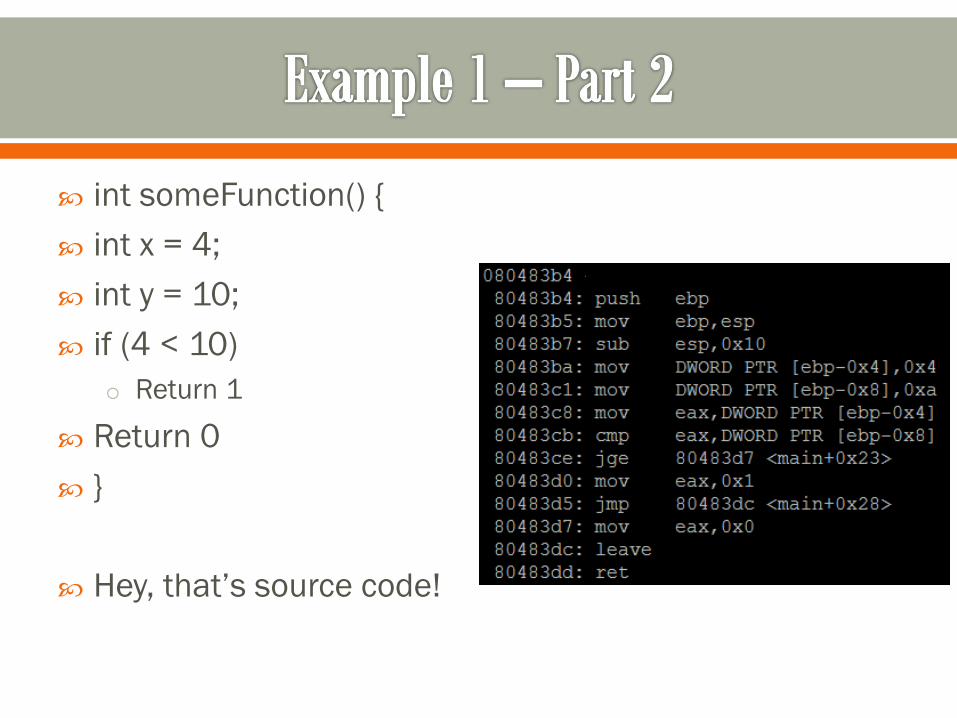
int someFunction() {
int x = 4;
int y = 10;
if (4 < 10)
o Return 1
Return 0
}
Hey, that’s source code!
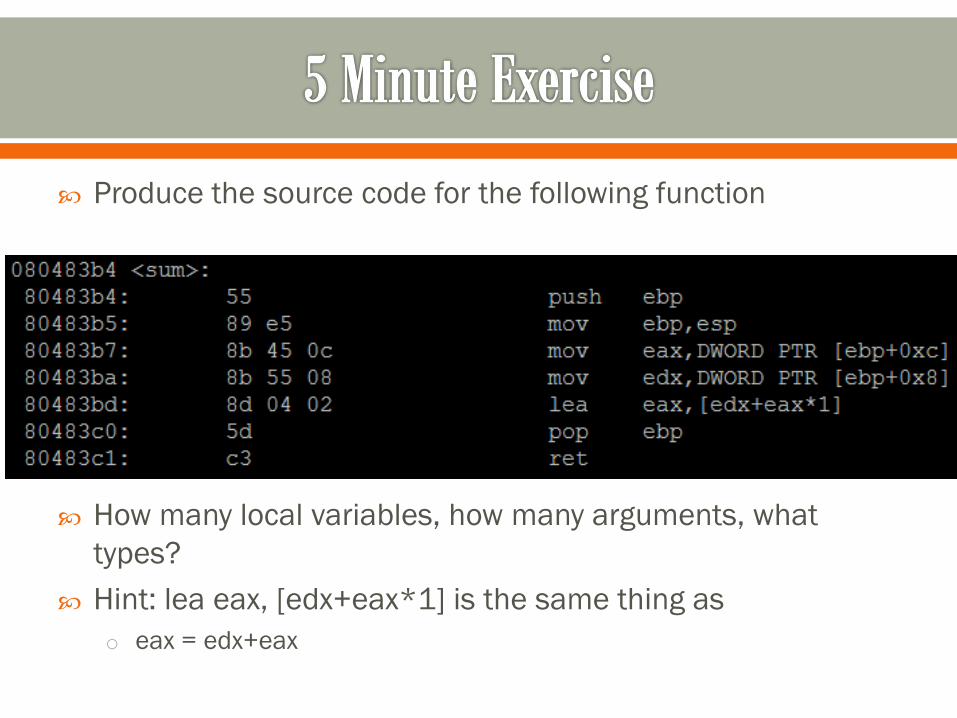
Produce the source code for the following function
How many local variables, how many arguments, what
types?
Hint: lea eax, [edx+eax*1] is the same thing as
o eax = edx+eax

What we just saw was the sum function.
The compiler used lea edx+eax for efficiency
It could have similarly used the add instruction
eax contains the return value
No local variables were used (no [ebp-x]), just arguments ([ebp+x])

Looking at the previous exercise introduces a question
about how function calls are handled
We know
o eax holds the return value
o Arguments (from the functions point of view) begin at ebp+8
But how do those arguments get there, and how are they
removed?

Two main calling conventions are commonly used
CDECL
o Originates from C
o Args pushed on the stack, right to left (reverse)
o Calling function cleans up
STDCall
o Orignates from Microsoft
o Args pushed on the stack, right to left (reverse)
o Called function cleans up
• Must know how many bytes ahead of time

GCC tends to use : move [esp+x], arg
Visual studio tents to use : push arg
Regardless, we’re putting args on top of the stack

…
RET
EBP
7
5 ESP EBP + 8
Now that the stack is setup, sum is called

Functions reference local variables and arguments via their
stack frame pointers, esp and ebp
So, every function has it’s own prolog and epilog to adjust
esp and ebp to contain the correct values

Prolog – push ebp to save it on the stack, then move ebp to the top of the stack, then make room for locals
o Push ebp
o mov ebp, esp
o sub esp, x
Epilog – move esp back to ebp, pop the top of the stack into ebp, return to the address on top of the stack
o add esp, x
o pop ebp
o ret
Epilog 2 – leave is equivalent to : mov esp, ebp; pop ebp
o leave
o ret

…
RET
EBP
7
5
The call instruction pushes EIP onto the stack
RET
ESP
EBP

…
RET
EBP
7
5
EBP is saved
RET
EBP
ESP
EBP

…
RET
EBP
7
5
EBP has the same value as ESP now
RET
EBP
ESP
EBP

…
RET
EBP
7
5
EAX gets the value of arg 2
RET
EBP
ESP
EBP
EAX = 7
…
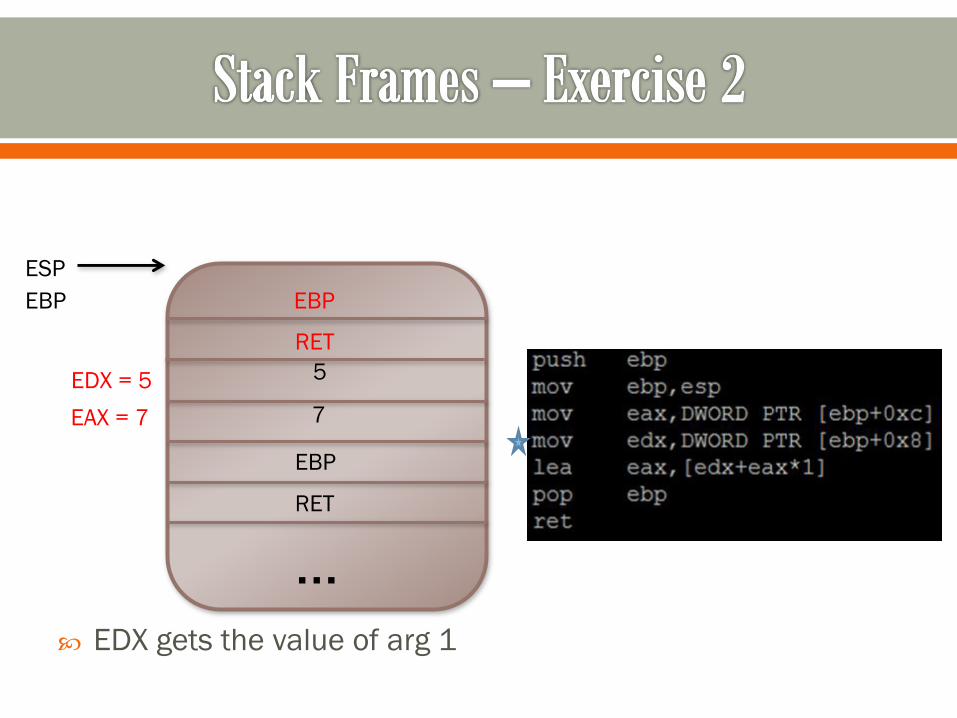
RET
EBP
7
5
EDX gets the value of arg 1
RET
EBP
ESP
EBP
EAX = 7
EDX = 5

…
RET
EBP
7
5
EAX contains a new value now, not what was in arg2
RET
EBP
ESP
EBP
EAX = 12
EDX = 5

…
RET
EBP
7
5
In the epilog now, set EBP back to the callers value
RET
ESP
EBP
EAX = 12
EDX = 5

…
RET
EBP
7
5
Ret is the same as : pop EIP
Control flow returns to the next instruction in the caller
ESP
EBP
EAX = 12
EDX = 5
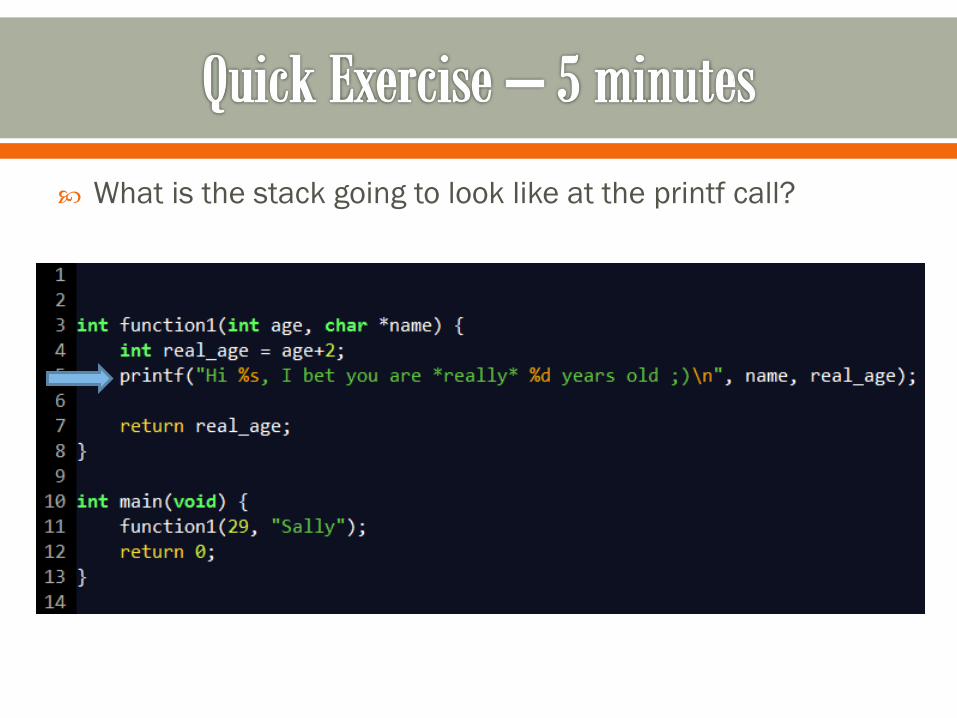
What is the stack going to look like at the printf call?

… RET
EBP
Sally
29
RET
EBP
real_age
real_age
name
Main
function1
ESP
EBP
.data section char *

for(i = 0; i < 10; i++)

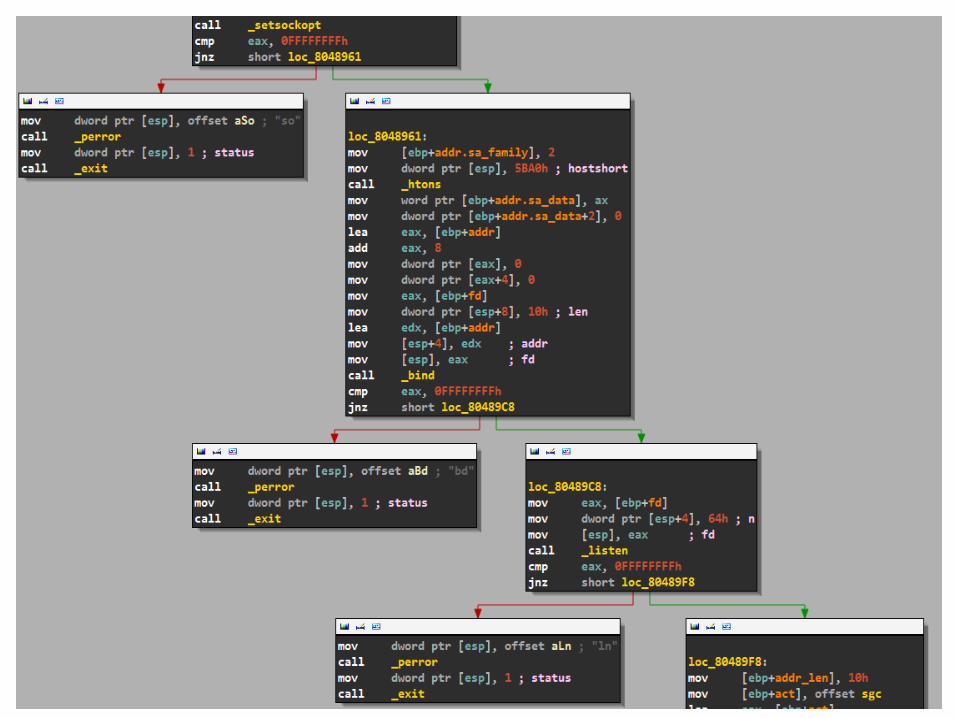
Without a single
instruction, it’s clear what
is happening at a high
level here
This common “stair step”
graph structure is a series
of calls/checks that error
out on failure
IDA rocks…
We can do many things, including grouping a set of nodes,
color coding them, and renaming them
Knowing that all these checks error out on failure we can
simplify the graph


I could spend on all day on IDA, too much information to put
into slides without making it a pure IDA talk
*Live demo goes here*
o How to use IDA
o Go over variable renaming, function protocol modification,
comments, coloring, grouping, sections, string, imports, etc.

Can you figure out the correct input to get the key program
to print the key?
Use the executable number_checker.exe


Everything covered so far has been static analysis
Now we’ll cover dynamic analysis through debugging

Remember
A good debugger will have several useful features
o Set breakpoints
o Step into / over
o Show loaded modules, SEH chain, etc.
o Memory searching
o …
WinDBG, OllyDBG, Immunity, IDA, GDB, etc. are good
debuggers

Keep in mind…
You control everything!
If you want to skip over an instruction, or a function call, do
it!
If you want to bypass the “authentication” method or make
it return true… you can!
You can change register contents and memory values,
whatever you want.
You can even patch programs (make changes and save it to
a new executable).
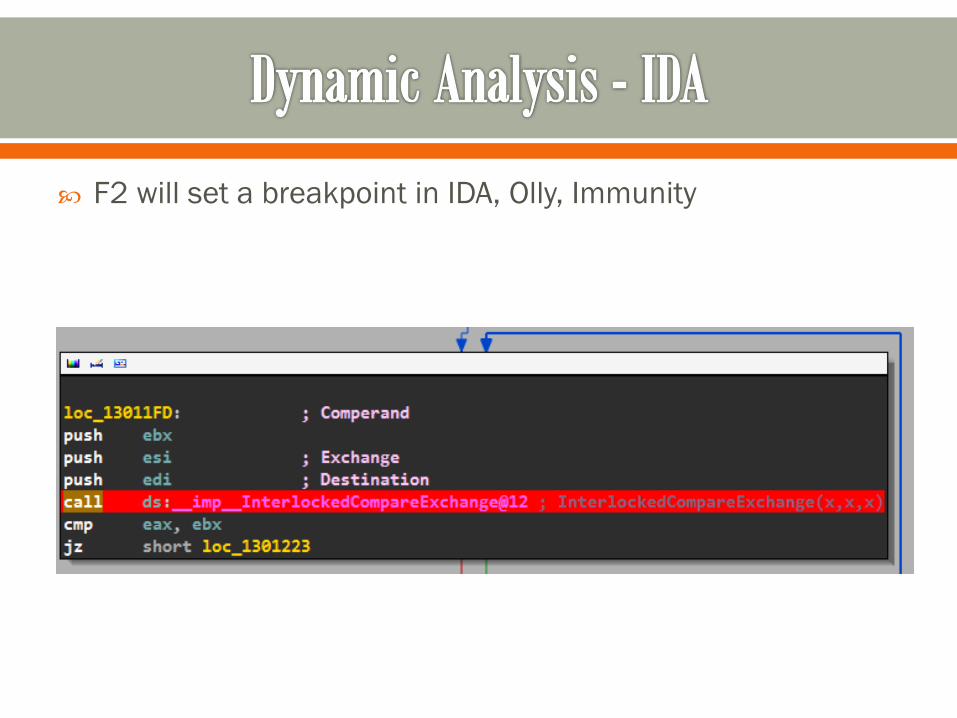
F2 will set a breakpoint in IDA, Olly, Immunity

The breakpoint has been hit, execution is stopped
• The registers
• The stack

The breakpoint has been hit, execution is stopped
• The registers
• The stack
args

We can now see the function call is
InterlockedCompareExchange(__native_startup_lock,
0x47000, 0)
Looking at the MSDN site for the prototype :

Knowing the data types of the parameters, we can trace
back up through the program where the values in ebx, esi
and edi came from
Then we can rename those values to something useful
Just looking at calls, figuring out their arguments, and
tracing back to fill in the data types can really help figure
out most of the functions
We’ll again use the number_checker.exe binary for this
exercise
Can you bypass the key check entirely?
In CTFs a lot of times we can see where the key get’s
printed, and we’ll try to just jump directly to that function, or
make checks return True/False depending on where we
want to go.
o Usually can get a quick low point problem this way ;)

Set a breakpoint at the beginning of the function (f2)

When execution is stopped, find where you want to jump to,
and right click -> set ip

Most of the Windows debuggers are similar
o Same windows, same hotkeys, etc.
o Except WinDBG, WinDBG is more GDB like
GDB is similar, but is command line
We’ll cover some simple GDB usage

Command Description
gdb ./my_program Launch gdb, debug my_program
gdb --args ./my_program arg1 arg2 Launch gdb, debug my_program,
passing two arguments
run Run the application
run arg1 arg2 Run the application, pass two args
run $(python –c “print ‘A’*1000”) Run the application, pass one arg, just
like regular shell execution
Starting GDB and launching the application
o With and without arguments

1. Launch GDB with the program we want to debug
2. Run it
Hmm… we need more information
o (I would just open it in IDA, but we’re trying to learn GDB here!)
2
1

Command Description
set disassembly-flavor intel Use Intel syntax
disas [function_name] Disassemple the chosen function
Command Description
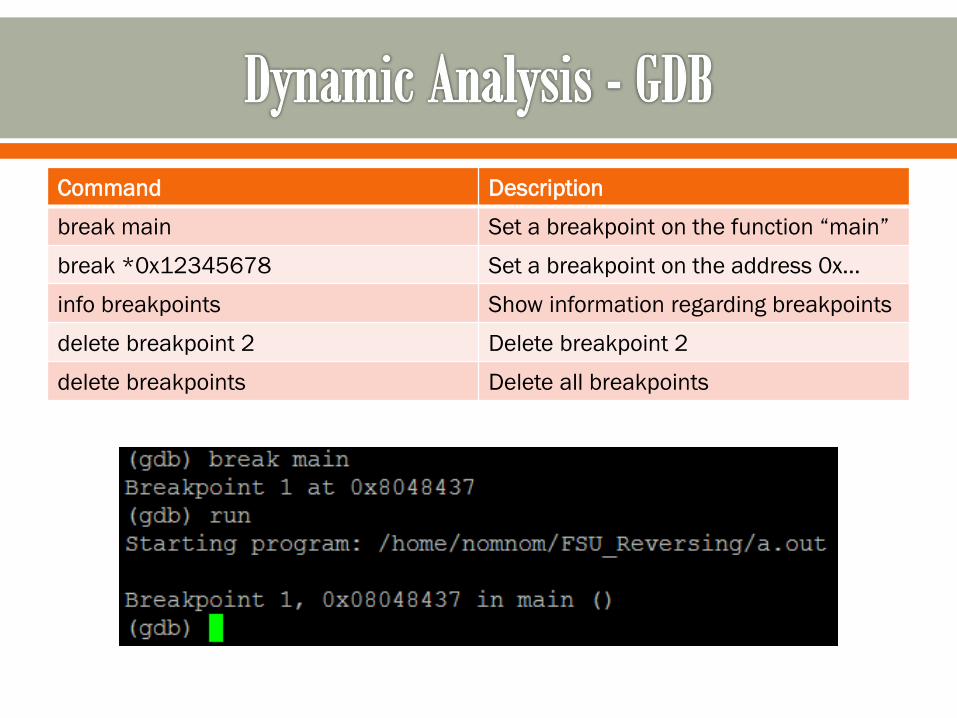
break main Set a breakpoint on the function “main”
break *0x12345678 Set a breakpoint on the address 0x…
info breakpoints Show information regarding breakpoints
delete breakpoint 2 Delete breakpoint 2
delete breakpoints Delete all breakpoints

Commands Description
si Step Instruction. Execute to next
instruction, go *into* functions
ni Next Instruction. Execute to next
instruction, go *over* functions
• Look at the
addresses
• We’re manually
stepping through
the instructions

Commands Description
si Step Instruction. Execute to next
instruction, go *into* functions
ni Next Instruction. Execute to next
instruction, go *over* functions
• Look at the
addresses
• We’re manually
stepping through
the instructions
This still
isn’t
helping us
though!

We can disassemble, set breakpoints, and step through the
program… but
We need to
o See the contents of registers
o See the contents of memory
o Modify (if desired)

Image from http://darkdust.net/files/GDB%20Cheat%20Sheet.pdf

Command Description
x/5i $eip Examine 5 instructions at EIP
x/4xw $esp Examine 4 hex words at ESP
x/s 0x12345678 Examine the string at 0x12345678
x/5b $ecx Examine 5 bytes at ECX
i r “info register”, show the values of all
registers
i r esp ebp ecx Show the values of registers ESP, EBP,
and ECX
x/nfu <address|register>


1 1. Run the program

1 1. Run the program
2. Where are we? Check
out EIP 2

1 1. Run the program
2. Where are we? Check
out EIP
3. Continue until we hit an
instruction of interest
2
3

1 1. Run the program
2. Where are we? Check
out EIP
3. Continue until we hit an
instruction of interest
4. Let’s see what’s being
compared – we can see
this jump is not taken
2
3
4

1 1. Run the program
2. Where are we? Check
out EIP
3. Continue until we hit an
instruction of interest
4. Let’s see what’s being
compared – we can see
this jump is not taken
5. Check out the argument
passed to puts
2
3
4
5
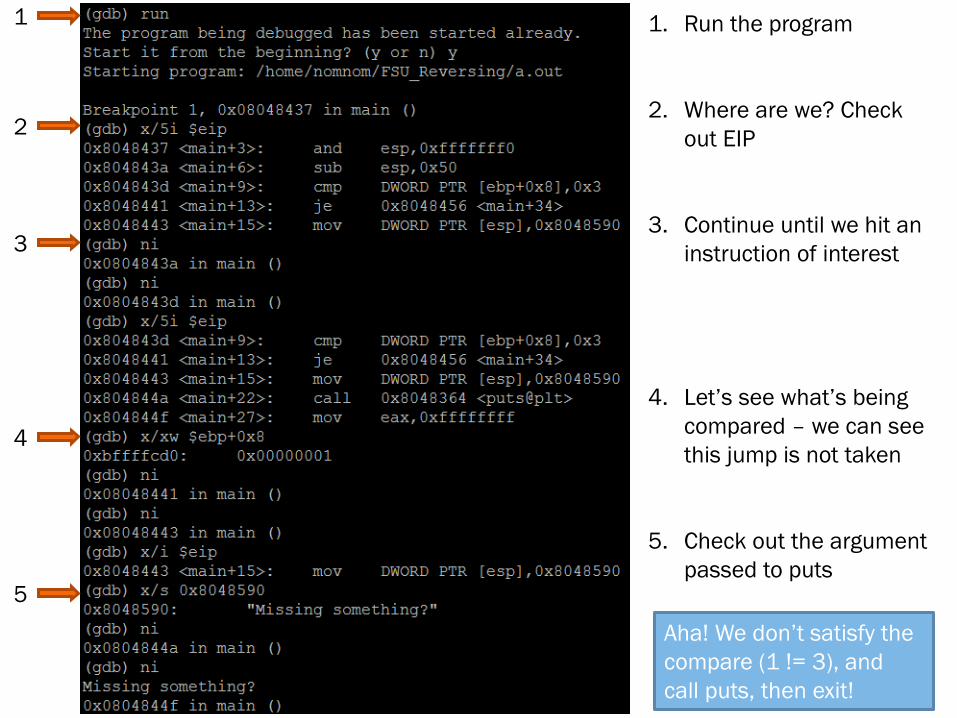
1 1. Run the program
2. Where are we? Check
out EIP
3. Continue until we hit an
instruction of interest
4. Let’s see what’s being
compared – we can see
this jump is not taken
5. Check out the argument
passed to puts
2
3
4
5
Aha! We don’t satisfy the
compare (1 != 3), and
call puts, then exit!

Think about the function protocol for main
o int main (int argc, char *argv[])
In main, [ebp+8] would reference the first argument, argc
We aren’t passing any arguments, besides argv[0], the
program name, hence why [ebp+8] has the value 1

Haha, passing the program 2 more arguments (3 total)
does in fact satisfy the first cmp instruction
A new code path is taken!

Try to figure out the correct input that will cause the
program to print message, "Congrats, you did it!“
Use IDA and GDB!
• Hey, we’ve seen this graph
pattern before!

Everyone has their own preferences
But the combination of the two will undoubtedly yield the
best results
IDA, WinDBG, Immunity, GDB all have scripting
o In fact, they all use Python except WinDBG*
o There are awesome scripts that will import results from debuggers
into IDA’s view, filling in all the registers/operands for each
instruction.

key_checker.exe or
We’ll do a real crackme
Crackme at
o http://www.woodmann.com/RCE-CD-
SITES/Quantico/mib/crackme2.zip
This might be a little tricky, that’s okay.

What about bytecode?
o .NET applications, java, python, etc.
Just download a disassembler
You’ll get near complete source code back
It’s really that easy…

Hopefully you feel comfortable
o Opening up and examining a binary and looking at it’s sections to
get a feel for it
o Renaming and simplifying the disassembly
o Converting back to source code where needed
o Using a debugger to fill in the gaps or manipulate program execution

Fantastic books
o Reversing: The secrets of reverse engineering
o The IDA Pro book
o The Art of Exploitation
Challenges
o Crackmes.de
o Woodmann.com
o Smashthestack.org (plenty of debugging involved ;) )
Links
o CSG : csg.utdallas.edu and irc.oftc.net #utdcsg (everyone is welcome)
o IDA : hex-rays.com
o CFF Explorer : ntcore.com/exsuite.php
o Immunity Debugger : immunityinc.com