miracle mile final remedial investigation report - text
TRANSCRIPT
REMEDIAL INVESTIGATION OF THE MIRACLE MILE WQARF SITE TUCSON, ARIZONA Prepared for ARIZONA DEPARTMENT OF ENVIRONMENTAL QUALITY URS Job No. 24097087 June 12, 2013

Remedial Investigation Report Miracle Mile WQARF Site Arizona Department of Environmental Quality
ii June 12, 2013
URS Job No. 24097013
TABLE OF CONTENTS
1.0 INTRODUCTION ...............................................................................................................1 1.1 OBJECTIVES OF THE REMEDIAL INVESTIGATION......................................2 1.2 SCOPE OF THE REMEDIAL INVESTIGATION .................................................2 1.3 REPORT ORGANIZATION ...................................................................................4
2.0 SITE BACKGROUND ........................................................................................................6
3.0 PHYSICAL CHARACTERISTICS.....................................................................................8 3.1 DEMOGRAPHICS AND LAND USE ....................................................................8 3.2 CLIMATE ................................................................................................................8 3.3 TOPOGRAPHY .......................................................................................................9 3.4 CURRENT OR REASONABLY FORESEEABLE USES OF LAND
AND/OR WATER ...................................................................................................9 3.5 REGIONAL HYDROGEOLOGIC CONDITIONS ................................................9
3.5.1 Geology ........................................................................................................9 3.5.2 Structural Features .....................................................................................10 3.5.3 Hydrogeologic Units ..................................................................................10 3.5.4 Perched Groundwater.................................................................................13 3.5.5 Depth to Groundwater and Flow Direction in the Regional Aquifer .........13 3.5.6 Groundwater Recharge and Discharge ......................................................14 3.5.7 Aquifer Parameters ....................................................................................14 3.5.8 Pumping Wells in the Vicinity of the Miracle Mile WQARF Site ............15
3.6 SURFACE WATER HYDROLOGY ....................................................................16
4.0 PREVIOUS INVESTIGATIONS ......................................................................................17 4.1 CERCLA INVESTIGATIONS – 1989-1999 ........................................................17 4.2 ABRAMS INVESTIGATIONS.............................................................................18
4.2.1 Site Investigation – 1989 ...........................................................................18 4.2.2 Plating Shop Testing Results – 1995 .........................................................19
4.3 PHASE I INVESTIGATION – 1988-1989 ...........................................................19 4.4 AQUIFER TEST – 1990 ........................................................................................20 4.5 PHASE II INVESTIGATION – 1991-1992 ..........................................................21 4.6 IRA-6 AND IRA-7 – MARCH 1995 .....................................................................23 4.7 INSTALLATION OF MONITOR WELLS – 1996 ..............................................23 4.8 INSTALLATION OF MONITOR WELLS IRA-9 AND IRA-10 – 1997 ............23 4.9 QUARTERLY GROUNDWATER MONITORING ............................................24 4.10 SPRING JOINT INVESTIGATION - 2002-2004 .................................................24

Remedial Investigation Report Miracle Mile WQARF Site Arizona Department of Environmental Quality
iii June 12, 2013
URS Job No. 24097013
5.0 EARLY RESPONSE ACTIONS .......................................................................................27 5.1 FAIRFAX WELL ABANDONMENT – 1995 AND 2002 ...................................28 5.2 ALTERNATIVE WATER SUPPLY FOR FWID – 1987-1998 ...........................30 5.3 CONSTRUCTION OF GAC SYSTEM FOR FWID – 2006 ................................32 5.4 INSTALLATION OF PAVEMENT CAP AT SPRING JOINT – 2005 ...............32 5.5 REMOVAL OF WASTE AND CONTAMINATED SOIL FROM SPRING
JOINT – 2003 ........................................................................................................32
6.0 REMEDIAL INVESTIGATION FIELD ACTIVITIES (1999 – 2011) ............................33 6.1 VADOSE ZONE SOIL INVESTIGATIONS ........................................................33
6.1.1 Field Investigations ....................................................................................34 6.1.1.1 Phase I: Passive Soil-Gas Survey – February 2001 ....................34 6.1.1.2 Phase II: Passive Soil-Gas Survey – April 2001 .........................34 6.1.1.3 Active Soil-Gas Survey and Soil Sampling – May 2002 ............34 6.1.1.4 Phase III: Passive Soil-Gas Survey – June 2002 ........................35 6.1.1.5 Abrams Airborne Soil and Passive Soil-Gas Sampling – June
to September 2004 ......................................................................35 6.1.1.6 Spring Joint Facility – 2004-2005...............................................37
6.2 GROUNDWATER INVESTIGATIONS ..............................................................38 6.2.1 Field Investigations ....................................................................................39
6.2.1.1 Aquifer Test ................................................................................40 6.2.1.2 Monitor Well Installation IRA-11 – IRA-16 ..............................40 6.2.1.3 Monitor Well Installation IRA-17 – IRA-23, IRA-25, IRA-26 ..42 6.2.1.4 Monitor Well Installation IRA-24 ..............................................42 6.2.1.5 Monitor Well Installation IRA-27 through IRA-30 ....................42 6.2.1.6 Spring Joint Soil Borings and Monitor Well Installation
IRA-31 ........................................................................................42 6.2.1.7 Monitor Well Installation IRA-32 through IRA-37 ....................43
6.3 R.E. DARLING SEWER INVESTIGATION 2008 ..............................................43
7.0 INTERPRETATION OF DATA FROM RI INVESTIGATIONS ....................................45 7.1 AQUIFER TEST RESULTS .................................................................................45 7.2 R.E. DARLING SEWER INVESTIGATION CONCLUSIONS ..........................45 7.3 CONTAMINANTS OF CONCERN .....................................................................46 7.4 VADOSE ZONE INVESTIGATION ....................................................................47
7.4.1 Passive Soil-Gas Results ............................................................................47 7.4.2 Interpretation of Passive Soil-Gas Results .................................................48 7.4.3 Active Soil-Gas Results .............................................................................49

Remedial Investigation Report Miracle Mile WQARF Site Arizona Department of Environmental Quality
iv June 12, 2013
URS Job No. 24097013
7.4.4 Interpretation of Active Soil-Gas Results ..................................................53 7.4.5 Calculation and Comparison of Active Soil-Gas Results ..........................54 7.4.6 Soil Sample Results ...................................................................................55
7.4.6.1 R.E. Darling 2002 Soil Borings ..................................................55 7.4.6.2 Abrams Airborne 2004 ESI Soil Sampling Summary ................56 7.4.6.3 Spring Joint Specialists 2004 Investigation Soil Sampling
Summary .....................................................................................57 7.4.7 Interpretation of Soil Sample Results ........................................................58 7.4.8 Current Understanding of Perched Groundwater Zone .............................59
7.5 DISTRIBUTION AND TRENDS OF CONTAMINATION IN GROUNDWATER ................................................................................................61 7.5.1 Contaminants in Perched Groundwater .....................................................61 7.5.2 Contaminants in Regional Aquifer ............................................................67
7.5.2.1 Horizontal Distribution and Trends ............................................67 7.5.2.2 Vertical Distribution and Trends ................................................77
7.6 POTENTIAL SOURCE AREAS ...........................................................................77 7.7 SUMMARY OF THE EXTENT OF CONTAMINATION ..................................86
8.0 CONTAMINANT FATE AND TRANSPORT .................................................................88 8.1 CHEMICAL CHARACTERIZATION OF TCE AND CHROMIUM .................88 8.2 CHEMICAL CHARACTERIZATION OF PCE, FREON-11, AND
FREON-12 .............................................................................................................88 8.3 TRANSPORT PROCESS/ ROUTES OF MIGRATION ......................................89 8.4 CHEMICAL AND BIOLOGICAL TRANSFORMATION PROCESSES ...........91 8.5 OBSERVED TCE AND CHROMIUM MIGRATION IN
GROUNDWATER ................................................................................................92
9.0 RISK EVALUATION .......................................................................................................96 9.1 1993 RISK ASSESSMENT FOR MIRACLE MILE WQARF SITE ...................96 9.2 ROUTES OF EXPOSURE ....................................................................................96 9.3 POTENTIAL RECEPTORS ..................................................................................97 9.4 GROUNDWATER QUALITY DATA .................................................................98 9.5 APPLICABLE REGULATIONS ..........................................................................98 9.6 RISK EVAUATION SUMMARY ........................................................................99
9.6.1 Perched Groundwater...............................................................................100 9.6.2 Regional Groundwater .............................................................................100 9.6.3 Potential Adverse Health Effects .............................................................101 9.6.4 Risk for Potential Adverse Health Effects ...............................................101

Remedial Investigation Report Miracle Mile WQARF Site Arizona Department of Environmental Quality
v June 12, 2013
URS Job No. 24097013
9.7 PRESENT AND FUTURE GROUNDWATER USES .......................................101
10.0 SUMMARY OF FINDINGS AND RECOMMENDATIONS ........................................102 10.1 CONCEPTUAL SITE MODEL ..........................................................................102 10.2 DATA GAPS .......................................................................................................104
REFERENCES ............................................................................................................................105
LIST OF FIGURES
Figure 1 – Site Location Map Figure 2 – Property Boundaries Within the Miracle Mile WQARF Site Figure 3 – Well Location Map Figure 4 – Tucson Basin Map Figure 5 – Locations of Natural and Artificial Recharge Figure 6 – Soil-Gas Locations, R.E. Darling 1990 CERCLA Investigation Figure 7 –Abrams Plating Shop 1995 Testing Results Figures, Soil Sample Locations Figure 8 – Fairfax Industrial Well Construction History Figure 9 – TCE Concentrations in Monitor Well IRA-8 Figure 10 – Asphalt Cap Dimensions, Spring Joint Asphalt Cap Installation Figure 11 – Passive Soil-Gas Sample Locations February 2001 to September 2004 Figure 12 – Active Soil-Gas Samples and Soil Boring Locations May 2002 Figure 13 – Soil Boring Locations Abrams Expanded Site Investigation June to September 2004 Figure 14 – Soil Boring and Well Locations Spring Joint 2005 Site Investigation Figure 15 – Onsite Sewer System Layout R.E. Darling 2008 Sewer Investigation Figure 16 – Video Inspection Overview R.E. Darling 2008 Sewer Investigation Figure 17 – Passive Soil-Gas Survey Results for TCE February 2001 to September 2004 Figure 18 – Passive Soil-Gas Survey Results for PCE February 2001 to September 2004 Figure 19 – Vertical Profile of TCE, PCE and Freon 11 in Soil Boring No. 1 May 2002 Figure 20 – Vertical Profile of TCE, PCE, and Freon 11 in Soil Boring No. 2 May 2002 Figure 21 – Vertical Profile of TCE in Soil Boring No. 3 May 2002 Figure 22 – Vertical Profile of TCE in Soil Boring No. 4 May 2002 Figure 23 – Vertical Profile of TCE and PCE in Soil Boring No. 5 May 2002 Figure 24 – Vertical Profile of TCE and PCE in Soil Boring No. 6 May 2002 Figure 25 – Vertical Profile of TCE and PCE in Soil Boring No. 7 May 2002 Figure 26 – Vertical Profile of TCE in Soil Boring No. 8 May 2002 Figure 27 – Vertical Profile of TCE, PCE and cis-1,2-DCE in Soil Boring No. 9 May 2002 Figure 28 – Vertical Profile of TCE, PCE and cis-1,2-DCE in Soil Boring No. 10 May 2002
Remedial Investigation Report Miracle Mile WQARF Site Arizona Department of Environmental Quality
vi June 12, 2013
URS Job No. 24097013
Figure 29 – Stratigraphic Fence Diagram of Eight Perched Monitor Wells Figure 30 – Perched Well Locations Figure 31 – Stratigraphic Fence Diagram of Nine Perched Monitor Wells Figure 32 – Perched Groundwater Elevation Map December 2011 Figure 33 – Perched Well TCE Results 2000 Through 2011 Figure 34 – Comparison of December 2004 TCE in Perched Groundwater Zone with Soil-Gas
TCE Figure 35 – Perched Well PCE Results 2000 Through 2011 Figure 36 – Perched Well cis-1,2-DCE Results 2000 Through 2011 Figure 37 – Perched Well Chromium Results 2000 Through 2011 Figure 38 – Regional Aquifer TCE Concentrations December 2011 Figure 39 – Regional Aquifer PCE Concentrations December 2011 Figure 40 – Regional Aquifer Chromium Concentrations December 2011 Figure 41 – Time-Series Graph of TCE in Selected Regional IRA Monitor Wells 1993 Through
2011 Figure 42 – Regional Well PCE Results 1990 through 2011 Figure 43 – Time-Series Graph of Chromium in Selected Regional IRA Monitor Wells 1997
through 2011 Figure 44 – Comparison of Total, Dissolved & Hexavalent Chromium in Groundwater - October
2005 Figure 45 – Vertical Distribution of TCE in Regional Monitor Well IRA-14 2001 Through 2011 Figure 46 – Vertical Distribution of Chromium in Regional Monitor Well IRA-14 2001 Through
2011 Figure 47 – FWID Well Hydrographs 1994 Through 2011 Figure 48 – Regional Well Chromium Results 1997 Through 2011 Figure 49 – Regional Well TCE Results 1990 Through 2011 Figure 50 – Regional Well cis-1,2-DCE Results 1995 Through 2011
LIST OF TABLES
Table 1 – FWID Annual Pumpage Summary 1979 Through 2011 Table 2 – FWID 2011 Monthly Pumpage Summary Table 3 – Soil Analytical Results – Spring Joint Table 4 – Well Construction Information Table 5 – Phase I Passive Soil-Gas Survey Results Table 6 – Phase I Passive Soil-Gas Survey Results – BTEX Compounds Table 7 – Phase II Passive Soil-Gas Survey Results
Remedial Investigation Report Miracle Mile WQARF Site Arizona Department of Environmental Quality
vii June 12, 2013
URS Job No. 24097013
Table 8 – Phase III Passive Soil-Gas Survey Results Table 9 – Active Soil-Gas Survey Results Table 10 – Soil Sample Results Table 11 – Analytical Results for Groundwater Samples Collected from Soil Borings Nos. 7 and 8 Table 12 – Soil-Gas to Soil Conversion Calculations Table 13 – Abrams ESI Soil Results Table 14 – Abrams ESI Soil Background Results Table 15 – Individual Tables of Selected VOCs in the Regional Aquifer Analytical Results 1999 - 2011 Table 16 – Individual Tables of Selected Metals in the Regional Aquifer Analytical Results for 1999 -
2011 Table 17 – Individual Tables of Selected VOCs in the Perched Groundwater Analytical Results for 1999 -
2011 Table 18 – Individual Tables of Selected Metals in the Perched Groundwater Analytical Results for 1999
- 2011
APPENDICES
Appendix A – Remedial Investigation (RI) Report Responsiveness Summary Appendix B – Land and Water Use Study for Miracle Mile WQARF Site Appendix C – Remedial Objectives (ROs) Report (and RO Responsiveness Summary) Appendix D – Groundwater Level Elevation Maps from May 1999 through October 2011 Appendix E – Hydrographs for Selected Miracle Mile Monitor Wells from 1990 through 2011 Appendix F – Hydrographs from Transducer Data from Wells IRA-9, IRA-11-210, IRA-13-210, IRA-
25, and IRA-26 from 2001 through 2005 Appendix G – Western Technologies 2004 Soil Locations Appendix H – Monitor Well Boring Logs and Well Schematics Appendix I – Active Gas Soil Boring Logs Appendix J – General Chemistry Appendix K – Calculations for Soil-Gas Data Appendix L – Summary Tables of Analytical Results for the IRA Monitor Wells from 1999 through
2011 Appendix M – Time-Series Graphs of TCE, Chromium, PCE, and 1,1-DCE in IRA Monitor Wells from
1990 through 2006 Appendix N – Historical Perched Groundwater TCE Concentration Appendix O – HGL Parcel Figure Appendix P – Historical Perched Groundwater Chromium Concentration Appendix Q – Historical Regional Groundwater TCE Concentration Appendix R – Historical Regional Groundwater Chromium Concentration Appendix S – Perched Groundwater Maps

Remedial Investigation Report Miracle Mile WQARF Site Arizona Department of Environmental Quality
viii June 12, 2013
URS Job No. 24097013
LIST OF ACRONYMS AND ABBREVIATIONS
§ Section (used for referring to laws or regulations) µg micrograms µg/kg micrograms per kilogram µg/L micrograms per liter µg/m3 micrograms per cubic meter 1,1-DCA 1,1-Dichloroethane 1,2-DCA 1,2-Dichloroethane 1,1-DCE 1,1-Dichloroethylene 1,1,1-TCA 1,1,1-Trichloroethane A.A.C. Arizona Administrative Code Abrams Abrams Airborne Manufacturing ADEQ Arizona Department of Environmental Quality ADHS Arizona Department of Health Services ADWR Arizona Department of Water Resources API American Petroleum Institute A.R.S. Arizona Revised Statutes ASRAC Arizona Superfund Response Action Contract AWQS Arizona Aquifer Water Quality Standard bgs below ground surface BTEX benzene-toluene-ethylbenzene-xylenes CDC Centers for Disease Control CERCLA Comprehensive Environmental Response, Compensation, and Liability Act cis-1,2-DCE cis-1,2-dichloroethylene COC contaminant of concern COPC contaminant of potential concern EPA U.S. Environmental Protection Agency ERA Emergency Response Action ESI expanded site inspection

Remedial Investigation Report Miracle Mile WQARF Site Arizona Department of Environmental Quality
ix June 12, 2013
URS Job No. 24097013
ºF Fahrenheit FLUTe Flexible Liner Underground Technologies, Ltd. Co. Freon-11 trichlorofluoromethane Freon-12 dichlorodifluoromethane FS feasibility study ft/day feet/day FWID Flowing Wells Irrigation District GAC granular activated carbon GORE W.L. Gore & Associates gpd/ft gallons per day per foot gpd/ft2 gallons per day per square foot GPL Groundwater Protection Level gpm gallons per minute Growth Growth Environmental Services, Inc. HGL HydroGeoLogic, Inc. IRA interim remedial action MCL Maximum Contaminant Level MCLG Maximum Contaminant Level Goals mg/kg milligrams per kilogram mg/L milligrams per liter Mgal million gallons ml milliliter MMIA Miracle Mile Interchange Area msl mean sea level MTBE methyl tertiary butyl ether PA Preliminary Assessment PCE tetrachloroethylene PID photo-ionization detector ppb parts per billion ppbv parts per billion by volume ppm parts per million PVC polyvinyl chloride

Remedial Investigation Report Miracle Mile WQARF Site Arizona Department of Environmental Quality
x June 12, 2013
URS Job No. 24097013
QAPP Quality Assurance Project Plan RCRA Resource Conservation and Recovery Act RI Remedial Investigation RL laboratory reporting limit RSC RSC Equipment Rental Sch Schedule SI Site Investigation Spring Joint Spring Joint Specialists SRL Soil Remediation Level TCE trichloroethylene TDS Total Dissolved Solids trans-1,2-DCE trans-1,2-dichloroethylene URS URS Corporation VOCs volatile organic compounds WBS Work Breakdown Structure WQARF Water Quality Assurance Revolving Fund WRCC Western Regional Climate Center

Remedial Investigation Report Miracle Mile WQARF Site Arizona Department of Environmental Quality
1 June 12, 2013
URS Job No. 24097013
1.0 INTRODUCTION
This Remedial Investigation (RI) Report for the Miracle Mile Water Quality Assurance Revolving Fund (WQARF) Registry Site (Site) was prepared by URS Corporation (URS) on behalf of the Arizona Department of Environmental Quality (ADEQ). URS prepared this RI under the Arizona Superfund Response Action Contract (ASRAC) in accordance with the guidelines and requirements outlined in the ASRAC Scope of Work (Work Breakdown Structure [WBS] 1.1.3, RI Report), Version C, dated August 10, 2000. This RI presents the findings of investigative activities performed from May 1999 through December 2011 by URS (formerly Dames & Moore). Summaries of previous investigation activities conducted at the Site by other consultants (including Kleinfelder, Inc., PRC Environmental Management, Inc., Earth Tech Corporation, Growth Environmental Services, Inc. [Growth], and Western Technologies, Inc.) under contract with ADEQ are also included in the RI.
The Draft RI Report was made available for public review and comment between March 30, 2007, and May 23, 2007. ADEQ has prepared a Responsiveness Summary to address the written comments received regarding the Draft RI Report. Both the written comments and ADEQ’s responses to those comments can be found in Appendix A.
The Site is located in northwest Tucson, Arizona. The Site originally was part of the Miracle Mile Interchange Area (MMIA), which was placed on the WQARF priority list on November 13, 1987, based on the detection of chlorinated volatile organic compounds (VOCs) in water supply wells located within the boundaries of the MMIA. The MMIA extended from Wetmore Road on the north to Speedway Boulevard on the south, and from Oracle Road on the east to Silverbell Road on the west (Figure 1). Based on the findings from subsequent investigations, ADEQ listed a much smaller area on the WQARF Registry in 1988 and this area became known as the “Miracle Mile WQARF Site.” Continued investigation, including the RI, has resulted in the boundaries of the Site being reduced to a smaller area and confined to contaminant of concern (COC) releases that have occurred in the vicinity of Romero Road, between Prince Road and Roger Road, as seen in Figure 1. A close-up of this area can be seen in Figure 2.
A COC, as defined by R18-16-401, “means a hazardous substance that results from a release and that has been identified by the Department as the subject of remedial action at a site.” COCs are those contaminants that have been detected with some consistency in groundwater or soil at concentrations above regulatory levels [Arizona Aquifer Water Quality Standards (AWQSs) for groundwater and Soil Remediation Levels (SRLs) for soil] or a risk-based level. [Note: For all COCs of potential concern listed in this report, the AWQS is equivalent to the Maximum Contaminant Level (MCL), unless indicated otherwise. The MCL is the federal drinking water

Remedial Investigation Report Miracle Mile WQARF Site Arizona Department of Environmental Quality
2 June 12, 2013
URS Job No. 24097013
standard.] The Site COCs are trichloroethylene (TCE) and chromium in the regional aquifer and hexavalent chromium in soil. [Note: Unless indicated otherwise, “chromium” refers to “total chromium,” as opposed to “trivalent chromium” or “hexavalent chromium.”] The probable sources of this contamination are discussed in Section 7.6.
1.1 OBJECTIVES OF THE REMEDIAL INVESTIGATION
The purpose of this RI is to characterize the nature and extent of COCs within the Site, to identify those that constitute a potential health risk, and to present the findings of the Land and Water Use Study.
The specific objectives of the RI are to:
• Identify and investigate potential source areas of COCs based on historical industrial and commercial activities within the Site.
• Characterize the geology, hydrogeology (including groundwater gradients and flow direction), hydrology, and the nature, concentration, and horizontal and vertical extent of COCs within the Site based on data collected by ADEQ, URS, and other consultants during previous investigations.
• Present and evaluate the factors that influence the fate and transport of COCs in the environment including the vadose zone soils, perched groundwater zone, and the regional aquifer.
• Assess the potential and actual risks to human health and the environment posed by the presence of COCs in the soil and groundwater.
• Summarize the results of the Land and Water Use Study.
Along with the Land and Water Use Study for the Site (Appendix B), this RI Report was used to establish the Remedial Objectives (ROs) for the Site (Appendix C). The RI Report (and the attached RO Report) will provide the basis for the future Feasibility Study (FS), which will evaluate various remedial actions to protect public health and the environment from the impact of the releases of COCs to soil and groundwater at the Site.
1.2 SCOPE OF THE REMEDIAL INVESTIGATION
The scope of the RI is to address the specific objectives, listed above, using a phased and iterative approach in data collection and evaluation.
Beginning in May 1999, URS performed various investigations of the soil and vadose zone within areas of known or suspected industrial activity within the Site to identify potential source
Remedial Investigation Report Miracle Mile WQARF Site Arizona Department of Environmental Quality
3 June 12, 2013
URS Job No. 24097013
areas. The investigations included passive and active soil-gas sampling, groundwater monitor well installations, groundwater monitor well sampling, and site specific investigations.
Soil-gas sampling was used to evaluate the concentration and distribution of VOCs in the soil and vadose zone. The investigation also assessed the potential for residual VOCs in the vadose zone to provide a continuing source of contamination to the regional aquifer. Passive soil-gas sampling was conducted in three phases, with each phase using the information generated from the subsequent phase to define and refine the area impacted by VOCs.
• Phase I passive soil-gas survey consisted of soil-gas sampling and analysis on a coarse grid throughout general areas of known or suspected industrial operations.
• Phase II consisted of soil-gas sampling and analysis on a finer grid in areas of higher soil-gas concentrations based on the results of Phase I.
• Phase III consisted of additional soil-gas sampling and analysis to refine the contours along the northern and southern boundaries of soil-gas survey area.
URS also conducted active soil-gas sampling and analysis, soil boring installation, and soil sampling and analysis to evaluate the levels of residual VOCs in the soil and vadose zone. Results of these activities showed that VOC concentrations in soil-gas and soil samples increased with depth up to 60 to 80 feet below ground surface (bgs). Perched groundwater was encountered during several monitor well installations within the Site at depths ranging from 70 to 100 feet bgs. Perched groundwater is defined as groundwater occurring in a saturated zone separated from the main body of groundwater by an unsaturated zone. Perched groundwater zones occur when a low permeability material (i.e., clay, shale), located above the regional aquifer, blocks or intercepts the downward flow of water from the land surface. Water mounds up over the low permeability material creating a perched water table.
From May 2001 to July 2004, URS installed a total of 16 monitor wells in the perched groundwater zone beneath the Site (however one of the perched wells was damaged during installation, resulting in 15 successful well installations). In addition, Western Technologies Inc. had previously installed a monitor well (IRA-10-100) in perched groundwater in the Carefree Village Mobile Home Park in 1997. Western Technologies was contracted by Spring Joint Specialists Inc. (Spring Joint) in 2004 to install 3 perched wells on the Spring Joint property. The analytical results from groundwater samples collected from these 19 perched monitor wells indicate that concentrations of TCE, the most prevalent COC, in the perched groundwater zone are one to two orders of magnitude higher than levels detected in samples obtained from monitor wells completed in the regional aquifer. Chromium is also a COC for the Site. Several investigations on the Spring Joint property had detected high levels of chromium in the soil and

Remedial Investigation Report Miracle Mile WQARF Site Arizona Department of Environmental Quality
4 June 12, 2013
URS Job No. 24097013
perched groundwater. Levels of chromium are highest in a perched well on the Spring Joint property; however, several other regional wells within the Site have had detections of chromium above the AWQSs.
Concern existed that the perched groundwater zone might provide a continuing source of VOC and chromium contamination to the regional aquifer, particularly in locations that could act as a potential conduit for downward contaminant migration from the perched groundwater zone to the regional aquifer, such as the former industrial well (referred to as the Fairfax well) located on the R.E. Darling property. As discussed in Section 5.1, the Fairfax well was abandoned in 1995 to mitigate the potential for vertical migration from the perched groundwater zone to the regional aquifer. However, a re-abandonment was necessary and was completed in June 2002 as an Early Response Action.
Prior to 1999, ADEQ had 10 regional groundwater wells installed throughout the site. Under contract with ADEQ, URS installed an additional 14 monitor wells in the regional aquifer from May 2001 to May 2011, including a monitor well on the Spring Joint property to further characterize the horizontal and vertical extent of groundwater contamination at that property, and a multi-port/depth FLUTe well for characterization of vertical extent of groundwater contamination. Groundwater monitoring of these 24 wells was conducted to delineate the horizontal and vertical extent of groundwater contamination in the regional aquifer within the Site. URS also evaluated supply well usage and pumpage and their impact on the distribution of contamination in the regional aquifer.
Current groundwater monitoring at the Site includes collecting groundwater samples and depth-to-water measurements from various monitor, water supply, and private wells annually.
1.3 REPORT ORGANIZATION
The format and content for this Report were developed in accordance with the guidelines and requirements outlined in the ASRAC Scope of Work (WBS 1.1.3, RI Report), Version C, dated August 10, 2000, and U.S. Environmental Protection Agency (EPA) Guidelines for Conducting Remedial Investigations and Feasibility Studies under the Comprehensive Environmental Response, Compensation, and Liability Act (CERCLA) (EPA, 1988). The remainder of the RI Report is presented as follows:
• Section 2.0, Site Background, presents the Site location, description and history, and the findings of previous investigations.

Remedial Investigation Report Miracle Mile WQARF Site Arizona Department of Environmental Quality
5 June 12, 2013
URS Job No. 24097013
• Section 3.0, Physical Characteristics, describes the demographics and land use, meteorology, current and foreseeable uses of water, topography, regional and Site-specific geology, structure and hydrogeology, and surface water hydrology.
• Section 4.0, Previous Investigations, summarizes the field activities, reports, and findings that were conducted by contractors other than URS from 1989 to 2004.
• Section 5.0, Early Response and Interim Remedial Actions, summarizes the findings of the Draft Fairfax Well Abandonment Report (URS, 2005d) and Water Supply Study (Dames & Moore 2000a).
• Section 6.0, Remedial Investigation Field Activities, describes the vadose zone, soil, perched groundwater and regional aquifer field investigation activities performed by URS from May 1999 through December 2011. The discussion presented in this section includes the objectives, technical approach, field methodologies, and chemical analyses and methods.
• Section 7.0, Interpretation of Data from RI Investigations, presents and discusses the results of the vadose zone sampling, monitor well installation, groundwater sampling, and aquifer testing conducted by URS from May 1999 to December 2011, and background information on the sources of contamination.
• Section 8.0, Contaminant Fate and Transport, presents the factors affecting the fate and migration of COCs in the environment, including chemical characteristics and physical properties and transport processes.
• Section 9.0, Risk Evaluation, presents a Site-specific evaluation of the risk associated with the presence of COCs in the regional aquifer.
• Section 10.0, Summary of Findings and Recommendations, summarizes the major findings of the RI and its conclusions, and presents the overall conceptual site model.

Remedial Investigation Report Miracle Mile WQARF Site Arizona Department of Environmental Quality
6 June 12, 2013
URS Job No. 24097013
2.0 SITE BACKGROUND
In September 1983, a groundwater supply well located at the Tra-Tel Tucson RV Park was found to contain tetrachloroethylene (PCE) in concentrations above the later-adopted AWQS. The Tra-Tel RV Park is located north of Fort Lowell Road, near La Cholla Boulevard, within the former MMIA boundaries, as shown on Figure 1. In June 1986, TCE was detected at a concentration (20 micrograms per liter [µg/L]) above the AWQS in a sample collected from an industrial well (Fairfax well) located approximately ¾-mile north-northeast of the Tra-Tel RV Park. The AWQSs for both PCE and TCE are 5 µg/L.
ADEQ began investigating this area by reviewing records and researching facilities that may have been sources of contamination. In 1988, ADEQ initiated a Phase I investigation in the Site vicinity under the authority of CERCLA. Beginning in December 1989, ADEQ conducted a Phase II investigation of several industrial facilities within the Site. The Phase II investigation included drilling, well installation, geophysical logging, sampling of five groundwater monitor wells (wells IRA-1 through IRA-5), and aquifer testing of two water supply wells. Results from the Phase II investigation indicated the presence of several VOCs in the soil-gas and soil samples collected, including TCE, 1,1-dichloroethylene (1,1-DCE), PCE, methyl tertiary butyl ether (MTBE), trichlorofluoromethane (Freon-11), and dichlorodifluoromethane (Freon-12). Groundwater sampling from the Phase II investigation found TCE; PCE; 1,1-Dichloroethane (1,1-DCA); and 1,1.1-Trichloroethane (1,1,1-TCA) (Kleinfelder, 1992).
In addition to VOC contamination in the regional aquifer, chromium was detected in a groundwater sample collected from the Fairfax well in June 1986, at a concentration of 0.097 milligrams per liter (mg/L). The AWQS for chromium is 0.10 mg/L. Since June 1999, chromium has been detected in seven regional monitor wells (IRA-2, IRA-7, IRA-8, IRA-9, IRA-10-230, IRA-11-210 and IRA-14) and one perched groundwater monitor well (SW-MW-2) in concentrations exceeding the AWQS.
Between 1990 and 1997, ten monitor wells (IRA-1 through IRA-10-230) were installed within the Site to investigate VOC contamination in the regional aquifer and one was installed to investigate the perched groundwater (IRA-10-100). Monitor wells installed by ADEQ for the purpose of investigating the Site have been assigned the prefix of IRA (for Interim Remedial Action). All IRA monitor well locations are shown on Figure 3.
Based on the results of previous and current field investigations, TCE is the most predominant VOC within the Site. Prior to May 2001, monitor well IRA-2 consistently contained the highest TCE concentrations of all the IRA monitor wells. Well IRA-2 is located on the southeast corner of 3939 North Romero Road (A Family Discount Storage facility) and completed in the regional
Remedial Investigation Report Miracle Mile WQARF Site Arizona Department of Environmental Quality
7 June 12, 2013
URS Job No. 24097013
aquifer. TCE concentrations in well IRA-2 steadily increased from 14 µg/L in October 1997 to 170 µg/L in June 2001. These increasing concentrations suggested the presence of an ongoing source of VOCs within the Site vicinity. A shallow, localized, perched groundwater zone was suspected as a possible source to the regional aquifer, based on reports from historical boring and well completion logs, and reports of cascading water in wells located within the Site. In May 1997, while drilling the borehole for a regional aquifer monitor well (IRA-10-230), a perched groundwater zone was encountered at approximately 100 feet bgs. Based on the occurrence of perched groundwater, a monitor well was installed and screened to intercept the perched water (Western Technologies, Inc. 1998). Monitor well IRA-10-100 was the first monitor well completed in the perched groundwater zone within the Site.
Since January 1992, ADEQ has been collecting groundwater level measurements and groundwater quality samples from wells within the Site on a periodic basis, mostly quarterly. In addition to defining the lateral and vertical extent of the plume, and its migration through time, evaluation of the quarterly groundwater level measurements and groundwater quality data provide information on water level trends and groundwater flow direction that assist in determining the location(s) of future monitor wells.
Flowing Wells Irrigation District (FWID), a municipal water provider, currently operates eight wells in and surrounding the area of the Site (north of Prince Road). These wells supply potable water for municipal, domestic, and industrial uses. The locations of the FWID wells are shown on Figure 3.
TCE was detected in one of the FWID wells (FWID-66), located approximately ½-mile northeast of monitor well IRA-2, in October 1997 at a concentration of 4.9 µg/L; the AWQS for TCE was 5.0 µg/L (Dames & Moore, 2000c). As a result of the contamination and a subsequent ADEQ/FWID agreement, this well was removed from service and is no longer in use. The TCE concentrations for well FWID-70 were found to be above AWQS standards in October of 2010.
In July 1998, FWID formally requested ADEQ to implement an IRA to address the loss or reduction of available water from FWID wells due to contamination by VOCs (DeConcini et al., 1998). The IRA evaluated alternative water supply options to compensate for the loss of supply from FWID wells 66, 70, and 75 (the wells either already impacted or most likely to be impacted by VOCs) prior to the completion of the Remedial Investigation/ Feasibility Study (RI/FS). The Interim Remedial Action consisted of performing a water supply study (Dames & Moore, 2000a) and providing additional storage and booster pumps at well FWID-72 (Section 5.2 of this RI).
In April 1999, ADEQ contracted with URS to begin the RI/FS for the Site.
Remedial Investigation Report Miracle Mile WQARF Site Arizona Department of Environmental Quality
8 June 12, 2013
URS Job No. 24097013
3.0 PHYSICAL CHARACTERISTICS
Section 3.0 presents the physical characteristics of the Site, including the demographics and land use, climate, topography, current and foreseeable land and water uses, regional and site-specific geology, structural hydrogeology, and surface water hydrology.
3.1 DEMOGRAPHICS AND LAND USE
According to the 2010 census, the population within the city limits of Tucson was 520,000, which is an increase of 6.9% percent from 1990. The Site straddles two separate census tracts, Nos. 45.04 and 45.13; the population for those two tracts total 10,311. The median household income within the Site ranges from $19,337 to $27,943 (City of Tucson Planning, 2003).
The area within the Site is a combination of light industrial businesses, manufacturers, small retail businesses, and residential areas. The majority of the active businesses are situated along Romero and Prince Roads. The area east of Romero Road consists primarily of residential districts, including the Tucson Mobile Home Park and Westward Ho Mobile Home Park.
Presently, the area within the Site boundaries is zoned for industrial use, which includes commercial, industrial, and manufacturing uses. Surrounding land uses include mobile home parks to the east; medium- to high-density single-family residential, much of which is fairly well established, to the west and southeast; commercial (retail sales only) and office uses also to the southeast; and recreational vehicle parks to the south.
3.2 CLIMATE
The climate of the Tucson area is typical of the arid southwestern desert. Average temperatures range from average summer highs in July of 101.4 degrees Fahrenheit (˚F) to average winter lows in December of 39.7 ˚F (Western Regional Climate Center [WRCC], 2011). Temperatures reached a record high of 115 ˚F in Tucson in June 1994. Tucson has an annual average of 193 clear, sunny days (WRCC, 2011). Monthly average pan evaporation rates range from 3.25 inches in January to 14.91 inches in June (WRCC, 2011). The average annual precipitation for northwestern Tucson is 12.69 inches (WRCC, 2011).
More than one-third of the annual precipitation occurs during the months of July and August when moisture-bearing winds move into Arizona from the Gulf of Mexico. Summer rains occur in the form of thunderstorms, which can produce short, intense downpours, strong winds, lightning strikes, and flash floods. Winter storm systems (November through March) typically originate in the Pacific Ocean.
Remedial Investigation Report Miracle Mile WQARF Site Arizona Department of Environmental Quality
9 June 12, 2013
URS Job No. 24097013
3.3 TOPOGRAPHY
The City of Tucson lies within the Tucson Basin, a gently sloping, relatively flat alluvial basin, as shown on Figure 4. The basin slopes to the northwest, with valley floor elevations ranging from 3,000 feet above mean sea level (msl) at the very southeastern end of the basin to approximately 2,250 feet above msl at the northwestern end. Land elevations range from 9,157 feet above msl on Mount Lemmon in the Santa Catalina Mountains to the north to less than 2,300 feet above msl in the valley floor. Land elevations within the Site range from approximately 2,320 feet above msl in the southeastern portion of the site to 2,260 feet above msl toward the northwestern boundary of the site.
3.4 CURRENT OR REASONABLY FORESEEABLE USES OF LAND AND/OR WATER
The Site currently consists largely of residential, commercial, and light industrial land uses. The Site lies within the boundaries of both the City of Tucson and Pima County. The area is largely “built-out” and currently neither the City of Tucson nor Pima County has any specific plans to re-develop the area. Based on this, land uses for the foreseeable future in the vicinity of the Site are expected to remain similar to the current land uses. (“Vicinity of the Site” is the same as “potential impact area” defined in Figure 5 in the “Land and Water Use Report” found in Appendix B.)
Two water service providers, FWID and, to a lesser extent, Tucson Water, currently supply water to the residences, businesses, and schools within the vicinity of the Site, and there is one small municipal provider, Villa Capri Mobile Home Park, which uses its own well water for potable and irrigation uses for its residents. Future water uses are expected to continue to be potable and irrigation uses, largely supplied by FWID.
A Study assessing the current and reasonably foreseeable uses of land and water in greater detail, was prepared by URS and ADEQ, and is included as Appendix B.
3.5 REGIONAL HYDROGEOLOGIC CONDITIONS
This section describes the regional geologic and hydrologic setting and provides the basis for the detailed discussion of the Site-specific geologic and hydrologic conditions.
3.5.1 Geology
The Tucson Basin is located within the southern Basin and Range physiographic province, which is characterized by alternating broad alluvial valleys and long, narrow, fault-bounded mountain ranges. The topography of the Basin and Range Province is a result of near-vertical block

Remedial Investigation Report Miracle Mile WQARF Site Arizona Department of Environmental Quality
10 June 12, 2013
URS Job No. 24097013
faulting, which began about 20 million years ago in southeastern Arizona, followed by basin subsidence about 15 million years ago.
Mountain blocks surrounding the Tucson Basin include the Santa Catalina Mountains to the north, Rincon Mountains to the northeast, Santa Rita Mountains to the southeast, Sierrita Mountains to the southwest, and Tucson Mountains to the west (see Figure 4). These mountain blocks range in age from Tertiary to Precambrian and consist of igneous, metamorphic, and sedimentary rocks.
The Tucson Basin is comprised of a thick accumulation of basin-fill deposits, derived from the surrounding mountain blocks and others farther to the south. The thickness of the basin-fill deposits may exceed 9,600 feet in the center of the basin (Oppenheimer and Sumner, 1980).
The Tucson Basin is drained by the Santa Cruz River and its major tributary, Rillito Creek (aka Rillito River). As shown on Figure 4, the Site is located about 4 miles southeast from the confluence of Rillito Creek and the Santa Cruz River.
3.5.2 Structural Features
The Tucson Basin is a sediment-filled structural depression that was formed in response to crustal extension during the Cenozoic Era. The basin has an area of approximately 1,000 square miles and trends north-northwest.
The Santa Cruz fault is a high-angle normal fault that trends southeast to northwest. The closest segment of the fault to the Site runs from approximately the intersection of Flowing Wells Road and Prince Road northwest to approximately the intersection of Romero Road and Wetmore Road. According to available well logs, the Santa Cruz Fault displaces the middle and lower members of the Tinaja Beds and the Pantano Formation, but there is no evidence of displacement by the fault to sediments above the middle unit of the Tinaja Beds (Anderson, 1987). (See Section 3.5.3 for discussion of hydrogeologic units.) Anderson suggested that the fault may influence groundwater flow in the lower part of the regional aquifer, but that groundwater in the upper portion of the aquifer is probably not affected.
3.5.3 Hydrogeologic Units
The principal hydrogeologic units in the Tucson Basin consist of the basin-fill sediments, terrace deposits, and recent alluvium related to modern streams and washes. The regional aquifer beneath the Tucson Basin has been divided into the upper basin-fill aquifer and the lower basin-fill aquifer based on a contrast in permeability of the sediments. The upper basin-fill aquifer consists of unconsolidated sediments of the upper portion of the upper member of the Tinaja

Remedial Investigation Report Miracle Mile WQARF Site Arizona Department of Environmental Quality
11 June 12, 2013
URS Job No. 24097013
Beds, the Fort Lowell Formation, and recent alluvium in areas where it is saturated. The lower basin-fill aquifer consists of more consolidated and less permeable lower part of the upper member of the Tinaja Beds, the middle and lower members of the Tinaja Beds, and the Pantano Formation.
A brief description of the hydrogeologic units, in ascending order, is presented below.
Basement Complex
The rocks comprising the basement complex, which include pre-Oligocene igneous, metamorphic, and well-lithified sedimentary rocks, have low permeability and porosity. Although these rocks may contain small quantities of groundwater in fractures and joints, the basement complex is not considered to be part of the regional aquifer.
Pantano Formation
The mid-Tertiary Pantano Formation unconformably overlies the basement complex and consists of reddish-brown siltstone and mudstone; red and gray conglomeratic sandstone; and pebble conglomerate with interbedded andesitic flows, volcanic conglomerate, and tuffs. The formation is weakly to strongly-cemented with calcium carbonate (Davidson, 1973). Wells in the Tucson Basin have penetrated as much as 1,700 feet of Pantano Formation, but none of the monitor wells within the Site have encountered the Pantano Formation.
Tinaja Beds
The Tinaja Beds, of late-Tertiary age (early Miocene to late Pliocene), unconformably overlie the Pantano Formation or basement complex, depending on the location within the Tucson Basin. The Tinaja Beds range in thickness from 1 foot to 5,000 feet and are divided into three units: an lower, middle and upper (Anderson, 1987). These sediments were formed in a closed basin environment and contain evaporitic deposits in the middle and lower units.
The lower Tinaja unit consists of well-consolidated gypsiferous clayey silt, mudstone, sand, gravel, and moderately lithified conglomerate. The lower Tinaja unit is more consolidated and cemented than the upper and middle units. The lower Tinaja unit has not been encountered in monitor wells installed at the Site. Based on lithologic logs from water wells drilled in the basin, the thickness of the lower Tinaja Beds may exceed 2,000 feet in other parts of the basin (Anderson, 1987).
The middle Tinaja unit is differentiated from the upper member by deposits of moderate to well-consolidated gypsiferous and anhydritic clayey silt and mudstone. Anderson reported to Kleinfelder (1992) in a personal communication that the interbedded lacustrine deposits of the

Remedial Investigation Report Miracle Mile WQARF Site Arizona Department of Environmental Quality
12 June 12, 2013
URS Job No. 24097013
middle Tinaja beds, where present, may act as a semi-confining layer, separating the regional aquifer into upper and lower units. The thickness of this middle unit ranges from approximately 2,000 feet to nearly zero along the basin margins (Anderson, 1987).
The upper Tinaja unit consists of unconsolidated to weakly consolidated heterogeneous deposits of interbedded clayey silts, sandy silts, sands, and gravels. At many locations, grain size is coarse and similar to the overlying Fort Lowell Formation. At the Site, on the west side of the Santa Cruz Fault, the upper Tinaja unit is estimated to be about 300 feet thick and overlies the basement complex. East of the Santa Cruz Fault, the thickness of the upper Tinaja unit is approximately 500 feet. Relative silt and clay content is estimated to range from about 40 to 80 percent (CH2M Hill et al., 1987).
Fort Lowell Formation
The Quaternary Fort Lowell Formation unconformably overlies the Tinaja Beds and consists of unconsolidated to weakly consolidated heterogeneous deposits of interbedded clayey silts, sandy silts, sands, and gravels. Thickness of the Fort Lowell Formation is estimated to range up to 400 feet within the center of the Tucson Basin (ADWR, 2001). Approximate thickness of the Fort Lowell Formation near the Santa Cruz River and the Site is 25 feet; farther to the east, about 3 miles from the river, the thickness increases to approximately 250 feet. Relative silt and clay content is estimated to be about 40 to 60 percent (CH2M Hill et al., 1987).
The Fort Lowell Formation is considered to be the most productive unit in the Tucson Basin (Dames & Moore, 2000c). Hydraulic conductivity measurements reported by Davidson (1973) range from 1 foot per day to 350 feet per day (ft/day). Davidson (1973) reported a basin-wide measurement of 0.15 for specific yield.
Recent Alluvium
The recent alluvial deposits in the Tucson Basin consist of Pleistocene undifferentiated alluvial and intermediate terrace deposits, and Holocene terrace, stream, and floodplain deposits. These sediments are composed of unconsolidated, inter-bedded, coarse-grained sand and gravel with a small percentage of silt and clay. The deposits are highly variable in thickness, ranging from a thin layer at basin margins to almost 100 feet adjacent to major tributaries. The regional water table is below the recent alluvium at the Site. In the vicinity of the Site, the recent alluvium extends eastward from the Santa Cruz River for a distance of about 1 mile, and based on drilling logs, is approximately 30 feet thick (CH2M Hill et al., 1987).
Remedial Investigation Report Miracle Mile WQARF Site Arizona Department of Environmental Quality
13 June 12, 2013
URS Job No. 24097013
3.5.4 Perched Groundwater
Perched groundwater had been reported in wells and borings installed in the Site since at least 1944. Boring completion logs recorded by drilling contractor Carl W. Pister for production well FWID-61 (installed in 1944) and FWID-70 (installed in 1960) note groundwater was encountered at 61 and 90 feet bgs, respectively. Cascading groundwater was noted in down-hole video of well FWID-65 at approximately 80 feet bgs; the source of the cascading water was suspected to be a localized perched groundwater system. Boring logs for monitor wells IRA-1, IRA-2, IRA-3, IRA-4, IRA-5, IRA-6, IRA-7, and IRA-8 indicate increased moisture conditions encountered from depths ranging from 55 to 85 feet bgs. Monitor well IRA-10-100 was installed and completed at 100 feet bgs based on encountering perched groundwater at 93 feet bgs during drilling.
The data suggested the presence of perched water in three general locations. The first location of perched water was in the area near the intersection of Miracle Mile and Flowing Wells Road, near well FWID-65. However, no perched conditions were indicated in the logs for monitor wells 65A-1D, 65A-2D, or 65A-3D, suggesting that the perched zone could be localized. This area is south and outside of the current Site boundaries.
The second location where perched water was encountered is in the area of monitor well IRA-10-100, located just north of Roger Road, between Romero and Flowing Wells Roads. The third area was identified from the boring and geophysical logs from wells IRA-6, IRA-7, and IRA-8, which suggested that perched water could be present in the area of the Fairfax well, located on the R.E. Darling property. Figure 3 shows the locations of the IRA monitor wells.
3.5.5 Depth to Groundwater and Flow Direction in the Regional Aquifer
Beneath the Site, groundwater levels in the regional aquifer occur at an average depth of 140 to 190 feet bgs in the upper member of the Tinaja Beds and the Fort Lowell Formation. Due to groundwater pumping, the water level in the regional aquifer in the vicinity of the Site declined about 50 feet from 1947 to 1985 (CH2M Hill et al., 1987).
Groundwater level, direction of groundwater flow, and hydraulic gradient in northwest Tucson have been observed to vary over time. Groundwater flow direction in northwest Tucson ranges from northwesterly to northeasterly. Large variations occur in response to stream channel recharge events, while changes in pumping regimens for nearby wells cause smaller, more localized changes. Based on December 2011 water level measurements in the IRA monitor wells, the current groundwater flow direction is to the north-northwest (approximately N30°W), with a hydraulic gradient of less than 0.002 feet/foot. Maps showing groundwater elevation and flow direction of the regional aquifer from July 1999 through December 2011 are provided in

Remedial Investigation Report Miracle Mile WQARF Site Arizona Department of Environmental Quality
14 June 12, 2013
URS Job No. 24097013
Appendix D. Hydrographs of the IRA monitor wells are included in Appendix E. Pressure transducers were installed in monitor wells IRA-9, IRA-11-210, and IRA-13-210 in December 2001 to provide continuous water level measurements. The pressure transducers were removed from wells IRA-11-210 and IRA-13-210 in 2003 and placed in wells IRA-25 and IRA-26. Hydrographs prepared from the pressure transducer data through January 2005 are provided in Appendix F.
3.5.6 Groundwater Recharge and Discharge
Sources of groundwater recharge to the Tucson Basin include mountain front recharge; infiltration from surface flows in the Santa Cruz River, Rillito Creek, and other small ephemeral washes; irrigation return flow; subflow from groundwater basins to the south; and seepage from the Central Arizona Project aqueduct and laterals. Direct seepage from precipitation is negligible. In addition to irrigation return flow from agriculture, urban sources of irrigation return flow include landscaping, parks, golf courses, and cemeteries that are located near the Site. The Santa Cruz River receives discharge from the Roger Road sewage treatment plant as well as from storm water runoff. Effluent discharge rates vary seasonally (Lacher, 1996). Treated effluent at the Roger Road sewage treatment plant is also recharged in spreading basins as part of a City of Tucson Water Department aquifer storage and recovery project that stores effluent during the winter effluent peak. During summer peak demand times, the treated effluent is recovered and used for irrigation of parks and golf courses via a non-potable pipeline system.
Groundwater flow patterns in the aquifer are influenced by the occurrence and distribution of recharge. During large storm events, groundwater mounding occurs at the water table surface along stream channels, and the direction of groundwater flow may temporarily shift toward a direction approximately perpendicular to the stream channel. Recharge occurring along stream channels in response to storm runoff events is highly variable.
Figure 5 shows locations of natural and artificial recharge in the vicinity of the study area. The Tucson Active Management Area (ADWR, 1992) reported that flood irrigation using groundwater and treated effluent is practiced at the majority of these facilities. From 1986 to 1990, the average annual irrigation water use at these facilities was about 1,840 acre-feet. Discharge from the regional aquifer occurs through pumping wells, evapotranspiration, and as underflow out of the northwest end of the Tucson Basin.
3.5.7 Aquifer Parameters
In order to understand and assess plume migration and/or hydraulic containment systems, reliable estimates of transmissivity (the ability of the aquifer to transmit water), hydraulic conductivity (permeability), and specific yield must be available. Davidson (1973) estimated
Remedial Investigation Report Miracle Mile WQARF Site Arizona Department of Environmental Quality
15 June 12, 2013
URS Job No. 24097013
permeabilities of the upper Tinaja beds in the Tucson Basin to range from approximately 10 to 400 gallons per day per square foot (gpd/ft2), and 150 to 700 gpd/ft2 for the Fort Lowell Formation. The City of Tucson Water Department (Tucson Water) conducted a 72-hour pumping test at a well [(D-13-13) 29] and calculated hydraulic conductivities ranging from 110 to 480 gpd/ft2, with an average of 300 gpd/ ft2 (Kleinfelder, 1989).
In July 1990, Kleinfelder conducted an aquifer test that consisted of pumping well FWID-75 and using three nearby wells (FWID-70, FWID-66, and the Douglas well) for observation wells. Water-level drawdown was measured in the pumping well and the observation wells. Based on the recovery data from well FWID-75, transmissivity of the regional aquifer in the vicinity of the Site was estimated to be between 8,000 and 14,000 gallons per day per foot (gpd/ft). Drawdown and recovery data from the observation well (Douglas well) produced transmissivity estimates of 100,000 gpd/ft and 167,000 gpd/ft, respectively. The coefficient of storage, calculated from the test data, was estimated to be 0.0008 (dimensionless).
3.5.8 Pumping Wells in the Vicinity of the Miracle Mile WQARF Site
Patterns of groundwater flow in the vicinity of the Site are can be influenced by groundwater extraction from nearby production wells. The number and location of production wells, the pumping rates for individual wells, and the duration and schedule of pumping have changed over time. Historically, pumping regimens and recharge events may have combined to influence the direction of groundwater flow and gradient.
Recharge events and pumping from large capacity production wells may also result in changes in the vertical hydraulic gradient within the aquifer. Where vertical gradients exist, non-pumping wells may act as conduits for vertical movement of water within the aquifer. Vertical hydraulic gradient and vertical flow in conduit wells may also change over time in response to changes in recharge and pumping regimens.
FWID delivers water to approximately 16,000 customers in a 4-square-mile area, generally bounded by the Rillito River to the north, Interstate 10 to the west, Miracle Mile to the south, and Fairview Road to the east (Personal communication, Flowing Wells Irrigation District, 2012b). The FWID water system currently relies on groundwater pumped from eight production wells: FWID-59, FWID-60, FWID-61, FWID-70, FWID-71, FWID-72, FWID-73, and FWID-75. Locations of the FWID wells are shown on Figure 3. All of the FWID wells are completed in the regional aquifer. In general, the FWID wells are 12 to 24 inches in diameter and are screened over several hundred feet, with total depths ranging from 200 to 1,000 feet bgs. Pumping rates for individual wells in 1999 ranged from 390 to 1,150 gpm.

Remedial Investigation Report Miracle Mile WQARF Site Arizona Department of Environmental Quality
16 June 12, 2013
URS Job No. 24097013
According to 2011 pumpage data from FWID, the average daily demand for water ranged from 1.48 million gallons (Mgal) in December to 3.07 Mgal in June (FWID, 2012b). Maximum monthly demand required from the FWID system ranged from 92.1 Mgal in December 2011 to 108.1 Mgal in June 2011 (FWID, 2012b). The total amount of groundwater pumped from the eight FWID wells in 2011 was 798 Mgal, or 2,450 acre-feet. Table 1 presents a summary of the annual pumpage data for the FWID wells from 1979 through 2011. During 2011, five wells, FWID-59, FWID-61, FWID-72, FWID-73, and FWID-75 produced 83 percent of the total wellfield production. Table 2 provides monthly pumpage data for 2011 for the FWID wells.
Wells FWID-72 and FWID-75 are located within 1,000 to 2,000 feet of the Site plume, and FWID-70 is located just within the eastern plume boundary. Because of their location in relation to the Site plume, these three wells, if pumped extensively, could influence the migration of the contaminant plume. Pumping records from 2011 show that well FWID-70 produced a total of 49 Mgal; FWID-75 produced 148 Mgal; and FWID-72 produced 109 Mgal.
In 2006, FWID and ADEQ constructed a new 900 gpm groundwater treatment facility as an Emergency Response Action (ERA) (Section 5.3). The system consists of two 12-foot diameter, 20,000-pound Granular Activated Carbon (GAC) vessels to treat water pumped from the two municipal groundwater production wells (FWID-70 & FWID-75). From startup in January 2007 through December 2011, the system has treated 1.1 billion gallons of water and removed 5.8 pounds of TCE. Details regarding this ERA are presented in Section 5.3.
3.6 SURFACE WATER HYDROLOGY
The Tucson Basin is drained by the Santa Cruz River, which lies approximately 1 mile to 1½ miles west of the Site. Tributaries to the Santa Cruz River, all of which are ephemeral, include Rillito Creek, Tanque Verde Creek, Pantano Wash, and Canada del Oro Wash. The Santa Cruz River originates in the San Rafael Valley, on the east side of the Patagonia Mountains in Arizona. From the San Rafael Valley, it flows south into Mexico, then bends at the town of Santa Cruz to re-enter the United States just east of Nogales and flows north, cutting across the Tohono O’odham Indian Reservation for about 10 miles before winding its way through Tucson to flow into the Gila River basin. Prior to the 1940s and the beginning of large-scale agricultural groundwater pumping in the Tucson Basin, the Santa Cruz River was perennial to at least the north end of the Tucson Mountains. Today, the Santa Cruz River is ephemeral for its entire length and flows only in response to storm water flows and treated effluent discharges.
Remedial Investigation Report Miracle Mile WQARF Site Arizona Department of Environmental Quality
17 June 12, 2013
URS Job No. 24097013
4.0 PREVIOUS INVESTIGATIONS
On November 13, 1987, ADEQ signed the Record of Decision appropriating monies from the WQARF fund in order to characterize the geology, hydrology, and nature and extent of the VOC contamination at the MMIA. Section 4.0 summarizes the various Miracle Mile Site investigations conducted by ADEQ from 1989 to 1999 and by other parties in 1989 and 2004 (as indicated in the text). The focus of this section, however, is on the parts of the investigation pertaining to the Site area, as opposed to the much larger MMIA (Figure 1).
4.1 CERCLA INVESTIGATIONS – 1989-1999
Preliminary assessments (PA) and site investigations (SI) of several facilities, including the R.E. Darling, Abrams Airborne Manufacturing (Abrams), Spring Joint Specialists (Spring Joint), Wade’s Automotive, and Coca-Cola Bottling Company properties, within the MMIA boundaries were investigated by ADEQ and other area stakeholders under CERCLA authority from 1989 to 1999.
ADEQ conducted a site inspection of the R.E. Darling property under CERCLA in 1990 (Miller, 1990). Twelve soil-gas samples were collected at various locations throughout the R.E. Darling property and three neighboring properties south and east of the R.E. Darling property. VOCs were detected in each sample collected from the R.E. Darling property. TCE concentrations ranged from 0.006 to 6 µg/L. Benzene was detected at concentrations up to 6 µg/L in three locations: RED-5, RED-11, and RED-12. Figure 6 shows the locations of the samples collected.
ADEQ prepared a PA for the Abrams’ property, located adjacent and south of the Darling property in 1990. A subsequent SI was conducted at the Abrams facility in 1991 by ADEQ (Azar-Schuster, 1991). Data from the SI was used appropriately to assess the concerns at Abrams. The wells discussed in the SI are still a part of the current monitoring network at the Site.
ADEQ conducted an SI of the Spring Joint facility in July 1990. ADEQ collected five soil-gas and eight soil samples from various locations about the property (ADEQ, 1990a). The soil-gas samples were collected from approximately 8 to 9 feet bgs. Analytical results for the soil-gas samples showed TCE in four samples at concentrations ranging from 0.002 to 6.0 µg/L. Chromium was detected at 83.3 milligrams per kilogram (mg/kg) in one soil sample.

Remedial Investigation Report Miracle Mile WQARF Site Arizona Department of Environmental Quality
18 June 12, 2013
URS Job No. 24097013
4.2 ABRAMS INVESTIGATIONS
4.2.1 Site Investigation – 1989
On January 28, 1989, a soil and soil-gas survey was conducted on the Abrams’ property and prepared through Abrams’ legal counsel. The soil-gas survey was performed by HydroGeoChem, under the supervision of Environmental Engineering Consultants Inc. (EEC). EEC prepared a report (1989) for Abrams that summarized the investigation. The investigation consisted of soil-gas sampling at 12 locations, and drilling four soil borings to a depth of 15 feet. Soil-gas sampling locations were located uniformly around the Abrams’ property boundary. The soil-gas and soil samples were analyzed for TCE, PCE, and 1,1-DCE.
TCE was detected in 14 of the 16 soil-gas samples with concentrations ranging from less than 1.4 µg/L to 31.2 µg/L. The area with the higher concentrations of TCE in soil-gas was the southern portion of the property.
Soil samples were collected at 5, 10, and 15 feet bgs in each of the four borings. The only detected VOC was TCE, found in two of the 5-foot samples (0.04 mg/kg and 0.02 mg/kg). These sample locations corresponded to the soil-gas sample locations.
The report indicated that some shallow TCE soil contamination was found along Abrams’ southern property boundary. It was their conclusion that the values were generated by recent surface soil contamination, due to migration of contaminated rainwater emanating from the property or properties to the south or southeast of the Abrams facility (Environmental Engineering Consultants, 1989). They supported this theory by stating the contamination was found only in shallow soil (less than 10 feet deep) as no TCE, PCE or DCE was detected in the 10 to 15 foot depth samples and the sampling event occurred within 48 hours of a significant rain fall.
However, Dames & Moore’s review of this report concluded that the sampling event was not of sufficient scope to characterize potential sources on the entire property. It was also added that the fact that TCE was detected in 14 of the 16 soil-gas samples collected suggests that a potential source of contamination may exist on or near Abrams’ property. However, the source of the contamination would be difficult to identify without further sampling (Dames & Moore, 2000c).
A review done by URS (URS, 2002b) of the methodologies used during the EEC site investigation revealed the following:
• Soil-gas sampling was limited to the exterior area of the property;
• Soil-gas sampling indicated detectable concentrations well above background;

Remedial Investigation Report Miracle Mile WQARF Site Arizona Department of Environmental Quality
19 June 12, 2013
URS Job No. 24097013
• The soil-gas survey identified abrupt changes in sample concentrations, indicating the presence of a source, however only limited vertical characterization and no lateral characterization of the potential sources was performed, and;
• The soil type for the samples containing detectable concentrations of TCE were generally silty to clayey, whereas the soil below 5 feet was of a coarser nature. The coarseness and typically low organic carbon content of the soils in the site vicinity provide limited adsorption of organic compounds.
4.2.2 Plating Shop Testing Results – 1995
On July 30 and August 28, 1995, Abrams contracted an environmental consulting firm to test soil samples from various places around the property, see Figure 7a through Figure 7c. Abrams reported that there were no observed VOCs detected in the samples and that the metal concentrations were below Arizona non-residential SRLs. They also noted the “Dirt Pile” referenced in Figure 7c was fill dirt used during the facilities expansion and was tested prior to its use (Abrams, 2004).
4.3 PHASE I INVESTIGATION – 1988-1989
ADEQ contracted with Kleinfelder, Inc. in December 1987 to conduct a Phase I of the Site. The boundaries of the study area (MMIA) for the Phase I investigation are shown on Figure 1. The Phase I investigation consisted of collecting historical data, including water quality data, aerial photographs, and government records to provide background information on the geology, hydrogeology, and land use, and to identify facilities or areas that may be potential source areas. Survey questionnaires were distributed to approximately 300 facilities within the study area that may store, produce, or dispose of chemicals. Four areas were identified during the data compilation and review phase for which historic concentrations of VOCs, primarily PCE and TCE, in the groundwater were known to exceed the AWQS (Kleinfelder, 1989). The four areas consisted of:
• Silverbell Road at the police academy
• La Cholla Boulevard and Fort Lowell Road
• Romero Road and Fort Lowell Road
• The 3700 block of North Romero Road
Phase I field activities included a reconnaissance of properties and wells, collecting groundwater samples from 13 wells, including the Fairfax well, Tra-tel RV Park well, and three FWID wells, and collecting soil samples from 14 locations. The soil sample locations were selected based on

Remedial Investigation Report Miracle Mile WQARF Site Arizona Department of Environmental Quality
20 June 12, 2013
URS Job No. 24097013
the proximity of facilities to areas in which chemicals were detected in the groundwater. Groundwater samples were analyzed for general inorganic compounds, VOCs, and the eight Resource Conservation and Recovery (RCRA) metals (arsenic, barium, cadmium, chromium, lead, mercury, selenium, and silver). The soil samples were analyzed for VOCs and the eight RCRA metals.
Three of the 14 soil samples contained detectable amounts of benzene, toluene, ethylbenzene, and/or xylene; these chemicals are generally referred to as BTEX compounds. The concentrations of all of the BTEX detections were well below the current Arizona Soil Remediation Levels (SRLs; ADEQ, 2009). No other VOCs were detected. Metals concentrations in the soil samples were also well below the corresponding SRLs.
The analytical results from the groundwater samples collected during the Phase I Investigation showed three of the 13 wells contained detectable concentrations of VOCs. The wells with detectable VOCs are shown below:
Well ID / Owner Cadastral Location Compound
Detected Concentration
(µg/L) AWQS/MCL
(µg/l) WR-70A City of Tucson
(D-13-13) 34BBC PCE 137 5 TCE 3 5
Tetrachloroethane 2 No standard SCS-North Soil Conservation Service (D-13-13) 27CDD 1,1-DCE 2 7 FWID-70 Flowing Wells Irrigation District (D-13-13) 22DCD 1,1-DCE 2 7
Notes: µg/L = micrograms per liter; AWQS = Aquifer Water Quality Standards; MCL = Maximum Concentration Limit; PCE = Tetrachloroethylene; TCE = Tricholoroethylene; 1,1-DCE = Dichloroethylene Well WR-70A, located west of Interstate 10 and just north of Miracle Mile Road, was the only well that contained a VOC at a concentration above the AWQS. Based on the information obtained from the Phase I investigation, the boundaries of the MMIA study area were revised and reduced, as shown on Figure 1. Details of the Phase I investigation are presented in the Phase I Report (Kleinfelder, 1989).
4.4 AQUIFER TEST – 1990
In July 1990, Kleinfelder (1992) performed separate aquifer tests on FWID wells (FWID-70 and FWID-75) to obtain aquifer parameters of transmissivity and storage coefficient, or specific yield (a measure of the amount of water released from storage during pumping).
A single well drawdown test at well FWID-70 consisted of pumping at a flow rate of 266 gpm for 25 hours and monitoring the water level decline in the pumped well. Water levels were

Remedial Investigation Report Miracle Mile WQARF Site Arizona Department of Environmental Quality
21 June 12, 2013
URS Job No. 24097013
collected following the cessation of pumping to monitor recovery. Due to cascading water in the well, water levels were difficult to measure. Transmissivity estimated from recovery data was 2,500 gpd/ft, which is low compared to other Tucson basin pumping tests conducted on wells screened within the unconsolidated sedimentary units. Based on the apparent drawdown in the well, the specific capacity was estimated to be 3 to 4 gpm/ft. The specific capacity of a well, defined as the discharge rate divided by the total drawdown, is a function of aquifer hydraulic parameters, pumping rate, duration of pumping, and well efficiency. Specific yield was not calculated, as observation wells were not monitored during the aquifer test.
A drawdown/recovery test was conducted on well FWID-75 (beginning on July 26, 1990), which consisted of pumping at a flow rate of 1,272 gpm for 24 hours (Kleinfelder, 1992). Water levels were monitored in the pumping well and three observation wells: the Douglas well, which is a privately owned well located approximately 480 feet to the west; FWID-70; and FWID-66. Based on the recovery data from well FWID-75, transmissivity was estimated to be between 8,000 and 14,000 gpd/ft. The specific capacity of well FWID-75 was 13.8 gpm/ft of drawdown. Drawdown and recovery data from the observation well (Douglas well) produced transmissivity estimates of 100,000 gpd/ft and 167,000 gpd/ft, respectively. Kleinfelder (1992) calculated a storage coefficient of 8.3x10⁻⁴ based on drawdown data at the Douglas well.
The saturated screened interval of the Douglas well at the time of the aquifer test was approximately 230 feet. Assuming that hydraulic conductivity does not vary significantly throughout the saturated thickness, the hydraulic conductivity would range from 58.1 ft/day to 93 ft/day.
4.5 PHASE II INVESTIGATION – 1991-1992
The Phase II Investigation, also conducted by Kleinfelder (1992), focused on a smaller area of the MMIA (Figure 1), based on information obtained from the Phase I investigation. The Phase II investigation included additional facility inspections, facility record searches, historical records searches, and groundwater sampling in the areas of the Fairfax Industrial Park, the University of Arizona Experimental Farm, the Silverbell Landfill, and the Soil Conservation Service wells.
Ten monitor wells were installed during the Phase II investigation in an effort to define the extent and source of the contamination. In addition, 39 wells were sampled in several stages between December 1989 and December 1991 to provide additional groundwater quality data for specific regions of the study area. Five of the monitor wells, IRA-1 through IRA-5, were installed in the general vicinity of the Fairfax Industrial Park. The remaining five monitor wells (65A-1D through 65A-4D, and 65A-4S) were installed in the vicinity of wells FWID-65 and

Remedial Investigation Report Miracle Mile WQARF Site Arizona Department of Environmental Quality
22 June 12, 2013
URS Job No. 24097013
FWID-62 (Figure 3). The depths of the 10 monitor wells ranged from 110 to 251 feet bgs (Kleinfelder, 1992). The five IRA wells were completed in the regional aquifer.
Following the completion of well installation, Kleinfelder performed natural gamma and neutron logging of monitor wells IRA-1, IRA-2, IRA-3, IRA-4, IRA-5, 65A-1D, 65A-2D, 65A-3D, and 65A-4D. The neutron log is used for measuring moisture content above the water table and total porosity below the water table. In general, data obtained from the neutron log indicate relative porosity values of the formation, where a decrease in American Petroleum Institute (API) units represents an increase in relative formation porosity. The natural gamma log provides information on the presence of naturally occurring radioactive minerals in the geologic formation. It is commonly used for correlation purposes in areas where distinct lithologies are present.
Kleinfelder reported that the geophysical logs indicated the presence of “a water bearing, clay rich zone, and potentially local perched groundwater system.” This interpretation was based on a deflection in the neutron count and associated increase in gamma ray counts that occurred between 25 and 65 feet bgs in wells IRA-1, IRA-2, IRA-3, IRA-4, IRA-5, and 65A-4D. The geophysical logs are presented in a Technical Memorandum dated March, 1992 (Kleinfelder, 1992).
Low concentrations of PCE; TCE; 1,1-DCE; 1,2-dichloroethane (1,2-DCA); TCA; Freon-11; Freon-12; benzene; toluene; xylene; chloroethane; chloromethane; and dibromochloromethane were detected in 23 of the 39 wells sampled during the Phase II investigation. Seven of the wells contained VOCs in concentrations above the AWQS. Groundwater samples collected from well FWID-65 contained PCE, TCE, and benzene at 14.3 µg/L, 13.1 µg/L, and 21.3 µg/L, respectively. The Tra-tel RV Park well contained 18.8 µg/L of PCE. TCE was detected in the Crescent Manor Mobile Home Park well and the Fairfax well at 6.2 and 6.3 µg/L, respectively. The remaining three wells of the seven with VOC concentrations above the AWQS are located outside (south and west) of the current Site. TCE, PCE, and 1,1-DCE were detected in well FWID-70 but at concentrations below the AWQS.
A sample of water cascading from a perched zone at a depth of 80 feet bgs was also collected from well FWID-65 during the Phase II investigation. Well FWID-65 is located on the north side of Miracle Mile Interchange, west of Flowing Wells Road (Figure 3). Kleinfelder (1992) reported nitrate-nitrite and total dissolved solids (TDS) concentrations in the cascading water were 18 mg/L and 1,500 mg/L, respectively. Kleinfelder (1992) compared these concentrations with a regional aquifer well located 900 feet away that had nitrate-nitrite and TDS concentrations of 3 mg/L and 550 mg/L, respectively. The sample of cascading water also contained several
Remedial Investigation Report Miracle Mile WQARF Site Arizona Department of Environmental Quality
23 June 12, 2013
URS Job No. 24097013
VOCs, including PCE (at 19.0 µg/L), TCE (6.3 µg/L), and MTBE (118 µg/L). The Phase II report concluded that well FWID-65 was having a significant impact on the regional aquifer by acting as a conduit for VOC contamination in the perched groundwater zone to migrate to the regional aquifer. Well FWID-65 was abandoned in 1995 (ADWR, 1995).
4.6 IRA-6 AND IRA-7 – MARCH 1995
Regional monitor wells IRA-6 and IRA-7 were installed in March 1995 (SCS Engineers, 1995). Monitor well IRA-6 is located on the R.E. Darling property and was completed at a depth of 206 feet bgs. Monitor well IRA-7 is located on the Desert Auto property and was completed at a depth of 208 feet bgs. Figure 3 shows the locations of these monitor wells.
According to the well completion report, perched water was encountered during the drilling of monitor well IRA-7 within a zone of poorly-graded medium sand at approximately 67 feet bgs (SCS Engineers, 1995). Moist soils were encountered from approximately 65 to 75 feet bgs during the drilling of monitor well IRA-6, but water did not enter the borehole. A sample of the perched water encountered in the borehole of IRA-7 was collected and analyzed for halogenated and aromatic VOCs; results showed a concentration of 5.5 µg/L of TCE present. No other compounds were identified above the laboratory reporting limits (RLs) in the perched sample (SCS Engineers, 1995). Monitor well IRA-7 began showing TCE concentrations above the AWQS in June 1995 (Dames & Moore, 2000c).
4.7 INSTALLATION OF MONITOR WELLS – 1996
In mid-May 1996, monitor well IRA-8 was installed on the R.E. Darling property, approximately 25 feet west of the Fairfax well (Figure 3) (Growth, 1996). This well was installed to replace the previously abandoned Fairfax well and to provide a monitoring point for groundwater (Growth, 1996). The well was completed to a depth of 210 feet bgs and screened from 140 to 200 feet bgs.
A subsurface soil sample collected during the drilling of the IRA-8 borehole was analyzed for VOCs, aromatic VOCs, and the eight RCRA metals (Growth, 1996). Analyses showed that the soil sample did not contain any VOCs or aromatic VOCs above the RLs. Although barium, chromium, lead, and mercury were detected above the RLs, none of the metals analyzed exceeded their respective AWQS (Growth, 1996).
4.8 INSTALLATION OF MONITOR WELLS IRA-9 AND IRA-10 – 1997
Prior to 1995, TCE was detected in monitor wells IRA-1, IRA-2, IRA-3, and IRA-4 at concentrations below the AWQS of 5 µg/L. In January 1995, TCE concentrations in monitor well IRA-2 increased to 7.6 µg/L, and continued to increase through April 1997. In an effort to define the northern extent of VOC contamination in the groundwater, three additional monitor

Remedial Investigation Report Miracle Mile WQARF Site Arizona Department of Environmental Quality
24 June 12, 2013
URS Job No. 24097013
wells (IRA-9, IRA-10-100, and IRA-10-230) were installed from March through May 1997 at locations downgradient of monitor well IRA-2 (Figure 3) Monitor wells IRA-9 and IRA-10-230 were completed in the regional aquifer. During the installation of monitor well IRA-10-230, perched groundwater was encountered overlying a 6-foot thick clay layer at 100 feet bgs. Based on the occurrence of perched groundwater, a companion well, IRA-10-100, was installed and screened to intercept the perched water (Western Technologies, Inc., 1998). Well IRA-10-100 was the first monitor well completed in the perched groundwater zone.
4.9 QUARTERLY GROUNDWATER MONITORING
In addition to specific groundwater investigations, groundwater level measurements and groundwater quality samples were collected from several wells within the Site on a periodic basis, mostly quarterly, beginning in January 1992. Wells sampled included the IRA monitor wells, the Fairfax well (prior to June 2001), selected FWID wells, and two to three private wells (the Douglas, Crescent Manor, and Tra-tel RV Park wells). The data were compiled and presented in quarterly reports, which include summary tables of the analytical results, TCE, PCE, and chromium iso-concentration figures, and groundwater elevation maps.
4.10 SPRING JOINT INVESTIGATION - 2002-2004
In December 2002, Western Technologies was contracted by Spring Joint Specialists, Inc. to perform a Phase I Environmental Site Assessment on the Spring Joint property (Figure 2). This investigation included property and area information, including historic property use, a regulatory and local records review, site reconnaissance, and interviews. Western Technologies recommended the following: chromium analyses of the soil around the sumps that held hard chrome dipping tanks, removal of a suspect UST system, testing of the soil beneath the steam cleaning area and around the historical drum storage site, and disposal of a 55-gallon drum of phosphate esters (Western Technologies, 2002).
In 2003, Western Technologies was contracted by Spring Joint Specialists, Inc. to remove the USTs, piping, concrete slabs, and contaminated soils associated with the sump and chrome tanks located on of the property. Contaminated soil with hexavalent chromium levels as high as 3,420 mg/kg were excavated from the site and disposed of as hazardous waste (Western Technologies, 2003). A discussion of the removal based on available data is presented in Section 5.5.
In January 2004, Western Technologies was contracted by Spring Joint Specialists, Inc. to perform a Limited Site Characterization and Monitor Well Installation for the Spring Joint property. A total of five borings were drilled and three were completed as monitor wells, MW-1, MW-2, and MW-3. The other two soil borings, B1 and B2, were plugged and abandoned. The
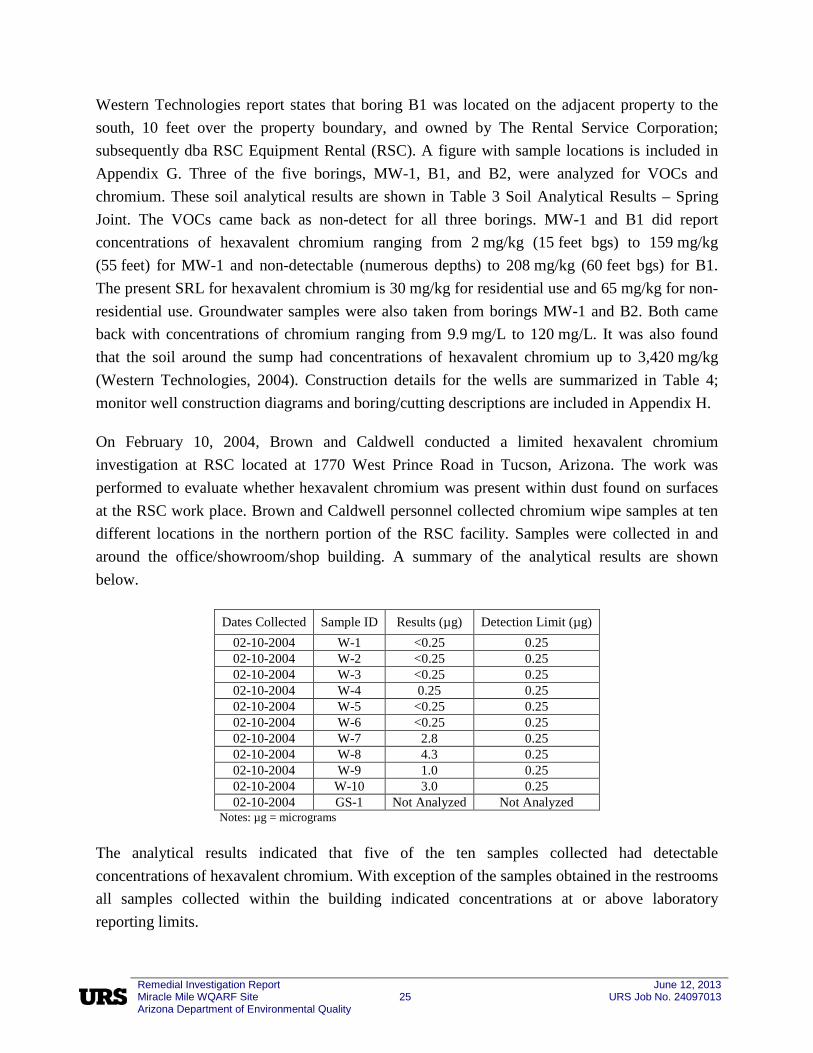
Remedial Investigation Report Miracle Mile WQARF Site Arizona Department of Environmental Quality
25 June 12, 2013
URS Job No. 24097013
Western Technologies report states that boring B1 was located on the adjacent property to the south, 10 feet over the property boundary, and owned by The Rental Service Corporation; subsequently dba RSC Equipment Rental (RSC). A figure with sample locations is included in Appendix G. Three of the five borings, MW-1, B1, and B2, were analyzed for VOCs and chromium. These soil analytical results are shown in Table 3 Soil Analytical Results – Spring Joint. The VOCs came back as non-detect for all three borings. MW-1 and B1 did report concentrations of hexavalent chromium ranging from 2 mg/kg (15 feet bgs) to 159 mg/kg (55 feet) for MW-1 and non-detectable (numerous depths) to 208 mg/kg (60 feet bgs) for B1. The present SRL for hexavalent chromium is 30 mg/kg for residential use and 65 mg/kg for non-residential use. Groundwater samples were also taken from borings MW-1 and B2. Both came back with concentrations of chromium ranging from 9.9 mg/L to 120 mg/L. It was also found that the soil around the sump had concentrations of hexavalent chromium up to 3,420 mg/kg (Western Technologies, 2004). Construction details for the wells are summarized in Table 4; monitor well construction diagrams and boring/cutting descriptions are included in Appendix H.
On February 10, 2004, Brown and Caldwell conducted a limited hexavalent chromium investigation at RSC located at 1770 West Prince Road in Tucson, Arizona. The work was performed to evaluate whether hexavalent chromium was present within dust found on surfaces at the RSC work place. Brown and Caldwell personnel collected chromium wipe samples at ten different locations in the northern portion of the RSC facility. Samples were collected in and around the office/showroom/shop building. A summary of the analytical results are shown below.
Dates Collected Sample ID Results (µg) Detection Limit (µg) 02-10-2004 W-1 <0.25 0.25 02-10-2004 W-2 <0.25 0.25 02-10-2004 W-3 <0.25 0.25 02-10-2004 W-4 0.25 0.25 02-10-2004 W-5 <0.25 0.25 02-10-2004 W-6 <0.25 0.25 02-10-2004 W-7 2.8 0.25 02-10-2004 W-8 4.3 0.25 02-10-2004 W-9 1.0 0.25 02-10-2004 W-10 3.0 0.25 02-10-2004 GS-1 Not Analyzed Not Analyzed
Notes: µg = micrograms
The analytical results indicated that five of the ten samples collected had detectable concentrations of hexavalent chromium. With exception of the samples obtained in the restrooms all samples collected within the building indicated concentrations at or above laboratory reporting limits.

Remedial Investigation Report Miracle Mile WQARF Site Arizona Department of Environmental Quality
26 June 12, 2013
URS Job No. 24097013
Duplicate samples were collected to be analyzed for total chromium as a gauge for detecting concentrations of hexavalent chromium in future samples based on a ratio between the two sets of sample wipes. However, RSC decided not to analyze the second set of wipe samples. A soil sample was also collected from a concrete pad near the building but was not analyzed.
Brown and Caldwell stated that the analytical results indicated the hexavalent chromium may have been present within the RSC building and that future testing needed to be considered (Brown and Caldwell, 2004).

Remedial Investigation Report Miracle Mile WQARF Site Arizona Department of Environmental Quality
27 June 12, 2013
URS Job No. 24097013
5.0 EARLY RESPONSE ACTIONS
ERAs are defined in Arizona Administrative Code (A.A.C.), Section R18-16-405(A), as remedial actions performed prior to selection of a final remedy at a site under A.A.C. Section R18-16-410 and which are necessary to accomplish one or more of the following:
1. Address current risk to public health, welfare, and the environment;
2. Protect or provide a supply of water;
3. Address sources of contamination; or
4. Control or contain contamination where such actions are expected to reduce the scope or cost of the remedy needed at the site.
Interim Remedial Actions are defined in Arizona Revised Statutes (A.R.S.) § 49-282.03(A) as an ADEQ remedial action taken to address the loss or reduction of available water from a well before the selection of a remedy, including making grants from the WQARF fund to provide alternative water supplies, well replacement or water treatment. Thus, an Interim Remedial Action is a specific type of ERA.
To date there have been four ERAs implemented at the Site to affect the groundwater VOC plume and prevent human exposure:
• Re-abandonment of the potential conduit Fairfax well at the R.E. Darling facility;
• Well FWID-72 re-equipping to address FWID’s loss of use of wells due to TCE contamination;
• Construction and continued operation and maintenance of a GAC treatment system to remove TCE from water pumped from FWID wells 70 and 75; and
• Installation of an engineered asphalt cap over chromium-contaminated soil at the Spring Joint property.
There has also been one other remedial activity performed to mitigate the impact of COC releases at the Site which is not defined herein as an ERA because it was not reviewed by ADEQ:
• Removal of waste and contaminated soil from the Spring Joint property.
These actions, summarized in the following sections, have been undertaken by ADEQ, FWID, and Spring Joint, individually or cooperatively.

Remedial Investigation Report Miracle Mile WQARF Site Arizona Department of Environmental Quality
28 June 12, 2013
URS Job No. 24097013
5.1 FAIRFAX WELL ABANDONMENT – 1995 AND 2002
The Fairfax well, located on the R.E. Darling property at 3749-3769 North Romero Road (Fairfax Industrial Park), was a private water supply well. Previous investigations (Growth, 1995) hypothesized that this well could be a conduit for the migration of VOC-contaminated perched water to the regional aquifer. Water moving downward in the vadose zone could potentially encounter contaminant vapors or contaminants that are bound in soils, and re-mobilize and transport the contaminants laterally until they intersected the well and downward via the Fairfax well into the regional aquifer. If laterally migrating water encounters a well with a perforated interval or improperly sealed annulus, the well could provide a conduit for rapid vertical movement to the regional aquifer. The well is located near the area where high concentrations of VOCs have been detected in the perched groundwater zone and the regional aquifer.
The date, total depth, and details of the original Fairfax well construction are unknown, but the history of the property on which the well is located dates back to the late 1930s. In 1976, the well was deepened from 130 feet to 242 feet and 6-inch diameter steel casing was installed to a depth of 240 feet with slotted casing from 140 to 240 feet. It was indicated that the existing borehole or well casing was at least eight inches in diameter. If this was not the case, the new casing and equipment would not have been able to fit down the previous borehole. Based on the driller’s invoice information, it is assumed that the 8-inch casing observed at land surface prior to final abandonment was casing for the original well. The depth and perforated interval of the 8-inch casing are unknown. See Figure 8a and 8b. There were no records for annular materials or seals. Static water level after completion in 1976 was 133 feet bgs.
Growth was contracted by ADEQ in May 1995 to either modify or abandon the Fairfax well. ADEQ was concerned that the well presented a potential route for the transport of TCE from the perched groundwater into the regional aquifer by means of cascading water through the original casing perforations, holes and cracks in the well casing itself, or the annular space between the casing and the borehole (Growth, 1995).
ADEQ initially decided to modify the well and convert it to a monitor well by installing new seals and 4-inch diameter slotted steel casing.
A video of the well showed that the 6-inch diameter well casing was intact and there did not appear to be any evidence of cascading water. The modification consisted of perforating the 6-inch steel casing from a depth of 100 feet to 135 feet bgs, which was performed on August 1, 1995. Installation of the new 4-inch diameter well casing began August 2, 1995, and included a 5-foot layer of bentonite and 3-foot layer of sand at 212 feet, the top of fill in the 6-inch diameter
Remedial Investigation Report Miracle Mile WQARF Site Arizona Department of Environmental Quality
29 June 12, 2013
URS Job No. 24097013
well. Then the installation of the 4-inch diameter steel casing inside the 6-inch diameter casing was attempted. The casing got to a depth of approximately 140 feet when it encountered bridging of bentonite. The plug was drilled out and the casing was installed to a total depth of 202 feet bgs (Growth, 1995). Filter gravel pack was placed from 136 feet to 202 feet bgs. A 5-foot bentonite seal was placed between 131 feet and 136 feet bgs (Figure 8c).
On August 9, 1995, attempts to grout the well annulus between the 4-inch diameter casing and the 6-inch diameter failed. It appeared that a substantially larger amount of cement slurry was placed in the well than the amount required to fill the estimated annular volume. Fluids from inside the 4-inch diameter well casing indicated the presence of cement inside the well. Cement slurry may have been infiltrated into the regional aquifer through the newly cut perforations (from 100 feet to 135 feet bgs) in the 6-inch diameter casing via the 8-inch diameter well. After a second attempt using thicker cement slurry failed, the decision was made to cease the well modification activities and abandon the well (Growth, 1995). The grouting efforts resulted in an estimated amount of cement slurry in the 4-inch and 6-inch wells, which were filled to approximately 180 and 124.5 feet bgs, respectively (Figure 8d).
On August 17, 1995, the inner well casing was abandoned by pressure grouting. Cement-bentonite slurry (abandonite) was pumped into the 4-inch diameter casing by pressure grouting using a tremie pipe installed at 140 feet bgs. The slurry was then poured into the outer (6-inch) casing annulus bringing the top of cement to 32 feet bgs. The upper 10 feet of the 6-inch well casing was cut, and the annulus of the casing was backfilled with a cement-bentonite grout (Growth, 1995). The Growth abandonment report did not discuss the annular space outside of the 6-inch diameter well casing or the original 8-inch diameter well (Figure 8e).
In December 1999, ADWR conducted a review of the Fairfax Well Abandonment Report (Growth, 1995) and concluded that the well may not have been properly abandoned to prevent vertical cross-contamination between any perched groundwater zone and the regional aquifer. ADWR stated “In general, it is believed that a combination of potentially weak-grout settling, micro-annulus cracks, and, or, bridging of seal material, particularly through the original borehole and gravel pack zone in the 4-inch annulus, has left the abandonment of this well in question. It would appear that during original efforts to grout the 6-inch casing some material may have hardened haphazardly and created obstructions to achieving an adequate seal.”
A perched groundwater monitor well, IRA-16, was installed in June 2001 approximately 25 feet west of the Fairfax well and completed in the perched groundwater zone as documented in the Phase I Monitor Well Installation Report (URS, 2001a). The first sample collected from well
Remedial Investigation Report Miracle Mile WQARF Site Arizona Department of Environmental Quality
30 June 12, 2013
URS Job No. 24097013
IRA-16 in June 2001 showed a TCE concentration of 660 µg/L and indicated the presence of high concentrations of TCE in the perched groundwater zone adjacent to the Fairfax well.
To ensure that this potential conduit was properly abandoned, URS conducted a re-abandonment of the Fairfax well in June 2002 (Figure 8f), using an RT-1800 mud-rotary drilling rig. Details of the work completed by URS can be found in the Fairfax Well Re-Abandonment Report (URS, 2005d). Figure 8 shows the history of the well construction up to the re-abandonment.
Regional well IRA-8 is located approximately 35 feet from the Fairfax well site and is screened at similar depths (140 feet to 200 feet bgs). Sixteen sampling events have been conducted since the re-abandonment effort in June 2002. Figure 9 shows the TCE concentration in well IRA-8 has declined from September 2002 (56 µg/L) to December 2011 (13.5 µg/L). These results indicate that the Fairfax well is no longer contributing contamination to the regional aquifer.
5.2 ALTERNATIVE WATER SUPPLY FOR FWID – 1987-1998
FWID currently operates eight groundwater production wells that supply potable water to approximately 16,000 municipal, domestic, and industrial customers within a 4-square-mile area (Personal communication, Flowing Wells Irrigation District, 2012b). In July 1998, FWID formally requested ADEQ to conduct an interim remedial action (IRA) in accordance with A.R.S. § 49-282.03.A, to address the loss or reduction of available water from FWID wells due to VOC contamination. To evaluate feasible IRAs, ADEQ contracted with URS to conduct an alternative water supply study for wells FWID-61, FWID-66, and FWID-75; the results were presented in a report submitted to ADEQ (Dames & Moore, 2000a). The purpose of the study was to determine the minimum IRA that would be necessary to address the short-term loss of production from wells FWID-61, FWID-66, and FWID-75 until the final site remedy could be determined and implemented.
From approximately 1987 through 1998, nine FWID groundwater production wells were used to meet the domestic water supply demand (Table 1). In December 1997, one well (FWID-66) was taken out of service because TCE concentrations were approaching the MCL (and AWQS) of 5 µg/L. A second well (FWID-75), located near the northern boundary of the Site boundary, was only pumped once a week due to high operating costs associated with the size of the pump and the depth to water in the well. FWID also owns two wells, FWID-69 and FWID-74, which have been out of service since 1986. Well FWID-69 was taken out of service because the well is crooked and, due to the close proximity to a nearby street, logistically difficult to operate and maintain. Well FWID-74 was taken out of service due to increasing concentrations of nitrate and the close proximity of numerous septic systems. Four other FWID wells (FWID-62, FWID-63,
Remedial Investigation Report Miracle Mile WQARF Site Arizona Department of Environmental Quality
31 June 12, 2013
URS Job No. 24097013
FWID-64, and FWID-65) have been out of service since at least 1980 because they are either dry or have been abandoned.
URS reviewed the existing data on the FWID wells and distribution system and identified, screened, and evaluated a number of water supply and remedial alternatives. Factors considered in the evaluation of water supply alternatives included cost, effectiveness, implementability, and the impact of the IRA on the final remedy resulting from the RI/FS (Dames & Moore, 2000a).
The alternatives were also evaluated on the overall protection of human health and the environment; compliance with applicable or relevant and appropriate requirements; long-term effectiveness and permanence; reduction of toxicity, mobility, or volume through treatment; and community acceptance (Dames & Moore, 2000a).
After detailed evaluation, it was determined that only Additional Storage and Booster Pumps at FWID-72 satisfied the objectives of the IRA, passed the threshold criteria of overall protection of human health and the environment, and met applicable state (and/or federal) environmental laws, regulations, or standards determined to be applicable or relevant and appropriate requirements (Dames & Moore, 2000a). Implementation of this alternative would provide FWID an immediate and reliable source of drinking water to replace the water lost due to the contamination of well FWID-66.
Well FWID-72 was deepened from 515 feet to 1,000 feet bgs in February 1997. In February 2001, FWID and ADEQ signed an agreement under which FWID would construct a new water supply facility at the location of well FWID-72, (with ADEQ reimbursing FWID for these costs); the new water supply facility would consist of a 500,000-gallon water storage tank, booster pumps, and a 5,000-gallon hydropneumatic pressure tank. In March 2001, ADEQ issued approval to FWID to proceed with construction. Well FWID-72 came on line with the new pump and reservoir in December 2001. The result of the upgrade was doubling of output, from 300 gpm to 600 gpm (Personal communication, Flowing Wells Irrigation District, 2012a).
In March 2004, URS compiled water level data collected since the cessation of pumping at wells FWID-75 and FWID-66 and compared them with historical water level data to evaluate any changes in groundwater flow direction. The data analysis indicated that the previously north-northeasterly trending groundwater, and TCE plume, had begun to shift toward the north and north-northwest, closely approximating what the regional groundwater trend was prior to the influence of local pumpage.
Remedial Investigation Report Miracle Mile WQARF Site Arizona Department of Environmental Quality
32 June 12, 2013
URS Job No. 24097013
5.3 CONSTRUCTION OF GAC SYSTEM FOR FWID – 2006
In 2006, FWID and ADEQ constructed a new 900 gpm groundwater treatment facility located at the existing Roger Road pumping and storage facility site. The system consists of two 20,000-pound GAC vessels to treat water pumped from the two municipal groundwater production wells (FWID-70 & FWID-75). The purpose of the system is to ensure that FWID continues to be able to serve water from these two wells which meets the federal drinking water standards. From startup in January 2007 through December 2011, the system has treated 1.1 billion gallons of water and removed 5.8 pounds of TCE.
5.4 INSTALLATION OF PAVEMENT CAP AT SPRING JOINT – 2005
To further characterize the horizontal and vertical extent of contamination at the Spring Joint property located at 3660 North Romero Road, 27 shallow soil borings, 6 indoor soil borings, and 1 regional aquifer groundwater monitor well were installed during June 2004 through February 2005. Results obtained from the shallow soil borings in an area of the northeast corner detected chromium in levels above the pre-2007 residential soil remediation levels but below non-residential soil remediation levels. Chromium levels ranged from 2,800 mg/kg to 9.3 mg/kg at 0-6 inches bgs and 1,700 mg/kg to 6.8 mg/kg at 2-3 feet bgs. Due to the uncertainty of the future uses for the facility, ADEQ directed URS to design and install an asphalt cover system to reduce the potential for exposure to dusts containing chromium. In April 2005, a cover system was installed which consisted 2-inches of asphaltic concrete compacted on 4-inches of compacted aggregate base course. The final dimensions of the asphalt cover system are shown on Figure 10 and are 53'-3" by 57'-10" by 53'-3" by 55'-3".
5.5 REMOVAL OF WASTE AND CONTAMINATED SOIL FROM SPRING JOINT – 2003
In 2003, Western Technologies was contracted by Spring Joint Specialists to remove USTs and associated equipment, the washwater UST, concrete in the washdown area, and arrange for excavation of contaminated soil. As the removal operations took place, additional contaminated soil were observed under and surrounding the concrete pads and tanks. Contaminated soil was excavated and disposed of as hazardous wastes due to the high levels of chromium detected in the soil. ADEQ’s information regarding this removal action is limited1.
1 Western Technologies has informed ADEQ that there is no final report issued for the chromium removal that documents the three dimensional volume of soil removed, the exact location of the removed soil, the locations of post-excavation soil sampling results, source of the fill, etc. ADEQ’s information comes from discussion with Western Technologies and some draft figures and laboratory data obtained from Western Technologies (with Spring Joint Specialists’ permission). Western Technologies informed ADEQ that Spring Joint Specialists, Inc. did not have Western Technologies produce a soil excavation report.

Remedial Investigation Report Miracle Mile WQARF Site Arizona Department of Environmental Quality
33 June 12, 2013
URS Job No. 24097013
6.0 REMEDIAL INVESTIGATION FIELD ACTIVITIES (1999 – 2011)
The RI field activities undertaken by ADEQ were designed to provide data and information to evaluate the source(s), and nature, and extent of VOC contamination in soils and groundwater, to characterize the hydrogeology beneath the Site, present and evaluate the factors that influence the fate and transport of COCs, and assess the potential and actual risks to human health and the environment posed by the presence of COCs in the soil and groundwater.
A series of soil-gas surveys (passive and active), soil sampling, and groundwater sampling were conducted by URS to identify the source(s), types of VOCs, and the lateral extent of VOC and chromium contamination in a cost-effective manner.
The rationale, method, and procedures of the vadose zone and groundwater investigations are discussed in the following sections. Figure 3 shows the well locations; Figure 2 shows the locations of the property boundaries related to the RI field investigations.
6.1 VADOSE ZONE SOIL INVESTIGATIONS
Five separate soil-gas and three soil surveys of areas within the Site have been conducted since 2001 for the purpose of identifying the nature, extent and potential source areas of VOC contamination in the subsurface soil, and to define the extent of VOC contamination in the perched groundwater zone. The presence of VOCs, which have a high vapor pressure and low water solubility, in soil and groundwater provides an opportunity to locate potential contaminant source areas using soil-gas surveys. Spills, leaks, and releases of VOCs to surface soils will result in diffusion of those VOCs through the vadose zone. In addition, VOCs in groundwater have a strong potential to partition from the dissolved phase into the overlying vadose zone soil-gas and migrate through the vadose zone toward the ground surface. For these reasons, passive soil-gas surveys over large areas can assist in identifying surface release locations as well as the areal extent of groundwater contamination. Passive soil-gas sampling can reduce investigative costs by characterizing suspected contamination over a large area without the need for drilling numerous soil borings and groundwater monitor wells. The results of the passive soil-gas survey were used to identify suspected source area locations.
Vadose zone investigations for the Site RI consisted of four phases of passive soil-gas surveying, one active soil-gas survey, and three soil sampling assessments.

Remedial Investigation Report Miracle Mile WQARF Site Arizona Department of Environmental Quality
34 June 12, 2013
URS Job No. 24097013
6.1.1 Field Investigations
Phases I and II of the passive soil-gas survey were conducted in spring 2001. The results from Phases I and II soil-gas surveys were used to develop the active soil-gas survey and Phase III passive soil-gas survey, which refined the delineation of the contaminant plume.
6.1.1.1 Phase I: Passive Soil-Gas Survey – February 2001
The Phase I passive soil-gas survey was conducted from February 12 through 15, 2001, and consisted of the installation of 321 GORE-SORBER® Screening Modules (modules) to a maximum depth of 3 feet bgs over an approximately 38-acre area on a 75-foot interval grid. The modules used in the passive soil-gas survey had been accepted by the EPA as an accurate screening method for delineating concentrations of VOCs in soil (EPA/600/R-98/095; August 1998b). This technology does not give actual concentrations of VOCs – just spatially relative masses. Figure 11 shows the passive soil-gas sample locations for Phases I, II, and III; Phase I sample locations are shown in yellow. The 75-foot grid encompassed the area of the Friedman Recycling, A Family Discount Storage, Public Storage Inc., and R.E. Darling properties.
The modules were left in the ground for 14 days to adsorb VOC vapors. After 14 days, the modules were removed and prepared for shipment to the W.L. Gore & Associates (GORE) Screening Module Laboratory in Elkton, Maryland, for analysis. The results and interpretation of the Phase I and II passive soil-gas survey data are discussed in Section 7.4.1 and 7.4.2.
6.1.1.2 Phase II: Passive Soil-Gas Survey – April 2001
The Phase II passive soil-gas survey was conducted on April 10 and 11, 2001, and consisted of installing 121 modules on a reduced, 25-foot grid. The Phase II survey focused on the areas where the highest TCE concentrations were detected during the Phase I survey, primarily along the central portions of the Public Storage Inc. and R.E. Darling properties. The modules were installed to a maximum depth of 3 feet bgs over an area encompassing a total of approximately 4.4 acres. Phase II passive soil-gas sample locations are shown in Figure 11 in orange.
As in Phase I, the modules were left in the ground for 14 days to adsorb VOC vapors. After 14 days, the modules were removed and prepared for shipment to the GORE Screening Module Laboratory for analysis. Details of the Phases I and II soil-gas surveys are presented in the Final Phase I and 2 Soil Gas Survey Report – Miracle Mile WQARF Site (URS, 2001b).
6.1.1.3 Active Soil-Gas Survey and Soil Sampling – May 2002
Based on the Phase I and II passive soil-gas survey screening results (Section 7.4.1), URS designed an active soil-gas survey and soil characterization program to obtain vertical profiles of

Remedial Investigation Report Miracle Mile WQARF Site Arizona Department of Environmental Quality
35 June 12, 2013
URS Job No. 24097013
VOC contamination in the vadose zone. The design included installation and sampling of 10 soil borings in the areas identified by Phase I and II surveys as having elevated TCE masses. Previous subsurface investigations had identified a perched groundwater zone near the study area. Groundwater sampling was included in the sampling plan in anticipation of encountering the perched groundwater zone. Between May 14 through 23, 2002, URS drilled 10 soil borings from which a total of 70 active soil-gas samples, 70 soil samples, and two perched groundwater samples were collected. Soil Borings No. 1 and 2 were located on the Friedman Recycling property, Soil Borings No. 3 and No. 4 were located on the Public Storage property, and Soil Borings No. 5 through 10 were located on the R.E. Darling property. Figure 12 presents the locations of the soil borings, Figure 2 shows the property locations and boundaries, and Appendix I contains the boring logs.
The results of the active soil-gas survey and soil samples are discussed in Section 7.4.3. Details of the May 2001 soil boring installations, active soil-gas sampling, soil sampling, and perched groundwater sampling are presented in the Draft Vertical Profiling-Soil Boring Installation Report, Remedial Investigation/Feasibility Study – Miracle Mile WQARF Site (URS, 2003b).
6.1.1.4 Phase III: Passive Soil-Gas Survey – June 2002
On June 26, 27, 28, and July 1, 2002, URS conducted Phase III of the passive soil-gas survey. Phase III consisted of installing 77 modules on grid spacing ranging from 40 to 75 feet along the northern and southeastern portions of the study area. One group of modules was installed from east to west along both sides of Price Road at the northern boundary of the study area. The second group of modules was installed from north to south along both sides of Romero Road, on portions of the property adjacent to the southern boundary of the study area, and on property east of Romero Road and southeast of the study area. The passive soil-gas modules were installed to a maximum depth of 3 feet bgs over a total area of approximately 6 acres.
After a period of 14 days in the ground, the modules were removed and submitted to the GORE Screening Module Laboratory for analysis. The results of the passive soil-gas survey are discussed in Sections 7.4.1 and 7.4.2. Details of the Phase III passive soil-gas survey were presented in the Final Phase 3 Soil Gas Survey Report - Miracle Mile WQARF Site (URS, 2002a).
6.1.1.5 Abrams Airborne Soil and Passive Soil-Gas Sampling – June to September 2004
Additional passive soil-gas sampling was conducted between June and September 2004 as a part of an Expanded Site Inspection (ESI) of the Abrams property (Figure 2). The Abrams ESI was conducted to assess the extent of contamination occurring in the subsurface soils in the immediate area around and beneath the Abrams facility. The ESI activities included the

Remedial Investigation Report Miracle Mile WQARF Site Arizona Department of Environmental Quality
36 June 12, 2013
URS Job No. 24097013
installation of 92 passive soil-gas modules, eight soil borings, and four perched groundwater monitor wells.
Soil samples collected during the 2004 Abrams ESI fieldwork were analyzed for VOCs and eight RCRA Metals. Samples were collected from all temporary borings and perched well borings, as well as from 11 of the passive soil-gas locations.
According to the May 5, 2004, Abrams ESI Work Plan, the soil matrix samples collected at 5-foot intervals during the installation of the four perched groundwater monitor wells were to serve as background samples for comparison with soil samples collected from the temporary borings located along the northern property line. For each organic and inorganic analyte, the maximum value, average (mean) value, standard deviation, population size and the 95% upper confidence limit were calculated. For analytes where all values were at the level of detection, the 95% upper confidence limit was reported as the laboratory detection limit. These calculated 95% upper confidence limit values serve as background values for the ESI to which remaining inorganic analytical results are compared.
The passive soil-gas installations for the Abrams ESI occurred between June 23 and 25, 2004 for exterior installations and August 28, 2004, for interior installations. The locations are shown in Figure 13. The modules were installed in borings approximately 3 feet bgs, and were allowed to remain in the ground for at least 14 days. The exterior samplers were removed July 13, 2004; the indoor samplers were removed September 18, 2004. The modules were sent to the GORE Screening Module Laboratory for analyses. The modules were analyzed for PCE; TCE; 1,2-DCA; 1,1,1-TCA; 1,1-DCA; MTBE; cis-1,2-dichloroethylene (cis-1,2-DCE); and trans-1,2-dichloroethylene (trans-1,2-DCE); Details regarding the Abrams passive soil-gas sampling are presented in Abrams Airborne Soil Borings and Well Installation Report, Expanded Site Investigation (URS, 2005a).
The Abrams ESI also included installing and abandoning eight temporary soil borings in August 2004, inside the Abrams building, in the plating and painting area. The locations are shown in Figure 13. The borings were performed by Yellow Jacket Drilling Services using an L-10-T Limited Clearance Propane Powered Hollow Stem Auger drill rig. The borings and depths were: Abrams-S-12 (45.75 ft), Abrams-S-13 (40.92 ft), Abrams-S-14 (40.75 ft), Abrams-S-15 (46.5 ft), Abrams-S-16 (41 ft), Abrams-S-17 (45.5 ft), Abrams-S-18 (45.25 ft), and Abrams-S-19 (47.5 ft). Soil samples were collected at 5-foot intervals from each boring and were analyzed for hexavalent chromium, metals, cyanide, and VOCs.

Remedial Investigation Report Miracle Mile WQARF Site Arizona Department of Environmental Quality
37 June 12, 2013
URS Job No. 24097013
Soil samples were also collected during the installation of the four perched groundwater monitor wells for the Abrams ESI. Soil samples were collected at 5-foot intervals, and analyzed for hexavalent chromium, eight RCRA metals, zinc, cyanide, and VOCs.
Results from the Abrams ESI soil sampling are discussed in Section 7.4.6. Details of the Abrams ESI are presented in Abrams Airborne Soil Borings and Well Installation Report, Expanded Site Investigation (URS, 2005a).
6.1.1.6 Spring Joint Facility – 2004-2005
An SI was conducted between June 2004 and February 2005, at the Spring Joint property (Figure 2), located at the southeastern end of the Site. The objective of the SI was to assess the extent of possible VOC and chromium contamination occurring beneath the Spring Joint property. Field activities included the installation and abandonment of 27 shallow soil borings, six indoor soil borings, and the installation of one regional aquifer monitor well. The locations are shown in Figure 14 and a summary of the analytical results are presented in Table 3. Details of the Spring Joint SI are presented in Section 7.4.6.3 and in the Spring Joint Facility Borings and Well Installation Report (URS, 2005c).
The 27 soil borings were installed to a depth of 3 feet bgs and abandoned on June 22, 2004. The borings were performed by Johnson Environmental Technologies using a push rig with a 2-inch GeoprobeTM sampler. Samples were collected from each boring at two distinct depths: one from the top 6 inches of the bore and the second from the bottom 12 inches of the bore. Samples collected during the shallow soil boring efforts were analyzed for VOCs, total chromium, and hexavalent chromium. Total chromium was detected above the pre-20072 residential SRL in the northeast corner of the property. To reduce potential exposure to dust containing chromium, an asphalt cap was constructed in the northeast corner of the Spring Joint property. See Section 5.4 for further discussion of the cap installation.
In February 2005, six soil borings were installed inside of the Spring Joint building and were completed in areas that had potential for release of contaminants to the subsurface. This determination was based on visual inspection of the facility and identifying existing concrete punctures and discolored areas. The borings were performed by Johnson Environmental Technologies using a push rig with a 2- or 4-inch GeoprobeTM sampler. Due to height restrictions of the drill rig, borings SJ-BD-B1, SJ-BD-B3, SJ-BD-B4, and SJ-BD-B5 were only advanced to
2 Prior to May 5, 2007, the residential and non-residential SRLs for Cr-total were 2,100 mg/kg and 4500 mg/kg, respectively. On May 5, 2007, updated SRLs went into effect; the updated SRLs include residential or non-residential SRLs for Cr-3 and Cr-6 but not Cr-total.

Remedial Investigation Report Miracle Mile WQARF Site Arizona Department of Environmental Quality
38 June 12, 2013
URS Job No. 24097013
6-feet, and borings SJ-BD-B2 and SJ-BD-B6 were advanced to 20 feet. Samples were analyzed for VOCs and eight RCRA metals. The results of the analyses are summarized in Spring Joint Facility Borings and Well Installation Report (URS, 2005c). The borings were abandoned by filling with bentonite pellets and sealing the core in the concrete floor with quickcrete.
Soil samples were also collected from the Spring Joint property during the drilling of regional groundwater monitor well IRA-31, located on the western portion of the Spring Joint property. The well was drilled to 210 feet and soil samples were collected at every 5-foot interval. A total of 43 soil samples were collected during the drilling and analyzed for total chromium. Ten of the forty-three samples resulted in detectable levels of total chromium and were subsequently analyzed for hexavalent chromium.
6.2 GROUNDWATER INVESTIGATIONS
Seven separate investigations of the perched groundwater zone and the regional aquifer, including exploratory drilling, sampling, and monitor well installation, were conducted. The four types of wells located within the site include: 19 wells in perched groundwater (screened interval from 55.5 to 101.5 feet bgs); 20 wells in the shallow regional aquifer (screened interval from 130 to 240 feet bgs); 1 (Flexible Liner Underground Technologies, Ltd. Co.) FLUTe well to allow for discrete samples at multiple levels; and 3 wells in the intermediate regional groundwater (269 to 355 feet bgs). Most recently, in 2011, six additional regional monitor wells were installed to assess the lateral extent of contamination in the regional aquifer.
The following sections provide an overview of the groundwater investigations conducted at the Site as part of the RI/FS from May 1999 through December 2011. The RI groundwater investigations are described in detail in the following reports:
• Phase I Monitor Well Installation Report, Miracle Mile WQARF Site Remedial Investigation Feasibility Study (URS, 2001a) (includes installation of groundwater monitor wells IRA-11-70/210, IRA-12-70/210, IRA-13-70/210, IRA-14, IRA-15, and IRA-16)
• Monitor Well Installation Report, IRA-17 through IRA-23, IRA-25 and IRA-26, Miracle Mile WQARF Site Remedial Investigation Feasibility Study. (URS, 2003a)
• Vertical Profiling-Soil Boring Installation Report, Remedial Investigation/Feasibility Study- Miracle Mile WQARF Site (URS, 2003b)
• Abrams Airborne Soil Borings and Well Installation Report, Expanded Site Investigation (URS, 2005a) (includes installation of groundwater monitor wells IRA-27, IRA-28, IRA-29, and IRA-30)

Remedial Investigation Report Miracle Mile WQARF Site Arizona Department of Environmental Quality
39 June 12, 2013
URS Job No. 24097013
• Monitor Well Installation Report IRA-24, Miracle Mile WQARF Site Remedial Investigation/Extended Sampling Investigation. May 18, 2005 (URS, 2005b)
• Spring Joint Facility Borings and Well Installation Report (URS, 2005c) (includes installation of groundwater monitor well IRA-31)
• Monitor Well Installation Report IRA-32, IRA-33, IRA-34, IRA-35, IRA-36 and IRA-37, Miracle Mile WQARF Site Remedial Investigation/Feasibility Study (URS, 2013)
A total of 29 monitor wells have been installed by ADEQ as part of the Site RI since 1999; 14 are completed in the regional aquifer and 15 are completed in the perched groundwater zone. All IRA monitor well locations are shown on Figure 3. Construction details for the wells are summarized in Table 4; monitor well construction diagrams and boring/cutting descriptions are included in Appendix H. The purpose of installation of most of the regional aquifer wells was to delineate the lateral extent of the contamination. One well (IRA-14) was installed close to the Site source area in the regional aquifer for vertical delineation of the contamination. The purpose of installation of the perched wells was investigation of potential sources of contamination to the regional aquifer.
6.2.1 Field Investigations
As of 1999, prior to the RI/FS study, the existing data from monitor wells IRA-1 through IRA-10 indicated that, in general, the southwest boundary of the TCE plume was located between wells IRA-6 and IRA-8 and the northern boundary of the TCE plume was north of well IRA-9. The existing monitor wells provided some understanding of the horizontal extent of TCE contamination in the regional aquifer, but no data existed regarding the vertical extent of contamination within the regional aquifer. The existing monitor wells were generally screened across the upper 60 to 80 feet of the regional aquifer, characterizing the distribution of VOCs in only the upper portion of the aquifer.
There are a total of 43 monitor wells currently sampled on the Site: eleven wells were installed prior to the beginning of the RI; three perched wells were installed by Western Technologies for Spring Joint Specialists in 2004; and 29 wells were installed by ADEQ between the years 1999 and 2011. The 19 perched groundwater monitor wells were constructed with a 10-foot screened interval; each well terminated with the 10-foot slotted length of casing and generally screened between 55.5 and l01.5 feet bgs. The 20 monitor wells completed in the shallow regional aquifer have various screened interval lengths most ranging between 50 and 80 feet and a screened interval from 130-240 feet bgs. The 3 wells completed in the intermediate regional aquifer, IRA-33, IRA-36, and IRA-37, are intermittently screened with 50 feet of screen from 269 to 355 feet bgs. The FLUTe well (IRA-14) has five 10-foot screened intervals (160-170, 190-200,

Remedial Investigation Report Miracle Mile WQARF Site Arizona Department of Environmental Quality
40 June 12, 2013
URS Job No. 24097013
230-240, 260-270, and 290-300 feet bgs). Well construction details are presented in Table 4, Appendix H, and in the reports listed in the beginning of Section 6.2.
6.2.1.1 Aquifer Test
A 24-hour, single-well aquifer test was conducted in June 2000 using two FWID wells (Dames & Moore, 2000b). Well FWID-72, located ¼-mile north of Wetmore Road, between Flowing Wells and Romero Roads, was used as the pumping well; well FWID-66, located approximately ½-mile south (upgradient) of well FWID-72, was used as the observation well. Well FWID-70 was also proposed to be used as an observation well; however, the presence of shaft oil in the well prevented accurate water level measurements. The objective of the aquifer test was to obtain aquifer parameter estimates that could be used to assist in selecting the minimum necessary IRA that would address the short-term loss of production from wells FWID-61, FWID-66, and FWID-75. Nine groundwater samples were collected over the 24-hour period and submitted for VOC, metals, and major ion analyses. Results of the aquifer test are discussed in Section 7.1.
For the aquifer test conducted in June 2000, the vertical turbine pump in well FWID-72 was operated at an average rate of 649-gpm for 24 hours; the pump intake was set at 467 feet bgs. Water levels were collected from well FWID-72 with an electric water level sounder; a pressure transducer was used to collect water level measurements in well FWID-66. Water quality field measurements were collected during the test to monitor changes in pH, temperature, and specific conductance. A total of nine groundwater samples were collected from well FWID-72 during the 24-hour aquifer test. The samples were analyzed for VOCs, RCRA metals, and major ions.
6.2.1.2 Monitor Well Installation IRA-11 – IRA-16
Between May and June 2001, URS installed six monitor wells (IRA-11 through IRA-16) and three companion wells within the Site. Three of the wells (IRA-11-210, IRA-12-210, and IRA-13-210) were completed at 210 feet bgs and screened in the regional aquifer. Each of these three wells has a companion well, located within the same borehole but with a separate casing. Each companion well (IRA-11-70, IRA-12-70, and IRA-13-70) is completed and screened in the perched groundwater zone. Well IRA-13-70 is unusable because the casing melted at approximately 40 feet bgs due to excess heat of hydration during grouting. The installation of the three companion wells was a field modification based on the analytical results from groundwater samples collected at 75 feet bgs during the installation of monitor well IRA-16, which indicated high concentrations of TCE in the perched groundwater zone.
Remedial Investigation Report Miracle Mile WQARF Site Arizona Department of Environmental Quality
41 June 12, 2013
URS Job No. 24097013
Well IRA-14 was drilled in May 2001, to a total depth of 300 feet bgs. Well IRA-14 is located approximately 22 feet west of well IRA-2, which has historically shown the highest concentrations of VOCs at the Site. IRA-14 was constructed and equipped to allow simultaneous collection of discrete samples from multiple depth intervals to characterize the vertical extent of the contamination. IRA-14 is a 4-inch diameter PVC well, constructed with five screened intervals separated by annular seals and equipped with a multi-port liner, designed by FLUTe of Santa Fe, New Mexico, which allows specific depth interval samples to be collected using gas displacement sampling methods. A total of five 10-foot screened intervals were placed in well IRA-14 at depths of 160-170, 190-200, 230-240, 260-270, and 290-300 feet bgs. Perched groundwater was encountered during the drilling of well IRA-14 at 77 feet bgs. One sample of perched water was collected from the borehole and submitted for TCE, PCE, cis- and trans-1,2-DCE, and BTEX. (The perched water sample did not contain any detectable VOCs, i.e., above the RLs.)
In 2010, URS observed that the liner water level in the IRA-14 FLUTe well was not able to be maintained above the regional water level. The original liner was removed and a second liner was installed on February 7, 2012. After 18 days, URS determined that the water level measurements indicated a leak in Port #3. FLUTe installed a third liner on April 3, 2012.
Perched groundwater monitor wells IRA-15 and IRA-16 are completed at 105 feet and 76.5 feet bgs, respectively. These two wells were located and constructed to evaluate the stratigraphy, groundwater flow direction, and extent of contamination within the perched groundwater zone, as well as the potential influence on the migration of contaminants through the vadose zone downward to the regional aquifer. Details of the well installation are presented in the Phase I Monitor Well Installation Report (URS, 2001a). Twenty-two soil samples and 23 groundwater samples were collected during the monitor well installations, from May through June 2001 to assess the vertical extent of VOC contamination, and to screen for evidence of preferential flow paths. Five of the 22 soil samples were collected from depths of 30 feet bgs to 76 feet bgs, and the remaining soil samples were collected from depths at and below 127 feet bgs. Soil samples were submitted for VOC analyses. Four of the 23 groundwater samples were from the perched groundwater zone; 19 samples were collected from depths ranging from 151 feet to 309 feet bgs. Twenty-one of the groundwater samples were submitted for VOCs; two of the samples, one from a depth of 168 feet bgs and the second sample from a depth of 309 feet bgs, were submitted for analyses of the eight RCRA metals (arsenic, barium, cadmium, chromium, silver, lead, selenium, and mercury) (URS, 2001a). Results of the soil sampling are discussed in Section 7.4.6.
Remedial Investigation Report Miracle Mile WQARF Site Arizona Department of Environmental Quality
42 June 12, 2013
URS Job No. 24097013
6.2.1.3 Monitor Well Installation IRA-17 – IRA-23, IRA-25, IRA-26
In February 2003, monitor wells IRA-17 through IRA-23 were installed and completed in the perched groundwater zone. Six of the seven wells were constructed on the R.E. Darling property; well IRA-23 was constructed on the Abrams property, to the south. No soil samples were collected during the drilling of wells IRA-17, IRA-18, IRA-19, IRA-20, IRA-21 and IRA-23. Soil samples were collected only at boring IRA-22 for chromium analysis at depths of 6 feet, 10 feet, and then at 5-foot intervals to a depth of 75 feet bgs (a total of 15 samples). A groundwater sample was collected for VOC analysis during the drilling of monitor well IRA-17 at a depth of 75 feet bgs, prior to well construction. Details of the well installation are presented in Monitor Well Installation Report, IRA-17 through IRA-23, IRA-25 and IRA-26, Miracle Mile WQARF Site Remedial Investigation Feasibility Study (URS, 2003a).
Two additional monitor wells, IRA-25 and IRA-26, were installed in May 2003, and completed in the regional aquifer to assess the northern extent of VOC contamination, downgradient from the identified contaminant plume. Details of the well installation are presented in Monitor Well Installation Report, IRA-17 through IRA-23, IRA-25 and IRA-26, Miracle Mile WQARF Site Remedial Investigation Feasibility Study (URS, 2003a).
6.2.1.4 Monitor Well Installation IRA-24
In June 2004, monitor well IRA-24 was installed on the northwest corner of La Cholla and Wetmore to further characterize the horizontal extent of contamination in the regional groundwater. The well was completed in the regional aquifer to a depth of 218 feet, with 50 feet of screened interval (168 to 218 feet bgs.). Details of the well installation are presented in Monitor Well Installation Report IRA-24 (URS, 2005b).
6.2.1.5 Monitor Well Installation IRA-27 through IRA-30
Between June and July 2004, four perched groundwater monitor wells (IRA-27, IRA-28, IRA-29, and IRA-30) were installed as part of the Abrams ESI. Each well was constructed using 4-inch PVC, with a 10-foot screened interval. Well completion depths ranged from 66 to 69.5 feet bgs. Details of the well installation are presented in Abrams Airborne Soil Borings and Well Installation Report, Expanded Site Investigation (URS, 2005a).
6.2.1.6 Spring Joint Soil Borings and Monitor Well Installation IRA-31
One regional aquifer monitor well, IRA-31, was installed as a part of the Spring Joint SI. Monitor well IRA-31, located on the western portion of the Spring Joint property, was completed on June 23, 2004, to a depth of 210 feet with 50 feet of screened interval (158 to 208 feet bgs). As discussed above in Section 6.1.1.6, 43 soil samples were collected from the well boring

Remedial Investigation Report Miracle Mile WQARF Site Arizona Department of Environmental Quality
43 June 12, 2013
URS Job No. 24097013
during the drilling of well IRA-31. Soil samples were collected at 5-foot intervals and analyzed for total chromium. Samples that returned detectable levels of total chromium were then analyzed for hexavalent chromium. See Section 7.4.6 for discussion of soil sampling. Details of the well installation are presented in Spring Joint Facility Borings and Well Installation Report (URS, 2005c).
6.2.1.7 Monitor Well Installation IRA-32 through IRA-37
Regional aquifer monitor wells IRA-32 through IRA-37 were installed with the purpose of delineating the lateral and vertical extent of contamination at the downgradient edge of the plume.
Regional aquifer monitor well IRA-32 was completed on April 19, 2011 to a total depth of approximately 231 feet bgs. Fifty feet of screen was installed from a depth of 230 to 180 feet-bgs. Regional aquifer monitor well IRA-33 was completed on April 15, 2011 to a total depth of 350 feet bgs. Perched groundwater was encountered at 113 feet bgs and was underlain by approximately 12 feet of clay. Regional groundwater was observed at a depth of 178.7 feet bgs during advancement of the boring. Fifty feet of screen was installed as follows: 10 feet of screen from 349-339 feet bgs; 20 feet of screen from 329-309 feet bgs; and 20 feet of screen from 289-269 feet bgs.
Regional aquifer monitor well IRA-34 was completed on April 8, 2011. Forty-nine feet of screen was installed from a depth of 229 to 180 feet bgs. IRA-35 was completed on April 4, 2011 to a total depth of 350 feet bgs. Fifty feet of screen was installed from a depth of 347 to 297 feet bgs.
Regional aquifer monitor well IRA-36 was completed on May 3, 2011 and terminated at 241 feet bgs. Fifty feet of screen was installed as follows: 20 feet of screen from 240-220 feet bgs; and 30 feet of screen from 210-180 feet bgs. Regional aquifer monitor well IRA-37 was completed on April 29, 2011 to a total depth of 357 feet bgs. Fifty feet of screen was installed as follows: 20 feet of screen from 355-335 feet bgs; 20 feet of screen from 315-295 feet bgs; 10 feet of screen from 285-275 feet bgs. Details of the well installation are presented in the draft report Monitor Well Installation Report IRA-32, IRA-33, IRA-34, IRA-35, IRA-36 and IRA-37, Miracle Mile WQARF Site Remedial Investigation/Feasibility Study (URS, 2013).
6.3 R.E. DARLING SEWER INVESTIGATION 2008
An investigation of the flow path and pipe structural integrity was conducted at the R.E. Darling property located at 3749 North Romero Road to assess the potential of the sewer system to contribute water to the perched groundwater. On April 14, 2008, URS met with R.E. Darling Management and Maintenance at the R.E. Darling property to discuss the overall plan and

Remedial Investigation Report Miracle Mile WQARF Site Arizona Department of Environmental Quality
44 June 12, 2013
URS Job No. 24097013
receive a general layout of the facility’s onsite sewer lines (Figure 15). Facility personnel indicated the sewer lines from the facility buildings located in the northwest portion of the property had recently been video inspected and any failed areas identified during that inspection had been replaced. Therefore the area of focus for additional investigation was the eastern and southern portions of the sewer system (Figure 15). URS developed specifications for bidding to subcontractors that included video inspection of approximately 755 linear feet of sewer line comprising the south and east portions of the onsite sewer (URS, 2010).
On May 28, 2008, Drainmasters of Tucson performed a video investigation of the sewer beginning at the northernmost cleanout and proceeding downstream to the southernmost cleanout. The inspection continued from the southernmost cleanout west toward a manhole and then proceeded east from that manhole to complete the inspection. The video inspection used a push camera with a 200-foot long cable. The video signal was recorded to a VHS tape then converted to a digital DVD format. Results of this investigation can be found in Section 7.2.

Remedial Investigation Report Miracle Mile WQARF Site Arizona Department of Environmental Quality
45 June 12, 2013
URS Job No. 24097013
7.0 INTERPRETATION OF DATA FROM RI INVESTIGATIONS
One of the primary purposes of this RI is to characterize the nature, extent, and possible sources of soil and groundwater contamination beneath the Site. The objective of this section is to synthesize the physical site characteristics presented in Section 3.0 with the historical and contaminant data collected as part of this RI to characterize the current nature and extent of the contamination of the Site. This characterization forms the basis for the evaluation of the fate and transport of contaminants in the subsurface (Section 8.0) and the risk evaluation (Section 9.0).
7.1 AQUIFER TEST RESULTS
As discussed above in Section 6.2.1.1, a 24-hour aquifer test was conducted in June 2000 using FWID-72 as the pumping well. The original aquifer test plan called for using both FWID-66 and FWID-70 as observation wells (Dames & Moore, 2000b). However at the time of the testing, well FWID-70 was unavailable for use and only well FWID-66 was used as an observation well. Estimated transmissivity obtained from the aquifer test was 7,100 gpd/ft using AquiferTest (Waterloo Hydrogeologic), a computer-based program for plotting and analyzing aquifer test data. Hydraulic conductivity, using the estimated transmissivity value, was calculated at 7.85 x 10⁻⁴ feet per minute or 1.1 ft/day. Drawdown in well FWID-72, the pumping well, reached an asymptotic value of 249 feet approximately 14 hours into the test (Dames & Moore, 2000b). Maximum drawdown in well FWID-72 was 250.4 feet after 16 hours. Twenty-four hours after the pump in FWID-72 was shut off, the water level had recovered to 76 percent of the pre-test static water level. A maximum 0.05-foot decrease in water level in the observation well, FWID-66, was observed at approximately 35 hours after the start of the aquifer test, but it was inconclusive whether this small decrease was attributable to the pumping of well FWID-72.
Nine groundwater samples were collected from well FWID-72 over the 24-hour aquifer test (Dames & Moore, 2000b). The samples were analyzed for VOCs, eight RCRA metals, alkalinity, sulfate, chlorine, magnesium, sodium, potassium, and calcium. Barium was the only one of the eight RCRA metals detected in concentrations above the RL; barium concentrations were below the AWQS.
7.2 R.E. DARLING SEWER INVESTIGATION CONCLUSIONS
During the video sewer line inspection previously discussed in Section 6.3, the following items were noted: several root intrusions and a crack were found between Cleanout 2 and Cleanout 3; several cracks and that the bottom of the pipeline was broken as well as a broken inlet tee were also found between Cleanout 3 and Cleanout 4; and a crack was observed in the top of the pipe between the Southern Cleanout and the Manhole. See Figure 16 for an overview of the sewer video inspection.

Remedial Investigation Report Miracle Mile WQARF Site Arizona Department of Environmental Quality
46 June 12, 2013
URS Job No. 24097013
Following a review of the video recording, and based upon observations made during the inspections, it did not appear that the inspected portion of the sewer line was an ongoing source of water to the perched groundwater. While some root intrusion and sewer pipe cracks were noted, and one area showed possible damage to the bottom of the pipe, no major breaks or pipe collapses were observed. Water was found flowing throughout the entire length of the pipe inspected, thus no major leaks of water from the sewer pipe were observed. Some portions of the pipe contained water at greater depths than that observed in other areas. Those locations were likely sections of the sewer line that had settled, creating dips or low areas where water accumulated to a greater depth. Based upon these conclusions, no further action or additional inspection was recommended for the sewer lines at the R.E. Darling property (URS, 2010).
7.3 CONTAMINANTS OF CONCERN
COCs are those contaminants which have been detected at concentrations above regulatory standards (AWQSs for groundwater and SRLs for soil) or risk-based standards with some consistency and, for this Site, are confined to those COC releases that have occurred in the vicinity of Romero Road, between Prince Road and Roger Road (Figure 2).
Also, a COC, as defined by R18-16-401, “means a hazardous substance that results from a release and that has been identified by the Department as the subject of remedial action at a site.” Based on the information collected during this RI, the perched groundwater is not a source of potable water (Section 7.3.8); therefore, when determining COCs, ADEQ does not include contaminants exceeding AWQSs solely in perched groundwater as COCs; rather, they are viewed as contaminants of potential concern (COPCs). In this RI, the perched groundwater is a potential media for remedial action because it may continue to cause either soil or regional groundwater to exceed a regulatory or risk-based standard.
During the various field investigations conducted at the Site, groundwater, soil, and soil-gas samples have been analyzed for VOCs. Soil and groundwater samples have, in addition, been analyzed for major cations and anions (Appendix J), hexavalent and total chromium, zinc, cyanide, and the eight RCRA metals (arsenic, barium, cadmium, chromium, silver, lead, selenium, and mercury). Of those chemicals:
• TCE and chromium are COCs in the regional aquifer;
• TCE and chromium are COCs in the perched groundwater;
• hexavalent chromium is a COC in soil; and
• 1,1-DCE, cis-1,2-DCE, PCE, and nitrates are COPCs.
Remedial Investigation Report Miracle Mile WQARF Site Arizona Department of Environmental Quality
47 June 12, 2013
URS Job No. 24097013
7.4 VADOSE ZONE INVESTIGATION
Soil-gas samples collected in 2001 and 2002 were analyzed for eight VOCs (TCE; PCE; trans- 1,2-DCE; cis-1,2-DCE; 1,1-DCA; 1,2-DCA; 1,1,1-TCA; and MTBE) as a screening method to delineate the nature and lateral extent of VOC contamination in soil and groundwater at the Site. The analytical results for the Phase I, II, and III passive soil-gas surveys are listed in Table 5, Table 6, Table 7, and Table 8, and TCE and PCE results are depicted in Figure 17 and Figure 18, respectively. A summary of the results from the active soil-gas, soil, and perched groundwater survey is presented in Table 9, Table 10, and Table 11, respectively, and the vertical depictions of TCE, PCE, and Freon-11 soil-gas concentrations in the 10 soil borings are depicted in Figure 19 through Figure 28.
7.4.1 Passive Soil-Gas Results
The Phase I passive soil-gas survey, conducted in February 2001, consisted of the installation of 321 modules over an approximately 38-acre area on a 75-foot interval grid (Figure 11). After 14 days, the soil-gas modules were removed and submitted for VOC analyses (TCE; PCE; 1,2-DCA; 1,1-DCA; cis-1,2-DCE; trans-1,2-DCE; 1,1,1-TCA; and MTBE). Forty-two of the 321 Phase I soil-gas samples were also analyzed for BTEX compounds. Table 5 and Table 6 present the analytical results for the Phase I passive soil-gas survey. The number and range of detections for the Phase I soil-gas samples are summarized in the table below:
Compound Number of Samples
Containing Detections Range of Detections TCE 153 out of 321 RL (0.03 µg) to 156.75 µg PCE 101 out of 321 0.03 - 13.83 µg cis-1,2-DCE 3 out of 321 0.03 - 0.06 µg 1,1,1-TCA 1 out of 321 0.03 µg 1,2-DCA 1 out of 321 0.02 µg Benzene 17 out of 42 0.03 - 2.32 µg Toluene 7 out of 42 0.03 - 3.24 µg Ethylbenzene 6 out of 42 0.03 - 50.38 µg m,p-xylene 9 out of 42 0.02 - 82.12 µg o-xylene 6 out of 42 0.03 - 70.69 µg Notes: µg = micrograms; PCE = Tetrachloroethylene; TCE = Tricholoroethylene; DCE = Dichloroethylene; TCA = Trichloroethane; DCA = Dichloroethane
Figure 17 and Figure 18 show the distribution of TCE and PCE, respectively, over the Site based on detections in the passive soil-gas samples. In addition to TCE and PCE, the results of the Phase I soil-gas survey indicated low levels of BTEX in the southern portion of the Friedman Recycling property. The sample number for each passive soil-gas sample shown on Figure 17 and Figure 18 consists of the last three digits of the six-digit sample number shown in Table 5, Table 6, Table 7, and Table 8.
Remedial Investigation Report Miracle Mile WQARF Site Arizona Department of Environmental Quality
48 June 12, 2013
URS Job No. 24097013
Results from the Phase II passive soil-gas survey, which consisted of 121 samples, confirmed the presence of TCE and PCE in soil-gas and helped to delineate the areas of elevated detections. TCE was detected in 120 of 121 samples at levels ranging from less than the RL (0.03 µg) to 573.54 µg (Table 7); most of the samples (109 of the 121) contained less than 100 µg. PCE was detected in 86 of 121 samples at levels ranging from the RL of 0.03 µg to 29.32 µg. None of the other constituents were detected at levels equal to or greater than the RL. A summary of the laboratory analytical results for Phase II is presented in Table 7.
The Phase I and II passive soil-gas results identified five separate areas with elevated TCE concentrations within the study area, as shown on Figure 17. One of the areas of elevated TCE is located along the northern boundary of the Friedman Recycling property. The four remaining areas include the central and south-central portion of the Public Storage Inc. south through the R.E. Darling property and into the northeastern portion of the Abrams facility.
The Phase III soil-gas sampling results further defined the lateral extent of VOCs present in soil-gas (Table 8). TCE was detected in 61 of 78 samples at levels ranging from the RL (0.03 µg) to 53.37 µg. PCE was detected in 46 of 78 samples at levels ranging from the RL (0.03 µg) to 10.91 µg. None of the other constituents were detected at levels equal to or greater than the RL. A summary of the laboratory analytical results for Phase III is presented in Table 8.
The objective of the passive soil-gas sampling completed during the Abrams ESI in June and September 2004 was to provide additional soil-gas information for the area immediately surrounding and beneath the Abrams facility. Results from the Abrams ESI indicate the presence of TCE and PCE (Figure 17 and Figure 18). TCE was detected in 35 of the 92 soil-gas samples at levels ranging from the RL (0.02 µg) to 18.56 µg. PCE was detected in 7 of the 92 samples at levels ranging from the RL (0.03 µg) to 0.21 µg. None of the other constituents were detected at levels equal to or greater than the RL. A summary of the results can be found in the Abrams Airborne Soil Borings and Well Installation Report, Expanded Site Investigation, (URS, 2005a).
7.4.2 Interpretation of Passive Soil-Gas Results
Areas of elevated VOCs in soil-gas can be indicative of potential source areas. The diffusion of the VOC vapors from a source is typically in a radial direction (horizontally and vertically) because the concentration gradient is assumed to be the same in all directions.
The results from Phases I and II soil-gas surveys and the active soil-gas survey indicated that the presence of TCE and PCE may extend beyond the north and southeast boundaries of the Phase I and II study area [R.E. Darling, A Family Discount Storage, Public Storage Inc., and Friedman Recycling properties (Figure 2)]. Locations for the Phase III soil-gas survey, shown on Figure 11
Remedial Investigation Report Miracle Mile WQARF Site Arizona Department of Environmental Quality
49 June 12, 2013
URS Job No. 24097013
and denoted in white, were selected to delineate the lateral extent of contamination in these two areas.
The passive soil-gas surveys revealed two separate, general areas in which TCE was detected, as shown on Figure 17. One of the two areas is located along the northern boundary of the Friedman Recycling property. The second, larger area extends from the northern boundary of the Public Storage property to the southern end of the R.E. Darling property and along the eastern end of the Abrams property. Within each of the two general areas are zones of elevated TCE, or “hot spots.” The detected soil-gas levels in the “hot spots” appear to diffuse out from the highest detected levels. There are approximately five zones in which TCE was detected at greater than 30 µg. These potential source areas are shown as the orange and red zones on Figure 17 and include the:
• Northern portion of the Friedman property
• Central portion of the Public Storage property
• Northern R.E. Darling property, immediately north and west of the two hangars
• Southern R.E. Darling property
• Southeastern corner of the R.E. Darling property/Northeastern corner of Abrams property
(Figure 2 shows the locations of the aforementioned properties.) The passive soil-gas sample that contained the highest TCE level (No. 357048 at 573.54 µg), was located on the northern boundary of the R.E. Darling property and is illustrated by the purple zone on Figure 17. The second-highest TCE level was seen in passive soil-gas sample No. 353132 at 200.50 µg, located along the northern boundary of the Friedman Recycling property.
Although PCE was detected in several general areas throughout the soil-gas survey study area, only one area contained PCE levels above 5.0 µg; this area coincides with the northernmost area of TCE occurrences, along the northern boundary of the Friedman Recycling property. Figure 18 presents the distribution of PCE as detected from the soil-gas samples. The soil-gas survey results indicate that PCE is present in the vadose zone but at much lower levels than TCE. PCE levels in the area of the northern TCE “hot spot” extend over a larger area than the TCE but range from 0.03 to 29.32 µg.
7.4.3 Active Soil-Gas Results
Vertical profiling consists of collecting active soil-gas samples at a given sampling location to characterize the vertical distribution of VOCs.
Remedial Investigation Report Miracle Mile WQARF Site Arizona Department of Environmental Quality
50 June 12, 2013
URS Job No. 24097013
In May 2002, 70 active soil-gas samples and 70 soil samples were collected from 10 soil borings, which ranged from 80 to 97.5 feet deep. The locations of the 10 soil borings are shown on Figure 12. Table 9 presents a summary of the analytical results for the active soil-gas samples; only those analytes that were detected above the RL in at least one sample are shown on Table 9. The sample number for each soil-gas sample listed in Table 9 consists of the suffix (MM), the depth of collection, and the soil boring number, e.g., MM-80-3 means a soil-gas sample was collected from soil boring No. 3 at 80 feet bgs. All VOC detections in active soil-gas are reported in ppbv.
The active soil-gas results were used to generate vertical profiles of selected VOCs, shown in Figure 19 through Figure 28. The vertical profiles were used to help identify any potential soil sources for VOCs and to evaluate the contribution of groundwater diffusion to the shallow soil-gas data. A summary of the vertical profiles from the 10 soil borings is presented below. A summary of the laboratory analytical results for the active soil-gas and soil samples is presented in Table 9 and Table 10, respectively.
Soil Boring Nos. 1 and 2
As discussed above in Section 7.4.2, Phases I and II passive soil-gas surveys identified an area of elevated TCE levels on the northern portion of the Friedman Recycling property (Figure 17). Based on these results, two soil borings, Boring Nos. 1 and 2 were installed along the northern portion of the Friedman Recycling property (Figure 12). TCE was detected at 200 µg in the passive soil-gas sample point where Boring No.1 was sited and 136 µg in the passive soil-gas sample point where Boring No. 2 was sited.
TCE, PCE, Freon-11, and chloroform were detected in the eight depth-specific soil-gas samples collected from Boring No. 1. Figure 19 presents the TCE, PCE, and Freon-11 concentrations from Boring No. 1 in vertical profiles. TCE concentrations ranged from 560 ppbv at 97 feet bgs to 12,000 ppbv at 40 feet bgs. The highest TCE concentrations occurred in the interval of 40 feet to 80 feet bgs.
Concentrations of PCE and Freon-11 show the same general vertical trend as TCE, i.e., increasing to a depth of 40 feet bgs, leveling off, then decreasing from approximately 80 feet to the bottom of the hole (97 feet). PCE concentrations in the soil-gas from Boring No. 1 ranged from 11 ppbv at 97 feet bgs to 430 ppbv at 40 feet bgs. Freon-11 ranged from 41 ppbv at 15 feet bgs to 850 ppbv at 80 feet bgs. Chloroform was detected in seven of the eight soil-gas samples collected from Boring No. 1, and ranged from below the RL (non-detect; less than 10 ppbv) to 180 ppbv at 40 feet bgs. Chloroform was not detected in the deepest sample, obtained at 97 feet bgs.
Remedial Investigation Report Miracle Mile WQARF Site Arizona Department of Environmental Quality
51 June 12, 2013
URS Job No. 24097013
Seven depth-specific soil-gas samples were collected from Boring No. 2. TCE, PCE, Freon-11, and chloroform were also detected in Boring No. 2, but at lower levels than detected in Boring No. 1. Vertical profiles of TCE, PCE, and Freon-11 concentrations in Boring No. 2 are shown in Figure 20. TCE ranged from 130 ppbv at 10 feet bgs to 7,900 ppbv at 80 feet bgs. PCE in Boring No. 2 ranged from 18 ppbv at 10 feet bgs to 320 ppbv at 60 feet bgs. Freon-11 ranged from non-detect (less than 10 ppbv) at 10 feet bgs to 810 ppbv at 80 feet bgs. The vertical trend of Freon-11 differed from that of the three other VOCs in that the highest concentration was obtained from the deepest sample. Chloroform ranged from non-detect to 120 ppbv.
Boring Nos. 3 and 4
Borings Nos. 3 and 4 were located on the Public Storage property based on results from the Phase I and II passive soil-gas surveys; locations of Borings Nos. 3 and 4 are shown on Figure 12.
VOCs detected in Boring No. 3 consisted of TCE, chloroform, and toluene. TCE ranged from 190 ppbv at 10 feet bgs to 5,700 ppbv at 20 feet bgs. A vertical profile of the TCE concentration in Boring No. 3 is shown in Figure 21. Chloroform ranged from non-detect to 27 ppbv. Toluene was detected in the sample obtained from 20 feet bgs, at 11 ppbv.
Boring No. 4 contained TCE at concentrations ranging from 130 ppbv at 97.5 feet bgs to 12,000 ppbv at 60 feet bgs. Chloroform; cis-1,2-DCE; and Freon-11 were detected in minor concentrations (below 47 ppbv). A vertical profile of the TCE concentration in Boring No. 4 is shown in Figure 22; Table 9 presents a summary of the results for the active soil-gas samples.
Boring Nos. 5 through 10
Borings Nos. 5 through 10 were installed from the north end of the R.E. Darling property to the south end, based on the Phase I and Phase II passive soil-gas surveys results. Figure 12 shows the locations of the soil borings.
Boring No. 5, located at the very north end of the R.E. Darling property, contained detectable concentrations of TCE; PCE; cis-1,2-DCE; 1,1-DCE; 1,1,2-TCA; BTEX; chloroform; 1,2,4-trimethylbenzene; and 1,3,5-trimethylbenzene; but the primary VOC was TCE. TCE in Boring No. 5 ranged from 1,100 ppbv at 5 feet bgs to 17,000 ppbv at 60 feet bgs. PCE was detected in the two samples collected from 20 feet and 40 feet bgs at 45 and 32 ppbv, respectively. Vertical profiles of TCE and PCE concentrations in Boring No. 5 are shown in Figure 23. The other seven VOCs were detected intermittently throughout the boring and at minor concentrations.

Remedial Investigation Report Miracle Mile WQARF Site Arizona Department of Environmental Quality
52 June 12, 2013
URS Job No. 24097013
Concentrations of TCE in Boring No. 6 ranged from 170 ppbv at 10 feet bgs to 11,000 ppbv at 60 feet bgs. The vertical profile of TCE in Boring No. 6 (Figure 24) is relatively similar to TCE in Boring No. 5, located approximately 50 feet to the north. Chloroform, PCE, and cis-1,2-DCE were also detected in Boring No. 6 but in minor concentrations. PCE was detected at 13 to 28 ppbv from 20 to 60 feet bgs; cis-1,2-DCE was detected in two samples, MM-43-6 and MM-60-6, at 28 and 31 ppbv, respectively. Chloroform was detected in two samples, MM-43-6 and MM-60-6, at 20 and 22 ppbv, respectively.
Five depth-specific soil-gas samples were collected from Boring No. 7. TCE, PCE, chloroform, cis-1,2-DCE, and methylene chloride were detected in one or more of the samples but the primary VOC detected was TCE, at a maximum concentration of 11,000 ppbv. TCE ranged from non-detect (less than 10 ppbv) in the 15- and 20-foot bgs samples to 11,000 ppbv in the 40-foot bgs sample. PCE; cis-1,2-DCE; and chloroform were detected in only the 40-foot bgs sample at 19 ppbv, 30 ppbv, and 22 ppbv, respectively. Methylene chloride ranged from non-detect to 27 ppbv at 15 feet bgs. The vertical profile of TCE concentrations in Boring No. 7 is shown in Figure 25.
Boring No. 8, located in the central portion of the R.E. Darling property, contained a maximum TCE concentration of 29,000 ppbv. Chloroform; cis-1,2-DCE; Freon-11; and toluene were also detected in Boring No. 8, but not PCE. TCE ranged from 490 ppbv at 10 feet bgs to 29,000 ppbv at 65 feet bgs. Cis-1,2-DCE was detected in two samples, the 40-foot and 65-foot bgs, at 15 ppbv. Chloroform concentrations ranged from non-detect (less than 10 ppbv) to 28 ppbv at 65 feet bgs. Freon-11 and toluene were both detected in only one sample, the 10-foot bgs sample, at 12 ppbv. The boring was terminated at 78.2 feet bgs when perched groundwater was encountered. A vertical profile of the TCE concentration in Boring No. 8 is shown in Figure 26.
Six depth-specific soil-gas samples were collected from Boring No. 9, which contained detectable concentrations of TCE; PCE; cis-1,2-DCE; 1,1-DCE; chloroform; benzene; and toluene. TCE ranged from 130 ppbv at 10 feet bgs to 11,000 ppbv at 60 feet bgs. PCE was detected in the samples collected from 10 and 60 feet bgs at 11 and 33 ppbv, respectively; cis-1,2-DCE was detected in two samples, 60 and 80 feet bgs, at 250 and 20 ppbv, respectively. Chloroform and benzene were detected in one sample, 60 feet bgs, at 18 and 34 ppbv, respectively. Toluene was detected intermittently throughout the soil boring at concentrations ranging from non-detect (less than 10 ppbv) to 29 ppbv. Figure 27 shows the vertical profiles of TCE; PCE; and cis-1,2-DCE concentrations in Boring No. 9.
Boring No. 10, located in the very southeastern corner of the R.E. Darling property, contained detectable concentrations of TCE; PCE; cis-1,2-DCE; 1,1-DCE; chloroform; benzene; toluene;

Remedial Investigation Report Miracle Mile WQARF Site Arizona Department of Environmental Quality
53 June 12, 2013
URS Job No. 24097013
and carbon tetrachloride. Similar to Boring No. 8, perched groundwater was encountered at 80 feet bgs, at which point the boring was terminated. TCE showed a clear trend increasing from 12 ppbv at 10 feet bgs to 200,000 ppbv at 80 feet bgs.
Boring No. 10 contained the highest concentration of cis-1,2-DCE detected in all of the active soil-gas samples, ranging from non-detect (less than 10 ppbv) at 5 feet bgs to 5,500 ppbv at 80 feet bgs. Boring No. 10 also contained the highest concentration of 1,1-DCE detected in the active soil-gas samples, ranging from non-detect (less than 10 ppbv) at 5 feet bgs to 140 ppbv at 80 feet bgs PCE and benzene were detected in the two lowest samples (60 and 80 feet bgs) at minor concentrations (less than 44 ppbv), and toluene was detected in three of the seven depth-specific samples, at concentrations ranging from 10 to 14 ppbv. Vertical profiles of the TCE; PCE; and cis-1,2-DCE concentrations in Boring No. 10 are shown in Figure 28.
7.4.4 Interpretation of Active Soil-Gas Results
Table 9 presents the results for each of the active soil-gas samples. TCE was the primary VOC detected, and in general, the highest concentrations of TCE detected in the active soil-gas samples occurred between 60 and 80 feet bgs. A summary of TCE concentrations by depth and sample are presented below.
Soil-Gas Sample Collection Depth
(feet bgs)
Range of TCE Detections
(ppbv)
Boring No. Containing the Maximum
TCE Concentration 5 12 - 1,500 Boring No. 2 10 130 - 1,400 Boring No. 1 15 < 10 - 2,200 Boring No. 9 20 < 10 - 9,100 Boring No. 5 40 1,500 - 12,000 Boring No. 1
60 - 66 3,400 - 46,000 Boring No. 10 80 300 - 200,000 Boring No. 10 97 130 - 560 Boring No. 1
Notes: ppbv = parts per billion by volume; TCE = Tricholoroethylene
Figure 29 is a fence diagram showing the stratigraphy encountered in the perched groundwater IRA monitor wells (IRA-16, IRA-17, IRA-18, IRA-19 IRA-20, IRA-21, and IRA-22) based on the boring logs. As Figure 29 shows, the lithology between 40 to 80 feet bgs consists of silty-sand, sand, or gravel, compared to silt, sandy clay, and clay in the upper 40 feet of the vadose zone, suggesting that the zone of coarser-grained sediments may partially control the migration of the VOCs. In addition, soil vapor samples collected from below the observed clay layer at a depth of approximately 70 feet show lower concentrations of VOCs. This clay layer, acting as a perching layer for groundwater, also prevents further downward migration of soil vapor VOCs.

Remedial Investigation Report Miracle Mile WQARF Site Arizona Department of Environmental Quality
54 June 12, 2013
URS Job No. 24097013
Surface soil sources were not identified from the active soil-gas survey, nor were any shallow subsurface areas identified that would conclusively indicate a surface spill as a source of contamination. However, these data do show that significant residual VOC contamination still exists in some of the deeper fine-grained materials (sandy clay or silt) within the vadose zone at the Site. These finer grained materials would tend to retain higher VOC concentrations for longer periods of time than courser grained sands and gravels. Thus, the vertical profiles of VOC contamination shown in Figures 19 through 28 could be showing what remains in the vadose zone from possible surface or near surface discharges or spills that occurred prior to any investigations.
7.4.5 Calculation and Comparison of Active Soil-Gas Results
This is a summary of the calculations performed on the total concentration in soil from the soil-vapor concentration originally reported in Table 12. The ppbv concentrations were first converted to micrograms per cubic meter (µg/m3) using the Soil Vapor Conversion Factors table in the ADEQ Soil Vapor Sampling Guidance (ADEQ, 2008a). The concentrations in µg/m3 were then converted to µg/L using a standard conversion of 1,000 L per 1 m3. The calculations and molecular weights were checked against a Unit Calculator program from Air Toxics LTD. website (Air Toxics, 2005).
The linear sorption partitioning equation1 and Henry’s Law were then applied to the µg/L concentrations to obtain the calculated concentrations in soil in micrograms per kilogram (µg/kg). The fractions of organic carbon, dry bulk density, volumetric water content and total soil porosity were consistent for all the analytes (ADEQ, 2008a), and are noted at the bottom of Table 12. Each analyte had a different Henry’s Constant and soil organic carbon-water partitioning coefficient (ADEQ, 2008a)2 and are noted at the top of the Table 12 for each constituent. Please see “Calculation A” in Appendix K (Sample calculation from concentration in soil-vapor to concentration in soil) for an example of how the calculation was done.
After obtaining the concentrations in soil in µg/kg they were then converted to mg/kg using the standard of 1000 µg per 1 mg. These numbers were then compared to the respective
1 Taken from the Soil Vapor Sampling Guidance (ADEQ, 2008a), but originally derived from Sorption of Hydrophobic Pollutants on Natural Sediments (Karichoff, 1979). 2 The Henry’s Constant and soil organic carbon-water partitioning coefficient for Freon-11 was found using an MSDS from Matheson Tri-Gas (Matheson Tri-Gas, 2008).

Remedial Investigation Report Miracle Mile WQARF Site Arizona Department of Environmental Quality
55 June 12, 2013
URS Job No. 24097013
Groundwater Protection Levels (GPLs) (ADEQ, 2008b) and residential and non-residential SRLs (ADEQ, 2009).
GPLs and SRLs at IRA-19 and Boring 10
The only analyte with a concentration above the GPL was TCE at 2.991 mg/kg. This concentration was found in Boring #10 at a depth of 80 feet bgs. The sample showing the concentration above the GPL was taken May 23, 2002. This analyte also came very close to meeting the residential SRL with a carcinogen risk of 10-6. Boring #10 also came close to meeting the GPL at a depth of 60 feet bgs, this sample was also taken on May 23, 2002.
This high concentration of TCE is of interest because a perched water table is located at approximately that depth. A perched well, IRA-19, was installed in close proximity to Boring #10, and therefore should share the same perched water. Both Boring #10 and IRA-19 are also in the same area of a “hot spot” found during the passive soil-gas survey. After finding the high soil-gas concentrations at the depth of the perched water table in Boring #10, but without any actual groundwater sampling, the ground water samples from IRA-19 were studied. It was found that this well not only consistently exceeded the AWQS from May 2003 through December 2011, but also had the highest concentration of TCE, ranging from 640 µg/L to 5200 µg/L, of all the perched wells. This fact, and the trend of the concentration of TCE in the soil-gas concentrations increased with depth in Boring 10, likely indicates that the soil-gas and the perched groundwater at IRA-19 are close to equilibrium.
7.4.6 Soil Sample Results
7.4.6.1 R.E. Darling 2002 Soil Borings
A total of 70 soil samples were collected from the 10 soil borings on the R.E. Darling property in May 2002. The samples were preserved in the field with methanol and submitted to Precision Analytical Laboratories for analysis of VOCs by EPA Method 8260 with a 24-hour turnaround time. The laboratory screened the samples for VOCs. Based on the screening results, 18 soil samples, for which the initial screening indicated the presence of VOCs, were submitted for analysis for VOCs by EPA Method 8260 (URS, 2003b). Two of the 18 samples (MM-60-7 and MM-65-8) were submitted a second time (confirmation analysis) using the same analytical method. Table 10 presents the results of the 18 soil samples; results are reported in mg/kg. The sample number for each soil sample listed in Table 10 consists of the suffix (MM), the depth of collection, and the soil boring number, e.g., MM-80-3 means a soil sample was collected from soil boring No. 3 at 80 feet bgs.
Remedial Investigation Report Miracle Mile WQARF Site Arizona Department of Environmental Quality
56 June 12, 2013
URS Job No. 24097013
VOCs detected in one or more of the soil samples consisted of TCE; trans-1,2-DCE; 1,2,4-trimethylbenzene; toluene; xylene (o- and m,p-); and methylene chloride. The VOCs detected in the most soil samples were 1,2,4-trimethylbenzene, ranging from 0.054 to 0.16 mg/kg, and TCE, ranging from 0.12 to 0.34 mg/kg. Methylene chloride; toluene; xylene; and trans-1,2-DCE were detected in minor concentrations, 0.054 to 0.24 mg/kg. Concentrations of all VOCs detected were well below the ADEQ SRL (ADEQ, 2009) and the minimum GPLs (ADEQ, 2008b). Minimum GPLs were established in 1995 by ADEQ as soil cleanup levels protective of groundwater quality and are based on a “worst-case” scenario in which the entire soil column is contaminated from surface to groundwater.
7.4.6.2 Abrams Airborne 2004 ESI Soil Sampling Summary
The VOC results for soils collected during the installation of all four perched well borings at Abrams (IRA-27, IRA-28, IRA-29 and IRA-30) are similar. In each case, TCE and 1,1-DCE were detected in soil samples collected near the top of an observed clay layer that acts as a perching layer for groundwater. The top of clay was observed in each boring at depths ranging from 50 to 60 feet below the ground surface. TCE was detected in 15 samples at a maximum concentration of 0.036 mg/kg, while 1,1-DCE was detected in only three samples at a maximum concentration of 0.0031 mg/kg. Chloroform was also detected in one sample, but there is no apparent pattern of observation. A summary of the VOC results for the perched well soil samples can be seen in Table 13.
Inorganic analytes (arsenic, cadmium, chromium, lead, zinc and hexavalent chromium) were detected above the maximum site-specific background values in soil samples collected from soil borings and passive soil gas locations completed in the plating/painting rooms and wastewater treatment area. A summary of the site-specific background values can be found in Table 14, while a summary of the inorganic analytes can be found in Table 13. No results for inorganics detected in soils collected during the ESI were found to exceed the SRLs for residential soils.
Arsenic, barium, chromium, lead, zinc, and hexavalent chromium were observed in groundwater samples collected from both perched and regional groundwater monitor wells.
1,1-DCE and TCE were detected in clay soils at depths ranging from 50 to 60 feet below the ground surface. These same analytes were also detected in perched groundwater collected from monitor wells IRA-22, IRA-27, and IRA-30 at similar levels. This observation suggests that VOCs observed in soils sampled during the perched well installations are a result of the saturated soils in equilibrium with perched groundwater from these locations. Details of the ESI can be found in the Abrams Airborne Soil Borings and Well Installation Report, Expanded Site Investigation (URS, 2005a).

Remedial Investigation Report Miracle Mile WQARF Site Arizona Department of Environmental Quality
57 June 12, 2013
URS Job No. 24097013
7.4.6.3 Spring Joint Specialists 2004 Investigation Soil Sampling Summary
This section discusses the investigation performed by URS for the sole purpose of the RI. Another soil investigation was performed by Western Technologies in 2004 that was contracted by Spring Joint Specialists, Inc. Details of that investigation can be found in Section 4.10. Interpretation of results for both investigations can be found in Section 7.4.7.
Soil samples collected during ADEQ’s Spring Joint 2004 Investigation were analyzed for VOCs and eight RCRA Metals. Samples were collected from all temporary borings and the IRA-31 boring.
Twenty-seven shallow soil borings were installed on the Spring Joint facility and sampled at the 0-6 inch depths and 24-36 inch depths. All 70 samples had detectable total chromium. A summary of the analytical results can be seen in Table 3 under Boring and Well Installation Report-Outside Boring Locations. Figure 14 shows the location of the shallow soil borings. The levels ranged between 6.4 and 2,800 mg/kg for the 0-6 inch depth results and 5.2 to 1,700 mg/kg for the deeper sampling depth. Those samples that returned the highest 27 values of total chromium were also analyzed for hexavalent chromium. The concentrations of hexavalent chromium ranged from 0.51 to 10 mg/kg (Table 3). Generally the shallow sample returned a higher level than the sample collected below it and, generally, the higher the result of the shallow sample, the higher the result of the deeper sample. The residential SRL during this investigation for total chromium was 2,100 mg/kg. In 2007, ADEQ eliminated the SRL for total chromium and created a residential SRL of 120,000 mg/kg for trivalent chromium and 30 mg/kg for hexavalent chromium. One of the shallow samples returned a total chromium concentration of 2,800 mg/kg, which is above the pre-2007 residential SRL, but below the pre-2007 non-residential SRL of 4,500 mg/kg.
In the soil sampling conducted by Western Technologies in 2004, three soil borings (MW-1, B1, and B2) were analyzed for VOCs and chromium (Appendix G). The Western Technologies report states that the B1 sample was located on the adjacent property to the south, 10 feet over the property boundary, and owned by The Rental Service Corporation; subsequently dba RSC Equipment Rental (RSC). Soil samples were collected at five-foot intervals beginning at approximately 15 feet bgs to the maximum depth of the boring. These soil analytical results are shown in Table 3 under Limited Site Characterization. The VOCs came back as non-detect for all three borings. MW-1 and B1 reported concentrations of hexavalent chromium ranging from 2 mg/kg (15 feet bgs) to 159 mg/kg (55 feet) for MW-1 and 2.2 mg/kg to 208 mg/kg (60 feet bgs) for B1. The present SRL for hexavalent chromium is 30 mg/kg for residential use and 65 mg/kg for non-residential use. Soil concentrations were above the SRL of 30 mg/kg in boring MW-1 at depths of 35’, 40’, 50’, 55’, 60’, and 70’ bgs; and in boring B1 at a depth of 60’ bgs. It
Remedial Investigation Report Miracle Mile WQARF Site Arizona Department of Environmental Quality
58 June 12, 2013
URS Job No. 24097013
was also found that the soil around the sump had concentrations of hexavalent chromium up to 3,420 mg/kg (Western Technologies, 2004).
Six indoor soil borings were installed to assess the presence or absence of COCs within the soils beneath Spring Joint facility. A total of 14 samples were collected and were analyzed for VOCs and eight RCRA metals. None of the samples contained detectable levels of VOCs. A summary of the analytical results can be seen in Table 3 under Boring and Well Installation Report-Indoor Boring Locations. Figure 14 shows the location of the indoor soil borings. Several RCRA metals were detected in the soil. These metals include arsenic, barium, chromium, and lead. Arsenic was detected in 6 of the 14 samples with a range of 5.2 to 9.3 mg/kg. All arsenic detections were below the residential SRL of 10 mg/kg. All 14 samples returned detectable levels of barium within the range of 14 to 460 mg/kg. These results are all less than the barium residential SRL of 15,000 mg/kg. Chromium was detected in 10 of the 14 samples. The detection occurred with the range of 5.6 to 12 mg/kg. These were all below the chromium residential SRL, at the time of the investigation, of 2,100 mg/kg. Lead levels ranging from 7.4 to 14 mg/kg were detected in 12 of the samples. These values were all below the lead residential SRL of 400 mg/kg.
Regional aquifer monitor well, IRA-31, was installed west of the Spring Joint facility to a depth of approximately 210 feet bgs. During the boring process, soil samples were collected at 5-foot intervals starting at 5 feet bgs. A total of 43 soil samples were collected and were analyzed for total chromium. Ten of the 43 samples showed detectable levels of total chromium ranging from 6.3 to 18 mg/kg. Samples determined to contain detectable levels of total chromium were also analyzed for hexavalent chromium. Of the 10 samples analyzed, 8 resulted in detectable levels of hexavalent chromium ranging from 1.5 to 16 mg/kg. A summary of the analytical results can be seen in Table 3 under Boring and Well Installation Report-Well Installation. The residential SRL for hexavalent chromium is 30 mg/kg. Details of the Spring Joint Investigation can be found in the Spring Joint Facility Borings and Well Installation Report (URS, 2005c).
7.4.7 Interpretation of Soil Sample Results
Based on the results from the areas sampled, VOC concentrations in the soil samples were low throughout the vertical profile. The absence of VOCs in the soil samples suggests that the soil-gas may be associated with VOCs in the perched groundwater zone and not residual soil contamination. Levels of inorganics tested in soil samples at Abrams were found to be below the Arizona residential SRLs (Table 13 and Table 14). However, evaluation of data provided in correspondence from Abrams (2004) suggests that operations at the Abrams facility may have resulted in releases of these inorganic analytes to the soils beneath the plating/painting rooms and in the vicinity of the wastewater treatment area, and that these releases to soil may have impacted

Remedial Investigation Report Miracle Mile WQARF Site Arizona Department of Environmental Quality
59 June 12, 2013
URS Job No. 24097013
the perched groundwater. Additional discussion of perched groundwater quality follows in Section 7.5.1.
Levels of inorganics at the Spring Joint property from the URS investigation were generally found to be below the Arizona residential SRLs. However, one sample of surface soil in the northeastern corner was found to be above the pre-2007 residential SRL for total chromium.
The presence of hexavalent chromium in both soils (from the Western Technology investigation) and perched groundwater (from the Western Technology and URS investigations) at the property strongly suggests that a potential on-going source of chromium contamination exists in the soil beneath the Spring Joint property.
7.4.8 Current Understanding of Perched Groundwater Zone
As stated in Section 3.5.4, perched groundwater had been reported in wells and borings installed in the Site since at least 1944. Monitor well IRA-10-100 was the first IRA monitor well to be completed in the perched groundwater zone within the current Site boundaries. Well IRA-10-100 was completed in April 1997 to a total depth of 104.5 feet bgs. Since 1999 (the beginning of the RI), 15 additional monitor wells have been completed in the perched groundwater zone at depths ranging from 68 feet to 105 feet bgs (see Table 4). Boring logs, water level measurements and water quality data from these perched groundwater monitor wells have assisted in defining the horizontal and vertical extent of the clay perching layer. The locations of the perched groundwater monitor wells that have been completed in the perched groundwater zone are shown in Figure 30.
The perched water is supported by a very fine-grained, dark brown to red, moist clay with minor silts and sands, as defined in the boring logs (Appendix H), typically at about 70 feet bgs, as shown in Figure 29. Figure 29 is a fence diagram showing the stratigraphy encountered in the perched groundwater IRA monitor wells IRA-16, IRA-17, IRA-18, IRA-19, IRA-20, IRA-21, IRA-22 and IRA-23 located on the R.E. Darling and Abrams properties. Figure 31 is a fence diagram showing the stratigraphy encountered in the perched groundwater IRA monitor wells IRA-22, IRA-23, IRA-27, IRA-28, IRA-29, and IRA-30 located on or adjacent to the Abrams property, and the perched groundwater monitor wells SJ-MW-1, SJ-MW-2 and SJ-MW-3 installed on the Spring Joint property by its owner in early 2004. The depth and screened interval of each perched groundwater well is also shown on Figure 29. Water within the perched zone is not used for any purpose (i.e., domestic, industrial, agricultural, or irrigation); however, based on water quality data from both the perched groundwater and regional aquifer IRA monitor wells, it may have migrated (or may still be migrating) down to the regional aquifer.

Remedial Investigation Report Miracle Mile WQARF Site Arizona Department of Environmental Quality
60 June 12, 2013
URS Job No. 24097013
The IRA monitor wells completed in the perched zone were constructed such that the bottom of the well coincided with the top of the clay layer (aquitard). As such, the height of the water column in the perched groundwater IRA monitor wells should be indicative of the thickness of the perched water in that location. However, water level measurements from the perched groundwater IRA monitor wells must be read and interpreted mindful of the well construction details. For example, according to the as-built well diagram for well IRA-10-100, there is approximately 3 feet of blank casing, including the end cap, below the last slot of the screened interval. Therefore, there could be up to 3 feet of standing water in the well casing that could be measured as a water level but not actually indicative of a perched groundwater zone. Another example is well IRA-11-70. In December 2003, the water level in well IRA-11-70 was measured at 67.92 feet bgs; the well is reported to be 68 feet deep. Therefore, this water level measurement is also probably not indicative of the top of the perched groundwater table.
Quarterly water level measurements show that perched groundwater is typically present below the R.E. Darling property in wells IRA-16, IRA-21, and IRA-22. The water column in well IRA-16 has ranged from 3 to 5.9 feet. Groundwater levels in wells IRA-21 and IRA-22 indicate the water column in these wells ranges from 3.3 to 6.8 feet. In addition to the water level data, limited water quality data suggest that the perched groundwater zone is hydraulically connected between these three wells. Comparisons of groundwater quality data from the perched groundwater IRA monitor wells are discussed below in Section 7.5.1. As shown on Figure 32, the gradient of the perched groundwater, between wells IRA-16, IRA-21, and IRA-22, is from the south to the north, which is in agreement with the topographic gradient and regional aquifer gradient.
Only one of the perched groundwater wells on the Spring Joint property (SJ-MW-2) consistently contains water, although the total volume of water in the well is small with less than 1 foot of water typically present in the well (Figure 31). However, monitor well IRA-23, which is located about 200 feet northwest of well SJ-MW-2, has not had sufficient water volume for sampling since its installation in February 2003. During the December 2011 sampling round, well IRA-23 registered a water level of 78.69 feet bgs, but did not have enough water for either VOC or metals samples. Well SJ-MW-2 is 73 feet deep; well IRA-23 is 79.5 feet deep. The elevation of the bottom of well IRA-23 is 2,212 feet above msl; the groundwater elevation in well SJ-MW-2 is approximately 2,218 feet above msl. This suggests that well IRA-23 may be completed in a lower “dry” region that lies between the perched groundwater zone beneath R.E. Darling/Abrams facilities and the perched groundwater zone beneath the Spring Joint facility (Figure 31). Based upon this, there may be two or more separate perched groundwater zones: one on the west side of Romero Road, and one on the east side of Romero Road.
Remedial Investigation Report Miracle Mile WQARF Site Arizona Department of Environmental Quality
61 June 12, 2013
URS Job No. 24097013
Wells IRA-15, IRA-18, IRA-20, and IRA-28 were dry in December 2011 indicating that perched groundwater is ephemeral, localized, and discontinuous vertically and horizontally. The recharge source(s) of the perched groundwater is currently unknown.
7.5 DISTRIBUTION AND TRENDS OF CONTAMINATION IN GROUNDWATER
This section summarizes the findings of the groundwater sampling conducted under the RI. Between 2001 and 2011, groundwater samples from both the perched groundwater zone and the regional aquifer were collected and analyzed for VOCs and the eight RCRA metals. Summary tables of the analytical results for the RI groundwater monitoring events from 1999 through 2011 are included in Appendix L. Time-series plots of TCE, PCE, 1,1-DCE, and chromium for IRA wells 1 through 31 are provided in Appendix M. Table 15 includes individual tables for TCE; 1,1-DCE; and cis-1,2-DCE; which show the 1999 through 2011 analytical data for all regional aquifer wells sampled at the Site. Table 16 includes 1999 through 2011 analytical data for all regional aquifer wells for chromium and arsenic.
7.5.1 Contaminants in Perched Groundwater
Within the Site, TCE, 1,1-DCE, cis-1,2-DCE, and chromium have been detected in one or more perched groundwater monitor wells at concentrations above the AWQS. Prior to 1999, only one well (IRA-10-100) was completed in the perched groundwater zone within the Site. In May and June 2001, four perched groundwater monitor wells (IRA-11-70, IRA-12-70, IRA-15, and IRA-16) were installed. Seven additional perched groundwater monitor wells, IRA-17 through IRA-23, were installed in February 2003. Four more perched groundwater monitor wells, IRA-27 through IRA-30, were installed in July 2004. The SJ-MW-1, -2, and -3 wells (installed by Spring Joint) were installed in January 2004. Locations of the perched groundwater monitor wells are shown in Figure 30. Wells IRA-11-70, IRA-15, IRA-18, IRA-20 and IRA-28, as well as SJ-MW-1 and SJ-MW-3, are typically dry and therefore only a few water samples have been collected from these wells. Well IRA-13-70 is not accessible due to a melted casing. Table 17 presents a summary of the 1999 through 2011 analytical results for TCE; PCE; 1,1-DCE; and cis-1,2-DCE in the perched groundwater IRA wells, and Table 18 presents the 1999 through 2011 analytical results for chromium and arsenic in the perched groundwater IRA monitor wells. Appendix L provides the summary tables of the analytical results of groundwater samples from 1999 through 2011. The following sections present a summary of all of the available data.
Trichloroethylene (TCE)
Prior to the initiation of the RI/FS and the subsequent monitor well installations, monitor well IRA-10-100 (Figure 3), the only well completed in the perched groundwater zone in April 1997, showed no detectable concentrations of TCE (0.50 µg/L).

Remedial Investigation Report Miracle Mile WQARF Site Arizona Department of Environmental Quality
62 June 12, 2013
URS Job No. 24097013
The first groundwater investigation conducted under the RI in May and June 2001 included the installation of five perched groundwater monitor wells. Analysis of the first samples collected from these wells showed TCE in perched groundwater wells IRA-12-70 and IRA-16 at concentrations of 36 µg/L and 660 µg/L, respectively. TCE in both wells has remained above the AWQS in subsequent sampling events. Wells IRA-12-70 and IRA-16 are both located on the R.E. Darling property. Monitor well IRA-11-70, located approximately 1,150 feet north of IRA-16, is frequently dry; however, when sampled it has consistently shown no detections of TCE.
Two groundwater samples were collected from the R.E. Darling property in May 2002 during the vertical profiling and soil boring investigation. The groundwater sample collected from Boring No. 7, at a depth of 72 feet bgs, contained TCE at a concentration of 1,400 µg/L, and the sample from Boring No. 8, collected at 80 feet bgs, contained TCE at a concentration of 880 µg/L.
Five of the perched groundwater IRA monitor wells (IRA-16, IRA-17, IRA-19, IRA-21, and IRA-22), installed in February 2003, consistently have elevated concentrations of TCE. TCE concentrations in the five perched groundwater monitor wells ranged from 48.2 µg/L in well IRA-22 to 2,110 µg/L in well IRA-19 in December 2011. Three of the four perched groundwater wells (IRA-27, IRA-29, and IRA-30) installed in June 2004 consistently contain perched groundwater. All three of those wells also contain detectable levels of TCE, ranging from 92.1 to 133 µg/L in December 2011. One perched groundwater monitor well located at the Spring Joint facility (SJ-MW-2) was sampled in December 2011, the remaining two wells could not be sampled due to access restrictions; however, these wells have typically been dry in the past. SJ-MW-2 contained TCE at a concentration of 123 µg/L. Appendix L contains the analytical results for the monitor wells for each sampling event from 1999 through 2011. Appendix M shows graphs of the concentration trends in perched groundwater wells. Figure 33 shows a map of the perched wells and some of the subsequent TCE concentration trends. Appendix N contains maps of the TCE concentrations over time in the perched groundwater.
Eleven of the perched groundwater monitor wells that were sampled in 2011 had elevated concentrations of TCE (Table 17). These results are consistent with sampling events occurring since well installations in 2003 and 2004.
TCE concentrations in the perched groundwater, based on the limited sampling results available, appear to correlate with the TCE results from the passive soil-gas surveys. Figure 34 compares the TCE concentrations detected in groundwater samples collected from the perched groundwater IRA wells in December 2004 with the TCE concentrations detected during the passive soil-gas survey. Figure 34 shows the two areas of highest TCE concentrations in the
Remedial Investigation Report Miracle Mile WQARF Site Arizona Department of Environmental Quality
63 June 12, 2013
URS Job No. 24097013
perched groundwater zone correspond with two areas of high soil-gas levels (dark orange to red shading). No monitor wells have been installed in or near the area of high soil-gas concentrations near Price Street. This is a data-gap and discussed further in Section 10.2.
TCE concentrations decline toward the west, as indicated by TCE concentrations detected in wells IRA-12-70, IRA-21, IRA-22, and IRA-27. Perched groundwater monitor wells IRA-11-70 and IRA-15 located north of the TCE plume have generally been dry since their installation. These two wells may delineate the northern extent of the perched groundwater zone, at least in the area west of Romero Road, which would also indicate the northern extent of the TCE plume in the perched zone.
Perched groundwater monitor well IRA-10-100, located approximately 2,200 feet northeast of well IRA-17 and east of Romero Road, has been sampled since 1998 but has shown no detectable TCE concentrations.
Tetrachloroethylene (PCE)
PCE has been detected in low concentrations (less than 2.4 µg/L) in four of the perched groundwater monitor wells, IRA-16 and IRA-19, both located on the R.E. Darling property, and IRA-29 and IRA-30, both located on the Abrams property. The AWQS for PCE is 5.0 µg/L. PCE concentrations in well IRA-16 have ranged from non-detect (below the RL of 0.50 µg/L) to 1.4 µg/L since sampling began at that well in June 2001. Well IRA-19 has been sampled fifteen times since May 2003 and has contained PCE concentrations ranging from non-detect to 2.4 µg/L. In December 2011, only two perched groundwater monitor wells contained PCE detections, IRA-16 with 0.92 μg/l and IRA-19 with 0.92 μg/l. Table 17 provides a summary of the 1999 through 2011 PCE concentrations in the perched groundwater monitor wells. Figure 35 shows a map of the perched wells and some of the subsequent PCE concentration trends. Appendix M shows graphs of the concentration trends in perched groundwater wells IRA-1 through IRA-31. Based on the limited occurrence and extremely low concentrations of PCE in the perched groundwater IRA monitor wells, PCE in the perched groundwater zone does not appear to be a major concern.
1,1-Dichloroethylene (1,1-DCE)
The maximum concentration of 1,1-DCE detected in the perched groundwater zone was 39.5 µg/L from a sample collected from well IRA-30 in April 2007. The AWQS for 1,1-DCE is 7.0 µg/L. Well IRA-30 is located at the southern boundary of the Abrams property. The second and third highest concentration of 1,1-DCE detected in the perched groundwater monitor wells were 35.9 and 35 µg/L in IRA-30, in October 2007 and April 2005, respectively. Monitor well IRA-22 has contained elevated concentrations of 1,1-DCE, ranging from 3 µg/L to 12 µg/L.

Remedial Investigation Report Miracle Mile WQARF Site Arizona Department of Environmental Quality
64 June 12, 2013
URS Job No. 24097013
IRA-29 has also contained 1,1-DCE at concentrations ranging from 7.16 to 16 µg/L. IRA-27 has contained 1,1-DCE at concentrations ranging from 10.6 to 20 µg/L.
Well IRA-16 has had 1,1-DCE at levels ranging from below the RL to 3.9 µg/L. Three other perched groundwater monitor wells (IRA-12-70, IRA-19, and IRA-21) have contained 1,1-DCE at concentrations less than 3.0 µg/L. Appendix M shows graphs of the concentration trends in perched groundwater wells IRA-1 through IRA-31.
cis-1,2-Dichloroethylene (cis-1,2-DCE)
Cis-1,2-DCE has been detected in nine of the perched groundwater wells. Concentrations in well IRA-16 have ranged from 2.9 to 16 µg/L. The AWQS for cis-1,2-DCE is 70 µg/L. Well IRA-19, located approximately 450 feet south-southeast of well IRA-16, at the very southeastern corner of the R.E. Darling property, has shown concentrations of cis-1,2-DCE ranging from 140 µg/L to 240 µg/L. Well IRA-29, located along the southern boundary of the Abrams property, has shown concentrations of cis-1,2-DCE ranging from non-detect to 96.8 µg/L. Concentrations of cis-1,2-DCE in wells SJ-MW-1, SJ-MW-2, IRA-17, IRA-18, IRA-20, and IRA-21 have ranged from below the RL to 15 µg/L. Appendix M shows graphs of the concentration trends in perched groundwater wells IRA-1 through IRA-31. Figure 36 shows a map of the perched wells and some of the subsequent cis-1,2-DCE concentration trends.
MTBE, Freon-11, and Freon-12
Of the 19 perched groundwater monitor wells, only IRA-30 has shown detectable concentrations of MTBE ranging from non-detect to 1.3 µg/L. Of the 19 perched groundwater monitor wells, none have shown detectable concentrations of Freon-11 or Freon-12 (above the RL of 1.0 µg/L). The RL was raised to 2.0 µg/L in 2011; therefore, any future detections will only be identified above 2.0 µg/L. MTBE, Freon-11, and Freon-12 do not have established AWQS.
Total Chromium
Total chromium was detected once in one of the perched groundwater IRA monitor wells (IRA-16) at a concentration above the AWQS of 0.10 mg/L. The June 2001 sampling results showed monitor well IRA-16 contained 0.22 mg/L of chromium. Chromium has not been detected in IRA-16 since April 2006. Groundwater samples collected from the perched groundwater IRA wells installed in February 2003 (wells IRA-17 through IRA-23) have contained chromium concentrations ranging from less than the RL (0.01 mg/L) to 0.067 mg/L—all below the AWQS.
Chromium concentrations in the perched groundwater well SJ-MW-2 have been monitored seven times since May 2004. Concentrations have ranged from 74 to 130 mg/L—approximately three
Remedial Investigation Report Miracle Mile WQARF Site Arizona Department of Environmental Quality
65 June 12, 2013
URS Job No. 24097013
orders of magnitude higher than the AWQS. Table 18 shows the 1999 through 2011 analytical results for chromium and arsenic in the perched groundwater IRA monitor wells. Figure 37 shows a map of the perched wells and some of the subsequent chromium concentration trends.
The two groundwater samples collected during the May 2002 soil boring investigation (Borings No. 7 and 8, at the R.E. Darling Facility) contained chromium at concentrations of 0.078 and 0.012 mg/L, respectively. Based on the groundwater sampling to date, it appears that the chromium contamination in the perched groundwater is limited to the vicinity of Spring Joint (monitor wells SJ-MW-1 and SJ-MW-2).
Hexavalent Chromium
Groundwater samples collected from twelve perched groundwater monitor wells in October 2005 were analyzed for total, dissolved, and hexavalent chromium. The purpose of this sampling was to see if hexavalent chromium is better represented by total chromium or dissolved chromium analysis. While total chromium was detected in eight of the perched groundwater wells, only two perched groundwater monitor wells located on the Spring Joint facility, SJ-MW-1 and SJ-MW-2, contained hexavalent chromium at levels of 8.7 and 130 mg/L, respectively. The results for dissolved chromium were shown to be more representative of the measured concentrations of hexavalent chromium. Therefore, samples collected during following sampling events have been analyzed for dissolved chromium.
Nitrate
Groundwater samples were collected from four of the perched groundwater monitor wells in May 2003 and May 2004 and were analyzed for the major ions in addition to VOCs and metals. The May 2003 analytical results showed that nitrate in the perched groundwater zone exceeded the AWQS of 10.0 mg/L in three of the four monitor wells sampled. Wells IRA-16, IRA-17, and IRA-22 contained 23, 14, and 110 mg/L of nitrate, respectively; well IRA-10-100 contained less than 1.0 mg/L. In May 2004, two of the four wells analyzed for nitrate contained levels above the AWQS. Wells IRA-16 and IRA-21 contained 26 and 32 mg/L of nitrate, respectively. Wells IRA-17 and IRA-22 showed nitrate levels of 4.2 and 0.013 mg/L.
The presence of high concentrations of nitrate in the perched groundwater may be indicative of an industrial and/or septic system source. Additional sampling and investigations are necessary to determine the exact source of the nitrate in the perched groundwater. Below is a table of nitrate exceedances in the perched groundwater.

Remedial Investigation Report Miracle Mile WQARF Site Arizona Department of Environmental Quality
66 June 12, 2013
URS Job No. 24097013
Well Aquifer Zone
May 2003
May 2004
October 2005
IRA-16 Perched 23 26 -- IRA-17 Perched 14 4.2 -- IRA-21 Perched -- 32 -- IRA-22 Perched 110 0.013 -- IRA-27 Perched -- -- 17 IRA-30 Perched -- -- 36
AWQS 10 10 10 AWQS = Aquifer Water Quality Standard; Unit of measurement is mg/L
Major Cations and Anions
During both the May 2003 and May 2004 sampling events the groundwater samples collected from the perched groundwater monitor wells were also analyzed for the major cations and anions. The results from each sampling event compared well with one another. The primary ions in the perched groundwater samples were calcium, sodium, chloride, and sulfate.
Other Constituents
In June 2001, 0.058 mg/L of lead was detected in well IRA-16; the AWQS for lead is 0.05 mg/L, and the EPA Treatment Technique action level is 0.015 mg/L. Groundwater samples collected from well IRA-16, as well as eight other perched monitor wells have been below the AWQS. Lead has not been detected in perched monitor wells since the October 2005 sampling event.
Concentrations of TDS in the perched groundwater monitor wells ranged from 580 mg/L in well IRA-10-100 to 1,500 mg/L in well IRA-22. There is no primary MCL or AWQS for TDS; however, there is a secondary MCL for TDS in drinking water of 500 mg/L, based on aesthetic qualities. TDS is used as a standard indicator of overall water quality.
Disinfection is a critical element in the elimination of pathogens from public drinking water supplies. Disinfection by-products include bromoform, chloroform, bromodichloromethane, and dibromochloromethane. A review of the water quality data showed all four compounds were detected in well IRA-10-100 in December 2001. Chloroform has consistently been detected in perched groundwater well IRA-16, and occasionally in wells IRA-17 and IRA-19, ranging from 0.8 to 2.2 µg/L. Chloroform has also occurred in wells IRA-29 and IRA-30 at levels of 1.5 and 0.6 µg/L, respectively. The presence of disinfection by-products in the perched groundwater zone could indicate a potential recharge source of chlorinated public supply water or a wastewater/septic source.

Remedial Investigation Report Miracle Mile WQARF Site Arizona Department of Environmental Quality
67 June 12, 2013
URS Job No. 24097013
7.5.2 Contaminants in Regional Aquifer
From 1990 through 2011, 24 IRA monitor wells have been installed and completed in the regional aquifer in the Site. The construction data for the 24 regional IRA monitor wells are listed in Table 4. The following discussion focuses primarily on contaminant concentrations and trends in the regional IRA monitor wells. While data collected from the water supply wells, both private and public, over the past 21 years have been useful in early site investigations and preliminary remedial actions, these data do not adequately characterize the nature and extent of groundwater on a regional scale. Most of the water supply wells are screened or perforated through a longer portion of the aquifer or in multiple aquifer zones, as compared to the monitor wells. Because of the longer screened interval, significant dilution of any contaminants may be occurring, and hence, water samples collected from these wells are not indicative of the concentration of contaminants at any specific depth. The screened interval of the regional IRA monitor wells ranges from 60 to 80 feet, whereas the FWID wells that are sampled on a regular basis have screened interval lengths ranging from 350 to 553 feet. Additional dilution is likely to occur when most or all of the well screen of the well is located below the plume. An example would be FWID-70, which is screened 450 to 800 feet bgs. The FWID-70 well, which has been located within the lateral extent of the plume—between groundwater monitor wells IRA-9 and IRA-25—has much lower levels of TCE in it than the upgradient IRA-9 and the downgradient IRA-25.
Table 15 and Table 16 present a summary of the 1999 through 2011 analytical results for selected VOCs and metals in the IRA monitor wells completed in the regional aquifer. Summary tables of the analytical data for groundwater samples collected from 1999 through 2011 are included in Appendix L. Time-series plots of TCE, PCE, 1,1-DCE, and chromium for IRA monitor wells are provided in Appendix M.
7.5.2.1 Horizontal Distribution and Trends
TCE, PCE, and chromium are the only contaminants consistently detected above an AWQS in the regional aquifer beneath the Site. Figure 38, Figure 39, and Figure 40 present contours for TCE, PCE, and chromium, respectively, in the regional aquifer based on the December 2011 sampling results. Maps were not included in the RI Report for 1,1-DCE, Freon-11, Freon-12, or MTBE as these contaminants are not considered COCs for the Site.
Trichloroethylene (TCE)
Nineteen of the IRA regional monitor wells have, at least once, contained detectable concentrations of TCE (see Table 15). Figure 38 presents an iso-concentration map of TCE in the

Remedial Investigation Report Miracle Mile WQARF Site Arizona Department of Environmental Quality
68 June 12, 2013
URS Job No. 24097013
regional aquifer based on the December 2011 analytical results. Figure 41 presents a time-series graph of TCE concentrations in six of the regional IRA monitor wells.
Monitor well IRA-2 was the first regional IRA monitor well in which TCE concentration was detected above the AWQS (5.0 µg/L). Well IRA-2 was one of four wells constructed in October 1990 (see Table 4). Well IRA-2 began to show TCE concentrations above the AWQS (at 7.6 µg/L.) in January 1995; TCE concentrations in this well have remained above the AWQS since 1995. The other three wells (IRA-1, IRA-3, and IRA-4) constructed in October 1990 have shown only trace concentrations of TCE, and hence, can be regarded as lying outside of the primary TCE plume. Well IRA-4 is located approximately 2,600 feet south of IRA-2 and south of Prince Road. From 2003 to April 2008, this well contained less than 1 μg/L of TCE or no detectable TCE. Over the last three years, TCE concentrations have been increasing slightly (1.3 μg/L in November 2008, 3.26 μg/L in October 2010, 3.17 μg/L in December 2011. However, TCE concentrations have been less than the AWQS, indicating that the source of the TCE seen in well IRA-2 must be located north of well IRA-4.
In March 1995, monitor wells IRA-6 and IRA-7 were constructed north of Prince Road and well IRA-4. TCE concentrations in well IRA-6 have ranged from less than 0.5 to 5.5 µg/L. TCE concentrations in well IRA-7 increased from 1.9 µg/L in January 1997 to 9.6 µg/L in February 1997 then decreased to 1.1 µg/L in October 1997 and have remained below the AWQS since October 1997. The water quality data suggest that these two wells are on the very southern periphery of the TCE plume.
In May 1996, well IRA-8 was constructed due north of wells IRA-6 and IRA-7 (250 and 550 feet, respectively). Well IRA-8 is located on the R.E. Darling property, approximately 25 feet west of the abandoned Fairfax well. Since March 1998, TCE concentrations in well IRA-8 have been above the AWQS, ranging from 6.5 to 59 µg/L. Figure 9 shows the TCE concentrations in well IRA-8 over time.
Monitor wells IRA-2 and IRA-14, located at the southeastern corner of the A Family Discount Storage facility and IRA-11-210 located on the southwestern corner of the Friedman Recycling property, have historically contained the highest TCE concentrations at the Site. TCE in well IRA-2 has ranged from 1.0 µg/L in June 1991 to 180 µg/L in March 2001. Since March 2001, TCE in well IRA-2 has decreased, but is still above the AWQS (see Figure 41). TCE in IRA-11-210 has ranged from 3.8 µg/L in March of 2002 to 187 in October 2010.
Well IRA-14, drilled in May 2001, is located approximately 22 feet west of regional aquifer well IRA-2 and is the deepest monitor well, at a total depth of 300 feet bgs. Well IRA-14 was constructed and equipped to allow simultaneous collection of discrete samples from multiple
Remedial Investigation Report Miracle Mile WQARF Site Arizona Department of Environmental Quality
69 June 12, 2013
URS Job No. 24097013
depth intervals and has five, 10-foot screened intervals at depths of 160-170, 190-200, 230-240, 260-270, and 290-300 feet bgs. The maximum TCE concentration seen in well IRA-14 was in June 2001, at 390 µg/L in the interval from 190- 200 feet bgs. The analytical data from wells IRA-2 and IRA-14 suggest that the (highest concentration portion of the TCE plume passed through these wells sometime between March and June 2001.
Well IRA-9 is located approximately 720 feet north-northeast and downgradient of wells IRA-2 and IRA-14. Prior to June 1999, TCE concentrations in well IRA-9 were less than 4.0 µg/L. Beginning in June 1999, TCE concentrations began to increase above the AWQS, and peaked in September 2002 at 79 µg/L, which is approximately 15 to 18 months after the TCE concentration peak was observed in well IRA-2. TCE concentrations in well IRA-13-210, located approximately 600 feet east-northeast from well IRA-2, also appear to have peaked in September 2002 at 93 µg/L (see Figure 41).
Assuming that wells IRA-9 and IRA-13-210 are intercepting the same TCE plume that was seen in wells IRA-2 and IRA-14, travel time for the plume may be estimated to be between 1.1 and 1.3 ft/day. The travel time of 1.1 to 1.3 ft/day assumes constant and uniform conditions existed during those 6 years. In reality, pumping from nearby FWID wells, groundwater recharge, dropping water levels, and other factors would have influenced the travel time, and also direction, of the plume.
Wells IRA-25 and IRA-26 were installed in May 2003. The most recent sampling results, from December 2011, show TCE concentrations in wells IRA-25 and IRA-26 of 17.3 and 0.74 µg/L, respectively. Well IRA-25 is located approximately 2,800 feet north of IRA-2; well IRA-26 is located approximately 2,640 feet northeast of well IRA-2.
TCE was also detected in 1997 in two water samples from well FWID-66 at concentrations close to the AWQS. Well FWID-66 is located approximately 515 feet south-southeast of well IRA-26, and 2,550 feet northeast of well IRA-2. The two samples, one collected in October 1997 and one in November 1997, contained TCE at 4.9 and 4.7 µg/L, respectively. The December 1997 sample contained less than the RL (0.05 µg/L) of TCE. Well FWID-66 was pumped extensively prior to October 1997, but when TCE was detected at 4.9 µg/L the well was shut off. Well FWID-66 is currently inactive and is not used as a water supply well under an ADEQ/FWID agreement.
Well IRA-10-230, constructed in April 1997, is located approximately 1,000 feet south-southwest and upgradient of well FWID-66. TCE in well IRA-10-230 was detected at a maximum concentration of 19 µg/L in April and June of 1997 but decreased rapidly with the cessation of pumping of well FWID-66 in late 1997. TCE in well IRA-10-230 has remained

Remedial Investigation Report Miracle Mile WQARF Site Arizona Department of Environmental Quality
70 June 12, 2013
URS Job No. 24097013
below the AWQS since December 1997, which strongly indicates that the pumping of well FWID-66 was a contributing factor to the migration of TCE in the regional aquifer.
Wells IRA-24 and IRA-31 were installed in June 2004. The intent of well IRA-24 was to provide a northwest monitoring point that was beyond the estimated boundary of the contaminant plume. Since its installation six samples have been collected from IRA-24. Only one of these samples has been above the RL for TCE, the sample collected in October 2005 (1.4 µg/L). Well IRA-31 was installed to further characterize the horizontal and vertical extent of contamination at the Spring Joint property as a part of the Spring Joint SI. IRA-31 is located on the western portion of the Spring Joint property and has been sampled eight times; the TCE concentrations have ranged from 0.55 µg/L to 2.4 µg/L.
Wells IRA-32 and IRA-33 were constructed in April 2011 and are located at 4522 North Pomona Road. The location and depths of the wells were chosen to further delineate the northern boundary and the depth of the plume. IRA-32 is a shallow depth regional aquifer well and IRA-33 is an intermediate depth regional aquifer well. The wells were sampled at the end of well development during May 2011 and were below the laboratory reporting limit for the COCs at this site. PCE was detected at 0.56 µg/L in the December 2011 sampling event.
IRA-34 and IRA-35 were constructed in April 2011 and are located at 1318 and 1310 West Wetmore Road, respectively. The location and depths of the wells were chosen to further delineate the northern boundary and the depth of the plume. IRA-34 is a shallow depth regional aquifer well and IRA-35 is an intermediate depth regional aquifer well. The wells were sampled at the end of well development during May 2011 and were below the laboratory reporting limit for the COCs at this site.
IRA-36 and IRA-37 were constructed in May and April 2011, respectively, and located adjacent to 4508 North Hansa Drive. The location and depths of the wells were chosen to further delineate the northern boundary and the depth of the plume. IRA-36 is a shallow depth regional aquifer well and IRA-37 is an intermediate depth regional aquifer well. The wells were sampled at the end of well development during May 2011. TCE was detected in well IRA-36 at a concentration of 3.4 µg/L. Well IRA-36 was re-sampled and analyzed for VOCs when the dedicated pumping equipment was installed on June 10, 2011. TCE was detected at a concentration of 3.3 µg/L and 1,1-DCE was detected at a concentration of 2.0 µg/L. During the December 2011 sampling event, TCE was detected in IRA-36 at a concentration of 8.32 µg/L and 1,1-DCE was detected at 3.31 µg/L. IRA-37 had a concentration of TCE below the laboratory reporting limit. IRA-36 was re-sampled in early January 2012 due to the unexpected concentration found during the

Remedial Investigation Report Miracle Mile WQARF Site Arizona Department of Environmental Quality
71 June 12, 2013
URS Job No. 24097013
December 2011. The concentration of TCE in IRA-36 during the re-sample was 9.26 µg/L and this concentration is depicted on Figure 38.
Since TCE has been detected consistently in the Site regional aquifer at concentrations above the AWQS and in Site perched groundwater above the AWQS, TCE is a COC for this Site.
Tetrachloroethylene (PCE)
PCE has been detected at least once in 16 of the 24 regional IRA monitor wells. Wells IRA-13-210, IRA-14, IRA-26, IRA-33, IRA-34, IRA-35, IRA-36, and IRA-37 have not, to date, contained any detectable levels of PCE. Prior to March 2004, only one monitor well, IRA-12-210, located on the western portion of the R.E. Darling property, contained PCE concentrations above the AWQS (5.0 µg/L). Well IRA-12-210, constructed in June 2001, contained a maximum of 6.8 µg/L in June 2001 but concentrations have dropped below the AWQS in 2002. Since 2002, PCE concentrations in IRA-12-210 have continued to decrease gradually. In December 2011, the PCE concentration was 1.13 µg/L (December 2011). There are only two wells containing PCE above the AWQS within the Site groundwater monitoring well network: IRA-1 and IRA-5 located at the far southwestern and western edge, respectively, of the network and the Site plume (Figure 39). PCE levels in well IRA-1 increased above the AWQS in 2004 and have continued to be above the AWQS through 2011, with a concentration of 35.5 µg/L in December 2011. PCE levels in well IRA-5 increased above the AWQS in 2004 and have continued to be above the AWQS through 2010, with a concentration of 5.77 µg/L in October 2010. In December 2011, the IRA-5 concentration dropped below the AWQS to 2.35 µg/L. Time series graphs of PCE levels in IRA-1 and IRA-5 are shown in Appendix M. Figure 39 shows the distribution of PCE in the regional aquifer beneath the Site as of December 2011.
PCE has not been found in regional aquifer above the AWQS within the geographically defined release area for the Site (Romero Road, between Prince and Roger Roads); therefore, PCE is not a Site COC. Only two perched groundwater wells contain PCE (detections less than 1 µg/L); thus, the Site perched groundwater is not considered a potential source for releasing PCE to the Site regional aquifer. However, since PCE has a low AWQS (5 μg/l) and has been detected in over a half dozen regional aquifer groundwater monitor wells spread throughout the Site, it is considered a COPC. Figure 42 shows a map of the regional wells and some of the subsequent PCE concentration trends.
1,1-Dichloroethylene (1,1-DCE)
Nineteen of the regional IRA monitor wells have, at least once, contained detectable 1,1-DCE concentrations. Wells IRA-1, IRA-32, IRA-33, IRA-34, and IRA-35, have not, to date, contained any detectable levels of 1,1-DCE. Only one well IRA-25, located at 4355 North Romero Road,

Remedial Investigation Report Miracle Mile WQARF Site Arizona Department of Environmental Quality
72 June 12, 2013
URS Job No. 24097013
contained a concentration of 1,1-DCE above the AWQS (7.0 µg/L). IRA-25 contained a maximum of 7.2 µg/L in April 2005, but concentrations have slowly declined to 3.3 µg/L in December 2011.
Since 1,1-DCE has not been found above the AWQS consistently in the Site regional aquifer, 1,1-DCE is not a COC for the Site. However, 1,1-DCE is a COPC because it has been detected above the AWQS in Site perched groundwater wells (potential continued source to the regional aquifer); it has an AWQS of only 7.0 µg/L; and it has been detected in numerous Site regional aquifer wells at 1 to 3 µg/L.
cis-1,2-Dichloroethylene (cis-1,2-DCE)
Ten of the twenty-four regional IRA monitor wells (IRA-1, IRA-2, IRA-5, IRA-8, IRA-9, IRA-14, IRA-11-210, IRA-13-210, IRA-25, and IRA-26) have, at least once, contained detectable cis- 1,2-DCE concentrations, all of which were much less than the AWQS (70 µg/L). The highest concentrations detected to date have been in the well IRA-14. The second screened interval between 190-200 feet bgs contained a cis1,2-DCE concentration of 5.2 µg/L in January 2003 and 6.2 µg/L in September 2001.
Since cis-1,2-DCE is well below the AWQS in the regional aquifer and the perched groundwater, cis-1,2-DCE is not a COC or a COPC.
MTBE
The maximum concentration of MTBE was detected in well IRA-2 in September 1999 at 30 µg/L. MTBE in well IRA-2 has ranged from less than the laboratory reporting limit (0.5 µg/L) to 30 µg/L. Well IRA-9, located downgradient of well IRA-2, has shown MTBE concentrations ranging from less than the RL to 12 µg/L. Fifteen of the twenty-four regional monitor wells have never shown any concentrations above the laboratory reporting limit. Since February 2000, none of the regional IRA wells have contained MTBE concentrations above 2.0 µg/L.
EPA has not set a national standard for MTBE, nor is there an AWQS. However, the EPA issued a Drinking Water Advisory for MTBE in 1997 and recommended that MTBE contamination in drinking water be limited to 20 µg/L to 40 µg/L. EPA also stated in the 1997 health advisory that there is little likelihood that MTBE concentrations between 20 and 40 ppb in drinking water would cause negative health effects.
MTBE is not a Site COC or COPC.
Remedial Investigation Report Miracle Mile WQARF Site Arizona Department of Environmental Quality
73 June 12, 2013
URS Job No. 24097013
Freon-11
Six of the twenty-four regional IRA wells (IRA-1, IRA-4, IRA-5, IRA-6, IRA-7, and IRA-12-210) have shown at least trace detections of Freon-11 in one or more samples. There is no established or recommended national standard for Freon-11; nor is there an AWQS. Prior to February 1999, none of the regional IRA wells showed any detections of Freon-11 above the laboratory reporting limit. Beginning with the December 1999 sampling event, well IRA-7, began showing trace amounts of Freon-11. Wells IRA-5 and IRA-6 began showing trace amounts in the second quarter 2000, IRA-12-210 began showing trace amounts in second quarter 2001, and IRA-1 and IRA-4 began showing trace amounts in December 2004.
The highest level of Freon-11 detected occurred in well IRA-1 in December 2011 at a concentration of 7.65 µg/L. IRA-4 and IRA-5 continue to show detectable levels of Freon-11 with a maximum of 2.2 µg/L detected in a sample from the well in April 2005 and 1.3 µg/L detected in a sample in April 2007.
Freon-11 is not a Site COC or COPC and the detections that have been seen at the Site are likely related to upgradient source to the southwest.
Freon-12
Eight of the twenty-four regional IRA wells (IRA-1, IRA-4, IRA-5, IRA-6, IRA-7, IRA-8, IRA-11-210 and IRA-12-210) have contained Freon-12 at detectable (RL is 0.5 µg/L) concentrations at least once. Well IRA-1 has contained the highest concentrations, ranging up to 76.4 µg/L in December 2011. Well IRA-5 contains the next highest concentration of Freon-12, with a maximum of 21 µg/L in April 2005.
Freon-12 is not a Site COC or COPC, and like Freon-11, the detections that have been seen at the Site are likely related to an upgradient source to the southwest.
Chromium
Water samples obtained from the regional wells have been analyzed for chromium, in addition to other metals, since April 1997. Figure 40 presents the chromium concentrations in the regional IRA monitor wells based on December 2011 sample results. Figure 43 is a time-series graph showing concentrations of chromium in five regional IRA monitor wells: IRA-2, IRA-7, IRA-8, IRA-9, and IRA-10-230. These five wells have historically contained chromium in concentrations close to or above the AWQS. The upper two zones of well IRA-14 have also contained chromium in concentrations above the AWQS. Table 16 presents a summary of the 1999 through 2011 analytical results for arsenic and chromium in the regional IRA wells.
Remedial Investigation Report Miracle Mile WQARF Site Arizona Department of Environmental Quality
74 June 12, 2013
URS Job No. 24097013
In addition to being the first well to detect TCE above the AWQS, well IRA-2 was also the first well in which chromium was first detected at a concentration above the AWQS (0.1 mg/L). In December 2000, the water sample obtained from well IRA-2 contained 1.6 mg/L of chromium. Chromium in well IRA-2 remained above the AWQS until May 2004 when the level dropped below the AWQS (see Figure 43). Chromium concentrations in well IRA-9, located approximately 720 feet north-northeast and downgradient of well IRA-2, began to increase in September 2000, exceeding the AWQS. The maximum in well IRA-9 occurred in September 2002, at 1.0 mg/L (see Figure 43), which was approximately 24 months after the peak occurred in well IRA-2. The most recent groundwater sample collected from well IRA-9 (December 2011) dropped below the AWQS at 0.0628 mg/L of chromium. IRA-8 has shown an increase in chromium over the AWQSs beginning in 2006; however, there is not enough data for well IRA-8 prior to 1998 or enough consistent data in wells IRA-2, IRA-9, and IRA-8 from 2007 through 2011 to determine whether or not a second pulse of chromium is moving through the perched groundwater at this time. None of the FWID supply wells included in the quarterly sampling events have shown chromium concentrations above the RL (0.010 mg/L).
The chromium was also detected in the peripheral IRA monitor wells (IRA-1, IRA-3, IRA-4, and IRA-5). Chromium concentrations in these four wells in the December 2011 samples range from less than 0.01 to 0.0191 mg/L.
IRA-31 is located immediately adjacent to the Spring Joint facility perched groundwater wells, SJ-MW-1 and SJ-MW-2, which have shown high levels of chromium since they were installed by the owner of Spring Joint in early 2004. The chromium results from the IRA-31 well are below the AWQS, with concentrations ranging from less than 0.010 to 0.053 mg/L.
Chromium (total) has been detected consistently in Site regional aquifer wells above the AWQS and in one Site perched groundwater well at concentrations three orders of magnitude above the AWQS; therefore, total chromium is a COC in the regional aquifer.
Hexavalent Chromium
Knowledge of the oxidation state of chromium in groundwater at the Site is important to understanding the mechanisms for transport and to assess potential risks to receptors. As such, during the October 2005 groundwater-sampling event, aliquots (a portion of the total sample) from twenty regional wells were collected and analyzed for total, dissolved (25 micron filtered), and hexavalent chromium. The results of these analyses are presented in Figure 44.
Fourteen of the twenty samples collected from regional monitor wells (including four intervals from IRA-14) had detectable levels of total chromium. However, ten of those fourteen also had
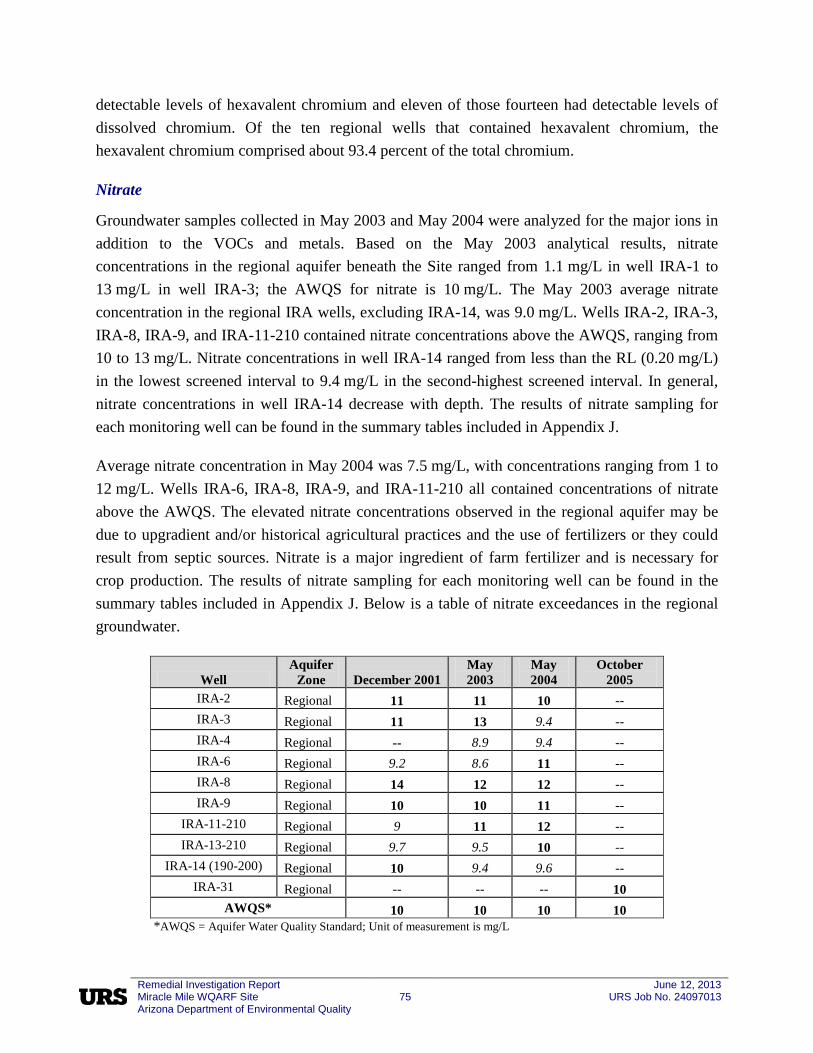
Remedial Investigation Report Miracle Mile WQARF Site Arizona Department of Environmental Quality
75 June 12, 2013
URS Job No. 24097013
detectable levels of hexavalent chromium and eleven of those fourteen had detectable levels of dissolved chromium. Of the ten regional wells that contained hexavalent chromium, the hexavalent chromium comprised about 93.4 percent of the total chromium.
Nitrate
Groundwater samples collected in May 2003 and May 2004 were analyzed for the major ions in addition to the VOCs and metals. Based on the May 2003 analytical results, nitrate concentrations in the regional aquifer beneath the Site ranged from 1.1 mg/L in well IRA-1 to 13 mg/L in well IRA-3; the AWQS for nitrate is 10 mg/L. The May 2003 average nitrate concentration in the regional IRA wells, excluding IRA-14, was 9.0 mg/L. Wells IRA-2, IRA-3, IRA-8, IRA-9, and IRA-11-210 contained nitrate concentrations above the AWQS, ranging from 10 to 13 mg/L. Nitrate concentrations in well IRA-14 ranged from less than the RL (0.20 mg/L) in the lowest screened interval to 9.4 mg/L in the second-highest screened interval. In general, nitrate concentrations in well IRA-14 decrease with depth. The results of nitrate sampling for each monitoring well can be found in the summary tables included in Appendix J.
Average nitrate concentration in May 2004 was 7.5 mg/L, with concentrations ranging from 1 to 12 mg/L. Wells IRA-6, IRA-8, IRA-9, and IRA-11-210 all contained concentrations of nitrate above the AWQS. The elevated nitrate concentrations observed in the regional aquifer may be due to upgradient and/or historical agricultural practices and the use of fertilizers or they could result from septic sources. Nitrate is a major ingredient of farm fertilizer and is necessary for crop production. The results of nitrate sampling for each monitoring well can be found in the summary tables included in Appendix J. Below is a table of nitrate exceedances in the regional groundwater.
Well Aquifer
Zone December 2001 May 2003
May 2004
October 2005
IRA-2 Regional 11 11 10 -- IRA-3 Regional 11 13 9.4 -- IRA-4 Regional -- 8.9 9.4 -- IRA-6 Regional 9.2 8.6 11 -- IRA-8 Regional 14 12 12 -- IRA-9 Regional 10 10 11 --
IRA-11-210 Regional 9 11 12 -- IRA-13-210 Regional 9.7 9.5 10 --
IRA-14 (190-200) Regional 10 9.4 9.6 -- IRA-31 Regional -- -- -- 10
AWQS* 10 10 10 10 *AWQS = Aquifer Water Quality Standard; Unit of measurement is mg/L

Remedial Investigation Report Miracle Mile WQARF Site Arizona Department of Environmental Quality
76 June 12, 2013
URS Job No. 24097013
Major Cations and Anions
During both the May 2003 and May 2004 sampling events the groundwater samples collected from the regional aquifer monitor wells were analyzed for the major cations and anions. The results from each sampling event compared well with one another. TDS in the regional water is slightly lower than in the perched groundwater zone, ranging from 580 to 1,000 mg/L, based on the May 2004 sampling results. (TDS concentrations in wells completed in the perched zone range from 710 to 1,200 mg/L). Evaluation of major cation and anion data indicates a general shift from sodium as the predominant cation in the southwest portion of the Site, near well IRA-1, to calcium toward the north-northeast portion of the Site, near well IRA-26.
Other Constituents
Arsenic concentrations in well IRA-1 consistently exceeded the recently-revised MCL of 0.01 mg/L, ranging from 0.014 to 0.029 mg/L through November 2008. (Note—The Arizona Aquifer Water Quality Standard has not yet been changed to 0.01 mg/L; it is still 0.05 mg/L.) Well IRA-4 has exceeded the revised Federal standard (MCL) of 0.010 mg/L once, in May 2003. These two wells are located on the southwest margin of the Site, nearest to the Santa Cruz River. Arsenic concentrations in all of the other regional IRA monitor wells have been below the RL (0.005 mg/L). Wells FWID-70 and FWID-75 have, on occasion, contained arsenic in concentrations above the revised MCL. Well FWID-70 contained 0.077 mg/L and 0.050 mg/L of arsenic in February and May 2000, respectively. Well FWID-75 had arsenic concentrations of 0.044 mg/L and 0.038 mg/L in April 2002 and January 2003, respectively. Arsenic was not detected in any samples from the October 2010 or the December 2011 sampling events. [However, FWID, which samples wells #70 and #75 regularly for arsenic, did have detections of arsenic above the MCL in 2010 and 2011.] Arsenic in these wells is viewed as naturally occurring and the well water from FWID-70 and FWID-75 is being treated with arsenic-removing media prior to distribution.
In September 2002, groundwater samples were collected from five IRA monitor wells (IRA-2, IRA-8, IRA-9, IRA-13-210, and IRA-16) and three FWID wells (FWID-61, FWID-72, FWID-75) and submitted for 1,4-dioxane analysis, using EPA Method 8270. None of the samples contained 1,4-dioxane concentrations above the laboratory detection limit of 1.0 µg/L. 1,4-dioxane is primarily used as a stabilizer in solvents, such as TCA, and as a solvent in lacquers, varnishes, paints, plastics, dyes, oils, waxes and resins. It may also be found in some paint/varnish strippers, automotive coolants, and in pesticides as an inert ingredient.

Remedial Investigation Report Miracle Mile WQARF Site Arizona Department of Environmental Quality
77 June 12, 2013
URS Job No. 24097013
7.5.2.2 Vertical Distribution and Trends
As described in Section 6.2.1.2, well IRA-14 was constructed in May 2001 with five separate 10-foot screened intervals (160-170, 190-200, 230-240, 260-270, and 290-300 feet bgs) to assess the vertical extent of contamination in the regional aquifer. Well IRA-14 is located in the southeast corner of the A Family Discount Storage facility and approximately 22 feet west of well IRA-2.
Water quality analyses from well IRA-14 provides indication of a vertical component to the dispersion of the contaminant plume. Figure 45 and Figure 46 are time-series graphs showing the vertical distribution of TCE and chromium in well IRA-14. The current sampling data indicate that largest concentrations occur in Port #2 the uppermost saturated interval. Port #1 has been dewatered by declining water levels in the regional aquifer. The range of TCE concentrations for all five intervals in well IRA-14 are shown below:
Well IRA-14 Screened Interval
(feet bgs) Range of TCE
Detections (µg/L) 160 - 170 37 - 140 190 - 200 26 - 390 230 - 240 4 - 88.9 260 - 270 3 - 116 290 - 300 2.8 - 85.5
Note: µg/L = micrograms per liter; TCE = trichloroethylene
Chromium in the upper two screened intervals has ranged from 0.051 mg/L to 1.8 mg/L. In the lower three intervals, chromium has ranged from less than the RL of 0.01 mg/L to 0.057 mg/L.
At the time of this report, data indicating a possible leak in Port #2 is being evaluated. Even though there have been problems with the multi-port sampling system, the data collected in 2012 are consistent with historical data indicating that the highest concentrations of TCE and chromium occur in the upper two screened intervals (160-170 feet bgs and 190-200 feet bgs). At this time, however, the data cannot be used to definitively describe the vertical gradient and vertical extent of contamination because of the possible influence of vertical flow in the well when the seal was not maintained.
7.6 POTENTIAL SOURCE AREAS
In December 2011, ADEQ requested that HydroGeoLogic, Inc. (HGL) provide support by providing a letter report documenting ownership history, operational history, and waste management information related to the facilities of interest located in the vicinity of Romero Road between Roger and Prince Roads. The text in this section is excerpted from the HGL February 6, 2012, facilities research report prepared for ADEQ with minor modifications and

Remedial Investigation Report Miracle Mile WQARF Site Arizona Department of Environmental Quality
78 June 12, 2013
URS Job No. 24097013
corrections provided by ADEQ. The information contained in the HGL report came from facility owners/operators, ADEQ files, Pima County Department of Environmental Quality (PDEQ) files, and other sources listed in Enclosure 1 of the HGL report. Parcels (and facilities operating at them) that were researched by HGL are shown in Appendix O and are as follows:
• Parcel 106-09-025A—San Juan Spring Company, doing business as Spring Joint Specialists Company (Spring Joint) operating at 3660 North Romero Road
• Parcel 106-10-013B—Abrams Airborne Manufacturing, Inc. (Abrams) operating at 3735 North Romero Road
• Parcel 106-10-014D—Desert Refrigeration and Auto Service, Inc. (Desert Auto) operating at 3675 North Romero Road
• Parcels 106-10-003G and 106-10-002A—R.E. Darling Company, Inc. (R.E. Darling) operating at 3749-3761 North Romero Road
• Gilpin Airport and Freeway Airport operating at portions of the 3735, 3675, and 3749-3761 North Romero Road parcels prior to Abrams, Desert Auto, and R.E. Darling
The operational history of facilities that operated within each parcel is discussed below.
Gilpin and Freeway Airports
In 1940, Walter Douglas Jr. established the Gilpin Airport on portions of the 3735, 3675, and 3749-3761 North Romero Road parcels prior to Abrams, Desert Auto, and R.E. Darling, respectively. Mr. Douglas started the Gilpin Airlines Company and provided charter services and flight instruction at the airport. The U.S. Army and the U.S. Navy used the Gilpin Airport during World War II. During the war, the Gilpin Airlines Company obtained a U.S. Government contract to train pilots under the Civilian Pilot Training Program, and approximately 1,100 U.S. Navy pilots received flight training at the airport. In the late 1950s, Mr. Douglas sold the Gilpin Airport to Arthur Pack, who established ANP Airpilots. Mr. Pack refurbished the airport, which was renamed Freeway Airport, by paving the runways, building hangars on the west side of the property, and adding a new ramp and administration building on Prince Road. The Freeway Airport ceased operations in 1979 or 1980.
Records on the Gilpin and Freeway Airports do not include information on the maintenance activities conducted on the property. Through general research on industrial operations and chemical use, HGL has found that the aircraft repair industry used TCE for degreasing metal parts during the time that the airports were in operation. No information documenting specific use and disposal of the Site COCs at the airport has been found.
Remedial Investigation Report Miracle Mile WQARF Site Arizona Department of Environmental Quality
79 June 12, 2013
URS Job No. 24097013
Parcel 106-09-025A—San Juan Spring Company/Spring Joint Specialists Company
Prior to purchasing property at 3660 North Romero Road, San Juan Spring Company, which was doing business as Spring Joint, leased the property from 1972 to 1975. Spring Joint’s operations consisted of repairing the hydraulic cylinders, suspensions, wheel assemblies, pumps, motors, and valves of heavy hydraulic equipment used by mining companies. In response to a 1990 Preliminary Assessment questionnaire, Spring Joint noted that TCE was used at the facility from 1974 to 1982. Spring Joint began its chrome plating operations on the property in July 1975, with construction of a plating shop. Spring Joint operated at 3660 North Romero Road until October 2002.
Historical city directories list other companies (welding, machining, building) operating at 3660 North Romero Road prior to Spring Joint (1958-1971) but HGL has not located information on the operations of these companies.
According to Spring Joint’s October 27, 2005, response to an Arizona Revised Statutes § 49-288 request for information letter, the company did not receive any notices of environmental violations for its operations at the 3660 North Romero Road property from 1973 until 2002.
In November 2002, Spring Joint delivered three 55-gallon drums of liquid waste and sludge from the degreaser and deruster tanks to Envirotech in Farmington, New Mexico. Envirotech analyzed and disposed of the waste. Spring Joint completed a Pima County Solid Waste Management Nonstandard Waste Disposal Request for the removal of the waste. According to the request, no health hazards were associated with the waste. Laboratory analysis of liquid waste from a hot vat found chromium at a concentration of 3.87 milligrams per liter (mg/L). Laboratory analysis of the sludge found chromium concentrations of 4.21 (mg/kg). No further information was available on the drums.
In May 2003, Western Technologies removed a subsurface concrete sump, and the soil around the sump was sampled. The samples collected showed chromium (VI) soil concentrations as high as 3,420 mg/kg at approximately 13 feet below ground surface (bgs). The sump had been used as a spill containment structure for a metal tank used for chrome plating. The excavated soil and the concrete debris from the removal of the tank were disposed of as hazardous waste in October 2003.

Remedial Investigation Report Miracle Mile WQARF Site Arizona Department of Environmental Quality
80 June 12, 2013
URS Job No. 24097013
Parcels 106-10-003G and 106-10-002A—R.E. Darling Company, Inc.
Multiple tenants have conducted operations on the site parcels owned by Fairfax Investments, LLC (Fairfax Investments). One of the tenants, R.E. Darling, has been in operation at the Tucson location since 1960. The buildings occupied by the company include the original two hangars and control tower of the Gilpin Airport. Since 1972, five metal buildings have been constructed on the property to the west of the hangars and control tower. Each of the metal buildings has its own street address. Since operations began in 1960, R.E. Darling has manufactured oxygen breathing systems for commercial and military aviation uses as well as reinforced plastics, molded rubber products, and extruded and lathe-cut mechanical rubber.
In 1961, R.E. Darling purchased its first vapor degreaser and used it in a small brick shed. TCE was applied with small spray bottles and with brushes in the facility’s hose production and research and development areas. There are no floor drains in either area. TCE degreasers were used by R.E. Darling at several locations within the facility complex. One of these, a 130-gallon TCE degreaser, was located within an uncoated, bermed, monolithic concrete secondary containment structure. The degreaser was plumbed directly to a still that also was located within the secondary containment structure.
In 1990, R.E. Darling was operating seven vapor degreasers: one 150-gallon, one 60-gallon, three 30-gallon, and two 1-gallon units. According to an October 20, 1993, PDEQ compliance inspection report, at least one of the 30-gallon degreasers used TCE.
Between 1971 and 1985, Fairfax Investments constructed five buildings on its property, and portions of those buildings were rented to several tenants. Regulatory records indicate that only one of the tenants, Tucson Rubber Corporation, may have used solvents. Records indicate that Tucson Rubber Corporation applied 1,1,1-trichloroethane (TCA) with brushes, but it does not appear that this or any other tenant used the Site COCs. Additional information related to the operational history and waste streams generated by these tenants has not been located.
Hazardous waste streams generated by R.E. Darling include TCE from degreasing processes and chromium from Chemfilm and passivation processes. Hazardous waste disposal documentation since 1981 indicates that hazardous waste generated on site has been transported off site to approved hazardous waste disposal facilities or recyclers. Small quantities of hazardous waste containing TCE were sent to Southwest Solvents or ESCO for reclamation according to a March 4, 1981, inspection report. The table below
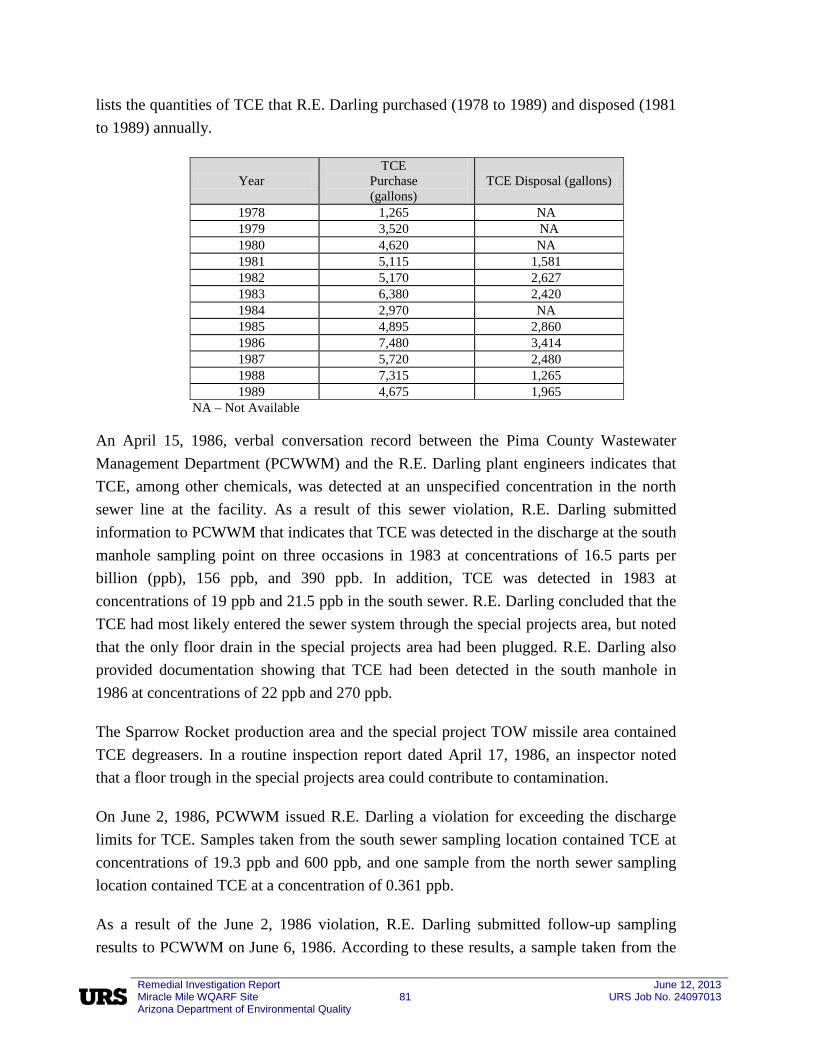
Remedial Investigation Report Miracle Mile WQARF Site Arizona Department of Environmental Quality
81 June 12, 2013
URS Job No. 24097013
lists the quantities of TCE that R.E. Darling purchased (1978 to 1989) and disposed (1981 to 1989) annually.
Year TCE
Purchase (gallons)
TCE Disposal (gallons)
1978 1,265 NA 1979 3,520 NA 1980 4,620 NA 1981 5,115 1,581 1982 5,170 2,627 1983 6,380 2,420 1984 2,970 NA 1985 4,895 2,860 1986 7,480 3,414 1987 5,720 2,480 1988 7,315 1,265 1989 4,675 1,965
NA – Not Available
An April 15, 1986, verbal conversation record between the Pima County Wastewater Management Department (PCWWM) and the R.E. Darling plant engineers indicates that TCE, among other chemicals, was detected at an unspecified concentration in the north sewer line at the facility. As a result of this sewer violation, R.E. Darling submitted information to PCWWM that indicates that TCE was detected in the discharge at the south manhole sampling point on three occasions in 1983 at concentrations of 16.5 parts per billion (ppb), 156 ppb, and 390 ppb. In addition, TCE was detected in 1983 at concentrations of 19 ppb and 21.5 ppb in the south sewer. R.E. Darling concluded that the TCE had most likely entered the sewer system through the special projects area, but noted that the only floor drain in the special projects area had been plugged. R.E. Darling also provided documentation showing that TCE had been detected in the south manhole in 1986 at concentrations of 22 ppb and 270 ppb.
The Sparrow Rocket production area and the special project TOW missile area contained TCE degreasers. In a routine inspection report dated April 17, 1986, an inspector noted that a floor trough in the special projects area could contribute to contamination.
On June 2, 1986, PCWWM issued R.E. Darling a violation for exceeding the discharge limits for TCE. Samples taken from the south sewer sampling location contained TCE at concentrations of 19.3 ppb and 600 ppb, and one sample from the north sewer sampling location contained TCE at a concentration of 0.361 ppb.
As a result of the June 2, 1986 violation, R.E. Darling submitted follow-up sampling results to PCWWM on June 6, 1986. According to these results, a sample taken from the

Remedial Investigation Report Miracle Mile WQARF Site Arizona Department of Environmental Quality
82 June 12, 2013
URS Job No. 24097013
manhole located northwest of Building 3759 contained TCE at a concentration of 0.109 mg/L, and a sample taken from the manhole located southwest of Building 3753 contained TCE at a concentration greater than 0.654 mg/L.
A June 1992 hazardous waste inspection report describes waste generated by R.E. Darling that contained TCE, and the method of removal unique to each waste type. This is shown in the table below. The source document indicates that cured Chemlok glue was not handled as hazardous waste and that a hazardous waste analysis was not performed on the glue. In 2003, R.E. Darling provided PDEQ with material safety data sheets (MSDS) for Chemlok glues. Two of eight Chemlok glues that R.E. Darling used for coating operations contained TCE. Chemlok 402 was composed of 60 percent TCE and Chemlok 234B was composed of 30 percent TCE.
Waste Type Waste Management
TCE Drummed and stored in hazardous waste and materials storage area; manifested to Gibralter Chemical Resources
Rags contaminated with TCE Air dried and discarded in dumpster
Cured Chemlok Glue* Discarded in dumpster *The distinction, if any, between “cured” Chemlok glue and the Chemlok glue listed in the MSDSs is unknown to HGL.
ADEQ noted in an August 5, 1997, hazardous waste inspection report that R.E. Darling was registered as a Resource Conservation and Recovery Act (RCRA) large quantity generator and was generating TCE waste. On February 2, 1998, R.E. Darling submitted a RCRA notification form to change its status from a large quantity generator (generating 2,200 or more pounds of hazardous waste per month) to a small quantity generator (generating between 220 pounds and 2,200 pounds of hazardous waste per month). The form identifies TCE as a hazardous waste generated at the facility. In 2003, R.E. Darling identified 50 hazardous air pollutants, VOCs, and chemicals with chromium that it was using.
As of 2001, R.E. Darling was still using TCE and producing TCE waste. In 2003, R.E. Darling informed PDEQ that it used 8,000 pounds of TCE annually. In addition, R.E. Darling used 1,600 pounds of Chemlok 234B and 20 pounds of Chemlok 402, which contained TCE. R.E. Darling produced documents in 2004 identifying the materials that it was using that contained chromium.
On January 2, 2012, R.E. Darling submitted to ADEQ a notification of RCRA small quantity generator status for generating D001, D006, D009, D040, D035, F001, F002, F003, and F005 hazardous wastes (ADEQ, Personal Communication, Dee Woodard,

Remedial Investigation Report Miracle Mile WQARF Site Arizona Department of Environmental Quality
83 June 12, 2013
URS Job No. 24097013
2012). D040 is hazardous waste by toxicity for TCE. F001, F002, F003, and F005 are listed hazardous wastes for spent solvents which could contain TCE.
Abrams Airborne Manufacturing, Inc. (Parcel 106-10-013B)
Abrams has been in operation at 3735 North Romero Road since 1965 when it purchased Parcel 106-10-0130. (Note—Parcel 106-10-0130 is now part of Parcel 106-10-013B). The first activities at the facility included various sheet metal operations conducted in one building located in the far northeast corner of the parcel. In 1966 or 1967, Abrams expanded to include a steel hangar used for the storage of one aircraft. No aircraft maintenance was conducted in this hangar. In 1982, the hangar was replaced with a cinderblock building where salt bath and dip brazing operations were conducted. Dip brazing involves making “an optimum seal” at seams on aluminum parts.
In 1968, an addition to the original building was constructed to house additional sheet metal operations. A paint shop was constructed on site in 1970. According to a May 5, 2004, ADEQ Expanded Site Inspection Sampling and Analysis Plan (ADEQ, 2004), painting operations have been performed at the Abrams facility since 1971. In 1973, Abrams constructed an aluminum and steel part plating shop for metal plating operations. In 1976, all of the individual buildings at the Abrams facility were connected into one large building, and the sheet metal area was expanded. The sheet metal area was expanded again in 1980.
From 1972 until the late 1980s, Abrams used a TCE vapor degreaser in the plating shop. TCE was stored on site, in either the plating room or the breezeway between a paint area and a dip brazing area. Waste solvents that may have contained TCE were often stored in the plating room (ADEQ, 2004).
Hazardous waste streams containing the Site COCs were generated at the Abrams facility by the following operations: degreasing, aluminum and steel plating, and painting. Abrams submitted a notification of hazardous waste activity to the U.S. Environmental Protection Agency on March 28, 1986, indicating that it generated less than 1,000 kilograms per month of F001 waste (spent halogenated solvents from degreasing). Abrams is also registered as a small quantity generator with the state of Arizona.
Wastewater from the plating operations is directed to an on-site wastewater treatment system through a series of concrete floor troughs. Industrial wastewater from Abrams is discharged to the Pima County publicly owned treatment works (POTW), and from there it is sent to the Pima County Roger Road wastewater treatment plant.

Remedial Investigation Report Miracle Mile WQARF Site Arizona Department of Environmental Quality
84 June 12, 2013
URS Job No. 24097013
Chem-film, a chromate conversion coating, has been used at the facility since 1971 and contains 3 to 5 percent chromic acid. Abrams uses different types of Chem-film with concentrations of chromium ranging from 300 parts per million (ppm) to 5,000 ppm. As of 2004, Abrams was using one to two 55-gallons of Chem-film annually.
Abrams used numerous types of paints and primers, including zinc chromate primers (ADEQ, 2004). In the 1970s, Abrams used between 5 and 6 gallons of paint per month, in the 1980s it used between 25 and 30 gallons per month, and in the 1990s it used between 500 and 600 gallons per month. As of 2004, Abrams was using approximately 250 gallons of paint per month. Cadmium plating, which involved use of cyanide, occurred at the facility from 1972 to 1983. Waste cyanide solution from this process contained chromium.
Hazardous waste manifests from 1983 to 1989 show that Abrams generated waste TCE, paint-related waste classified as F003 and F005 waste, and waste cyanide solution containing chromium. In June 1983, Environmental Waste Enterprises collected nine drums (452 gallons) of TCA and three drums (165 gallons) of TCE from the facility. The table below lists the quantities of TCE that Abrams used from 1972 to 1983 and waste TCE generated in 1983 as identified in the August 21, 1990 Preliminary Assessment/Site Investigation report (ADEQ, 1990b)1.
Year TCE Used (drums)
TCE Waste Generated (drums)
1972-1973 2 NR 1974 6 NR 1975 12 NR 1976 16 NR 1977 19 NR 1978 8 NR 1979 16 NR 1980 NA NA 1981-1982 10* NR
1983 0 14 NR – No Records NA – Not Available
1 Conflicting information exists regarding the year Abrams stopped using TCE. Some source documents indicate that Abrams stopped using TCE in 1980 when it began using TCA, while others indicate that solvent degreasers, including TCE and TCA, were used until 1989.
Remedial Investigation Report Miracle Mile WQARF Site Arizona Department of Environmental Quality
85 June 12, 2013
URS Job No. 24097013
*The source document lists 10 as the quantity for both TCE and TCA, but it also lists a separate quantity of 24 for the number of TCA drums used in 1982.
The facility was connected to the municipal sewer system from the beginning of its operation in 1965. A 1990 inspection report of the Abrams facility notes that no drains were visible near the vapor degreaser.
During a 1991 site inspection, Abrams personnel informed ADEQ that various companies recycled TCE waste for the company during the 1970s; however, Abrams did not maintain documentation indicating the amount of TCE waste that had been recycled.
Abrams contracted with a consulting firm in 1995 to conduct soil sampling beneath its plating room and near its wastewater treatment system. Chromium was detected in a soil sample (a composite of soil collected from surface to 1 foot bgs) at concentrations of up to 2,310 mg/kg.
On December 9, 1998, Abrams sent a notification of noncompliance to Pima County for exceeding the permitted daily maximum of 1.2 mg/L for chromium in its wastewater discharge. The discharge from the facility had a chromium concentration of 3.7 mg/L.
According to the 2000 Pima County Fact Sheet for Industrial Wastewater Discharge Permit No. 5E 10611, industrial wastes at Abrams were generated primarily from the welding, machining, painting, and plating operations performed during the sheet metal fabrication of various parts. Abrams was operating an industrial pretreatment system for wastewater that consisted of floatation, separation, solid settling, and pH adjustment prior to releasing it to the POTW. Prior to 1987, a clay tile line conveyed discharges from the plating room to the wastewater treatment sump. In approximately 1987, Abrams removed the clay tile line and replaced it with a polyvinyl chloride pipe. That same year, Abrams also replaced the sump tank and analyzed the concrete from the old tank for leachable metals. The analytical results of the concrete sample found concentrations below the Groundwater Protection Level of 590 mg/kg for chromium.
On November 17, 2011, Abrams submitted to ADEQ a notification of RCRA small quantity generator status for generating D001, D002, D007, D008, D035, F003, F005, F006, and F019 hazardous wastes (ADEQ, Personal Communication, Dee Woodard, 2012). F003 and F005 are listed hazardous wastes for spent solvents which could contain TCE.

Remedial Investigation Report Miracle Mile WQARF Site Arizona Department of Environmental Quality
86 June 12, 2013
URS Job No. 24097013
Desert Refrigeration and Auto Service, Inc. (Parcel 106-10-14D)
City directories indicate that Desert Auto has been operating at 3675 North Romero Road since approximately 1973. Real estate records show that the owners of Desert Auto purchased Parcel 106-10-014D in 1974. No evidence of Site COC use at the property has been located. Chromium was analyzed for, but not detected, in a soil sample collected from the facility on February 5, 1990. The soil sample was not analyzed for the COC TCE. Additional information related to the operations and waste streams of Desert Auto was not located.
City directories also show that Spring Joint operated at 3675 North Romero Road from 1971 to 1972, and then again in 1977. No information was found regarding the operations of Spring Joint at 3675 North Romero Road.
7.7 SUMMARY OF THE EXTENT OF CONTAMINATION
As discussed in Sections 6.1 and 6.2, the soil-gas, soil borings, and groundwater sample data, were used to evaluate the areal extent of soil and groundwater contamination throughout the Site. The most prevalent compound detected was TCE, which is present in the soil-gas samples collected from the vadose zone, the perched groundwater zone, and the regional aquifer. Although the presence of significant TCE concentrations was not found in the shallow vadose zone (less than 20 feet), the presence of TCE may be a result of poor waste handling practices, which could include surface spills or leaking tanks. Because of its density and low retardation factor, TCE ultimately moves downward in the vadose zone until reaching an impermeable barrier. In the Site, the impermeable barrier is the clay-rich layer, or aquitard, occurring at depths of 70 feet to 100 feet bgs (see Figure 29).
Five zones, or areas, of elevated TCE levels were identified from the passive and active soil-gas sampling in the vadose zone (see Figure 34). Available groundwater quality data from the perched groundwater IRA monitor wells correspond well with these zones.
Figure 38 presents the approximate extent of TCE in the regional aquifer, based on the December 2011 sampling results. TCE concentrations in the regional aquifer greater than the AWQS of 5 µg/L underlie an area of approximately 2,600 feet wide by 5,300 feet long.
Chromium concentrations in the regional aquifer as of December 2011 are shown in Figure 40 and indicate one area in which the concentrations exceed the AWQS (0.10 mg/L). That area is in the vicinity of well IRA-8, located near the center of the R.E. Darling property.

Remedial Investigation Report Miracle Mile WQARF Site Arizona Department of Environmental Quality
87 June 12, 2013
URS Job No. 24097013
Although TCE concentrations are increasing in the perched groundwater primarily in the area of wells IRA-16, IRA-17, and IRA-19, TCE concentrations remain fairly stable in the regional aquifer. The regional TCE plume appears to be slowly migrating to the north-northwest following the trend of regional groundwater flow. Based on analytical data from the IRA wells screened in the intermediate regional aquifer, the TCE plume is primarily contained in the shallow regional aquifer with minimal contaminate migration to the intermediate zone. However, further evaluation /investigation is required to adequately delineate the vertical extent of the plume.
On December 2001, May 2003, May 2004, and October 2005 ADEQ tested for nitrate in perched and regional wells and found exceedances of the AWQS in the Site perched, Site regional, and upgradient of the Site in the regional. Given that nitrate has been found above AWQS in the perched on R.E. Darling and Abrams, nitrate is considered a COPC.

Remedial Investigation Report Miracle Mile WQARF Site Arizona Department of Environmental Quality
88 June 12, 2013
URS Job No. 24097013
8.0 CONTAMINANT FATE AND TRANSPORT
This section discusses those processes that affect the fate and transport of TCE, chromium, PCE, Freon-11 and Freon-12 in groundwater beneath the Site. In general, potentially complex physical, geochemical, and biological processes control the movement and transformation of compounds in the subsurface. These processes are functions of site-specific environmental characteristics and geochemical properties, including soil and groundwater pH, oxidation-reduction potential, dissolved oxygen, major ion chemistry, soil-bulk density, hydraulic conductivity, soil stratigraphy, and microorganism populations and types. These characteristics can vary considerably within a small area, both vertically and laterally. However, for the purposes of this evaluation these characteristics are assumed to be an average value over a large area.
8.1 CHEMICAL CHARACTERIZATION OF TCE AND CHROMIUM
As discussed in Section 7.0, TCE and chromium are the two COCs present at the Site. TCE is a halogenated aliphatic VOC. The chemical structure of TCE consists of three chlorine atoms attached to a carbon-carbon double bond making TCE a highly oxidized compound. As a result, the chemical reactivity of TCE is greatest under a reducing environment that provides conditions favorable for transfer of electrons.
Chromium exists in oxidation states ranging from +6 to –2; however, the most prevalent forms in the environment are the trivalent and the hexavalent oxidation states. Trivalent chromium occurs naturally in the environment; hexavalent chromium typically comes from man-made (industrial) processes. Hexavalent chromium is a strong oxidant and is reduced in the presence of electron donors (e.g., ferrous iron minerals or organic matter in the soil). Hexavalent chromium is very soluble, mobile, and moves at a rate essentially the same as the groundwater. Hexavalent chromium is acutely toxic, mutagenic, and carcinogenic. In contrast, the reduced form of chromium, trivalent chromium, has relatively low toxicity and is immobile under alkaline to slightly alkaline conditions.
8.2 CHEMICAL CHARACTERIZATION OF PCE, FREON-11, AND FREON-12
Concentrations of PCE, Freon-11, and Freon-12 have been noted along the western border of the Site at levels higher than those observed in other portions of the Site. PCE is a halogenated aliphatic VOC. The chemical structure of PCE consists of four chlorine atoms attached to a carbon-carbon double bond, this results in a molecule with similar chemical properties to TCE discussed in Section 8.1. Freon-11, or trichlorofluoromethane, is a halogenated VOC. The chemical structure consists of one carbon atom bonded to three fluorine atoms and one chlorine atom. Freon-12, or dichlorodifluoromethane, is also a halogenated VOC with a chemical
Remedial Investigation Report Miracle Mile WQARF Site Arizona Department of Environmental Quality
89 June 12, 2013
URS Job No. 24097013
structure consisting of one carbon atom bonded to two fluorine atoms and two chlorine atoms. Both Freon-11 and 12 are primarily used as propellants and refrigerants.
8.3 TRANSPORT PROCESS/ ROUTES OF MIGRATION
The movement of VOCs and inorganic constituents in the subsurface is highly dependent on their mobility in groundwater. Several processes, such as advection, hydrodynamic dispersion, diffusion, sorption/desorption, dilution, and volatilization affect the site-specific mobility of these compounds.
In general, solutes are transported in groundwater by advection-dispersion and retained by such chemical or physical interactions within the saturated zone as sorption/desorption. The retardation factor is a measure of the effect of the sorption/desorption process on the rate at which some compounds move in groundwater.
Advection
Advective transport is the movement of the dissolved compound at an average solute velocity, which is directly proportional to the average groundwater flow velocity, and is inversely proportional to the retardation factor. Advection in homogeneous aquifers results in a uniform distribution of the contaminant plume. In non-homogeneous aquifer materials, preferential flow within layers of higher conductivity will occur, modifying the uniformity of contaminant distribution.
High capacity production wells, such as the FWID wells, will also influence advection. The pattern of the contaminant migration in the Site may be locally altered and/or accelerated by pumping from production wells within or near the Site.
Hydrodynamic Dispersion
Macroscopic hydrodynamic dispersion includes the effects of two processes: molecular and ionic diffusion and mechanical dispersion. Molecular diffusion is the movement of the dissolved compound through the aqueous phase as a result of a concentration gradient of that compound, but is generally not significant relative to advection and mechanical dispersion in an aquifer. Mechanical dispersion, which causes the three-dimensional spreading of compounds in the aquifer, is a linear function of the groundwater flow velocity and the aquifer dispersivity and will increase with increasing aquifer heterogeneity. Longitudinal dispersion, which occurs in the direction of flow, is usually much greater than transverse dispersion, which occurs in directions perpendicular to the flow.

Remedial Investigation Report Miracle Mile WQARF Site Arizona Department of Environmental Quality
90 June 12, 2013
URS Job No. 24097013
In areas with high hydraulic conductivities and resulting high groundwater flow velocities, advection is the dominant transport mechanism.
The contaminant plume’s geometry, which gradually widens as it moves away from the source areas, is primarily attributed to changes in groundwater flow direction.
Diffusion
Molecular diffusion is the lateral movement of solutes away from higher concentrations toward lower concentrations. The rate of diffusion is proportional to the concentration gradient, as described by Fick’s first law. The density of the contaminant affects its molecular diffusivity, hence the distribution of the contaminant within the plume is also effected. For a given system of two fluids in a homogeneous aquifer (groundwater and contaminant solution), the denser the solution, the deeper the solution will sink over a given distance. On a macroscopic scale, the solution of contaminants will behave as a unit, and will have the combined physiochemical properties of the dissolved contaminants.
Diffusion is not a significant transport mechanism at the Site because the advective velocities are likely at least six times greater than the molecular diffusivity. Diffusion typically only becomes a significant transport mechanism in stagnant water.
Sorption/Desorption
Sorption is the transfer of a solute from the aqueous phase to the solid phase (clay minerals and organic compounds); desorption is the transfer of a solute from the solid phase to the aqueous phase. Gradual sorption and desorption of solutes can cause overall increases or decreases in observed contaminant concentrations relative to the plume. Sorption does not permanently bind the solute, but acts to retard plume migration. Sorption is considered to be a chief mechanism of contaminant fate and transport for TCE, trivalent chromium and PCE in the Site. Due to the much higher aqueous solubility of hexavalent chromium, sorption plays a less important role in its fate and transport.
Dilution
Dilution is the process by which the groundwater from within the contaminant plume is mixed with contaminant-free groundwater. Contaminant-free groundwater will generally be introduced via recharge. Recharge in the Site is primarily through infiltration of storm water through the Santa Cruz River and Rillito Creek channels and artificial recharge via the Roger Road sewage treatment plant and irrigation. Because of the limited recharge, dilution is considered a minor mechanism of contaminant fate and transport at the Site.

Remedial Investigation Report Miracle Mile WQARF Site Arizona Department of Environmental Quality
91 June 12, 2013
URS Job No. 24097013
Volatilization
Volatilization is the partitioning of the solute from the water to the air. This is a process that primarily occurs in the pore spaces within the vadose zone immediately overlying the water table. Gradual volatilization and solution of solutes can cause overall increases or decreases in observed concentrations relative to the plume. With the exception of vinyl chloride, methylene chloride, and the chlorofluorocarbons, the physiochemical properties of chlorinated solvents give them low Henry’s Law constants, meaning they do not readily escape into the pore space. Therefore, volatilization of the dissolved phase contaminants from the Site is considered a minor mechanism of contaminant fate and transport at the Site.
8.4 CHEMICAL AND BIOLOGICAL TRANSFORMATION PROCESSES
Chemical and biological transformation processes can affect the fate and transport of compounds in the subsurface. Chemical processes include hydrolysis, oxidation, and reduction reactions. Hydrolysis is the direct reaction of dissolved compounds with the water molecules. Most oxidation and reduction reactions that occur in the environment are a result of microbial activity, although some oxidation and reduction reactions can occur in abiotic conditions. These three processes are not expected to have a significant effect on the chlorinated hydrocarbons found in the groundwater in the Site.
Biotransformation of VOCs can occur in the saturated zone under aerobic and anaerobic conditions and has been well documented in research literature over the last 20 years. The biotransformation of a contaminant is actually a series of microbially induced oxidation-reduction reactions, which require an electron acceptor (oxidizer) and an electron donor (reducer). In general, the highly chlorinated ethylenes (PCE and TCE) do not act as the electron donor or substrates due to their highly oxidized state. However, DCE and vinyl chloride (and theoretically methylene chloride) can act as the primary substrate and undergo oxidation.
The initial reduction product of the anaerobic transformation of PCE is TCE. Under some conditions, sequential reductive dehalogenation of TCE produces cis- and trans-1,2-DCE followed by vinyl chloride. Reductive dehalogenation of VOCs becomes more difficult for each successive step in the sequence from PCE to TCE to 1,2-DCE to vinyl chloride. For example, the reduction of PCE to TCE is much easier than the reduction of 1,2-DCE to vinyl chloride.
All of the above-referenced fate and transport mechanisms may be operating at the Site. The fate and transport mechanisms considered to play a primary role at the Site are:
Remedial Investigation Report Miracle Mile WQARF Site Arizona Department of Environmental Quality
92 June 12, 2013
URS Job No. 24097013
• Advection
• Biotransformation
• Dispersion
8.5 OBSERVED TCE AND CHROMIUM MIGRATION IN GROUNDWATER
The use of groundwater as a drinking water supply is the most significant route of potential exposure at the Site because of the presence of the contaminant plume in the regional aquifer. Therefore, a detailed evaluation of the distribution and temporal trends of chromium, TCE, cis-1,2-DCE (a breakdown product of TCE), in both the perched and regional groundwater is necessary to best understand the fate of these contaminants at the Site.
To assist with this evaluation of the fate of these constituents, log concentration versus time graphs of chromium, TCE, and cis-1,2-DCE in both the perched groundwater and regional aquifer groundwater monitor wells were prepared and overlaid on site maps. In addition, to better understand the impact(s) that production well operation has on the distribution and migration of the contaminants, hydrographs of four production wells (FWID-75, FWID-70, FWID-66 and FWID-72) have also been prepared and overlaid on a site map.
Contamination in the Perched Groundwater Zone
In general, mechanisms controlling the fate of contaminants in the perched groundwater include sorption and anaerobic biodegradation. The available data indicate that concentrations of contaminants in the perched groundwater tend to remain constant over time. This is consistent with the understanding that the groundwater in many of the perched zones is stagnant (i.e., is not moving). The soils that form the aquitard consist of silts and clays that tend to absorb the organic molecules and water, holding them in place. Additionally, the reducing conditions in the perched groundwater tend to favor the biodegradation of TCE to cis-1,2-DCE. At the Site, the biodegradation process of TCE appears to stop at cis-1,2-DCE; no vinyl chloride has been detected in the perched groundwater samples. A more reducing environment would promote the further dechlorination of cis-1,2-DCE to vinyl chloride. It has also been observed that some of the perched water contains 1,1-DCE concentrations above AWQS. Appendix N contains maps of the TCE plume over time in the perched groundwater.
The elevated concentrations of TCE, cis-1,2-DCE, 1,1-DCE in the perched groundwater are a potential source of contamination to the regional groundwater. Natural and artificial groundwater recharge could mobilize the contaminated perched groundwater, driving it down to the regional groundwater where it will be carried and dispersed in the regional flow direction.

Remedial Investigation Report Miracle Mile WQARF Site Arizona Department of Environmental Quality
93 June 12, 2013
URS Job No. 24097013
The hexavalent chromium data from the Spring Joint monitor wells suggest that the perched groundwater in the vicinity of the Spring Joint property is a potential source of chromium to the regional groundwater. Available groundwater data indicate that the perched groundwater IRA monitor wells, located to the northwest of Spring Joint, do not contain chromium at concentrations high enough to impact the regional groundwater. Appendix P contains maps of the chromium plume over time in the perched groundwater.
Contamination Variations in the Regional Groundwater
To better understand how the Site TCE and chromium plume migration may be locally altered and/or accelerated by pumping within and around the perimeter of the Site, hydrographs of production wells FWID-75, FWID-70, FWID-66, and FWID-72 were prepared and plotted on a site map (Figure 47). The graphs show monthly volumes of water pumped (in 1,000-gallons) over the time period January 1994 to December 2011. Groundwater level elevation maps are presented in Appendix D. Maps of the TCE plume over time are presented in Appendix Q and maps of the chromium plume over time are presented in Appendix R.
As can be seen from the plots, the contribution of flow from each well over the time period has changed considerably. From 1994 through the end of 1997 the majority of the water was drawn from well FWID-66 with much smaller seasonal contributions from wells FWID-70 and FWID-72. Well FWID-66 was shut down at the end of 1997 due to increased concentrations of TCE, and was officially taken out of service. (FWID-66 continues to be shut down per an ADEQ/FWID agreement.) Following the shutdown of well FWID-66, well FWID-70 was put into operation, and from early 1998 through the end of 2001 it was the major source of groundwater in this area, with very small contributions from well FWID-75. At the end of 2001, well FWID-72 was put into operation and the contributions from wells FWID-70 and FWID-75 became very minor. In early 2004, both wells FWID-70 and FWID-75 were brought back on line and, throughout 2005, these two wells were significant contributors of water supply for FWID. Near the end of 2005, wells FWID-70 and FWID-75 were shut down due to the lowering of the MCL for arsenic from 0.05 mg/L to 0.01 mg/L. Arsenic and VOC treatment systems for these two wells were constructed during 2006, and wells FWID-70 and FWID-75 were brought back online in late 2006/early 2007. The VOC part of the treatment system was paid for by ADEQ as an ERA (Section 5.3).
This variation in operation of the FWID production wells most likely greatly impacts regional flow direction, and consequently, impacts how the contaminant plumes in the regional groundwater behave. Figure 48, Figure 49, and Figure 50 present the log concentration versus time graphs of chromium, TCE and cis-1,2-DCE, respectively, for the majority of the regional groundwater monitor wells. During the time that well FWID-66 is the major FWID contributor

Remedial Investigation Report Miracle Mile WQARF Site Arizona Department of Environmental Quality
94 June 12, 2013
URS Job No. 24097013
of water (1994 through 1997), concentrations of TCE in monitor well IRA-2 and the Douglas well are increasing. When FWID switched to using FWID-70 (1998 through 2001), TCE concentrations in the Douglas well leveled off, but TCE concentrations in well IRA-2, and then in well IRA-9, began to increase. Monitor wells IRA-2 and IRA-9 lie directly between well FWID-70 and the Fairfax well, which is a suspected source of TCE contamination to the regional aquifer. TCE (Figure 49) and chromium (Figure 48) concentrations reach their peak levels in well IRA-2 in June 2001, and in well IRA-9 in September 2002 near the end of the time period (2001 to 2002) that well FWID-70 was the major contributor of water.
With the cessation of pumping of wells FWID-70 and FWID-75 in early 2002, the direction of groundwater flow returned to the north-northwest direction, which is consistent with the regional flow regime. With the FWID production wells nearest to the Site turned off, the chromium and TCE concentrations in wells IRA-2 and IRA-9 began to decrease (Figure 48 and Figure 49), along with those in wells IRA-13-210 and IRA-26, now in a position upgradient of wells IRA-2 and IRA-9. Concurrent and subsequent to the cessation of pumping of well FWID-70, wells IRA-11-210 and IRA-25, which are downgradient of IRA-2 and IRA-9, began to show increased concentrations of chromium and TCE. The groundwater quality data indicate that the chromium and TCE plumes have shifted from a northerly direction caused by the pumping of first well FWID-66 and then well FWID-70, to a north-northwest direction of the regional flow once the production wells were shut down.
Since wells FWID-70 and FWID-75 began operating again in early 2004, only minor changes to concentrations of TCE and chromium in most regional IRA wells have been observed. A slight increase in both TCE and chromium concentrations is apparent in well IRA-25; as well as a continued decrease in both TCE and chromium concentrations in wells IRA-26 and IRA-13-210.
Concentrations of cis-1,2-DCE in the regional monitor wells (Figure 50) are all below the AWQS and the trends of cis-1,2-DCE parallel those of TCE. Cis-1,2-DCE is no longer detected above the RL in wells IRA-2, IRA-9, IRA-13-210, and IRA-26.
Conclusions
In conclusion, concentrations of TCE and hexavalent chromium observed in the perched groundwater monitor wells have tended to remain constant over time, and in general, the perched groundwater is considered the source for these contaminants to the regional aquifer. During times of high groundwater recharge (both natural and artificial) these contaminants may have been, and in the future may be, mobilized and transported to the regional aquifer. Once transported to the regional aquifer, the contaminants are carried with the regional groundwater flow. This phenomenon has been observed in the regional aquifer for both TCE and chromium.

Remedial Investigation Report Miracle Mile WQARF Site Arizona Department of Environmental Quality
95 June 12, 2013
URS Job No. 24097013
In contrast to the TCE concentrations within the site, PCE is only rarely detected in the perched groundwater. Its distribution in the regional aquifer is limited to the western portion of the site and is generally found in those wells that also show Freon detections. The Freon detections are also limited within the perched groundwater. Since the current site model indicates Miracle Mile COCs are transported to the regional aquifer from the perched groundwater, the limited concentrations of Freon and PCE in the perched (Section 7.5.1) and the occurrence in the regional aquifer only on the western portion of the site (Section 7.5.2, Figure 42) indicate that the PCE and Freon are both likely contributed from an upgradient source rather than the onsite potential source areas.

Remedial Investigation Report Miracle Mile WQARF Site Arizona Department of Environmental Quality
96 June 12, 2013
URS Job No. 24097013
9.0 RISK EVALUATION
Environmental concerns at the Site are based on releases of VOCs and chromium to the groundwater. The following assessment incorporates the results from the vadose zone and groundwater investigations obtained during the RI and previous hydrogeologic investigations. The assessment focuses on the potential exposure to humans from the consumption of contaminated groundwater, dermal contact, and inhalation. It also focuses on present and future groundwater uses.
9.1 1993 RISK ASSESSMENT FOR MIRACLE MILE WQARF SITE
In 1993, the Arizona Department of Health Services (ADHS) prepared a risk assessment of the Site for ADEQ (ADHS, 1993). The purpose of the 1993 risk assessment was to determine the extent and likelihood of adverse effects to human health that might result from exposure to chemical contamination from releases of potentially toxic substances. The document was prepared using groundwater analytical data collected from 1988 to 1993 by Tucson Water and Kleinfelder, under contract to ADHS. The study area covered by the risk assessment was comprised of four areas with known contamination including: Silverbell Road at the Police Academy, La Cholla Boulevard and Fort Lowell Road, Romero Road and Fort Lowell Road, and the 3700 block of North Romero Road.
The ADHS risk assessment evaluated 30 contaminants of concern for the study including TCE, PCE, MTBE, 1,1-DCE, and 1,2-DCE. Primary exposure routes evaluated include inhalation, ingestion, and dermal contact with groundwater. The risk estimates used by the ADHS assumed residential use of the water for 30 years. The study concluded that even the most sensitive members of the population are unlikely to experience acute adverse health effects as a result of consumption of water from the private wells and that the municipal supply wells in the area have not been impacted by concentrations of contaminants of public health concern.
9.2 ROUTES OF EXPOSURE
The route of exposure is the pathway by which a chemical enters the body. There are three principal routes of exposure: penetration through the skin (dermal absorption), absorption through the lungs (inhalation), and absorption from the digestive tract (ingestion). Exposure to contaminants in drinking water supplies can occur via ingestion and/or dermal contact and inhalation from water uses such as showering, bathing, or other household uses.
Exposure routes considered for the Site are: (1) ingestion of groundwater, (2) inhalation of vapors from groundwater during water use in the home, and (3) dermal contact with groundwater while showering. Inhalation of particulates and/or vapors emitted from the vadose zone was not

Remedial Investigation Report Miracle Mile WQARF Site Arizona Department of Environmental Quality
97 June 12, 2013
URS Job No. 24097013
evaluated based on the low levels of VOCs detected in the soil samples and soil-gas samples. The low levels of VOCs in the upper vadose zone do not present an unacceptable health risk to onsite workers through inhalation because the concentration of VOCs in near surface soils is very low.
Trivalent and metallic chromium are generally not considered to be health hazards. Hexavalent chromium has the potential to cause damage to the liver, kidney, circulatory system and nerve tissues and is a known carcinogen by inhalation (EPA, 1998a). As of the writing of the Toxicological Review published by the EPA in 1998, there was insufficient data available to determine whether it is a carcinogen by ingestion (EPA, 1998a).
9.3 POTENTIAL RECEPTORS
Groundwater from FWID supply wells and private wells in the regional aquifer is the primary source of drinking water for many residents in the vicinity of the Site. FWID has approximately 3,500 active service connections, which includes residences and industry (Personal communication, Flowing Wells Irrigation District, 2012b). Water supplied by FWID is not used for agricultural irrigation (FWID, 2003). Dames & Moore (2000a) conducted a well inventory of the area surrounding the Site in 1999. The methodology for the well inventory consisted of:
• Compilation of existing well records for wells located within the area
• Fieldwork to verify registered well locations and to locate the nearest upgradient and downgradient active private well to each landfill
• Data management using hard copies and an electronic database of the well location, ownership, construction, accessibility, and well use information
(ADWR also conducted a well inventory of the Site in 2001 for the purpose of identifying wells that could be acting as pathways for vertical cross-contamination.)
The Dames & Moore search identified 15 FWID wells, eight City of Tucson monitor wells, one City of Tucson water supply well, two Arizona Department of Transportation monitor wells, five University of Arizona monitor wells, and two private water supply wells. In addition, a Tucson Plant Material Center well was located south of the Site, but used for irrigation purposes only.
The nearest private wells identified in the well inventory are the Douglas and Villa Capri Mobile Home Park wells, shown on Figure 3. The Douglas well is generally inactive, and is used for irrigation purposes only. Due to a severed electrical connection, it did not operate from 1997 until it was rehabilitated by ADEQ in August 1999. Presently this well is inactive because of a broken pump. It is exempt from ADWR reporting requirements because the pump capacity is

Remedial Investigation Report Miracle Mile WQARF Site Arizona Department of Environmental Quality
98 June 12, 2013
URS Job No. 24097013
less than 35 gpm. The Villa Capri Mobile Home Park well is used for potable and irrigation purposes by residents of the mobile home park. Both wells are screened in the regional aquifer.
9.4 GROUNDWATER QUALITY DATA
The Douglas well has been sampled since 1990. The most prevalent compound detected in the Douglas well is TCE, which was first detected in February 1996. The maximum concentration occurred in October 1997 at 3.6 µg/L. From May 2000 through November 2008, TCE has ranged from 1.6 µg/L to 2.8 µg/L. Concentrations of 1,1-DCE in the Douglas well have ranged from 0.4 µg/L to 6.2 µg/L, but have been below 3.3 µg/L since January 2000. PCE was first detected in the well in January 1997 and has ranged between 0.7 µg/L and 1.9 µg/L since then. Cis-1,2-DCE, Freon-11, or Freon-12 have not been detected in the Douglas well above the RL. The highest concentration of chromium detected in the Douglas well was 0.02 mg/L in March 2004. Due to access restrictions, the Douglas well has not been sampled since November 2008.
The Villa Capri well has been sampled since 2010 when ADEQ first requested the well be sampled as part of the monitoring well network for the Site. There have been no detections of any VOCs or chromium during the sampling events in 2010 and 2011. Barium was the only RCRA metal detected, but levels were below the AWQS.
ADEQ began sampling the FWID water supply wells in 1990. Water samples collected from FWID-66 in October and November 1997 contained TCE in concentrations of 4.9 μg/L and 4.7 µg/L, respectively, which are near but not exceeding the AWQS of 5 μg/l. FWID promptly closed this well. TCE concentrations in well FWID-66 have been below 1.1 µg/L since December 1997; however, this well was not sampled during the groundwater sampling event for the Site in 2010 or 2011. TCE was detected at 7.56 µg/L and 1.00 µg/L in FWID-70 in 2010 and 2011, respectively. TCE was not detected in FWID-75 in either 2010 or 2011. FWID-72 was non-detect for TCE in 2010 but, was not sampled in 2011. Chromium has also been consistently below the laboratory reporting limit (0.01 mg/L) in the FWID-75 and FWID-66 during the respective sampling events. FWID-70 has had detections of chromium in 2004, 2007, 2008, and 2010, with the highest concentration of 0.019 mg/L during the November 2008 sampling event. A summary of all analytical data from the sampling events for each well is presented in Appendix L.
9.5 APPLICABLE REGULATIONS
The Federal Safe Drinking Water Act, as amended, protects the quality of drinking water by regulating the public drinking water systems and by protecting the sources of drinking water. Two sets of standards are contained in the National Primary Drinking Water Standards that are applicable to this site: MCLs and Maximum Contaminant Level Goals (MCLGs). Primary MCLs

Remedial Investigation Report Miracle Mile WQARF Site Arizona Department of Environmental Quality
99 June 12, 2013
URS Job No. 24097013
are established, legally enforceable standards for specific contaminants in the drinking water or potential drinking water sources; secondary MCLs are non-enforceable guidelines based on aesthetic properties (taste, odor, clarity). MCLGs, the second set of standards, are health-based goals set at levels at which there is no known or expected risk to health. MCLGs allow for a margin of safety and are non-enforceable public health goals.
In addition, EPA Region IX has Regional Screening Levels (RSLs) for contaminants that do not yet have an MCL. RSLs are risk-based and non-enforceable, and EPA has calculated RSLs for ingestion, dermal contact, and inhalation.
In addition to federal drinking water standards, Arizona has established AWQSs for specific inorganic and organic chemicals that apply to all aquifers classified for drinking water use. The numeric AWQSs for the Site COCs and COPCs are equivalent to the Federal MCLs and are listed in A.C.C. § R18-11-406. The AWQSs are the regulatory standards which are used by ADEQ at WQARF Sites.
9.6 RISK EVAUATION SUMMARY
This section provides a summary of the risk factors discussed in the previous sections. The table below provides a summary of the applicable soil and potable water standards for the constituents discussed in this section:

Remedial Investigation Report Miracle Mile WQARF Site Arizona Department of Environmental Quality
100 June 12, 2013
URS Job No. 24097013
Constituent
Soil Remediation Levels (SRLs) Drinking Water
Standards Residential (mg/kg) Non-
residential (mg/kg)
MCL (mg/L)
AWQS (mg/L)
Carcinogen Non-carcinogen 10-6 Risk 10-5 Risk
TCE 3 30 17 65 0.005 0.005 PCE 0.51 5.1 13 0.005 0.005
Trivalent Chromium 120,000 1,000,000 0.1* 0.1*
Hexavalent Chromium 30 NA 65 0.1* 0.1* Freon-11 390 1,300 NE NE Freon-12 94 310 NE NE 1,1-DCE 120 410 0.007 0.007
Cis-1,2-DCE 43 150 0.07 0.07 MTBE 32 320 710 NE NE
* Total Chromium test—however, EPA’s present MCL of 0.1 for chromium assumes that all of the chromium present in the sample is hexavalent chromium (EPA, 2012).
Notes: SRLs reflect most recent ADEQ revisions in 2007 mg/kg = milligrams per kilogram; mg/L = milligrams per liter; MCL = Maximum Concentration Level; AWQS = Aquifer Water Quality Standard; NE = Not Established; NA = Not Applicable; PCE = Tetrachloroethylene; TCE = Trichloroethylene; DCE = Dichloroethylene; MTBE = Methyl tert-butyl ether
The residential and non-residential SRLs are defined in A.C.C. Title 18, Chapter 7, Article 2; MCL is the Maximum Contaminant Level for drinking water as defined by U.S. Environmental Protection Agency (EPA, 2006); and AWQS is the Aquifer Water Quality Standard for drinking water as defined in A.C.C. Title 18, Chapter 11, Article 4.
9.6.1 Perched Groundwater
Perched groundwater within the Site is not used for any purposes, including drinking water, domestic uses, irrigation or industrial uses. Therefore, the probability of exposure through ingestion or inhalation of VOCs from the perched groundwater is very low.
9.6.2 Regional Groundwater
The COCs in the regional aquifer are TCE and chromium. Detections of 1,1-DCE; cis-1,2-DCE; and MTBE in the IRA monitor wells and FWID wells have typically been below the AWQS. Two IRA wells at the western and southwestern edge of the Site have contained PCE above the AWQS; however, given that PCE has been below the AWQS in the remaining wells and in the perched groundwater wells, PCE is not a COC at this Site. Freon-11 and Freon-12 have been detected in the regional groundwater; however, no AWQS has been established for either chemical.

Remedial Investigation Report Miracle Mile WQARF Site Arizona Department of Environmental Quality
101 June 12, 2013
URS Job No. 24097013
9.6.3 Potential Adverse Health Effects
TCE
According to EPA, TCE has the potential to cause liver damage from a lifetime exposure at levels above the MCL and may produce an increased risk of developing cancer (EPA, 2006). Acute exposure of TCE at levels above the MCL can potentially cause vomiting and abdominal pain (EPA, 2006).
PCE
According to EPA, PCE has the potential to cause liver and/or kidney damage from a lifetime exposure at levels above the MCL and may produce an increased risk of developing cancer (EPA, 2006).
Chromium
According to EPA, chromium has the potential to cause liver, kidney, circulatory, and/or nerve tissue damage from a lifetime exposure at levels above the MCL and may produce skin irritation (EPA, 2006). Acute exposure of chromium at levels above the MCL can potentially cause skin irritation or ulcerations (EPA, 2006).
9.6.4 Risk for Potential Adverse Health Effects
Based on the water quality data collected from the numerous known private wells and public supply wells in the Site since 1990, there is no evidence to indicate that levels of PCE, TCE, or chromium in the domestic supply wells currently in use were ever high enough to cause adverse health effects or cancer. Based on recent water quality data and the FWID ERA, there is also no current exposure above regulatory standards to PCE, TCE or chromium in the private or public drinking water wells.
9.7 PRESENT AND FUTURE GROUNDWATER USES
Current and reasonably foreseeable groundwater uses consist of residential, commercial, irrigation, and light industrial uses. Based on discussions with both the City of Tucson and Pima County, the area is not expected to have significant use changes in the foreseeable future. There are 15 water supply wells located within the Site. Of these 15 wells, nine are privately owned wells, five are FWID wells, and one is owned by Pima County Wastewater Management Department. These wells are expected to continue to be used either as wells to serve potable water or to serve as irrigation purposes. Present and future groundwater uses are evaluated in detail in the Land and Water Use Study Report which is included as Appendix B to this Report.
Remedial Investigation Report Miracle Mile WQARF Site Arizona Department of Environmental Quality
1 June 12, 2013
URS Job No. 24097013
10.0 SUMMARY OF FINDINGS AND RECOMMENDATIONS
10.1 CONCEPTUAL SITE MODEL
Analytical results of water quality samples collected from monitor wells, water supply wells, and private wells indicate that the regional aquifer beneath the Site currently contains concentrations of TCE and chromium that exceed their respective AWQS. However, there is currently no known exposure to these COCs above the AWQS or MCL. Two other VOCs (1,1-DCE and cis-1,2-DCE) are present in the regional aquifer at the Site but at concentrations below their respective AWQSs, and hence, are not considered to be a potential risk to human health. PCE is also detected within the site in the regional groundwater. However its presence in the perched groundwater is limited, and therefore it is considered a COPC with a likely upgradient, offsite source. In addition, TCE; 1,1-DCE; and chromium exist in the perched groundwater and vadose zone beneath the site.
Analytical results of soil samples collected from the area indicate no areas of known TCE concentrations above the SRLs. However, chromium concentrations at the former Spring Joint property indicate hexavalent chromium concentrations exceeding the SRLs.
RI activities have included conducting an ERA in June 2002, which consisted of the re-abandonment of the Fairfax well, a private water supply well, which may have been constructed without the use of annular materials. It was hypothesized that this well was acting as a conduit for the vertical migration of perched groundwater to the regional aquifer. Another ERA was completed for FWID in 2006 that provided a GAC treatment system to remove VOCs from two FWID wells.
Field investigations conducted to investigate and identify potential source areas of COCs included passive and active soil-gas and soil sampling. Passive soil-gas survey results defined five separate areas within the Site that contained higher detectable TCE. One area is located along the northern boundary of the Friedman Recycling property. The other four areas extend from the northern portion of the Public Storage property south to the southern and southeastern end of the R.E. Darling property and the northeastern corner of the Abrams property. TCE concentrations in the perched groundwater zone appear to correlate well with the soil-gas results in the area of the R.E. Darling property.
The elevated concentrations of TCE, cis-1,2-DCE and 1,1-DCE in the perched groundwater and vadose zone are a potential source of contamination to the regional groundwater. Natural and artificial groundwater recharge could mobilize the contaminated perched groundwater, driving it
Remedial Investigation Report Miracle Mile WQARF Site Arizona Department of Environmental Quality
2 June 12, 2013
URS Job No. 24097013
down to the regional groundwater where it will be carried and dispersed in the regional flow direction.
Chromium concentrations in the regional aquifer, as of December 2011, indicate one IRA monitor well in the Site (IRA-8) contained chromium above the AWQS of 0.10 mg/L. IRA-8 is located near the center of the R.E. Darling property (Figure 3). Perched groundwater wells located on the Spring Joint facility have consistently shown levels of chromium 2-3 orders of magnitude above the AWQS. Therefore, the perched zone in the area of the Spring Joint facility continues to be a potential source of chromium to the regional aquifer.
PCE in the regional aquifer has shown increasing levels along the western perimeter of the Site (Figure 43). Freons are also confined to the western perimeter of the Site. The analytical results from IRA-1 and IRA-5 show proportions of Freon and PCE not found in the onsite perched groundwater. Therefore, further evaluation is needed to identify potential upgradient sources for PCE.
The migration of COCs in the regional aquifer beneath the site is governed primarily by advection and dispersion and to a lesser extent sorption. Data obtained and evaluated during the RI indicate that the TCE and chromium plumes will likely continue to migrate on a north-northwesterly trend until the contamination is intercepted by wells or is degraded.
The risk evaluation included in this RI assessed the human health risks posed by the ingestion of groundwater contaminated with TCE, PCE and chromium. Because TCE, PCE, and chromium have not been detected in the FWID public supply wells or the private domestic wells (Douglas and Crescent Manor) at concentrations above the MCL, the risk evaluation concluded that consumption of water from these wells poses no past or current risk to human health from these constituents.
Based on ADEQ's evaluation of (1) the perched groundwater and regional aquifer water quality and well water elevation data, (2) the soil and soil-gas data, (3) the history of the Fairfax well, and (4) the information from the HGL facility background report related to the facilities located in the vicinity of Romero Road between Prince and Roger Roads, ADEQ has determined the following regarding likely source areas within the Miracle Mile WQARF Site:
Chromium: The soil and perched groundwater sampling results indicate that the chromium contamination in the regional aquifer is likely sourced primarily at or near the 3660 N. Romero Road Parcel.
Remedial Investigation Report Miracle Mile WQARF Site Arizona Department of Environmental Quality
3 June 12, 2013
URS Job No. 24097013
TCE: Perched groundwater and passive and active soil gas sampling results indicate that the TCE contamination in the regional aquifer is likely sourced at or near parcels near Romero Road between Prince and Roger Roads, including the 3660 N. Romero Road, 3749-3761 N. Romero Road, and 3735 N. Romero Road parcels.
10.2 DATA GAPS
Based on the data obtained from the RI and previous investigations, the following potential data gaps have been identified and may be addressed as part of the ongoing FS and remedial design:
1. Adequately define the northern and western plume boundaries of the regional aquifer.
2. Evaluate whether perched groundwater monitor wells should be installed at the previous soil-gas investigation hot spots at the Friedman Recycling and Public Storage properties.
3. Further define the nature and extent of the perched groundwater/
4. Evaluate whether a vertical delineation well is needed near IRA-14.
5. The full extent of hexavalent chromium contamination in the soil and total/hexavalent chromium in the perched groundwater in the vicinity of the Spring Joint property is not defined. Additional soil borings, soil sampling and installation of perched groundwater monitor wells is recommended in areas to the north, south and east of the perched groundwater monitor wells SJ-MW-1 and SJ-MW-2 to better define extent of the chromium contamination in this area.
6. Additional sampling and investigations are necessary to determine the exact source and extent of the nitrate in the perched groundwater.
7. Evaluate the FWID ERA for potential to treat hexavalent chromium.
8. Evaluate the need for additional monitor wells to assess potential PCE (which is a COPC) impacts from upgradient sources.

Remedial Investigation Report Miracle Mile WQARF Site Arizona Department of Environmental Quality
4 June 12, 2013
URS Job No. 24097013
REFERENCES
Abrams Airborne Manufacturing, Inc., 2004. Abrams’ Plating Shop Testing Analytical Results, September 10. [Note—Results from sampling performed in July and August 1995.]
Air Toxics LTD, 2005. Unit Calculator. Retrieved January 26, 2012 from http://www.airtoxics.com/cclasses/unitcalc.html.
Anderson, S.R. 1987. Cenozoic stratigraphy and geologic history of the Tucson Basin, Pima County, Arizona: U.S. Geological Survey Water Resources Investigations Report 87-4190, prepared in cooperation with the City of Tucson, Arizona.
Arizona Department of Environmental Quality (ADEQ). 1990a. Preliminary Assessment Spring Joint Specialist Company, June 6.
_____. 1990b. Preliminary Assessment Abrams Airborne Manufacturing, Inc. August 21.
_____. 1996. A Screening Method to Determine Soil Concentrations Protective of Groundwater Quality.
_____. 2004. Expanded Site Inspection Sampling and Analysis Plan, Abrams Airborne Manufacturing Inc. Site. May
_____. 2008a. Soil Vapor Sampling Guidance. July 10.
_____. 2008b. Spreadsheet GPL-Minimum GPLs. November 1.
_____. 2009. Arizona Administrative Code, Department of Environmental Quality-Remedial Action, Title 18, Chapter 7, Article 2. March 31. [Note—March 31, 2009 is the publication date listed on the PDF of this document on ADEQ’s website; however, this rule became effective on May 5, 2007.]
_____. 2012. Personal Communication with Dee Woodard. Hazardous Waste Notifications Coordinator, Waste Programs/Planning & Outreach Programs/GIS & IT Unit. May 11, 2012.
Arizona Department of Health Services, 1993. Draft Risk Assessment for the Miracle Mile Interchange Area. November.

Remedial Investigation Report Miracle Mile WQARF Site Arizona Department of Environmental Quality
5 June 12, 2013
URS Job No. 24097013
Arizona Department of Water Resources (ADWR). 1992. Irrigated Facilities and Water Use Data for 1985-1990 in the Vicinity of the Miracle Mile Interchange, Tucson Active Management Area, Tucson, Arizona.
_____. 1995. Well Abandonment Completion Report.
_____. 2001. Conduit Well Analysis Pilot Project – Phase I, Miracle Mile/Silverbell Landfill WQARF Sites, Tucson, Arizona. Vol. 1, June 13.
Arizona Superfund Response Action Contract, 2000. Scope of Work (WBS 1.1.3, RI Report), Version C. August 10.
Azar-Schuster, L., 1991. Site Inspection, Abrams Airborne Manufacturing, Inc. October 11.
Brown and Caldwell. 2004. Hexavalent Chromium Wipe Sampling Results. February 24.
CH2M Hill, Inc., Errol L. Montgomery & Associates, Inc., L.G. Wilson, 1987. Tucson Recharge Feasibility Assessment, Phase A. Prepared for Tucson Water Planning Division, Hydrology Section Report.
City of Tucson Planning and Development Services, 2003. Official Website, http://www.tucsonaz.gov/planning.html.
Dames & Moore, 2000a. Water Supply Study Report, Miracle Mile WQARF Site Interim Remedial Action, September.
_____. 2000b. Final Report on Aquifer Testing and Water Quality Sampling of FWID-72.
_____. 2000c. Summary of Existing Data, Miracle Mile WQARF Site Remedial Investigation/Feasibility Study. January.
Davidson, E.S., 1973. Geohydrology and Water Resources of the Tucson Basin, Arizona. U.S. Geological Survey Water Supply Paper 1939-E.
DeConcini, McDonald, Yetwin & Lacy. 1998. Request by Flowing Wells Irrigation District That the Department of Environmental Quality Take Interim Remedial Action.
Environmental Engineering Consultants. 1989. Field Investigation for Soil Contamination at Abrams Airborne Manufacturing, Inc.: Prepared for Abrams Airborne Manufacturing, February.

Remedial Investigation Report Miracle Mile WQARF Site Arizona Department of Environmental Quality
6 June 12, 2013
URS Job No. 24097013
Flowing Wells Irrigation District (FWID). 2003. Personal Communication with Cheryl Roberts (Controller). June 23.
_____. 2012a. Personal Communication with Dave Crocket (Superintendent). April 25.
_____. 2012b. Personal Communication with Cheryl Roberts (Controller). May 24.
Growth Environmental Services, Inc. 1995. Letter report, Fairfax Well Abandonment, Miracle Mile WQARF Area: Prepared for the Arizona Department of Environmental Quality, October.
_____. 1996. Monitor Well Installation and Development, Miracle Mile Interchange WQARF Study Area, R.E. Darling Industries, Miracle Mile 220000/00: Prepared for Arizona Department of Environmental Quality, September.
HydroGeoLogic, Inc (HGL). 2012. Draft Final Letter Report – Remedial Investigation Miracle Mile WQARF Registry Site. February.
Karichoff, S.W., D.S. Brown, and T.A. Scott. 1979. Sorption of Hydrophobic Pollutants on Natural Sediments. Water Resources Research 13, no. 3:241-248.
Kleinfelder, Inc. 1989. Phase I Report, Task Assignment K-1, Miracle Mile Interchange area, Tucson, Arizona: prepared by Kleinfelder, Inc. for the Arizona Department of Environmental Quality.
_____. 1992. Technical Memorandum, Task Assignment K-1, Phase II, Miracle Mile Interchange Area, Tucson, Arizona: prepared by Kleinfelder, Inc. for the Arizona Department of Environmental Quality, March.
Lacher, L.J., 1996. Recharge Characteristics Of An Effluent Dominated Stream Near Tucson, Arizona. Ph.D. dissertation, University of Arizona.
Matheson Tri-Gas, INC., 2008. Material Safety Data Sheet: Fluorotrichloromethane. Retrieved on January 26, 2012 from http://www.mathesongas.com/pdfs/msds/MAT09990.pdf.
Miller, D.J., 1990. Site Inspection R.E. Darling, Co. Inc. Prepared for ADEQ, August.
Oppenheimer, J.M., and Sumner, J.S., 1980. Gravity Modeling of the Basins in the Basin and Range Province, Arizona: Arizona Geological Society Digest, v.13, p. 111-115.

Remedial Investigation Report Miracle Mile WQARF Site Arizona Department of Environmental Quality
7 June 12, 2013
URS Job No. 24097013
PRC Environmental Management, Inc., 1992. Groundwater Sampling and Water Level Survey for the Miracle Mile Interchange Area, Quarterly Summary Report; July.
SCS Engineers. 1995. Installation and Development Letter Report, Monitor Wells IRA-6 and IRA-7, Miracle Mile WQARF Area, Prince and Romero Roads, Tucson, Arizona: prepared by SCS Engineers for the Arizona Department of Environmental Quality, April.
U.S. Environmental Protection Agency (EPA). 1988. Guidelines for Conducting Remedial Investigations and Feasibility Studies under the Comprehensive Environmental Response, Compensation, and Liability Act.
_____. 1998a. Toxicological Review of Hexavalent Chromium (CAS No. 18540-29-9). August.
_____. 1998b. W.L. Gore Soil Gas Sampler, Innovative Technical Evaluation Report EPA/600/R-98/095; August.
_____. 2006. Official website, Ground Water and Drinking Water. http://www.epa.gov/safewater/contaminants/index.html.
_____. 2012. Official website, Chromium in Drinking Water. http://water.epa.gov/drink/info/chromium/index.cfm.
URS. 2001a. Phase I Monitor Well Installation Report, Miracle Mile WQARF Site Remedial Investigation Feasibility Study.
_____. 2001b. Final Phase 1 and 2 Soil Gas Survey Report, Miracle Mile WQARF Site, Tucson, Arizona. August 31.
_____. 2002a. Final Phase 3 Soil Gas Survey Report, Miracle Mile WQARF Site. December 9.
_____. 2002b. Historical Research for Miracle Mile WQARF Site Remedial Investigation/Feasibility Study. January 14.
_____. 2003a. Monitor Well Installation Report, IRA-17 through IRA-23, IRA-25 and IRA-26, Miracle Mile WQARF Site Remedial Investigation Feasibility Study, September 16.
_____. 2003b. Vertical Profiling – Soil Boring Installation Report, Remedial Investigation/ Feasibility Study-Miracle Mile WQARF Site. May 30.
_____. 2005a. Abrams Airborne Soil Borings and Well Installation Report, Expanded Site Investigation, Miracle Mile WQARF Remedial Investigation, April 11.
Remedial Investigation Report Miracle Mile WQARF Site Arizona Department of Environmental Quality
8 June 12, 2013
URS Job No. 24097013
_____. 2005b. Monitor Well Installation Report IRA-24, Miracle Mile WQARF Site Remedial Investigation/Extended Sampling Investigation, May 18.
_____. 2005c. Spring Joint Facility Borings and Well Installation Report, Miracle Mile WQARF Site Remedial Investigation, June 11.
_____. 2005d. Fairfax Well Re-Abandonment Report, Miracle Mile WQARF Site Interim Remedial Action, September 9.
_____. 2010. Final Summary Report Sewer Video Inspection R.E. Darling Facility, Miracle Mile WQARF site, Prepared for Arizona Department of Environmental Quality, October 27.
_____. 2013. Monitor Well Installation Report IRA-32, IRA-33, IRA-34, IRA-35, IRA-36, and IRA-37, Miracle Mile WQARF Site Remedial Investigation/Feasibility Study, March 25.
Watts, R.J. 1997. Hazardous Wastes: Sources, Pathways, Receptors. John Wiley & Sons, Inc.
Western Regional Climate Center (WRCC), 2011. Historical Climate Information. Accessed October 27, 2011. http://www.wrcc.dri.edu/CLIMATEDATA.html.
Western Technologies Inc., 1998. Monitoring Well Installation and Groundwater Sampling in the Miracle Mile Interchange WQARF Site Study Area, Tucson, Arizona: Prepared by Western Technologies, Inc. for the Arizona Department of Environmental Quality, April.
_____. 2002. Phase I Environmental Site Assessment Commercial Property 3660 North Romero Road Tucson, Arizona: Prepared by Western Technologies, Inc. for the Spring Joint Specialists, Inc.
_____. 2003. Summary of Tasks Accomplished May 1-5, 2003, Commercial Property at 3660 North Romero Road in Tucson, Arizona. Prepared by Western Technologies, Inc. for the Spring Joint Specialists, Inc., May 5.
_____. 2004. Limited Site Characterization and Monitor Well Installation, Spring Joint Specialists, Inc., 3660 North Romero Road, Tucson, Arizona: Prepared by Western Technologies, Inc. for the Spring Joint Specialists, Inc.