minority group representation in the united states and in the soviet union:a snapshot in time
TRANSCRIPT

MINORITY GROUP REPRESENTATION IN THE UNITED STATES AND IN THE SOVIET UNION:
A SNAPSHOT IN TIME
James Peterson
INTRODUCTION
Elections held in both t h e United States and the Soviet Union in 1984 offer a unique opportunity to compare the two political systems with regard to one dimension of representation. That dimension involves the willingness on the part of the respective party elites to see that important minority groups win a fair share of the positions available in a given election.
One spotlight in this study will shine on Jesse Jackson's effort to win an equitable share of the convention delegates chosen in the 1984 Democratic primaries. In various primary states, how close was the fit between his proportion of the popular vote and his percentage of convention delegates? A second spotlight will illuminate a corner of the minority group universe that is more remote from the concerns of most Americans. The six Central Asian republics in the Soviet Union constitute that more remote corner. Since some of those republics share borders with Iran and Afghanistan, they have been the targets of special interest by many western observers. Dur- ing the spring of 1984 citizens in the Soviet Union elected deputies to their national legislature. Thus i t is appropriate to ask whether those six Central Asian republics won a share of seats in the Supreme Soviet in 1984 that accorded with their share of the popular vote.
There are several reasons for attempting this kind of cross-national analysis. First, measurement in both case studies centers on the f i t between votes
63

cast and representatives won. Second, American blacks and Soviet Central Asians both constitute about twelve per cent of their respective populations. Third, party elites in both systems exercise consid- erable control over their election processes. For example, in the American system the state party elite determine whether a primary or a caucus will be the method for selecting convention delegates. Fur- ther, within the Democratic Party in recent years, the national party elite has experimented with various guidelines to which the state party leaders have had to adhere. Similarly, in the Soviet Union the national party elite determines how many legislative seats are accorded to each of its fifteen republics. For instance, the Communist Party elite in Moscow controlled the number of seats allocated to the Central Asian republics. Given the degree of party control over the election processes in both countries, i t makes sense to compare t h e two wi th regard to the willingness of the party elites to establish the framework for minority group representation within their respective political systems.
Cross-national, comparative studies of the type just outlined are important because of their precise focus on one measurable component of representation in both communist and non-Communist systems. While the American and Soviet systems are markedly different along a whole array of dimensions, they are comparable in the specific sense that party elites in both nations must struggle with the common problem of granting fair representation to important minority groups. In addition, concretely defined studies like this one ca'n help fil l a gap in the field of compara- tive politics. On the one hand, researchers have devoted much effort to the elaboration of broad, comparative theories and models that highlight the many differences and few similarities between the American and Soviet systems. On the other hand, the literature also includes many insightful applications of these ' theories to concrete political situations
64

within either the American or t h e Soviet systems. However, a wide gap exists between these two kinds of studies. Middlerange studies that utilize the broad frameworks in an effort to illuminate concrete similarities and differences between the two systems can help to fill that gap. Thus the study that fol- lows is a middlerange effort to compare the 1984 elections in the Soviet Union and the United States in light of one significant dimension of representation.
METHOD OF STUDY AND HYPOTHESIS
The Congressional Quarterly Weekly Report contained most of the data on the Jackson campaign results. Throughout the spring primary season, that publication listed both the percentage of the popular vote obtained and the proportion of convention delegates awarded to each candidate. In the end, twenty-three states using primary elections offered clear results on both indicators needed for the study. The research project thus includes an analysis of the results of those twenty-three primary election re- sults. At a deeper level, the study also probes for t h e significant reasons behind the discovered results.
Data on the election results for the Supreme Soviet in the Soviet Union 'were more difficult to obtain. The best summary was available in the March 7 , 1984 edition of Pravda (p. 1). The editors carried a republic-by-republic break-down of Supreme Soviet election results for that year. The six republics chosen for analysis are ones normally classified as "Central Asian." Such a classification does not mean that the six are each socially homogeneous. For instance, they vary somewhat with regard to the proportion of Moslems within their respective popula- tions. Further, large numbers of the dominant ethnic group in each of the Central Asian republics actually live outside their own republic. However, i t must also be remembered that Jesse Jackson's support in the 1984 presidential primaries contained some white
as well as many black votes. Therefore, a comparison between the Soviet and American case studies is merited.
In a comparative sense the general hypothesis of the research project will be simply that the political representation of blacks a t t h e Democratic Conven- tion via the Jesse Jackson campaign should be more equitable than political representation for Central Asians in the Supreme Soviet. The conventional distinctions which authors usually make between western democracies and the communist nations of the East account for this hypothesis (Dahl, 1971, pp. 6-7; Ludz, 1972, pp. 40-41; Meyer, 1965. pp. 243). Especially during the last twenty years, the American political elite has passed a variety of laws purporting to grant more access for minorities into the social and political systems. One would expect this general political responsiveness to affect as well the election system. In t h e Soviet case, one generally reads about efforts to Russianize the minority group populations rather than to offer them fuller political representa- tion. Leaders from the Russian Republic spend part of their careers in such far off places as Central Asia in an effort to keep the local population quiet and to build more credentials on their way to further power in Moscow (Medish, 1985, pp. 141-143; Rothman and Breslauer, 1978, pp. 135-136). Such recent differ- ences between the American and Soviet patterns of responsiveness to minorites thus reinforce the general expectations which are embodied in the hypothesis about the 1984 elections.
FINDINGS ON THE JESSE JACKSON CAMPAIGN
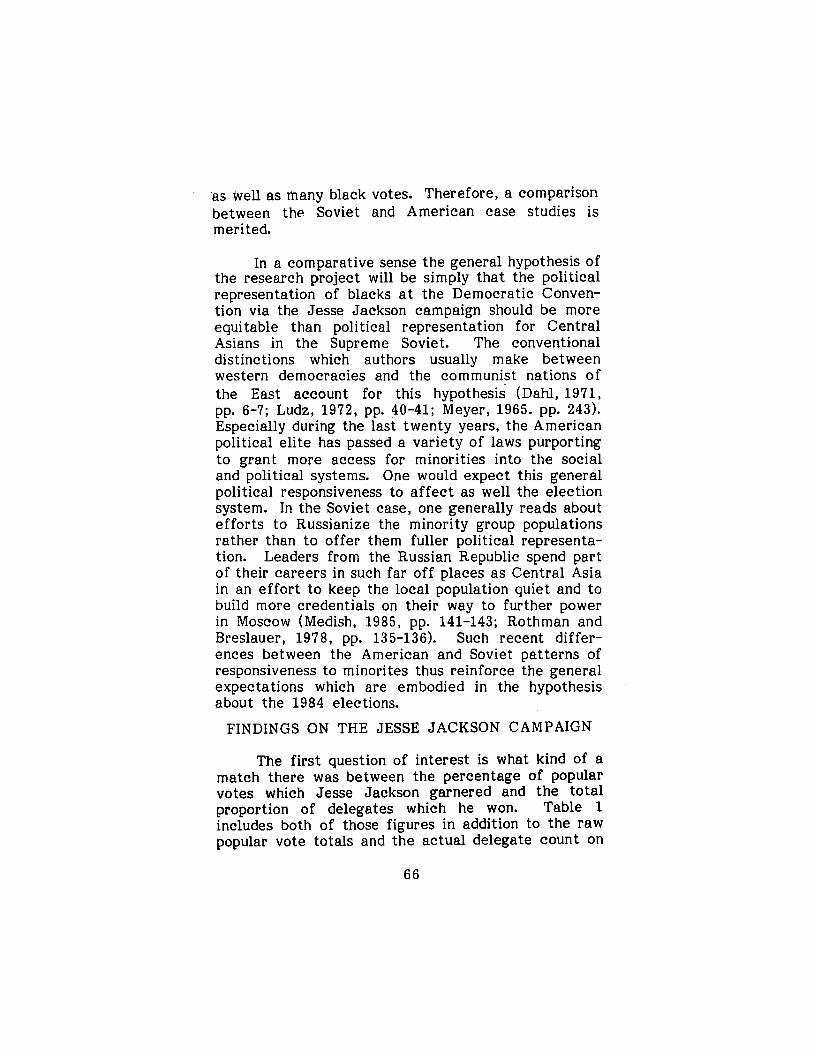
The first question of interest is what kind of a match there was between the percentage of popular votes which Jesse Jackson garnered and the total proportion of delegates which he won. Table 1 includes both of those figures in addition to the raw popular vote totals and the actual delegate count on
66
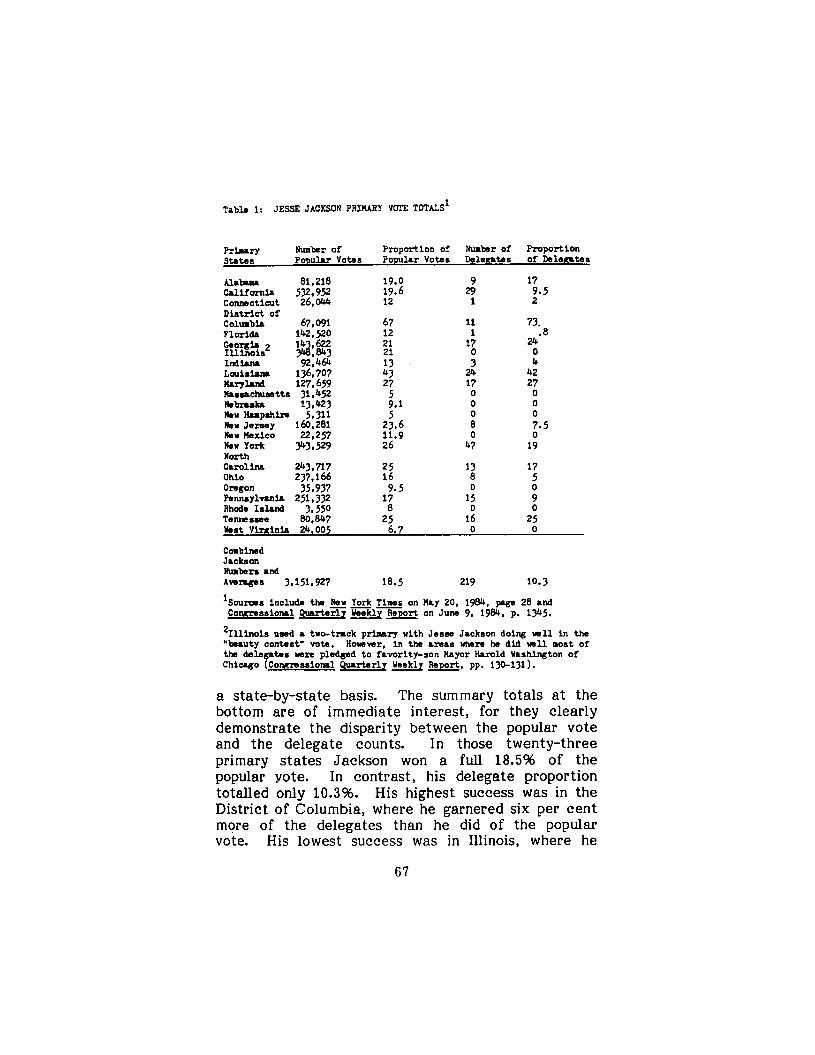
Table 11 JESSE JACKSON PRIMARY VOTE TOTALS'
R-W Number of Propor t ion of Nmbr of P r o p o r t i o n s u t e s popular Votes Popular Votes DS1emt.s of De1emt.s
Ala- 81,218 19.0 9 17 CIllfornia 532.99 19.6 29 9.5 Connecticut 26,044 12 1 2 District o f
142,520 12 1 .8 24 F l o r i d .
0 4
14 ,622 21
3 24 42
Indiuu 92,464 13
27 L o u i s i u u 136,707 43 Ilrryhnd 127,659 27 17 Ilreochumtts 31,452 5 0 0 Nobruk 13,423 9.1 0 0 Now H u p s h l m 5,311 5 0 0 Now J e r s e y 160.281 23.6 8 7.5 Now k x i c o 22,257 11.9 0 0 Now York 343,529 26 47 19 North Carollna 243.7l7 25 13 17 Ohlo 237.166 16 8 5 Olsgon 35,937 9.5 0 0 Pennsylvania 251,332 17 15 9 Rhoda Island 3,550 8 0 0 Tennessee 80,847 25 16 25 Host V l q l n k 24,005 6.7 0 0
Columbia 67.091 67 11 73.
'B ?GZ%S2 4 . 8 4 3 21
Combined Jackson Nrubsrs and
iSoumss include the New York Times on flay 20, 1984, p.ge 28 and C o v s s i o n r l p u a r t e z m y p o r t on June 9, 1984, p. 195 .
2111inols used a two-trrck p r i n a r y with Jesse Jackson doing wc l l ln the " b a u t y contest" vote. Hwvsr. i n t h e amas Whem he d i d w l l most of the d e l e Chicago ~o-ssiona1 Quarterly Weekly Report. pp. 130-131).
A = w s 3,151,927 18.5 219 10.3
tas *re pie-d t o f avor i ty - son flayor Hamld Washington of
a state-by-state basis. The summary totals at t h e bottom are of immediate interest, for they clearly demonstrate the disparity between the popular vote and the delegate counts. In those twenty-three primary states Jackson won a full 18.5% of the popular yote. In contrast, his delegate proportion totalled only 10.3%. His highest success was in the District of Columbia, where he garnered six per cent more of the delegates than he did of the popular vote. His lowest success was in Illinois, where he
67
obtained twenty-one per cent of the popular vote but no delegates. These facts require further analysis in order to determine the reason for such a disparity.
One explanation for the above-noted disparity would entail the possibility that the national Demo- cratic Party had allocated too few delegates to states in which Jackson's support was likely to be concen- trated. Perhaps malapportionment existed among the various Democratic primary states. If this were true, one would expect to find that each delegate in a state where Jackson had run up high popular vote totals was worth more popular votes than was each delegate in a comparably good state for Mondale or Hart. The national Democratic party may not have intended to produce such bias, hiit i%sexistence would have harmed Jackson's chances to acquire an equita- ble proportion of delegates.
States with high numbers of popular votes per delegate would be ones of particular interest with regard to the Jackson campaign. If they turned out to be the states where he did the best in his own popular vote count, it would be possible to argue that such malapportionment harmed his prospects. In fact, it is apparent that considerable inter-state malappor- tionment did exist in 1984 within t h e Democratic Party. For example, in North Carolina one delegate was worth 12,809.2 popular votes, while in Rhode Island a single delegate represented 2051.6 voters. The twelve states which possessed the widest dele- gate/popular vote gap were thus labelled t h e "most malapportioned," while the eleven states having the narrowest delegate/popular vote gap were designated as "least malapportioned." The next problem is to ascertain if states where Jackson received a high proportion of popular votes were also those at the top of the list of t h e most seriously malapportioned states. In order to solve this problem, the twenty- three states studied were again divided into two groups. In the first group of twelve states, Jackson's
68
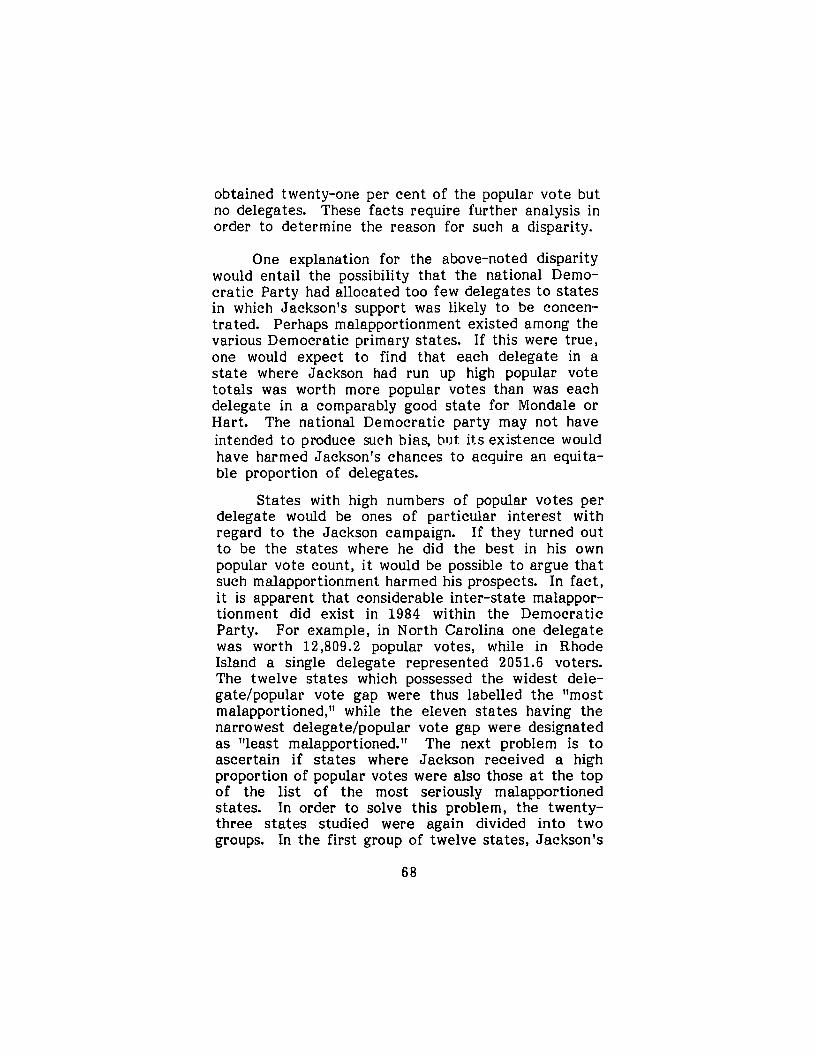
percentage of the popular vote was higher than it was in the second group of eleven states.
h b l c 21
PEWORnANCE AND LEYn OF IULAF'PORTIO~T
COMPARISON OF PRIMARY STATES BASED ON JACKSON'S
Level of Malapportlonnent Jackson' 6 Perf-ncs
Bast States W O r S t S h t . 8 6
nost Malapportlonsd 6 6
5
T o t a l 12 11
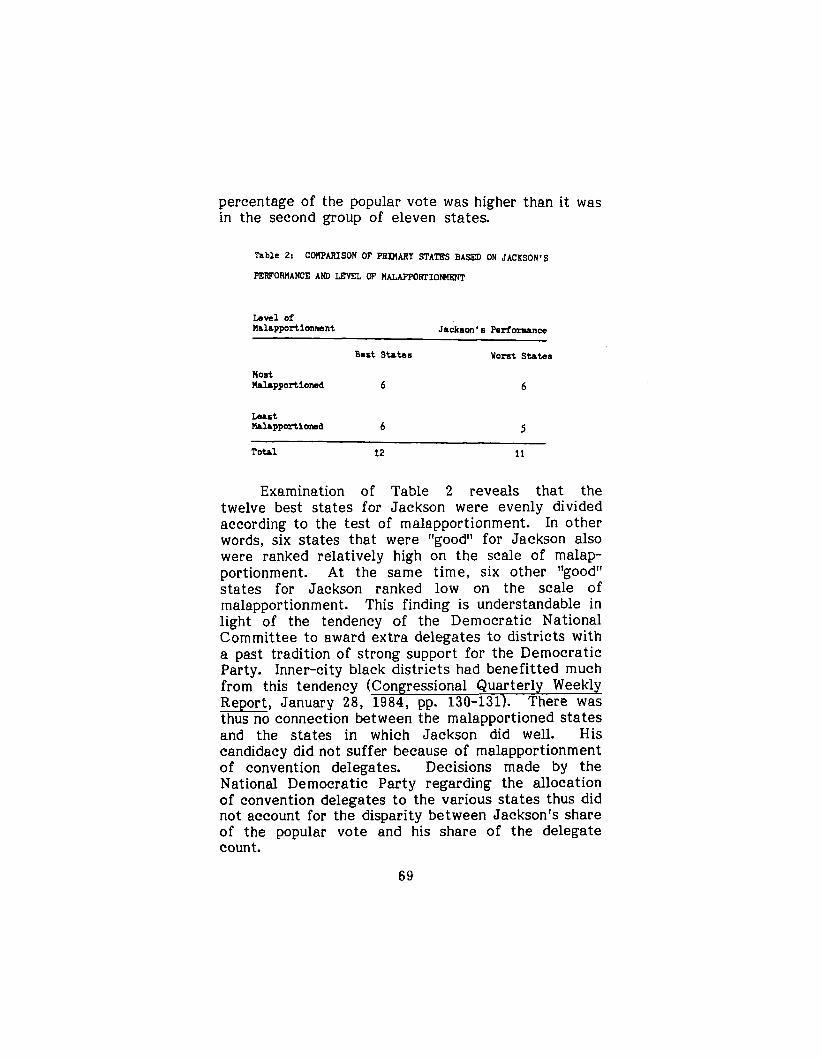
Examination of Table 2 reveals that the twelve best states for Jackson were evenly divided according to the test of malapportionment. In other words, six states that were rrgoodll for Jackson also were ranked relatively high on the scale of malap- portionment. A t the same time, six other "good" states for Jackson ranked low on the scale of malapportionment. This finding is understandable in light of t h e tendency of the Democratic National Committee to award extra delegates to districts with a past tradition of strong support for the Democratic Party. Inner-city black districts had benefitted much from this tendency (Congressional Quarterly Weekly Report, January 28, 1984, pp. 130-131). There was thus no connection between the malapportioned states and the states in which Jackson did well. His candidacy did not suffer because of malapportionment of convention delegates. Decisions made by the National Democratic Party regarding the allocation of convention delegates to the various states thus did not account for the disparity between Jackson's share of t h e popular vote and his share of the delegate count.
69
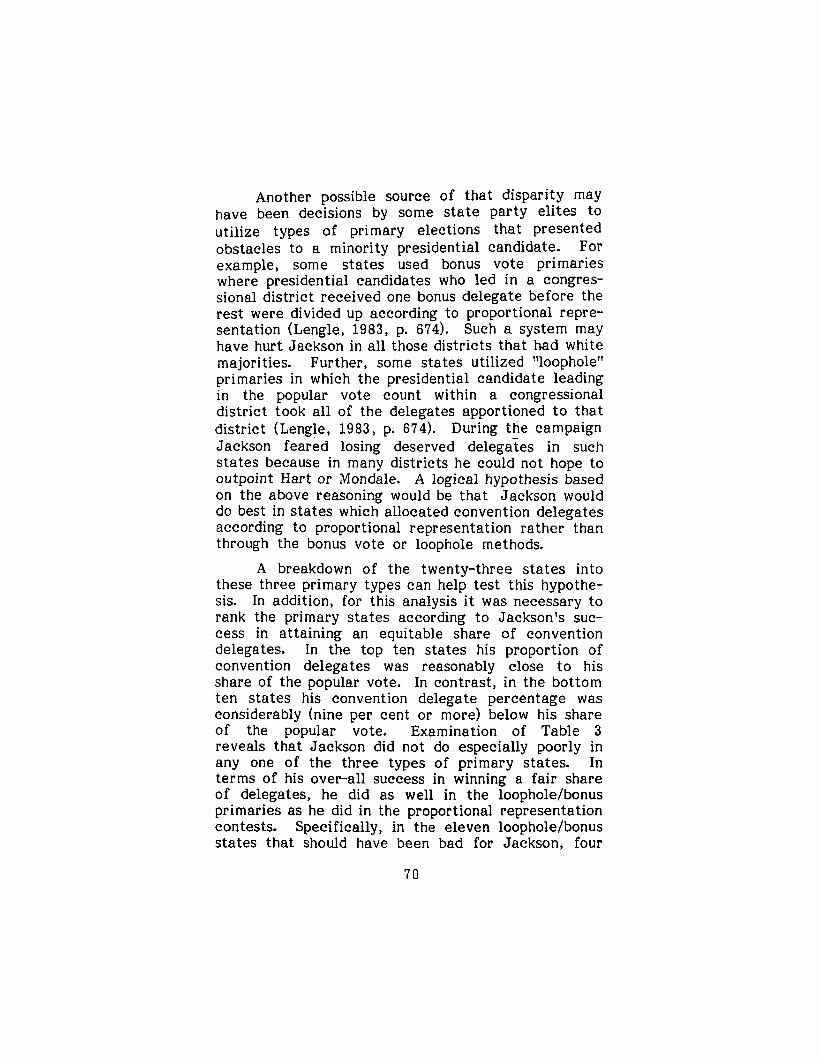
Another possible source of that disparity may have been decisions by some state party elites to utilize types of primary elections that presented obstacles to a minority presidential candidate. For example, some states used bonus vote primaries where presidential candidates who led in a congres- sional district received one bonus delegate before the rest were divided up according to proportional repre- sentation (Lengle, 1983, p. 674). Such a system may have hurt Jackson in all those districts that had white majorities. Further, some states utilized "loophole" primaries in which the presidential candidate leading in the popular vote count within a congressional district took all of the delegates apportioned to that district (Lengle, 1983, p. 674). During the campaign Jackson feared losing deserved delegaies in such states because in many districts he could not hope to outpoint Hart or Mondale. A logical hypothesis based on the above reasoning would be that Jackson would do best in states which allocated convention delegates according to proportional representation rather than through the bonus vote or loophole methods.
A breakdown of the twenty-three states into these three primary types can help test this hypothe- sis. In addition, for this analysis it was necessary to rank the primary states according to Jackson's suc- cess in attaining an equitable share of convention delegates. In the top ten states his proportion of convention delegates was reasonably close to h is share of the popular vote. In contrast, in the bottom ten states his convention delegate percentage was considerably (nine per cent or more) below his share of the popular vote. Examination of Table 3 reveals that Jackson did not do especially poorly in any one of the three types of primary states. In terms of his over-all success in winning a fair share of delegates, he did as well in the loophole/bonus primaries as h e did in the proportional representation contests. Specifically, in the eleven loophole/bonus states that should have been bad for Jackson, four
7 0

Table 31 OF STATES ACCOADIK TO JACKSON'S ABILITY To WIN AN EQUITABLE SHARE
OF CONVEKTION DELEGATES
RELATIONSRIP BETVEEN THE TYPE OF STATE PRIMARY AND THE RAM
ax& EqultabUlty RanWng Baaed on Jsckson's P e r f m n c e
Top 10 Mlddle 3 B o t t a 10
Loo hole or tonus 4
Proportloml Repmaentation 6
2 5
1 5
T o t a l 10 3 10
ranked in the top ten for him in winning an equitable share of convention delegates. Similarly, five of the twelve states using proportional representation were also among the bottom ten states for Jackson in terms of delegate representation. Thus there is absolutely no evidence that the state party elites in the loophole/bonus states devised election machinery that impaired Jackson's ability to win a proportion of convention delegates that accorded with his per- centage of popular votes. His Georgia showing is particularly revealing in that regard. In this "bonus" state he actually obtained three per cent more convention delegates than popular delegates. Such a result is surprising in light of the hypothesis.
In fact, Congressional Quarterly Weekly Report (January 28, 1984, pp. 130-131) suggested that a minority candidate might lose out through elimination of the loophole/bonus type primaries. The authors reasoned that such candidates depended on obtaining a disproportionate share of delegates in districts heavily populated by minority group members. That expectation fits the Jackson findings, for he did very well in three loophole/bonus states that have large clusters of blacks within t h e local population. Those states include Maryland, New York, and Georgia.
71
These findings, taken together, suggest strongly that the national/state party elites were not respon- sible for the overall disparity between Jackson's share of the popular vote in a state and his proportion of that state's convention delegates. The source of Jackson's problem lay elsewhere. It is possible that the general dispersion of t h e black population throughout America undercut Jackson's potential for obtaining large blocs of convention delegates.
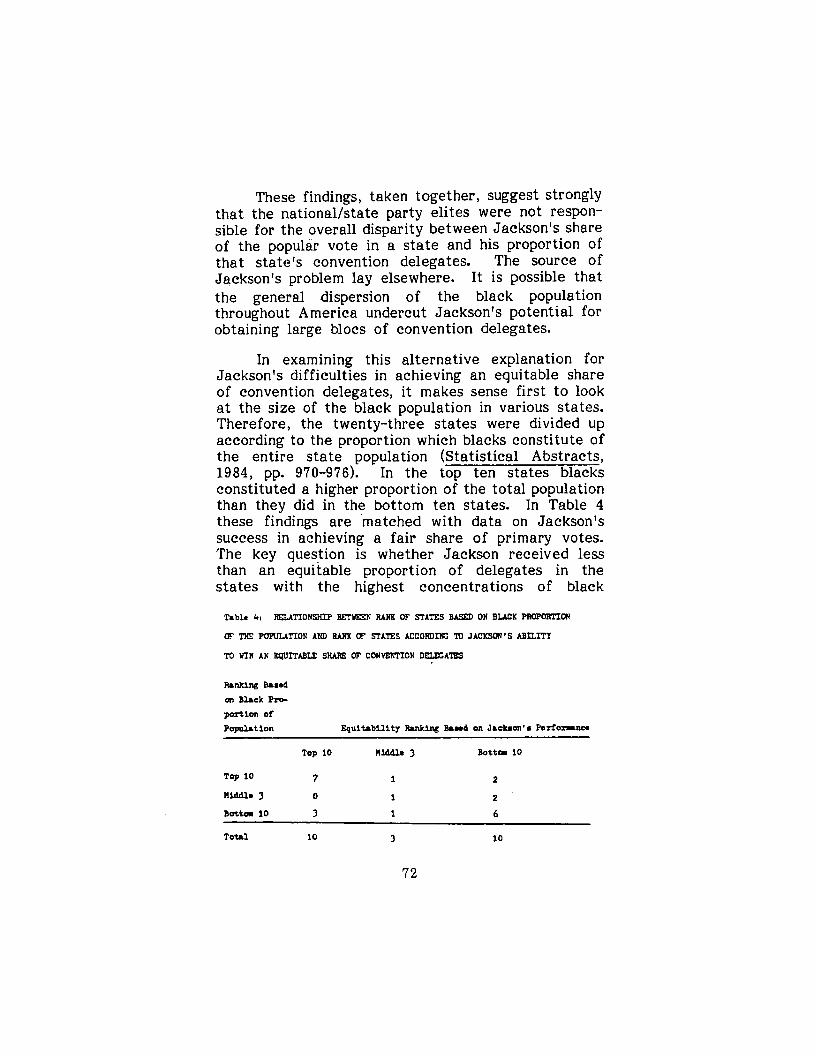
In examining this alternative explanation for Jackson's difficulties in achieving an equitable share of convention delegates, it makes sense first to look at the size of the black population in various states. Therefore, the twenty-three states were divided up according to the proportion which blacks constitute of the entire state population (Statistical Abstracts, 1984, pp. 970-976). In the top ten states blacks constituted a higher proportion of the total population than they did in the bottom ten states. In Table 4 these findings are matched with data on Jackson's success in achieving a fair share of primary votes. The key question is whether Jackson received less than an equitable proportion of delegates in t h e states with the highest concentrations of black
Table 41 REWTIONSHI? BETYD; RANK OF STATES B m ON BLACK PROPORPION
CF THE POPUWTION AND OF STATES A C C O W I K : TU JACKWW'S ABILITY
TO Y I N Ah' EQUITABLE SHARE OF CONVENTION DELECATES
Rankin& h w d
01 Black Prc- p a t i o n of Population EquitsbLlity Ranking Baaed on Jackmn's P c r f o r r n a
Top 10 n w e 3 B o t t a 10
Top 10 7 1
niddle 3 0 1
2
2
Bottom 10 3 1 6
Totrl 10 3 10
72
voters. The answer to that question is clearly For example, seven of the ten states in which Jackson won an equitable share of t h e delegates also ranked high in terms of the black proportion of t h e popula- tion. However, six of the ten states that were "bad" for Jackson ranked in the bottom ten with respect to the proportion of the black population. Thus it is possible to conclude that his problems in terms of equitability generally lay in these states with smaller proportions of black citizens.
A more precise way of studying this issue of the distribution of t h e black population would be to cast the spotlight on the congressional district level. States were thus ranked based on t h e proportion of congressional districts that contained a black popula- tion constituting thirty percent or more. A thirty percent figure was chosen primarily because there were three candidates in the presidential nomination race in 1984 who stayed in to the end. If Jackson were able to win most of the black votes, and if Mondale and Hart were equally strong, then Jackson would have a reasonable chance of defeating the other two in that congressional district. Since most of the convention delegates were chosen on a con- gressional district basis in 1984, it makes sense to look carefully a t that level.
From Table 5 it is clear that Jackson received inequitable treatment in terms of delegates largely in states that had no or few districts that were at least thirty per cent black. In contrast, he attained equitable results in states containing many districts with at least a thirty per cent black population. Since earlier tests have shown that bonus vote and loophole states were not particularly detri- mental to Jackson's prospects, it must be that Jackson was especially harmed by the wide and thin distribution of black citizens throughout a number of congressional districts in certain key states. In fact, the problem states isolated by th is test are such
73

major population centers as California, Florida, New Jersey, Illinois, Ohio, and Indiana. The wide scatter- ing of the black population throughout the congres- sional districts in those six states may have stemmed from natural demographic factors or from gerryman- dering by state legislatures. In either case, the discovery that the dispersion of the black population partly accounts for Jackson's difficulties in attaining an equitable proportion of delegates is an important finding.
Table 51 IGZATIONSXIF' El" THE RANK OF STATSS BASED ON PMPOFrTION
OF c o ~ s c w s s ~ o ~ ~ ~ DISTRICTS c o m m ~ nom THAN 3s BLACK FUFIJLATION
AM) THE RANK W STA'IZS ACCOROIE TO JACKMW'S ABILITY TO WIN AN
DlUITABLE SHARE OF C0" ION D E I g c A T S S
Ilmklng B u o d on Pmportion of Con- gmmionrl D i . t r i c t a Containing M o m T h n 3% B k c k Population E q u l b b U i t y Fmnkiq B w d on J i c h o n ' ~ Porforrrncr
Top 10 Hiddle 3 Bottm 10
Top 10 7 2 1
0 3 nibdie 3 0
3 1 6
TDti l 10 3 10
Bottom 10
A final possible explanatory factor lies in the size of the non-black vote received by Jackson in various primary states. Jackson's proportion of a state's popular vote was thus matched with the black proportion of that state's population. The top states were those in which he received considerably higher shares (at least six per cent) of votes than the black percentage of the population. In t h e bottom ten states his share of the vote relative to the black percentage of the population was not so impressive. In Table 6 the previously discussed data on Jack- son's success in attaining an equitable share of convention delegates in a given state are combined with these new rankings. The findings are conclusive.
74

h b l e 61 RELATIONSHIP BETWEEN THE RANK OF STATES BASED ON THE
SIZE OF THE NON-BLACK YOTE AND THE RANK OF SPATES ACCORDING To
JACKSON'S ABILITY TO YIN AN EQUITABLE SHARE OF CONVENTION DELEATES
Ranklng Based on ttm Slz. of the
Non-Black Vote Equltabl l l ty Rmklng Baaed on Jackson's Performance
Top 10 Nlddle 3 Bottca 10
Top 11 3 1 7
Hlddle 2 0 1 1
B o t t o m 10 7 1 2
Total 10 3 10 1 A tle for tho tenth posltlon in the flrst varlable accounts for the a t e a o r y "Top 11."
Seven of the ten states where Jackson received an inequitable share of delegates were also states in which he received a higher proportion of votes than the black share of the population. I t is possible that high black turnout partly accounts for this, but there is no doubt that he also received many non-black votes in these states. In other words, he had trouble winning a fair share of delegates in precisely those states where he probably received many white votes. It is also likely that his white vote in these states was so dispersed that it did not help him much in winning delegates at the congressional district level. Such a finding is also significant in explaining Jackson's general failure to win a fair share of delegates.
In summary, Jesse Jackson did more poorly in winning convention delegates than he did in winning popular votes. An important finding of this study is that the party elites at the state and national level were not responsible for this disparity. Rather, the wide dispersion of black citizens throughout con- gressional districts in certain key states partly ac-
75
counts for the above-noted disparity. Surprisingly, the dispersion of Jackson's white support in states where he picked up a good share of it contributed also to the inequitable delegate count. This last finding suggests that a future black presidential candidate would do better if he or she targeted certain white groups in key congressional districts than if he/she simply appealed for white support on a general basis.
FINDINGS ON THE CENTRAL ASIANS
The invasion of Afghanistan in 1979 by the Soviet Union was the single key event that drew the eyes of the West to Central Asia. Presumably, one reason for the Soviet invasion was the fear in Moscow that the Islamic fervor stoking the rebel movement in Afghanistan would infect the predominantly Moslem population in the Soviet Union's own six Central Asian republics. Eleven years earlier the Soviet leaders had ordered an invasion of Czechoslovakia partly in response to a similar fear about the infecting potential of the Prague Spring reforms. There is also evidence that Jaruzelski cracked down on Solidarity in Poland in 1981 partly because of the fear that other nations in t h e Soviet bloc would be the sites of similar patterns of labor agitation. In the Afghanistan situation of 1979, Soviet fears intensified after the rise to power of Khomeini in Iran. In 1978-80 there were no certainties that the Islamic resurgence in Iran was a movement confined only to that country. In light of general concern in the West about the stability of strategically important coun- tries like Pakistan and Saudi Arabia, it is not surprising that Soviet leaders may have feared an infection of militant Islam into their own Central Asian republics.
Research on the problem of ethnicity in the Soviet Union should thus rightly center on the political representation of groups like the Central
76
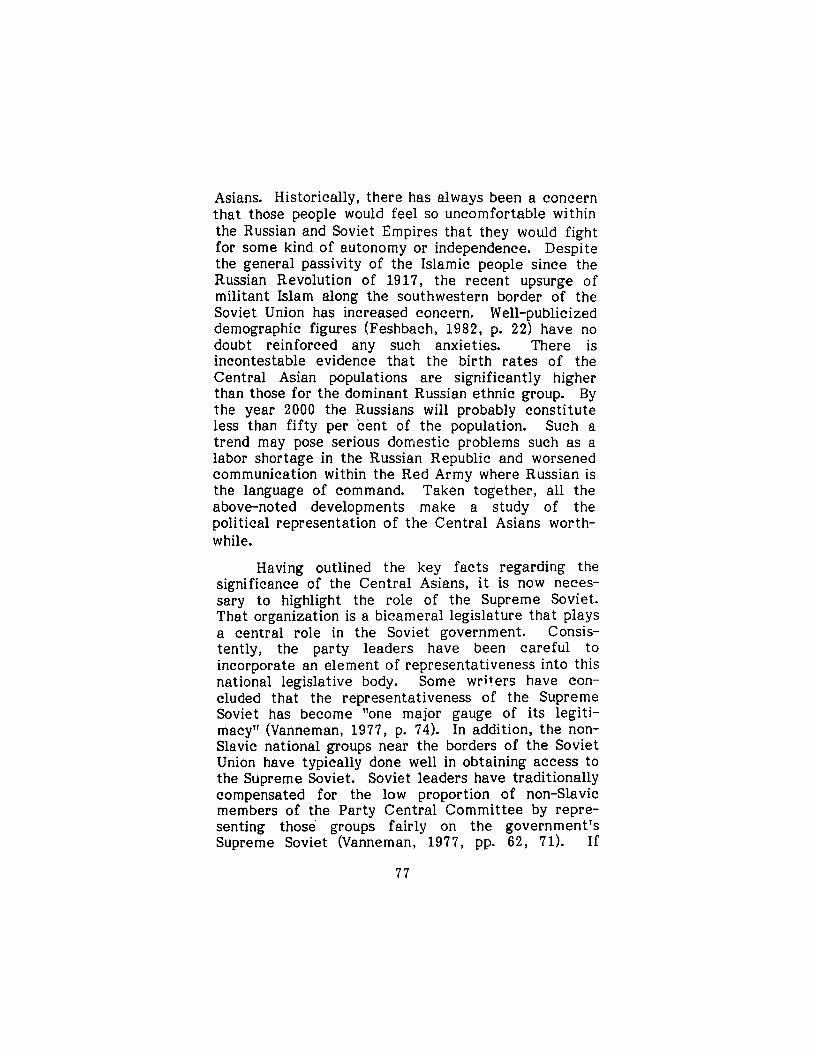
Asians. Historically, there has always been a concern that those people would feel so uncomfortable within the Russian and Soviet Empires that they would fight for some kind of autonomy or independence. Despite the general passivity of the Islamic people since the Russian Revolution of 1917, the recent upsurge of militant Islam along the southwestern border of the Soviet Union has increased concern. W ell-publicized demographic figures (Feshbach, 1982, p. 22) have no doubt reinforced any such anxieties. There is incontestable evidence that the birth rates of the Central Asian populations are significantly higher than those for the dominant Russian ethnic group. By the year 2000 the Russians will probably constitute less than fifty per cent of the population. Such a trend may pose serious domestic problems such as a labor shortage in the Russian Republic and worsened communication within t h e Red Army where Russian is the language of command. Taken together, all the above-noted developments make a study of the political representation of the Central Asians worth- while.
Having outlined the key facts regarding the significance of the Central Asians, it is now neces- sary to highlight the role of the Supreme Soviet. That organization is a bicameral legislature that plays a central role in the Soviet government. Consis- tently, the party leaders have been careful to incorporate an element of representativeness into this national legislative body. Some writers have con- cluded that the representativeness of the Supreme Soviet has become "one major gauge of its legiti- macy" (Vanneman, 1977, p. 74). In addition, the non- Slavic national groups near the borders of the Soviet Union have typically done well in obtaining access to the Supreme Soviet. Soviet leaders have traditionally compensated for the low proportion of non-Slavic members of the Party Central Committee by repre- senting those groups fairly on t h e government's Supreme Soviet (Vanneman, 1977, pp. 62, 71). If
77
Central Asians are likely to have an impact on any element of the Soviet political system, i t would be on the Supreme Soviet. At the same time, one should not overestimate the significance of the Supreme Soviet in the overall Soviet political structure. I t is, after all, a branch of a government apparatus which is clearly subordinate to the Communist Party organ- ization. While the increased activities of its com- missions in recent years may mean that it has become a more powerful organization with which the party leaders must bargain (Vanneman, 1977, p. 7), that very activity may also indicate a renewed interest by the party elite in more closely controlling the government bureaucracy (Vanneman, 1977, p. 20).
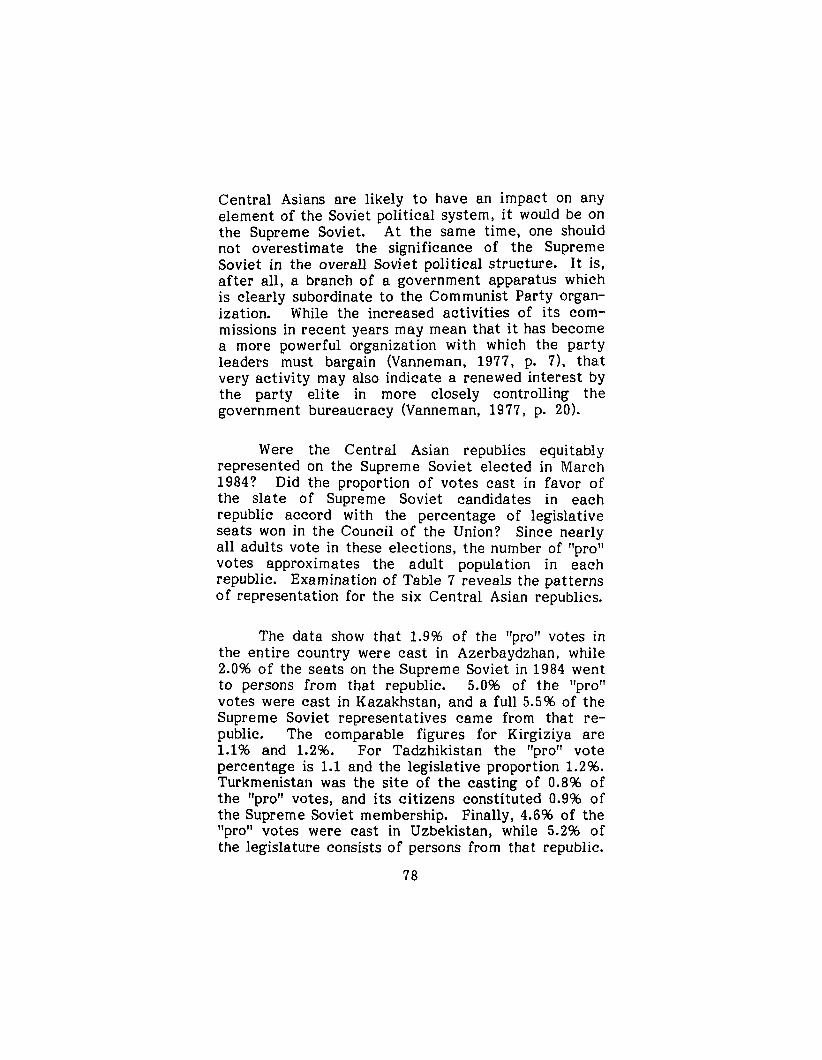
Were the Central Asian republics equitably represented on the Supreme Soviet elected in March 1984? Did the proportion of votes cast in favor of the slate of Supreme Soviet candidates in each republic accord wi th the percentage of legislative seats won in the Council of the Union? Since nearly all adults vote in these elections, the number of rtproll votes approximates the adult population in each republic. Examination of Table 7 reveals the patterns of representation for the six Central Asian republics.
The data show that 1.9% of the ttproll votes in the entire country were cast in Azerbaydzhan, while 2.0% of the seats on the Supreme Soviet in 1984 went to persons from that republic. 5.0% of the lrproll votes were cast in Kazakhstan, and a ful l 5.5% of the Supreme Soviet representatives came from that re- public. The comparable figures for Kirgiziya are 1.1% and 1.2%. For Tadzhikistan the "pro" vote percentage is 1.1 and the legislative proportion 1.2%. Turkmenistan was the site of the casting of 0.8% of t h e rtprort votes, and its citizens constituted 0.9% of the Supreme Soviet membership. Finally, 4.6% of the llproll votes were cast in Uzbekistan, while 5.2% of the legislature consists of persons from that republic.
78

In sum, none of the six Central Asian republics are underrepresented.
In all of the six republics, the proportion of representatives in the legislature is higher than the proportion of ltprolt votes cast within that given republic. Kazakhstan and Uzbekistan have in fact done somewhat better in winning legislative seats than one would have expected after looking at the tlpro" vote figures. These figures provide no evidence that the party elite discriminated against the Central Asians with respect to Supreme Soviet representation. Taken together, the six Central Asian republics cast
Table 71 CENTRAL ASIAN VOTE TQTALS M R THE CWEIL OF THE UNION
OF THE SLlPRME SOvTEri
Nubur of Proportion of Nunbur of Proportion Republic Pro votas Pro votas Deputies of Deputies
AeerbJdshn 3,439,765 1.9 15 2.0
I(.=akhdm 9,157,703 5.0 41 5.5
)(igiliJ. 2,000,261 1.1 9 1.2
h d z h i k l n t a n 2,078,850 1.1 9 1.2
Turlwnis tm 1,531,459 0.8 7 0.9
Uebkis tan 8,457,097 4.6 39 5.2
'Data wxm compiled fm prrvdr, March 7, 1984, P.1.
14.5% of the Itprol* votes in the Soviet Union and won 16% of the seats in the most recent election to the Supreme Soviet.
79
The findings reported above do not demonstrate any pattern of discrimination against the Central Asians on the part of the national party elite. In fact, the party elite went to great pains to ensure that the Central Asians possessed more than their share of legislative seats. While this is not the place to assess the motivations behind such a national policy, it is likely that the party elite is vitally interested in providing at least the appearance of fair representation to an extremely sensitive minority group. The geographic concentration of the Central Asians in six adjacent republics makes the granting of such representative access a simple and direct pro- cess.
COMPARATIVE CONCLUSIONS
Political elites in both the Soviet Union and the United States are vitally concerned about the politi- cal representation of large ethnic minorities. In the case of the Soviet Union, the ongoing war in Afghanistan has prompted a renewed interest i n Islamic groups mainly concentrated in six border republics. In the American case, civil rights struggles of the 1960s raised expectations about continued upward mobility for a dispersed group that for a long time had worn the badge of discrimination. In both political systems the ethnic minorities in question had substantial reason to think that the doors to political representation ought to be wide open.
The major hypothesis raised in th i s study was the prediction that the American party elite would be more likely to grant fair representation to blacks than would the Soviet party elite be to offer representation to Central Asians. Taken together, the two sets of findings reveal an opposite pattern. Jesse Jackson won only a little more than half of the Democratic convention delegates he deserved based on his popular vote totals. His success in winning a fair share of delegates varied widely in different
80
states, but the summary percentages for convention delegates and for primary votes show a distinctly unrepresentative pattern. In sharp contrast, the Central Asian republics won slightly more Supreme Soviet positions than their share of the total ''pro" vote would suggest that they deserved. There are some differences among t h e various republics, but all show higher proportions for legislative seats than for the I'proll votes. In sum, American blacks appear to have been more poorly represented than they should have been through the Jesse Jackson campaign, while Soviet Central Asians were somewhat better repre- sented than they deserved in the recent Supreme Soviet elections.
A search for the political reasons for these contrasting patterns, however, led to the discovery that party elites in neither country were bent on a pattern of political discrimination. For example, the National Democratic Party did allocate a fair share of convention delegates to states where a black candidate was likely to do well. Further, state party elites did not utilize loophole and bonus primaries in such a way that Jackson's candidacy was particularly harmed. Similarly, in the Soviet Union the national communist party elite in Moscow allocated more than a fair share of Supreme Soviet positions to the six Central Asian republics. It is thus necessary to look elsewhere for the sources of the disparity noted in the previous paragraph.
Most probably, the contrasting living patterns of Soviet Central Asians and American blacks account for these contrasting pictures of political representa- tion. Living mainly in six contiguous republics, the Central Asians constitute a concentrated regional bloc to which t h e national Communist Party elite could easily allocate a particular share of delegates. In contrast, American blacks are dispersed into -many regions of the country. Also, within many states t h e y live mainly in a f e w major urban centers. No doubt
81

this scattered living pattern throughout America means that their candidates can easily win a few delegates in many urban areas but have difficulty in most other areas. Of singular importance was the finding in this study that the Jackson candidacy had special difficulty winning a fair share of convention delegates in states where most congressional districts were less than thir ty per cent black. Of equal significance was t h e related finding that Jackson had similar difficulty in states where he picked up many, dispersed, non-black votes. Thus, Central Asians and American blacks had different political experiences because of very different living patterns. The general lesson that emerges from this study is that a minority group does much better politically if its members are concentrated into a few regional units of a country than if its people are widely dispersed throughout the country.
In conclusion, i t is possible for political systems as different as t h e American and Soviet, non- communist and communist, to respond in similar ways to the common problem of representing major ethnic groups. Coping with a common problem does not, however, mean that party elites can easily overcome intractable demographic patterns such as dispersal or concentration of the minority populations. It is therefore striking that the contrasts in the two patterns of political representation revolve around basic demographic facts of life rather than around expected differences between party elites in com- munist and non-communist countries.
REFERENCES
Dahl, Robert A. Polyarchy: Participation and Op- position. New Haven: Yale University Press, 1971.
82

Daly, John Charles, moderator. Choosing Presidential Candidates. Washington, D.C.: American En- terprise Institute for Public Policy Research, 1980.
Feshbach, Murray. The Soviet Union: Population Trends and Dilemmas. Washington, D.C.: Pop- ulation Reference Bureau, Inc., 1982.
Lengle, James I. "To Run or Not to Run." Politi- (Fall 19831, pp. 673-677. cal Science (PS) XVI -
Ludz, Peter C. The Changing Party Elite in East Germany. Cambridge, Mass.: The MIT Press, 1972.
Medish, Vadim. Soviet Union. Second Revised Edi- tion. Englewood Cliffs, N e w Jersey: Prentice- Hall, Inc., 1985.
Meyer, Alfred G. The Soviet Political System. N e w York: Random House, 1965.
Polsby, Nelson W. Consequences of Party Reform. N e w York: Oxford University Press, 1983.
Kanney, Austin. The Federalization of Presidential Primaries. Washington, D.C.: American Enter- prise Institute for Public Policy Research, 1978.
Rotham, Stanley and George W. Breslauer. Soviet Politics & Society. N e w York: West Publishing Co., 1978.
Vanneman, Peter. The Supreme Soviet: Politics and the Legislative Process in the Soviet Political System. Durham, N.C.: Duke University Press, 1977.

PERIODICALS
Congressional Quarterly Weekly Repor t , 42 (January 28, 19841, pp. 130-131.
/
Congressional Quarterly Weekly Report , 42 (June 9 , 19841, p. 1345.
N e w York Times, May 20, 1984, p. 28.
Pravda, March 7, 1984, p. 1.
Stat is t ical Abstract , 1984, pp. 970-976.
84