minority concentration district project north 24 … · minority concentration district project...
TRANSCRIPT

Minority Concentration District Project
North 24 Parganas, West Bengal
Sponsored by the Ministry of Minority Affairs
Government of India
Centre for Studies in Social Sciences, Calcutta
R1, Baishnabghata Patuli Township
Kolkata 700 094, INDIA. Tel.: (91) (33) 2462-7252, -5794, -5795
Fax: (91) (33) 24626183 E-mail: [email protected]
Research Team Faculty: Prof. Partha Chatterjee, Dr. Pranab Kumar Das, Dr. Sohel Firdos, Dr. Saibal Kar, Dr. Surajit C. Mukhopadhyay, Prof. Sugata Marjit. Research Associate: Smt. Ruprekha Chowdhury. Research Assistants: Shri Dhritiman Bhattacharya, Smt. Anindita Chakraborty, Shri Pallab Das,
Shri Siddhartha Laha, Shri Avik Sankar Moitra, Shri Ganesh Naskar and Shri Abhik Sarkar.
Acknowledgment
The research team at the CSSSC would like to thank Shri G. C. Manna, Deputy Director
General, NSSO, Dr. Bandana Sen, Joint Director, NSSO, Shri Pawan Agarwal, Principal
Secretary, MDW & ME, Shri A. Khaleque, Director & E.O. Joint Secretary, MDW, Shri A.A.
Siddiqui, Joint Secretary MDW, Shri S.N. Pal, Director & E.O. Joint Secretary, Madrasah
Education, Shri Arfan Ali Biswas, CEO, Board of Wakfs, Mr. Tanvir Afzal, General Manager,
and Mr. Raktim Nag, Manager-Systems, West Bengal Minorities Development & Finance
Corporation, Bhavani Bhavan, Kolkata and Shri Prabhat Kumar Misra, District Magistrate of
North 24 Parganas and other department officials for their generous support and assistance in our
work.
1
Content
An Overview…………………………………………………...4 Significance of the Project……………………………………5 The Survey..……..…………………………………………….7 Methodology…………………………………………………..8 Introducing West Bengal……………………………………9 North 24 Parganas………………………………………….10 Demography…………………………………………………10 Selected Villages in Respective Blocks……………………..11 Map of the District of North 24 Parganas..………………...12 Findings……………………………………………………....13
1. Basic Amenities……………………………………..13 2. Education……………………………………………18 3. Occupation…………………………………………..28 4. Health………………………………………………..33 5. Infrastructure……………………………………….38 6. Awareness about Government Schemes……….…38 7. Other issues…………………………………………41
Recommendations…………………………………………...48
2

Appendices
Table A1: General information………………………….….52 Table A2: Transport and Communication…………………52 Fig. A 1 Sources of Water………………………………..…..53 Fig. A2: Distance to Post-Office.……………………….……53 Fig. A3: Distance of Public Transport…..……………..…54 Fig. A4: Average No. of Banks and Other Financial Institutions……………….……..54 Fig. A5: Irrigation…………………………..……….….….55 Sampling Methodology……………………………..………56
3

The Minority Concentrated Districts Project An Overview The MCD project aims to provide a baseline survey on the state of minorities in the
districts identified by the Ministry of Minority Affairs, Government of India. Centre for Studies
in Social Sciences, Calcutta, undertakes the project in the following districts: Uttar Dinajpur,
Dakshin Dinajpur, Malda, Murshidabad, Birbhum, Nadia, South 24 Parganas, North 24
Parganas, Bardhaman, Koch Behar, Haora, Gajapati, North Sikkim and Nicobar Islands.1
The objective of the proposed study has been conducting a baseline survey on religious
minority population under the aegis of Indian Council of Social Science Research and funded by
the Ministry of Minority Affairs. A total of ninety districts have been selected by the Ministry of
Minority Affairs on the basis of three criteria, viz. minority population, religion specific socio
economic indicators and basic amenities indicators. The Ministry has classified the districts with
substantial minority population on the basis of religion specific socio economic indicators and
basic amenities indicators respectively. The four religion specific socio-economic indicators are:
(i) literacy rate, (ii) female literacy rate, (iii) work participation rate and (iv) female work
participation rate. The four basic amenities are: (i) % of households with pucca walls, (ii) % of
households with safe drinking water, (iii) % of households with electricity and (iv) % of
households with W/C latrines. A total of 53 districts with both sets of indicators below national
average were considered more backward and were classified into group ‘A’ and 37 districts with
either of the indicator values below national average were classified into group ‘B’. Group B was
further classified into two sub-categories – B1 for which religion specific socio-economic
indicators are below national average and B2 for which basic amenities indicators are below
national average. The minorities are defined on the basis of National Commission of Minorites
Act, 1992 and includes Muslims, Sikhs, Christians, Buddhists and Zorastrians (Parsis).
Centre for Studies in Social Sciences, Calcutta would carry out the survey in 11 districts
of West Bengal and one each in the Andaman and Nicobar Islands, Orissa and Sikkim. Of the 11
districts of West Bengal Uttar Dinajpur, Dakshin Dinajpur, Malda, Murshidabad, Birbhum,
1 The spellings for the districts and state are in accordance with West Bengal Human Development Report, 2004
4
Nadia, South 24 Parganas, Brdhaman and Kochbihar are in group A while Haora, North 24
Parganas are in group B (sub-category B1). Nicobars in Andaman and Nicobar Island and North
Sikkim in Sikkim are in group B (sub-category B2). Gajapati district in Orissa is in group A. It
may also be noted that all the 11 districts of West Bengal are marked for Muslim minority
category while Gajapati and Nicobars are marked for Christian minority category and North
Sikkim for the Buddhist minority category.
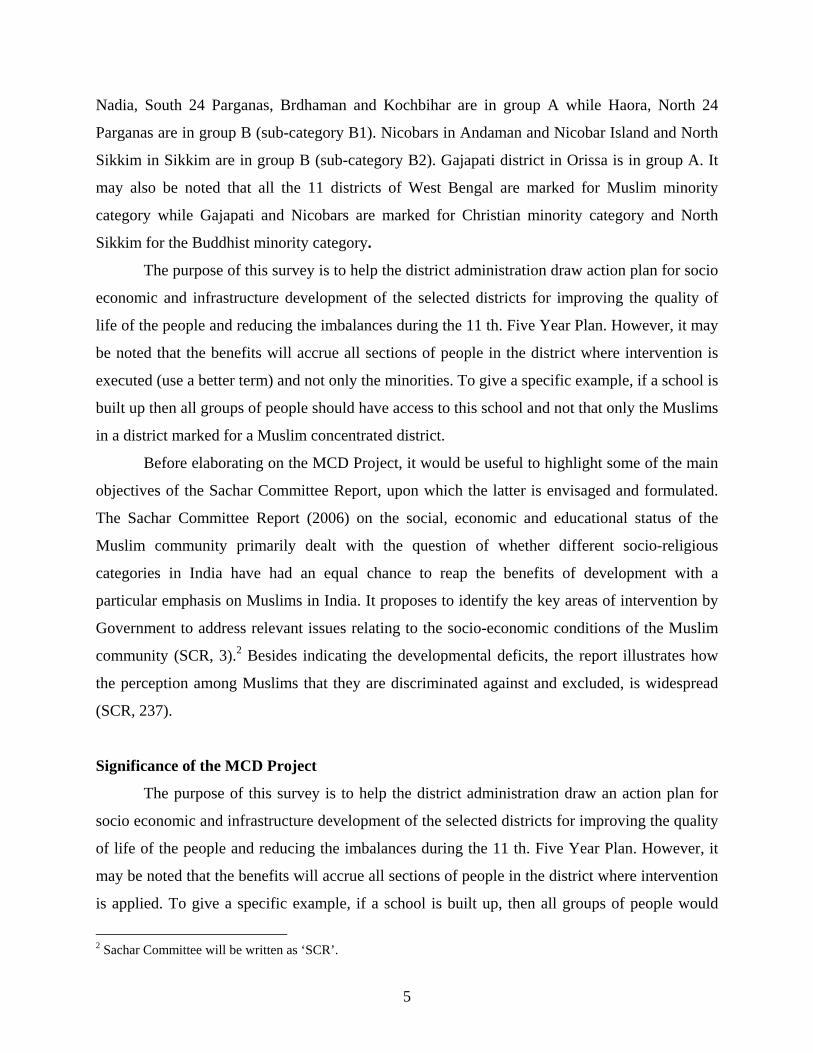
The purpose of this survey is to help the district administration draw action plan for socio
economic and infrastructure development of the selected districts for improving the quality of
life of the people and reducing the imbalances during the 11 th. Five Year Plan. However, it may
be noted that the benefits will accrue all sections of people in the district where intervention is
executed (use a better term) and not only the minorities. To give a specific example, if a school is
built up then all groups of people should have access to this school and not that only the Muslims
in a district marked for a Muslim concentrated district.
Before elaborating on the MCD Project, it would be useful to highlight some of the main
objectives of the Sachar Committee Report, upon which the latter is envisaged and formulated.
The Sachar Committee Report (2006) on the social, economic and educational status of the
Muslim community primarily dealt with the question of whether different socio-religious
categories in India have had an equal chance to reap the benefits of development with a
particular emphasis on Muslims in India. It proposes to identify the key areas of intervention by
Government to address relevant issues relating to the socio-economic conditions of the Muslim
community (SCR, 3).2 Besides indicating the developmental deficits, the report illustrates how
the perception among Muslims that they are discriminated against and excluded, is widespread
(SCR, 237).
Significance of the MCD Project
The purpose of this survey is to help the district administration draw an action plan for
socio economic and infrastructure development of the selected districts for improving the quality
of life of the people and reducing the imbalances during the 11 th. Five Year Plan. However, it
may be noted that the benefits will accrue all sections of people in the district where intervention
is applied. To give a specific example, if a school is built up, then all groups of people would
2 Sachar Committee will be written as ‘SCR’.
5
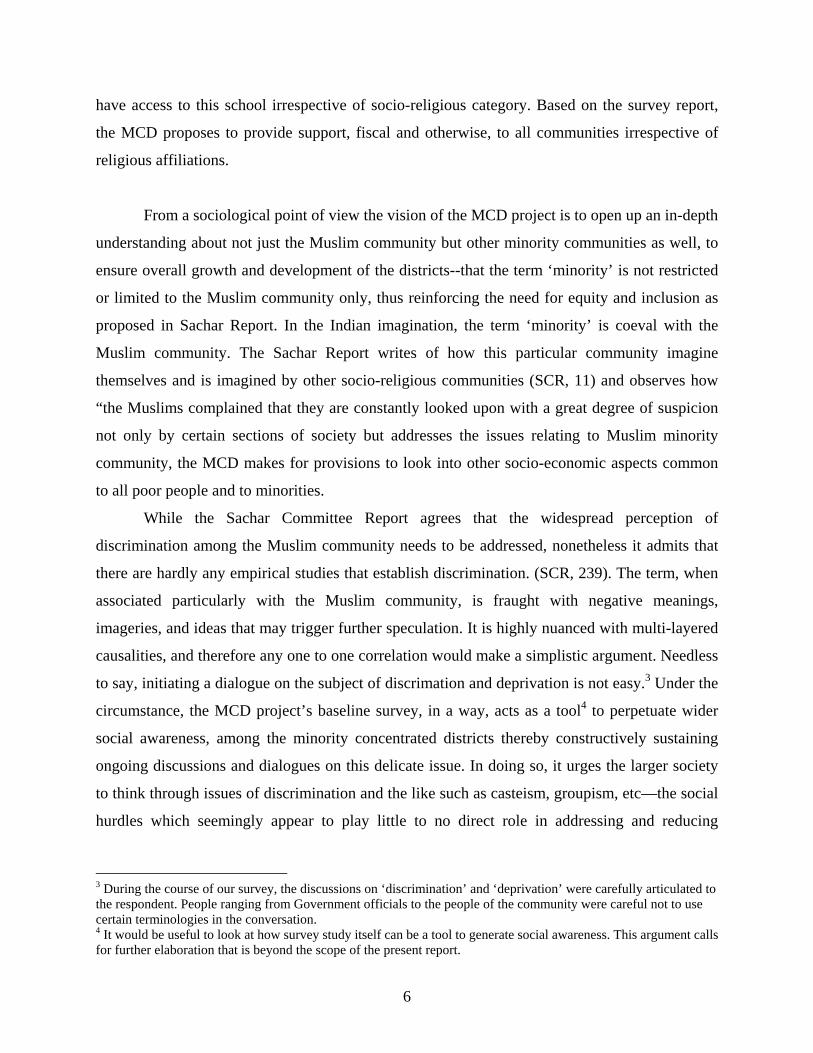
have access to this school irrespective of socio-religious category. Based on the survey report,
the MCD proposes to provide support, fiscal and otherwise, to all communities irrespective of
religious affiliations.
From a sociological point of view the vision of the MCD project is to open up an in-depth
understanding about not just the Muslim community but other minority communities as well, to
ensure overall growth and development of the districts--that the term ‘minority’ is not restricted
or limited to the Muslim community only, thus reinforcing the need for equity and inclusion as
proposed in Sachar Report. In the Indian imagination, the term ‘minority’ is coeval with the
Muslim community. The Sachar Report writes of how this particular community imagine
themselves and is imagined by other socio-religious communities (SCR, 11) and observes how
“the Muslims complained that they are constantly looked upon with a great degree of suspicion
not only by certain sections of society but addresses the issues relating to Muslim minority
community, the MCD makes for provisions to look into other socio-economic aspects common
to all poor people and to minorities.
While the Sachar Committee Report agrees that the widespread perception of
discrimination among the Muslim community needs to be addressed, nonetheless it admits that
there are hardly any empirical studies that establish discrimination. (SCR, 239). The term, when
associated particularly with the Muslim community, is fraught with negative meanings,
imageries, and ideas that may trigger further speculation. It is highly nuanced with multi-layered
causalities, and therefore any one to one correlation would make a simplistic argument. Needless
to say, initiating a dialogue on the subject of discrimation and deprivation is not easy.3 Under the
circumstance, the MCD project’s baseline survey, in a way, acts as a tool4 to perpetuate wider
social awareness, among the minority concentrated districts thereby constructively sustaining
ongoing discussions and dialogues on this delicate issue. In doing so, it urges the larger society
to think through issues of discrimination and the like such as casteism, groupism, etc—the social
hurdles which seemingly appear to play little to no direct role in addressing and reducing
3 During the course of our survey, the discussions on ‘discrimination’ and ‘deprivation’ were carefully articulated to the respondent. People ranging from Government officials to the people of the community were careful not to use certain terminologies in the conversation. 4 It would be useful to look at how survey study itself can be a tool to generate social awareness. This argument calls for further elaboration that is beyond the scope of the present report.
6

developmental deficits, are nonetheless inextricably linked to the overall growth and
advancement of the country.5
By focusing on the14 districts, extended over 3 states and 1 union territory, viz. West
Bengal, Orissa, Sikkim and Andaman and Nicobar Islands respectively, the MCD project headed
by the Center for Studies in Social Sciences, Calcutta, aims to gain an in-depth and detailed view
of the socio-economic conditions of the communities living in these districts and create socio-
economic profiles of the districts by identifying the key developmental deficits viz. health,
literacy rate, female work participation etc. that have a significant bearing on the overall growth
and expansion of a State. The project is a district level plan that doesn’t necessarily target the
minority community, and therefore although it will identify the minority community, the funds
will be allocated across communities irrespective of socio-religious affiliations. (See ICSSR’s
Expert Committee Meeting on Baseline Survey of Minority Concentration Districts, p.2)
The MCD also looks into issues pertaining to non- implementation of various schemes
and programmes offered by the Government. The Sachar Committee quotes of how the ‘non-
implementation” of several earlier Commissions and Committee has made the Muslim
community wary of any new initiative (SCR, 10).
The Survey
The MCD project undertakes a baseline survey to address the socio-economic issues of
the district communities. A baseline survey is significant as it creates a rich database, which
allows us to interrogate, and provides us with more research options. Also, it allows us to create
a benchmark for future survey on the focused areas that need immediate Government
intervention. The new data collected and collated by baseline survey will thus build on and
supplement the existing data provided by Census and the Sachar Committee.
There is a need to describe developmental deficits in terms of figures and numbers, one
has to take cognizance of how the ‘social’ is intertwined with the economic parameters of human
conditions and vice versa. This approach towards research would allows us to gain a holistic
perspective while at the same time enabling us to stay focused on certain key aspects of
development of the minority concentrated districts.
5 The Sachar Committee Report notes that the widespread perception of discrimination among the Muslim community needs to be addressed but admits that ‘there are hardly any empirical studies that establish discrimination.’ (SCR pp.239)
7
Previous research such as the State HDR (West Bengal) did not treat the Muslim
community as a separate socio-religious group. While data for SC/STs and on gaps in
development exist, the absence of focus on the Muslim community does not bring to the fore
their specific socio-economic status. While certain socio-economic conditions would be
applicable across communities in terms of literacy, employment, or such like, a specific focus on
minorities would also show the relative position vis-à-vis other disadvantaged groups namely the
SC/STs. The advantage of focusing on the conditions of minorities in terms of standard socio-
economic indices is to clearly highlight their condition, which would have been glossed over if
the research were conducted by focusing on the SC/STs only.
Methodology
The survey has been conducted at two stages. The census villages are primary sampling
units. Based on the proportion of minority population the development blocks and accordingly
the villages are grouped into three strata where first stratum is top 20%, second one is middle
50% and the third is the bottom 30%. If district population is more than 0.5 Million then a total
of 30 villages will be chosen which will be distributed in the three strata in proportion to
population of the respective strata. The villages are chosen by the method of probability
proportional to size given the number of villages to be chosen from each stratum. In the second
stage a total of 30 households are chosen from each village randomly in proportion to religious
group in the total population of the village. However our population is not the whole village but
two hamlet groups if village population exceeds 1200. The hamlet group with highest
concentration of minority population is chosen with probability one and another is chosen from
the rest hamlet groups randomly. Typical size of a hamlet group is 600.
The methodology employs two types of survey instruments – one a rural household
questionnaire and second, a village schedule. Household schedule would be used to identify
socio-economic parameters, as well as, to understand both the individual and the collective
experiences of people living in these areas. The village schedule would be instrumental in
collecting the village average data. This data will be collected from the various government
offices, such as the office of the District Magistrate, the Block Development Officer, the
8

Agricultural Department; the office of the Panchayat Pradhan, ICDS centres etc. It will be useful
in understanding the nature of the village in terms of availability of infrastructure, access to basic
amenities such as health services, education, land and irrigation and the like.
Besides very few descriptive open-ended questions, the questionnaires primarily consist
of short, close-ended questions, with appropriate coding categories. An instruction sheet with
comments, wherever necessary, is annexed for further clarification of the questionnaire if and
when so required. Pre-testing of the questionnaire was accomplished through various drafts,
where members of the faculty and team met and discussed on a weekly basis, to evaluate the
comprehensibility, conviviality, (whether the questions are relevant) and competency (whether
the respondents will be able to answer reliably) of the questions being asked.
The methodology has required appointing and training supervisors and field investigators
in the districts for conducting the survey among the rural householders effectively. The
interviews have been carried out with the consent and voluntary participation of the respondents.
Confidentiality and their right to privacy have been safeguarded at all times.
Introducing West Bengal
West Bengal is the fourth most populous state in the Eastern Region of India accounting
for 2.7 % of India’s total area, 7.8 % of the country’s population and ranks first in terms of
density of population which is 904 per square Km. Muslims are the dominant minority and
account for 27 % of the total population of the State. With 72% of people living in rural areas,
the State of West Bengal is primarily an agrarian state with the main produce being rice and jute.
About 31.8% of the total population lives below the poverty line.
Previous research on West Bengal has shown that certain districts such as Darjeeling,
Jalpaiguri, Koch Behar, Malda, Uttar Dinajpur and Dakshin Dinajpur in the north, Purulia,
Bankura, Birbhum in the west and the two 24 Parganas (north and south) stretching across the
Sunderbans are relatively more backward socio-economically than the rest of the districts in
West Bengal. It is equally worth noting that the concentration of Muslim minority in the state of
West Bengal is higher than the national average. (SCR, 30)
9

North 24 Parganas
The district of North 24 Parganas as Muslim minority district belongs to category ‘B’
(sub-category B1) of the MCD districts with 24.22% Muslim population and religion specific
average socio-economic indicator value 40.9 and average basic indicator value 47.2.6
Barasat, district headquarter, is very close to Kolkata, the state capital and well connected
by road and railways. There are 22 CD Blocks, 200 Gram Panchayats and 2923 Gram Samsads
in the district. The district has 3799 primary schools, 838 secondary and higher secondary
schools, 37 degree colleges, 16 professional and technical colleges and 28 IDS centres.
Demography
Of the 18 districts of West Bengal, North 24 Parganas ranks 3 rd. in terms of Human
Development Index (Human Development Report, 2004, p. 219). The density of population is
2182 per square Km. The total population of the district is 8934286 (Census, 2001) with a
decadal rate of growth of 22.69 % over 1991 census. Of the total population the rural population
is approximately 45.70%. The SC and ST population of the district are 20.6% and 2.23%
respectively. The literacy rates of males and females are 89.32% and 71.72% respectively. The
rate of work participation is 33.45% and the female work participation rate is 11.33%. The
district of North 24 Parganas is characterized by gangetic alluvial soil and rich in rice production.
The proportion of landless labourers constitute a very large proportion – 13.9% males and 12.2%
females.
6 The corresponding national averages are 45.8% and 41.7% respectively as calculated by the Ministry of Minority Affairs.
10
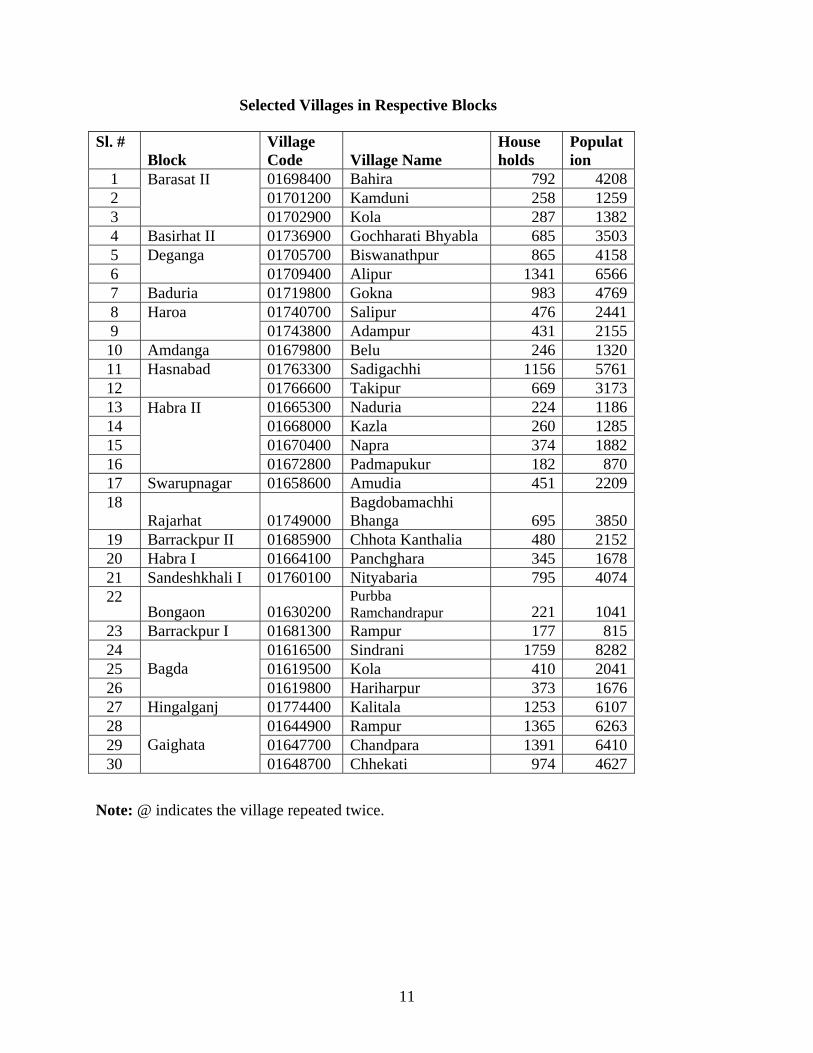
Selected Villages in Respective Blocks
Sl. # Block
Village Code Village Name
House holds
Population
1 01698400 Bahira 792 4208 2 01701200 Kamduni 258 1259 3
Barasat II 01702900 Kola 287 1382
4 Basirhat II 01736900 Gochharati Bhyabla 685 3503 5 01705700 Biswanathpur 865 4158 6
Deganga 01709400 Alipur 1341 6566
7 Baduria 01719800 Gokna 983 4769 8 01740700 Salipur 476 2441 9
Haroa 01743800 Adampur 431 2155
10 Amdanga 01679800 Belu 246 1320 11 01763300 Sadigachhi 1156 5761 12
Hasnabad 01766600 Takipur 669 3173
13 01665300 Naduria 224 1186 14 01668000 Kazla 260 1285 15 01670400 Napra 374 1882 16
Habra II 01672800 Padmapukur 182 870
17 Swarupnagar 01658600 Amudia 451 2209 18
Rajarhat 01749000 Bagdobamachhi Bhanga 695 3850
19 Barrackpur II 01685900 Chhota Kanthalia 480 2152 20 Habra I 01664100 Panchghara 345 1678 21 Sandeshkhali I 01760100 Nityabaria 795 4074 22
Bongaon 01630200 Purbba Ramchandrapur 221 1041
23 Barrackpur I 01681300 Rampur 177 815 24 01616500 Sindrani 1759 8282 25 01619500 Kola 410 2041 26
Bagda 01619800 Hariharpur 373 1676
27 Hingalganj 01774400 Kalitala 1253 6107 28 01644900 Rampur 1365 6263 29 01647700 Chandpara 1391 6410 30
Gaighata 01648700 Chhekati 974 4627
Note: @ indicates the village repeated twice.
11
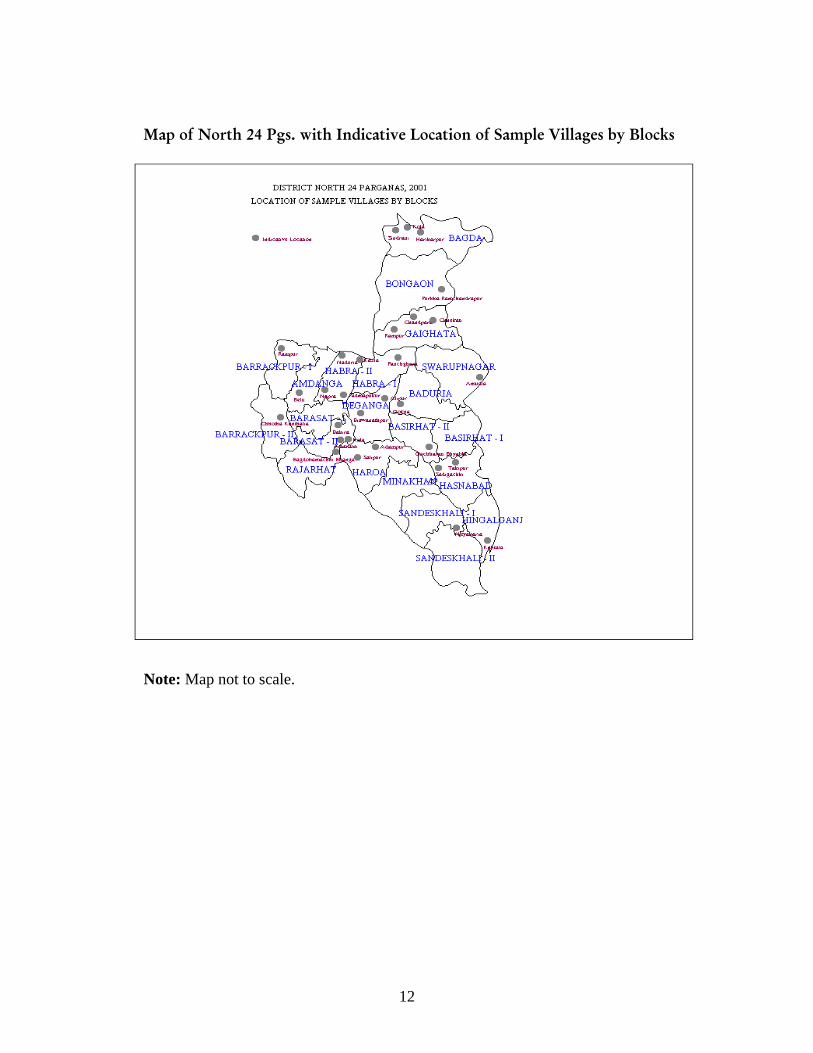
Map of North 24 Pgs. with Indicative Location of Sample Villages by Blocks
Note: Map not to scale.
12

Findings
In line with the aims and objectives of the Ministry of Minority Affairs, CSSSC has
identified the following key areas in the District of North 24 Parganas. We systematically
provide the district level followed by the village level findings on a variety of aspects including
the broad categories of Basic Amenities; Education; Health; Infrastructure; Occupational
conditions; Existence and Efficacy of Government Schemes and any other issue that is
crucial for a better understanding of the conditions of the minorities as well as general population
in the district. We provide two sets of tables – one for the data across villages to capture the
locational variation preceded by the district averages computed for all the households
surveyed in all the sample villages chosen in the district.
1. Basic Amenities
We begin with a distribution of the Basic Amenities in the district of North 24 Parganas
calculated at the level of villages using the household survey data and it includes the types and
percentage of houses under Kutcha/ Pucca constructions, percentage of electrified houses, the
average distance of each house within a specific village from its source of drinking water, the
percentage of houses in these villages with access to toilet facilities, and the type of fuel used. It
shows that the 83.55% Muslim households on average have in-house toilet facilities compared to
87.43% for non-Muslim households. This is quite good compared the state scenario as well as
for the variation across inter religious groups. However, there is a wide variation across villages.
The percentage of in-house toilet facility in Kalital in Hingalganj Block is found to be as low as
33%, over 55% in Nityabaria in Sandeshkhali I Block and Sadigachhi in Hasnabad Block and
over 69% in Takipur in Hasnabad Block (Table 2). The percentage of in-house toilet facility is
higher in the sample villages, such as Belu (6.67%), Kola (3.33%) which are relatively more
close to Kolkata and as a result receive more development facilities. Those who have toilet
facility inside their premises do have hygienic provision in general. In this connection it may be
noted that in our discussion with government officials and Panchayat functionaries this has been
emphasized that often it is the case that though a large fund is available for low cost toilet, but
people are reluctant to access such benefits even though their contribution is only 10%. So the
problem cannot be solved by allocating more funds only, but other measures, such as awareness
13
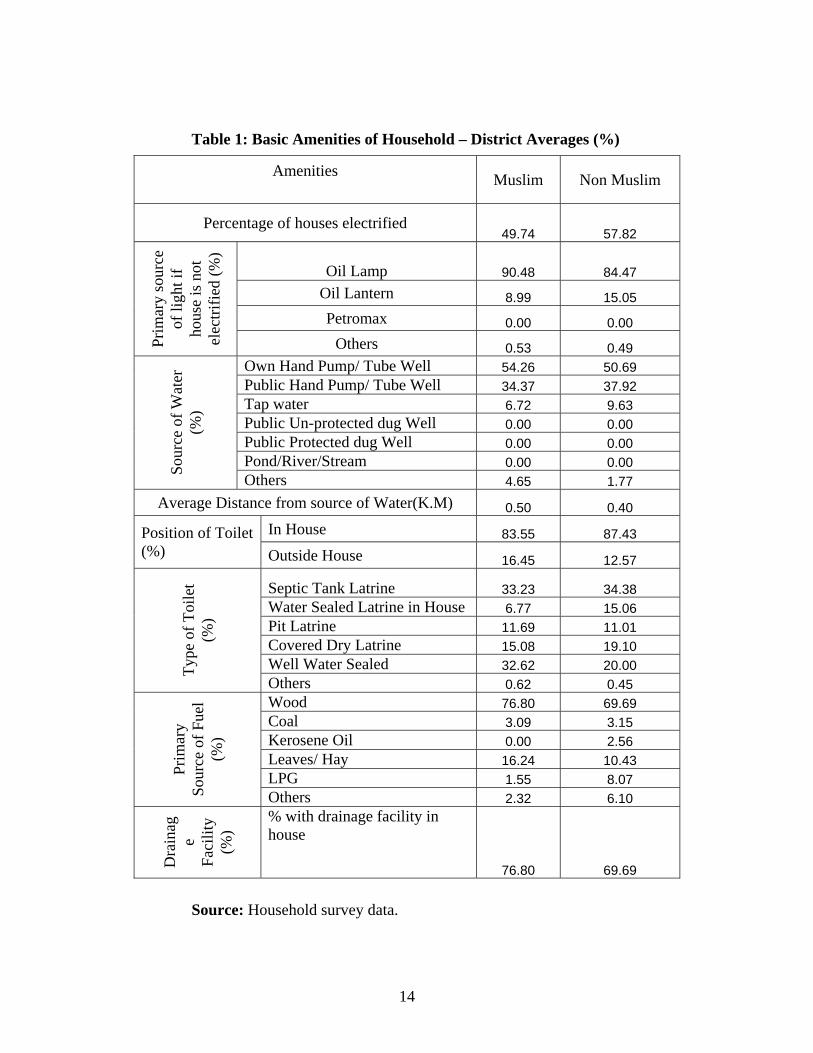
Table 1: Basic Amenities of Household – District Averages (%)
Amenities Muslim Non Muslim
Percentage of houses electrified 49.74 57.82
Oil Lamp 90.48 84.47 Oil Lantern 8.99 15.05 Petromax 0.00 0.00
Prim
ary
sour
ce
of li
ght i
f ho
use
is n
ot
elec
trifie
d (%
)
Others 0.53 0.49 Own Hand Pump/ Tube Well 54.26 50.69 Public Hand Pump/ Tube Well 34.37 37.92 Tap water 6.72 9.63 Public Un-protected dug Well 0.00 0.00 Public Protected dug Well 0.00 0.00 Pond/River/Stream 0.00 0.00 So
urce
of W
ater
(%
)
Others 4.65 1.77 Average Distance from source of Water(K.M) 0.50 0.40
In House 83.55 87.43 Position of Toilet (%) Outside House 16.45 12.57
Septic Tank Latrine 33.23 34.38 Water Sealed Latrine in House 6.77 15.06 Pit Latrine 11.69 11.01 Covered Dry Latrine 15.08 19.10 Well Water Sealed 32.62 20.00 Ty
pe o
f Toi
let
(%)
Others 0.62 0.45 Wood 76.80 69.69 Coal 3.09 3.15 Kerosene Oil 0.00 2.56 Leaves/ Hay 16.24 10.43 LPG 1.55 8.07
Prim
ary
Sour
ce o
f Fue
l (%
)
Others 2.32 6.10
Dra
inag
e Fa
cilit
y (%
)
% with drainage facility in house
76.80 69.69
Source: Household survey data.
14

Table 2: Village wise Basic Amenities of Households (in percentage)
Source: Village survey data.
Type of Houses Type of Fuel used Name of the Village Kutcha
Kutcha-Pucca
Pucca Avg. distance for source of
drinking water (Km.)
Electri- fied
houses
Households having Septic Tank
/water/Sealed/Well-water Latrine
Woo
d
Coa
l
Ker
ose
ne O
il
Leav
es/
Hay
LPG
Oth
ers
Toilet outside house
BELU 17.86 57.14 25.00 0.52 73.33 57.14 73.33 0.00 0.00 13.33 0.00 13.33 6.67SINDRANI 27.59 24.14 48.28 0.28 90.00 93.10 66.67 0.00 0.00 10.00 23.33 0.00 3.33KOLA 89.29 7.14 3.57 0.61 3.33 41.38 96.67 0.00 0.00 3.33 0.00 0.00 3.33
HARIHARPUR 70.00 23.33 6.67 0.20 0.00 26.67 96.67 0.00 0.00 3.33 0.00 0.00 0.00PURBBA RAMCHANDRAPUR 23.08 30.77 30.77 1.00 43.33 72.41 16.67 0.00 0.00 50.00 10.00 23.33 3.33RAMPUR 41.38 37.93 20.69 0.23 40.00 30.00 93.33 0.00 0.00 3.33 3.33 0.00 0.00CHANDPARA 62.07 0.00 34.48 0.04 100.00 70.00 50.00 20.00 0.00 0.00 30.00 0.00 0.00CHHEKATI 65.52 20.69 13.79 0.20 73.33 44.83 46.67 0.00 0.00 0.00 3.33 43.33 3.33AMUDIA 44.83 17.24 34.48 0.00 56.67 79.31 3.33 0.00 20.00 76.67 0.00 0.00 3.33PANCHGHARA 33.33 30.00 16.67 0.34 36.67 85.71 96.67 0.00 3.33 0.00 0.0 0.0 30.00NADURIA 72.41 20.69 6.90 0.40 40.00 53.33 93.33 3.33 0.00 3.33 0.0 0.0 0.00KAZLA 21.74 78.26 0.00 0.00 23.33 63.33 83.33 10.0 0.00 0.00 6.6 0.0 0.00
NAPRA 42.86 53.57 3.57 0.00 80.00 96.67 96.67 0.00 0.00 0.00 3.33 0.00 0.00PADMAPUKUR 36.67 60.00 3.33 0.00 70.00 100.00 93.33 0.00 0.00 0.00 6.67 0.00 0.00RAMPUR 34.48 27.59 37.93 0.57 70.00 76.67 63.33 3.33 0.00 20.0 10 3.3 0.00CHHOTHA KANTHALIA 3.45 48.28 48.28 1.25 86.67 53.33 70.00 3.33 0.00 0.00 26.67 0.00 0.00BAHIRA 28.57 0.00 71.43 0.00 96.67 100.00 100.00 0.00 0.00 0.00 0.00 0.00 0.00KAMDUNI 30.77 15.38 53.85 0.21 63.33 90.00 80.00 6.67 0.00 0.00 6.67 6.67 33.33KOLA 30.77 38.46 30.77 0.23 43.33 83.33 46.67 6.67 3.33 33.33 3.33 6.67 40.00BISWANATHPUR 26.67 46.67 26.67 0.14 63.33 55.17 93.33 0.00 0.00 0.00 6.67 0.00 0.00ALIPUR 50.00 50.00 0.00 0.00 76.67 65.52 93.33 0.00 0.00 3.33 0.00 0.00 3.33GOKNA 10.34 75.86 10.34 0.23 63.33 96.55 70.00 30.00 0.00 0.00 0.00 0.00 3.33GOCHHARATI BHYABLA 58.62 13.79 24.14 1.00 30.00 71.43 23.33 3.33 0.00 73.33 0.00 0.00 53.33SALIPUR 46.67 36.67 16.67 1.00 63.33 37.93 90.00 0.00 0.00 3.33 6.67 0.00 3.33ADAMPUR 79.31 0.00 20.69 0.36 3.33 52.94 16.67 0.00 10.00 66.67 0.00 6.67 43.33BAGDOBAMACHHI BHANGA 33.33 50.00 16.67 0.04 23.33 88.89 93.33 3.33 3.33 0.00 0.0 0.0 10.00NITYABARIA 26.67 63.33 10.00 0.64 100.00 100.00 93.33 3.33 0.00 0.00 3.33 0.00 43.33SADIGACHHI 63.33 23.33 13.33 0.29 63.33 100.00 86.67 0.00 3.33 3.33 6.67 0.00 43.33TAKIPUR 55.17 20.69 24.14 0.50 34.48 100.00 65.52 0.00 0.00 13.79 0.00 20.69 31.03KALITALA 96.67 0.00 3.33 0.58 0.00 100.00 83.33 0.00 0.00 6.67 0.00 10.00 66.67
Note: N.A means not available
15

and campaigning at the level of households is urgently called for. Compared to this, the level of
average electrification in the Muslim households is lower at 49.74 % compared to 57.82 % for
non-Muslim households. Once again at the village level, Hariharpur and Kalital report zero
percentage and Kola and Adampur report 3.33% of electrified households (Table 2) and there are
many villages in our sample with quite low level of electrification. For cooking fuel and other
households activities, most households are dependent on wood and stray sources, such as
gathered leaves and hay and barring a few villages as Sindrani, Chandpara and Chhota
Kanthhalia majority have access to LPG or even Kerosene. Most Muslim or non-Muslim
households have access to private hand pumps or tube wells or public tube wells or handpumps.
Usage of tap water is slightly higher for non-Muslims (9.63%) than Muslims (6.72%). In general
the district is well placed in respect of safe drinking water. The average distance traversed for
procurement of water is not much and in fact well within half Km. for both Muslims and non-
Muslims. All these information is directly available from Tables 1 and 2 and may be used for
specific actions.
There is however, scope for immense intervention in the types of houses the respondent
and therefore the average person in each village surveyed lives in. There is no village in our
sample which has more than 50% households with pucca houses. Proportion of pucca or even
kutcha-pucca houses are more prevalent in the relatively developed or in the areas that are close
to district head quarter or sub-divisional town. Not surprisingly therefore, majority of the villages
have kutcha houses and although 98.7% of Muslim and 96.2% of non-Muslim households own
their houses, only 1.04 % of the former and a little higher 2.8% of the latter received it under the
IAY (see Table 3). Housing condition appears by and large similar for the Muslim households
as compared to non-Muslims, as on average 45.26 % of Muslim compared to 44.05% of non-
Muslim houses live in kutcha houses, 37.37% of Muslims and 28.18% of non-Muslims live in
kutcha-pucca houses. Of the pucca houses across villages in North 24 Parganas, 16.58% belong
to Muslims and 25.89% belong to non-Muslims.7 This we believe should be an area where top
up facilities may be extended. It is understood that construction and maintenance of better
houses require large investments from the residents, which if channeled into provision of
education and health facilities among the children and women shall serve a better purpose under
7 This is percentage with respect to the general population. The same as the percentage of BPL families for the district as a whole is 2.95%.
16
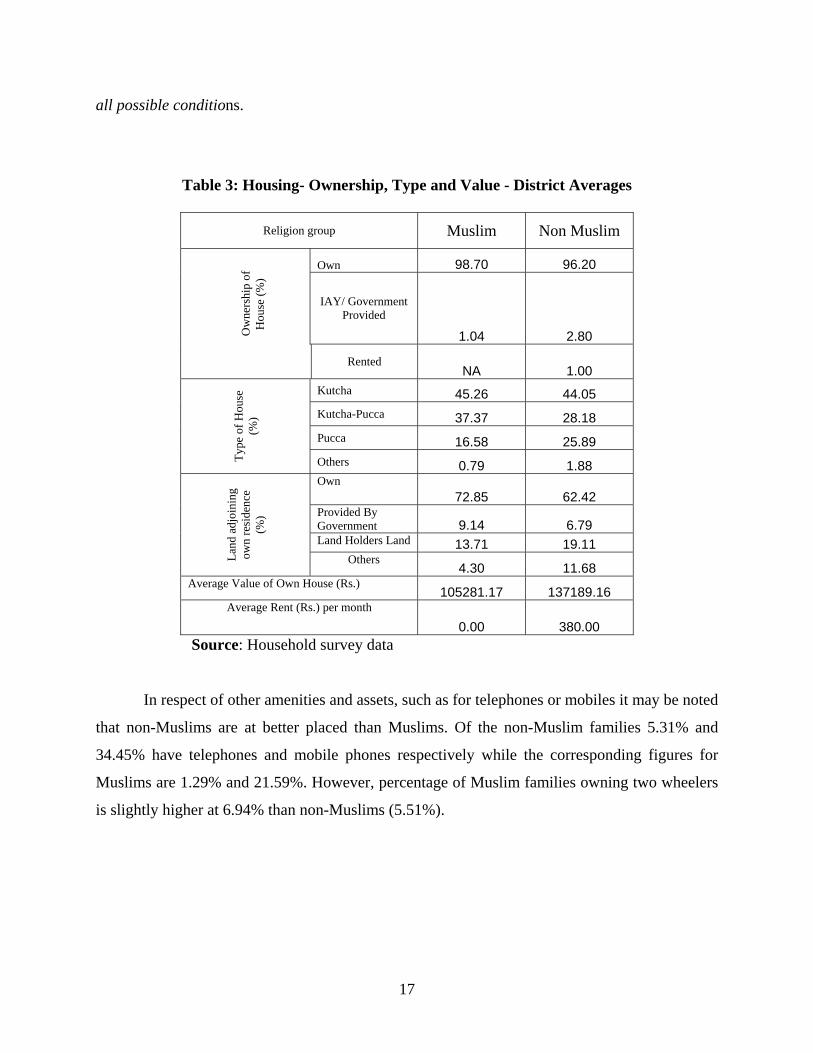
all possible conditions.
Table 3: Housing- Ownership, Type and Value - District Averages
Religion group Muslim Non Muslim
Own 98.70 96.20
Ow
ners
hip
of
Hou
se (%
)
IAY/ Government Provided
1.04 2.80
Rented NA 1.00
Kutcha 45.26 44.05 Kutcha-Pucca 37.37 28.18 Pucca 16.58 25.89
Ty
pe o
f Hou
se
(%)
Others 0.79 1.88 Own
72.85 62.42 Provided By Government 9.14 6.79 Land Holders Land 13.71 19.11
Land
adj
oini
ng
own
resi
denc
e (%
)
Others 4.30 11.68
Average Value of Own House (Rs.) 105281.17 137189.16
Average Rent (Rs.) per month
0.00 380.00 Source: Household survey data In respect of other amenities and assets, such as for telephones or mobiles it may be noted
that non-Muslims are at better placed than Muslims. Of the non-Muslim families 5.31% and
34.45% have telephones and mobile phones respectively while the corresponding figures for
Muslims are 1.29% and 21.59%. However, percentage of Muslim families owning two wheelers
is slightly higher at 6.94% than non-Muslims (5.51%).
17
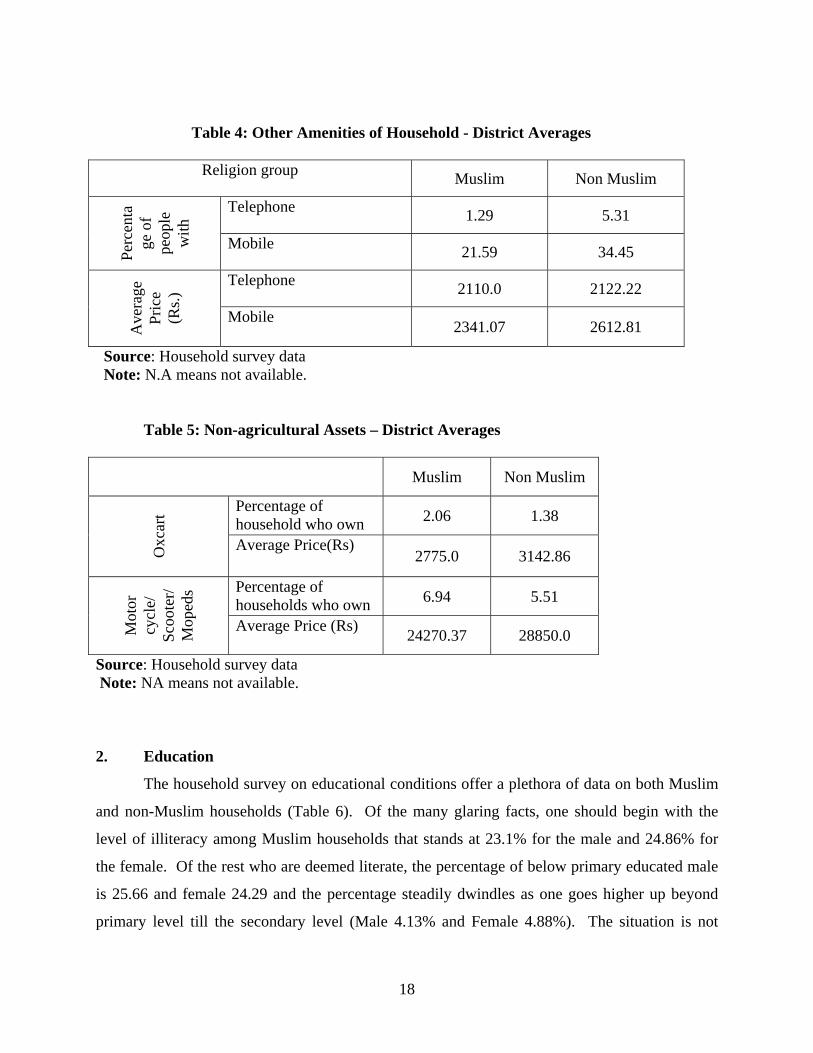
Table 4: Other Amenities of Household - District Averages
Religion group Muslim Non Muslim
Telephone 1.29 5.31
Perc
enta
ge o
f pe
ople
w
ith
Mobile 21.59 34.45
Telephone 2110.0 2122.22
Ave
rage
Pr
ice
(Rs.)
Mobile 2341.07 2612.81
Source: Household survey data Note: N.A means not available.
Table 5: Non-agricultural Assets – District Averages
Muslim Non Muslim
Percentage of household who own 2.06 1.38
Oxc
art
Average Price(Rs) 2775.0 3142.86
Percentage of households who own 6.94 5.51
Mot
or
cycl
e/
Scoo
ter/
Mop
eds
Average Price (Rs) 24270.37 28850.0
Source: Household survey data Note: NA means not available. 2. Education
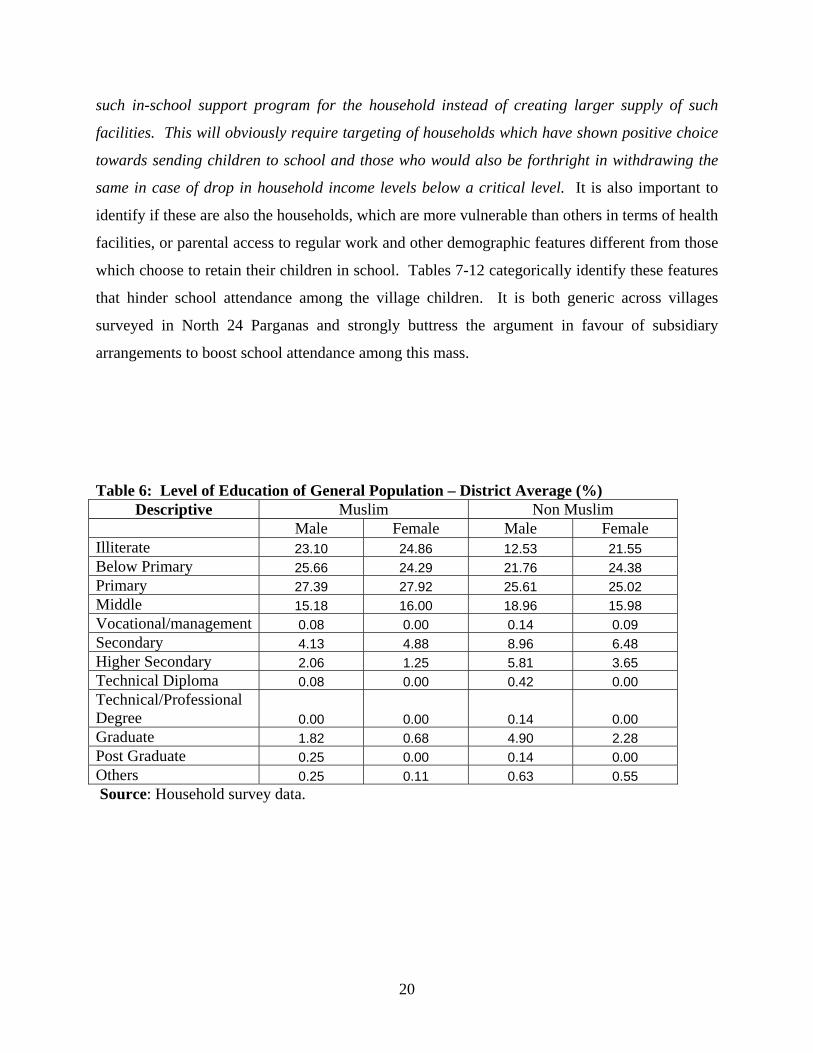
The household survey on educational conditions offer a plethora of data on both Muslim
and non-Muslim households (Table 6). Of the many glaring facts, one should begin with the
level of illiteracy among Muslim households that stands at 23.1% for the male and 24.86% for
the female. Of the rest who are deemed literate, the percentage of below primary educated male
is 25.66 and female 24.29 and the percentage steadily dwindles as one goes higher up beyond
primary level till the secondary level (Male 4.13% and Female 4.88%). The situation is not
18
appreciably better for non-Muslim households, where literacy level is certainly higher, but
secondary school going percentage for male is 8.96 and female, 6.48. It seems almost self-
selection among those who could continue to the highest possible level of graduation – those
who stayed onto the higher secondary level also continued till graduation and at that point the
disparity across Muslim and non-Muslim households almost vanishes as does the gender gap
across religions.
Table 9 clearly identifies the reasons why the dropout rates have been so high for most
school goers. On average 40% of all dropouts across villages in the district of North 24 Parganas
report that the cost of remaining in school is quite high – both the direct cost and the indirect cost
of not earning anything while in school. Despite the fact that distance wise, most Muslim
(65.91%) and non Muslims (59%) households find the school almost in the neighbourhood
within a distance of 1 km, continuation becomes infeasible at a very early stage due to the high
opportunity cost (next best alternative to school is go out for work and earn for the family) of
being in school. This also, is a potential point of intervention where without stressing on the
supply of schools, the emphasis should be on creating parental demand for sending children to
school. We do not think mid-day meal alone can address this problem successfully, because the
respondents clearly voiced their positions on the choice between school and work and the only
way they could continue in school is providing the household sending children to school with a
subsidy equivalent to the income they would lose by not working during that time. Conversely,
if the families that send children to school receive higher income from their existing jobs that
may relax the constraint facing these children intending to attend school on a longer term. We
therefore, re-emphasize that this is an area although well known to both academic and policy-
making communities need larger attention. What we propose is that the households that choose
to send children to school may be provided with additional income support during the school
years so that the student does not drop out and transform into child labour. In fact, provisions of
such facilities in kind are already in practice, and include the mid-day meal arrangements
although with several problems of mismanagement and corruption among the organizers that the
scheme regularly suffers from. Still it does not take care of the opportunity cost in full, since it is
well known that putting children in the work force is essentially a decision taken by one or both
parents under the condition that children’s leisure is a luxury good under dire necessity of
survival for the household. Thus, we would like to draw attention to policies that can ensure
19
such in-school support program for the household instead of creating larger supply of such
facilities. This will obviously require targeting of households which have shown positive choice
towards sending children to school and those who would also be forthright in withdrawing the
same in case of drop in household income levels below a critical level. It is also important to
identify if these are also the households, which are more vulnerable than others in terms of health
facilities, or parental access to regular work and other demographic features different from those
which choose to retain their children in school. Tables 7-12 categorically identify these features
that hinder school attendance among the village children. It is both generic across villages
surveyed in North 24 Parganas and strongly buttress the argument in favour of subsidiary
arrangements to boost school attendance among this mass.
Table 6: Level of Education of General Population – District Average (%) Descriptive Muslim Non Muslim
Male Female Male Female Illiterate 23.10 24.86 12.53 21.55 Below Primary 25.66 24.29 21.76 24.38 Primary 27.39 27.92 25.61 25.02 Middle 15.18 16.00 18.96 15.98 Vocational/management 0.08 0.00 0.14 0.09 Secondary 4.13 4.88 8.96 6.48 Higher Secondary 2.06 1.25 5.81 3.65 Technical Diploma 0.08 0.00 0.42 0.00 Technical/Professional Degree 0.00 0.00 0.14 0.00 Graduate 1.82 0.68 4.90 2.28 Post Graduate 0.25 0.00 0.14 0.00 Others 0.25 0.11 0.63 0.55 Source: Household survey data.
20

Table 7: State of Education for 5 to 18 age group – District Averages (%)
Muslim Non Muslim Condition Not admitted to school 2.16 0.55
Below primary education 29.20 27.62 Primary education 44.82 41.44 Class Eight 17.32 15.47 Vocational 0.34 0.00 Secondary 5.43 11.79
Leve
l
Higher Secondary 1.70 3.31 Government/ Aided School 95.18 95.20
Private School 3.44 3.87
Madrasah 1.03 0.00 Missionary School 0.00 0.55 Unconventional school 0.34 0.37
Type
of s
choo
l
Others 0.00 0.00
Source: Household survey data.
21
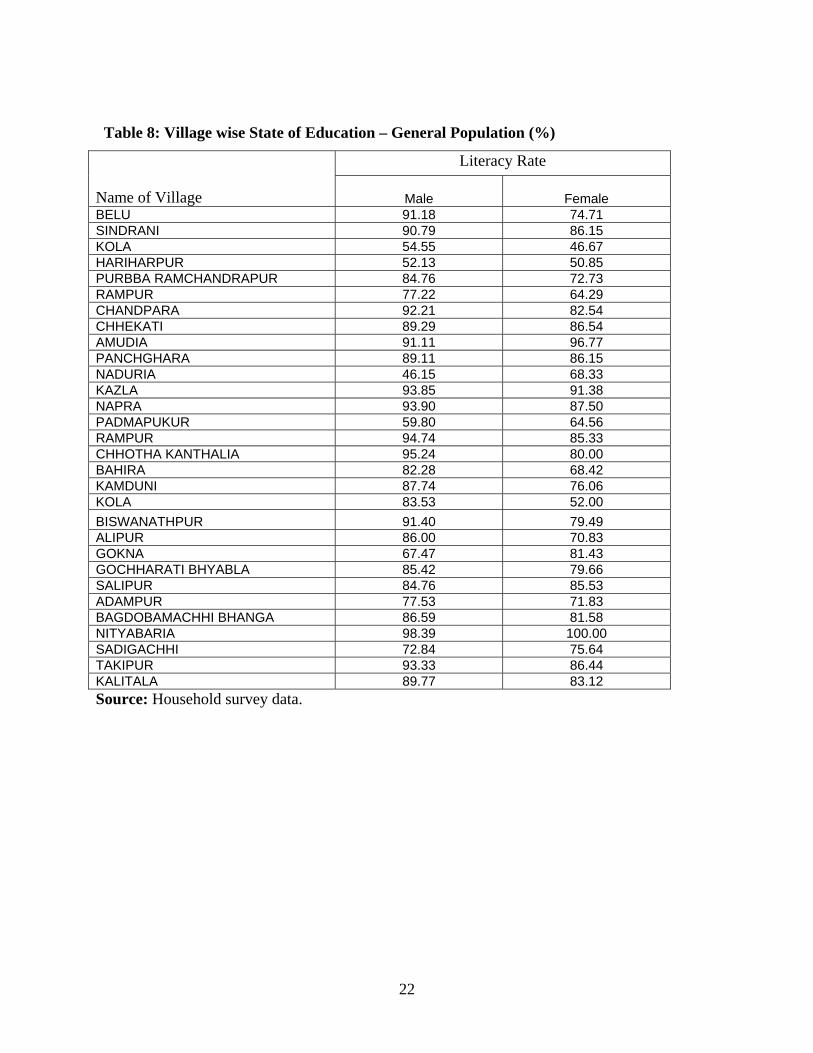
Table 8: Village wise State of Education – General Population (%)
Literacy Rate Name of Village Male Female BELU 91.18 74.71 SINDRANI 90.79 86.15 KOLA 54.55 46.67 HARIHARPUR 52.13 50.85 PURBBA RAMCHANDRAPUR 84.76 72.73 RAMPUR 77.22 64.29 CHANDPARA 92.21 82.54 CHHEKATI 89.29 86.54 AMUDIA 91.11 96.77 PANCHGHARA 89.11 86.15 NADURIA 46.15 68.33 KAZLA 93.85 91.38 NAPRA 93.90 87.50 PADMAPUKUR 59.80 64.56 RAMPUR 94.74 85.33 CHHOTHA KANTHALIA 95.24 80.00 BAHIRA 82.28 68.42 KAMDUNI 87.74 76.06 KOLA 83.53 52.00 BISWANATHPUR 91.40 79.49 ALIPUR 86.00 70.83 GOKNA 67.47 81.43 GOCHHARATI BHYABLA 85.42 79.66 SALIPUR 84.76 85.53 ADAMPUR 77.53 71.83 BAGDOBAMACHHI BHANGA 86.59 81.58 NITYABARIA 98.39 100.00 SADIGACHHI 72.84 75.64 TAKIPUR 93.33 86.44 KALITALA 89.77 83.12 Source: Household survey data.
22
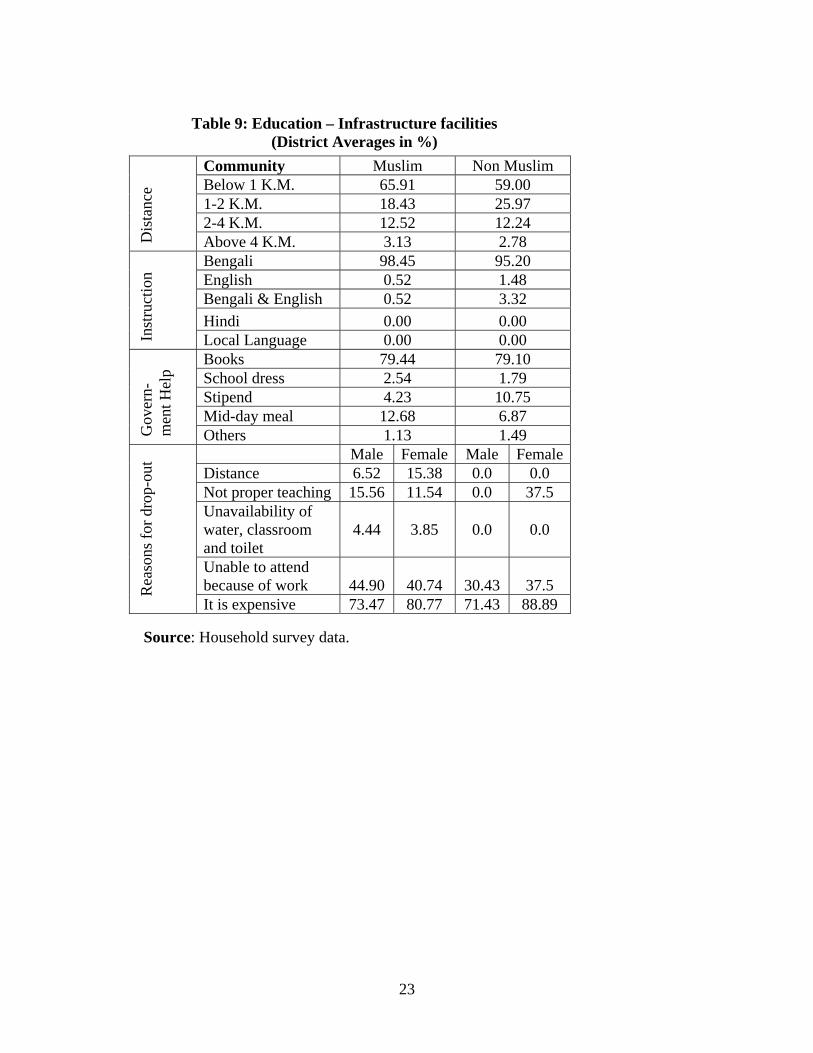
Table 9: Education – Infrastructure facilities
(District Averages in %)
Community Muslim Non Muslim Below 1 K.M. 65.91 59.00 1-2 K.M. 18.43 25.97 2-4 K.M. 12.52 12.24
Dis
tanc
e
Above 4 K.M. 3.13 2.78 Bengali 98.45 95.20 English 0.52 1.48 Bengali & English 0.52 3.32 Hindi 0.00 0.00
Inst
ruct
ion
Local Language 0.00 0.00 Books 79.44 79.10 School dress 2.54 1.79 Stipend 4.23 10.75 Mid-day meal 12.68 6.87
Gov
ern-
m
ent H
elp
Others 1.13 1.49 Male Female Male FemaleDistance 6.52 15.38 0.0 0.0 Not proper teaching 15.56 11.54 0.0 37.5 Unavailability of water, classroom and toilet
4.44 3.85 0.0 0.0
Unable to attend because of work 44.90 40.74 30.43 37.5 R
easo
ns fo
r dro
p-ou
t
It is expensive 73.47 80.77 71.43 88.89
Source: Household survey data.
23

Table 10: Education - Infrastructure and Aspirations (%) (Community wise District Averages)
Muslim Non Muslim Regularity 87.24 77.01
Taste 57.87 61.50 Mid-day meal
Cleanliness 58.38 62.23 Book Availability 73.22 68.25
Regularity 93.31 95.07 Discipline 94.88 96.03
Teachers
Teaching 64.31 74.01 Male Female Male Female
Vocational 3.60 1.25 2.02 0.41 Madhyamik 29.86 52.50 18.18 40.57
H.S 20.50 20.00 19.53 17.62 Graduate 29.50 17.50 31.65 24.18
Post-Graduate 6.47 5.42 12.79 9.43 Professional
Courses 5.40 1.67 12.79 6.56
Aspiration of parents
Others 4.68 1.67 3.03 1.23
Source: Household survey data.
Table 11: Rate of Dropout from School – Community and Gender wise(%)
(District Averages) Muslim Non Muslim Level of dropout Male Female Male Female < Primary 15.22 30.0 12.0 17.65 <Class Eight 71.74 70.0 76.0 70.59
Source: Household Survey Data
24
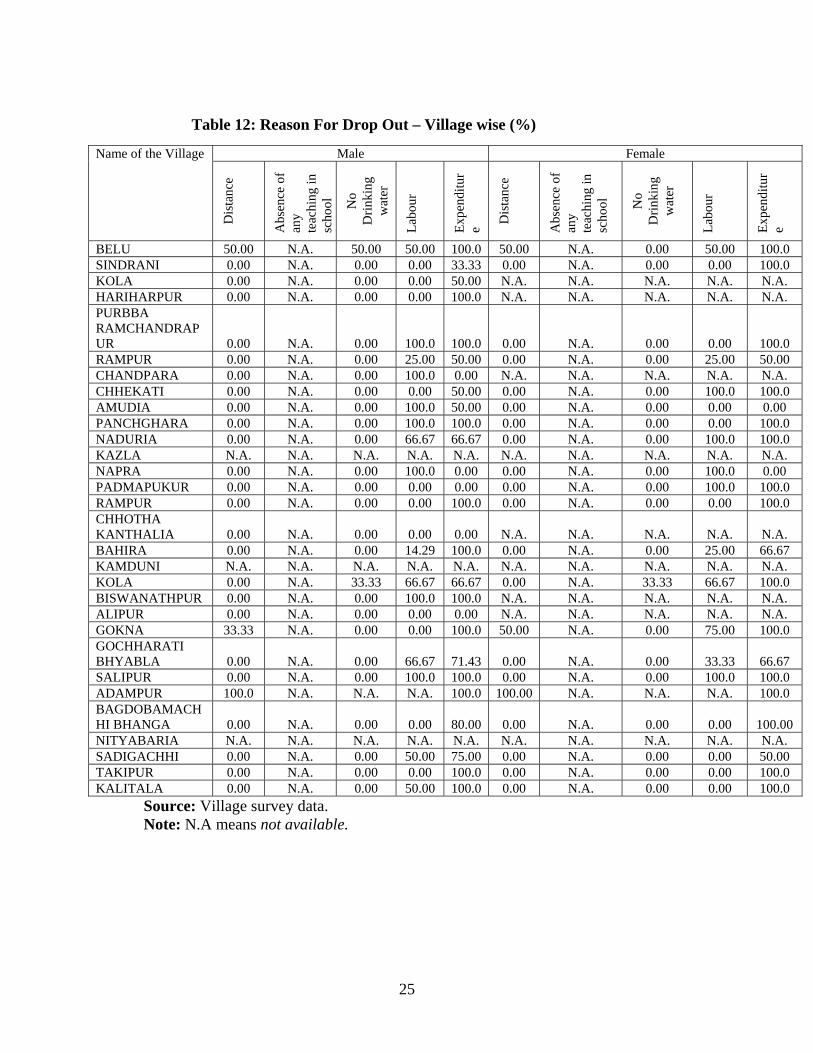
Table 12: Reason For Drop Out – Village wise (%)
Source: Village survey data.
Male Female Name of the Village
Dis
tanc
e
Abs
ence
of
any
teac
hing
in
scho
ol
No
Drin
king
w
ater
Labo
ur
Expe
nditu
re D
ista
nce
Abs
ence
of
any
teac
hing
in
scho
ol
No
Drin
king
w
ater
La
bour
Expe
nditu
re
BELU 50.00 N.A. 50.00 50.00 100.0 50.00 N.A. 0.00 50.00 100.0 SINDRANI 0.00 N.A. 0.00 0.00 33.33 0.00 N.A. 0.00 0.00 100.0 KOLA 0.00 N.A. 0.00 0.00 50.00 N.A. N.A. N.A. N.A. N.A. HARIHARPUR 0.00 N.A. 0.00 0.00 100.0 N.A. N.A. N.A. N.A. N.A. PURBBA RAMCHANDRAPUR 0.00 N.A. 0.00 100.0 100.0 0.00 N.A. 0.00 0.00 100.0 RAMPUR 0.00 N.A. 0.00 25.00 50.00 0.00 N.A. 0.00 25.00 50.00 CHANDPARA 0.00 N.A. 0.00 100.0 0.00 N.A. N.A. N.A. N.A. N.A. CHHEKATI 0.00 N.A. 0.00 0.00 50.00 0.00 N.A. 0.00 100.0 100.0 AMUDIA 0.00 N.A. 0.00 100.0 50.00 0.00 N.A. 0.00 0.00 0.00 PANCHGHARA 0.00 N.A. 0.00 100.0 100.0 0.00 N.A. 0.00 0.00 100.0 NADURIA 0.00 N.A. 0.00 66.67 66.67 0.00 N.A. 0.00 100.0 100.0 KAZLA N.A. N.A. N.A. N.A. N.A. N.A. N.A. N.A. N.A. N.A. NAPRA 0.00 N.A. 0.00 100.0 0.00 0.00 N.A. 0.00 100.0 0.00 PADMAPUKUR 0.00 N.A. 0.00 0.00 0.00 0.00 N.A. 0.00 100.0 100.0 RAMPUR 0.00 N.A. 0.00 0.00 100.0 0.00 N.A. 0.00 0.00 100.0 CHHOTHA KANTHALIA 0.00 N.A. 0.00 0.00 0.00 N.A. N.A. N.A. N.A. N.A. BAHIRA 0.00 N.A. 0.00 14.29 100.0 0.00 N.A. 0.00 25.00 66.67 KAMDUNI N.A. N.A. N.A. N.A. N.A. N.A. N.A. N.A. N.A. N.A. KOLA 0.00 N.A. 33.33 66.67 66.67 0.00 N.A. 33.33 66.67 100.0 BISWANATHPUR 0.00 N.A. 0.00 100.0 100.0 N.A. N.A. N.A. N.A. N.A. ALIPUR 0.00 N.A. 0.00 0.00 0.00 N.A. N.A. N.A. N.A. N.A. GOKNA 33.33 N.A. 0.00 0.00 100.0 50.00 N.A. 0.00 75.00 100.0 GOCHHARATI BHYABLA 0.00 N.A. 0.00 66.67 71.43 0.00 N.A. 0.00 33.33 66.67 SALIPUR 0.00 N.A. 0.00 100.0 100.0 0.00 N.A. 0.00 100.0 100.0 ADAMPUR 100.0 N.A. N.A. N.A. 100.0 100.00 N.A. N.A. N.A. 100.0 BAGDOBAMACHHI BHANGA 0.00 N.A. 0.00 0.00 80.00 0.00 N.A. 0.00 0.00 100.00 NITYABARIA N.A. N.A. N.A. N.A. N.A. N.A. N.A. N.A. N.A. N.A. SADIGACHHI 0.00 N.A. 0.00 50.00 75.00 0.00 N.A. 0.00 0.00 50.00 TAKIPUR 0.00 N.A. 0.00 0.00 100.0 0.00 N.A. 0.00 0.00 100.0 KALITALA 0.00 N.A. 0.00 50.00 100.0 0.00 N.A. 0.00 0.00 100.0
Note: N.A means not available.
25
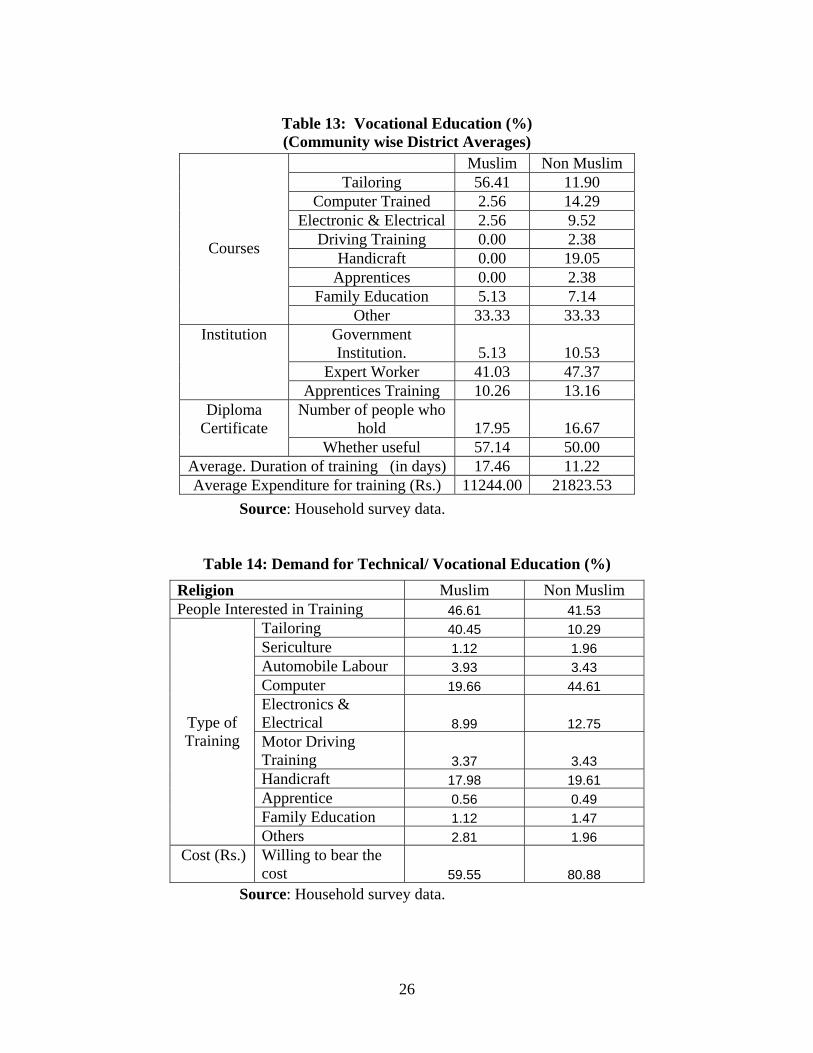
Table 13: Vocational Education (%) (Community wise District Averages)
Muslim Non Muslim Tailoring 56.41 11.90
Computer Trained 2.56 14.29 Electronic & Electrical 2.56 9.52
Driving Training 0.00 2.38 Handicraft 0.00 19.05
Apprentices 0.00 2.38 Family Education 5.13 7.14
Courses
Other 33.33 33.33 Government Institution. 5.13 10.53
Expert Worker 41.03 47.37
Institution
Apprentices Training 10.26 13.16 Number of people who
hold 17.95 16.67 Diploma
Certificate Whether useful 57.14 50.00
Average. Duration of training (in days) 17.46 11.22 Average Expenditure for training (Rs.) 11244.00 21823.53
Source: Household survey data.
Table 14: Demand for Technical/ Vocational Education (%)
Source: Household survey data.
Religion Muslim Non Muslim People Interested in Training 46.61 41.53
Tailoring 40.45 10.29 Sericulture 1.12 1.96 Automobile Labour 3.93 3.43 Computer 19.66 44.61 Electronics & Electrical 8.99 12.75 Motor Driving Training 3.37 3.43 Handicraft 17.98 19.61 Apprentice 0.56 0.49 Family Education 1.12 1.47
Type of Training
Others 2.81 1.96 Cost (Rs.) Willing to bear the
cost 59.55 80.88
26

Table 15: Village wise Demand for Technical/Vocational Education (in %)
Peop
le w
illin
g to
be
ar th
e co
st
Peop
le
inte
rest
ed
intra
inin
g
Name of the Village
Tailo
ring
Seric
ultu
re
Aut
omob
ile
Labo
ur
Com
pute
r Tr
aini
ng
Elec
troni
cs &
El
ectri
cal
Mot
or D
rivin
g
Han
dicr
aft
App
rent
ice
Fam
ily E
duca
tion
Oth
ers
BELU 60.00 72.22 27.78 5.56 5.56 22.22 0.00 5.56 16.67 0.00 16.67 0.00
SINDRANI 40.00 83.33 16.67 0.00 8.33 58.33 0.00 0.00 8.33 0.00 0.00 8.33
KOLA 63.33 89.47 0.00 0.00 5.26 78.95 0.00 10.53 0.00 0.00 0.00 5.26
HARIHARPUR 10.00 100.00 0.00 0.00 0.00 100.00 0.00 0.00 0.00 0.00 0.00 0.00 PURBBA RAMCHANDRAPUR 50.00 93.33 21.43 7.14 0.00 7.14 28.57 0.00 21.43 7.14 7.14 0.00
RAMPUR 26.67 25.00 0.00 0.00 0.00 75.00 0.00 0.00 25.00 0.00 0.00 0.00
CHANDPARA 66.67 90.00 10.00 0.00 0.00 65.00 10.00 5.00 10.00 0.00 0.00 0.00
CHHEKATI 3.33 100.00 100.00 0.00 0.00 0.00 0.00 0.00 0.00 0.00 0.00 0.00
AMUDIA 45.83 30.00 10.00 0.00 20.00 50.00 20.00 0.00 0.00 0.00 0.00 0.00
PANCHGHARA 93.33 100.00 3.57 0.00 0.00 32.14 3.57 0.00 57.14 3.57 0.00 0.00
NADURIA 0.00 N.A. N.A. N.A. N.A. N.A. N.A. N.A. N.A. N.A. N.A. N.A.
KAZLA 39.29 80.00 9.09 9.09 0.00 54.55 9.09 0.00 18.18 0.00 0.00 0.00
NAPRA 0.00 N.A. N.A. N.A. N.A. N.A. N.A. N.A. N.A. N.A. N.A. N.A.
PADMAPUKUR 23.33 28.57 14.29 0.00 0.00 57.14 14.29 14.29 0.00 0.00 0.00 0.00
RAMPUR 0.00 N.A. N.A. N.A. N.A. N.A. N.A. N.A. N.A. N.A. N.A. N.A. CHHOTHA KANTHALIA 56.67 100.00 11.76 5.88 0.00 41.18 11.76 11.76 17.65 0.00 0.00 0.00
BAHIRA 81.48 59.09 0.00 0.00 0.00 31.82 68.18 0.00 0.00 0.00 0.00 0.00
KAMDUNI 31.03 88.89 0.00 0.00 0.00 33.33 55.56 0.00 11.11 0.00 0.00 0.00
KOLA 61.54 80.00 6.25 0.00 0.00 62.50 0.00 0.00 31.25 0.00 0.00 0.00
BISWANATHPUR 46.67 92.86 21.43 0.00 7.14 42.86 0.00 7.14 14.29 0.00 7.14 0.00
ALIPUR 0.00 N.A. N.A. N.A. N.A. N.A. N.A. N.A. N.A. N.A. N.A. N.A.
GOKNA 82.14 17.39 73.91 0.00 0.00 8.70 0.00 0.00 13.04 0.00 0.00 4.35 GOCHHARATI BHYABLA 70.00 42.86 61.90 0.00 4.76 9.52 0.00 0.00 19.05 0.00 0.00 4.76
SALIPUR 26.67 87.50 12.50 12.50 0.00 37.50 25.00 0.00 12.50 0.00 0.00 0.00
ADAMPUR 10.00 66.67 50.00 0.00 0.00 0.00 0.00 0.00 50.00 0.00 0.00 0.00 BAGDOBAMACHHI BHANGA 100.00 13.33 66.67 3.33 0.00 3.33 6.67 3.33 16.67 0.00 0.00 0.00
NITYABARIA 55.17 100.00 50.00 0.00 18.75 18.75 0.00 12.50 0.00 0.00 0.00 0.00
SADIGACHHI 43.33 84.62 46.15 0.00 0.00 15.38 15.38 7.69 15.38 0.00 0.00 0.00
TAKIPUR 62.07 88.89 5.56 0.00 5.56 27.78 0.00 5.56 27.78 0.00 0.00 27.78
KALITALA 73.33 90.91 13.64 0.00 13.64 9.09 13.64 0.00 50.00 0.00 0.00 0.00
Source: Village survey data Note: N.A means not available
27
The demand for technical and vocational training also reflects the significant gap that
exists between agricultural and non-agricultural work participation in the villages surveyed. The
predominance of casual workforce in agriculture and allied occupations among the working
population clearly displays the lack of skill in both religious groups. Given the findings on
educational choices and preferences it is undoubtedly related that the population strongly prefers
the supply of such training facilities to replace or add on to the general educational trainings. In
fact, the overwhelming demand for computer training (among the non-Muslims while Muslims
have highest demand for tailoring) epitomizes the awareness, even if incomplete, of the
beckoning possibilities in this new era of electronics and information technologies. While a
higher literacy rate is a definite precursor for even partial awareness in this regard, the need for
technical education is a certain emphasis among the potential workforce that should not be
downplayed under any circumstances. The public funds must be allocated towards provision of
such facilities in the areas covered in this study.
3. Occupation
It is readily revealed by the tables below (Tables 16 through 19) that agriculture is the
major source of livelihood for both the communities, either as cultivator or as landless
agricultural labourers. Interestingly like many other districts of West Bengal, Muslim
participation in government jobs is lower to other communities in this district, though the
percentage of such employees is quite small. More impoverished villages are also the ones with
largest participation in casual agricultural work. However, across communities there is very
little female participation in work although there is a sizable share in both Muslim and non-
Muslim communities who do not classify as either in full time or casual jobs or purely engaged
in household maintenance. Given the fact that major source of occupation is agriculture it only
reflects disguised unemployment in agriculture leading to effectively low productivity. The share
of migrant workers is quite sizable (Table 17) and about 4% of all migrant workers even work
abroad. Across religion there is heterogeneity in the type of occupation the migrant workers get
involved in, but there is homogeneity across religious groups in respect of locations (about 50%
of Muslims and non Muslims migrate to towns outside the province of West Bengal). These
systematically indicate the lack of opportunities in the province and that even traditional migrant
28

pullers like the city of Kolkata has become less attractive to job seekers from the villages.
Table 16: Work participation – Community wise District Averages (%)
Source: Household survey data
Muslim Non Muslim Male Female Male Female
Agriculture 19.18 0.56 18.82 1.37 Agricultural Labour 17.46 1.35 12.95 1.37 Family Business 5.25 0.00 5.32 0.36 Salaried Employee (Govt.) 0.25 0.00 3.36 4.11 Salaried Employee (Private) 2.87 0.34 3.92 0.36 Casual Labour 3.93 0.00 5.88 1.00 Domestic and related work 0.82 55.47 1.26 49.45 Retirees, Pensioners, Remittance Recipient 0.33 0.23 0.77 0.46 Unable to work (Child/ Elderly) 8.28 9.58 8.54 11.59 Unorganised Employee 11.80 1.35 10.22 2.28 Student 23.61 28.97 22.60 24.27 Others 2.70 0.34 3.01 2.10 Unemployed 3.52 1.80 3.36 1.28
29

Table 17: Migration for Work – Community wise District Averages (%)
Muslim Non Muslim Short Term 37.93 46.34
Duration
Long Term 62.07 51.22 Within District (Village) 3.45 0.00 Within District (Town) 6.90 2.44 Within State (Village) 6.90 7.32 Within State (Town) 27.59 31.71 Outside State (Village) 0.00 2.44 Outside State (Town) 51.72 51.22
Place of work
Abroad 3.45 4.88 Professional Work 27.59 17.07 Administrative Work 3.45 21.95 Clerical Work 3.45 2.44 Sales Work 10.34 2.44 Farmer 0.00 2.44 Transport and labourers 37.93 39.02 Student 3.45 7.32
Reasons for migration
Others 13.79 7.32 Repatriation Household 77.78 83.78
Source: Household survey data
30
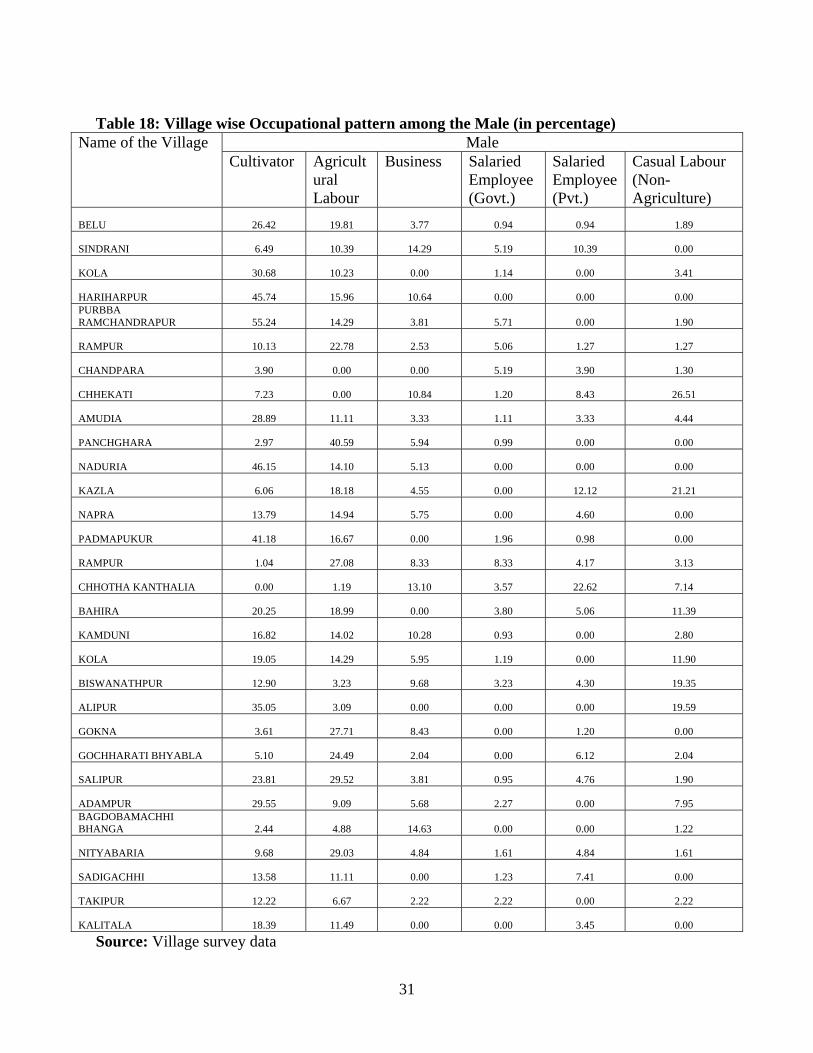
Table 18: Village wise Occupational pattern among the Male (in percentage)
Male Name of the Village Cultivator Agricult
ural Labour
Business Salaried Employee (Govt.)
Salaried Employee (Pvt.)
Casual Labour (Non-Agriculture)
BELU 26.42 19.81 3.77 0.94 0.94 1.89
SINDRANI 6.49 10.39 14.29 5.19 10.39 0.00
KOLA 30.68 10.23 0.00 1.14 0.00 3.41
HARIHARPUR 45.74 15.96 10.64 0.00 0.00 0.00 PURBBA RAMCHANDRAPUR 55.24 14.29 3.81 5.71 0.00 1.90
RAMPUR 10.13 22.78 2.53 5.06 1.27 1.27
CHANDPARA 3.90 0.00 0.00 5.19 3.90 1.30
CHHEKATI 7.23 0.00 10.84 1.20 8.43 26.51
AMUDIA 28.89 11.11 3.33 1.11 3.33 4.44
PANCHGHARA 2.97 40.59 5.94 0.99 0.00 0.00
NADURIA 46.15 14.10 5.13 0.00 0.00 0.00
KAZLA 6.06 18.18 4.55 0.00 12.12 21.21
NAPRA 13.79 14.94 5.75 0.00 4.60 0.00
PADMAPUKUR 41.18 16.67 0.00 1.96 0.98 0.00
RAMPUR 1.04 27.08 8.33 8.33 4.17 3.13
CHHOTHA KANTHALIA 0.00 1.19 13.10 3.57 22.62 7.14
BAHIRA 20.25 18.99 0.00 3.80 5.06 11.39
KAMDUNI 16.82 14.02 10.28 0.93 0.00 2.80
KOLA 19.05 14.29 5.95 1.19 0.00 11.90
BISWANATHPUR 12.90 3.23 9.68 3.23 4.30 19.35
ALIPUR 35.05 3.09 0.00 0.00 0.00 19.59
GOKNA 3.61 27.71 8.43 0.00 1.20 0.00
GOCHHARATI BHYABLA 5.10 24.49 2.04 0.00 6.12 2.04
SALIPUR 23.81 29.52 3.81 0.95 4.76 1.90
ADAMPUR 29.55 9.09 5.68 2.27 0.00 7.95 BAGDOBAMACHHI BHANGA 2.44 4.88 14.63 0.00 0.00 1.22
NITYABARIA 9.68 29.03 4.84 1.61 4.84 1.61
SADIGACHHI 13.58 11.11 0.00 1.23 7.41 0.00
TAKIPUR 12.22 6.67 2.22 2.22 0.00 2.22
KALITALA 18.39 11.49 0.00 0.00 3.45 0.00
Source: Village survey data
31
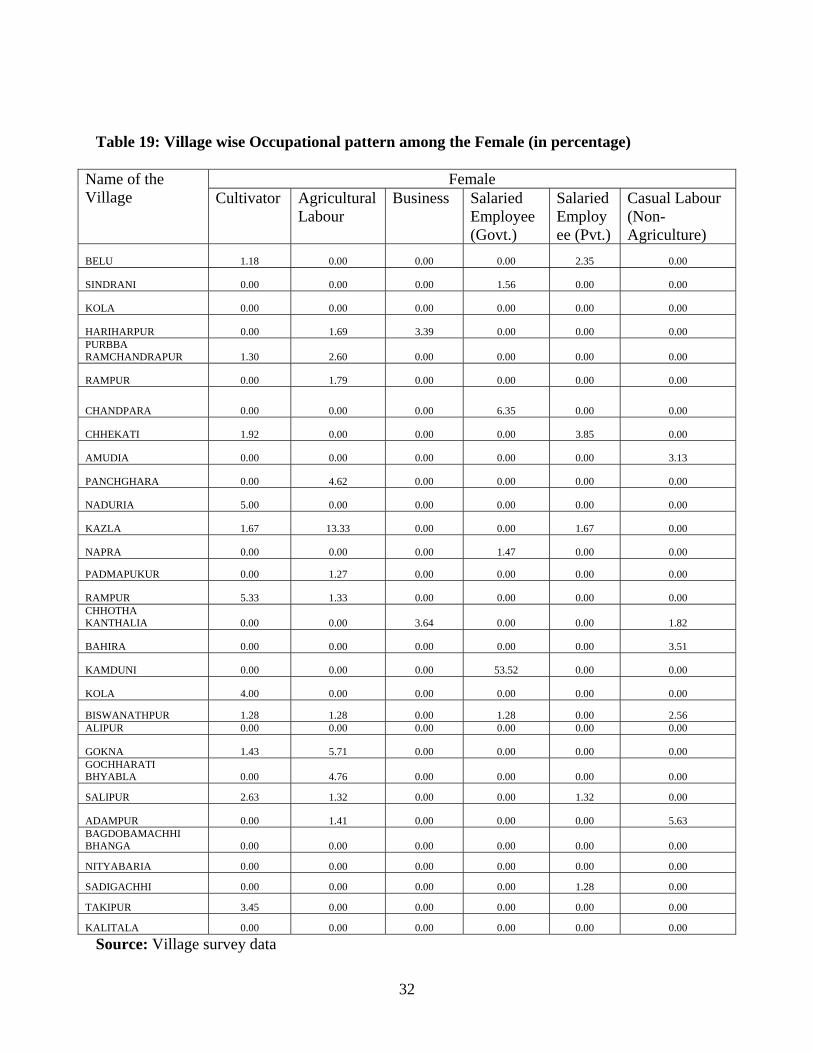
Table 19: Village wise Occupational pattern among the Female (in percentage)
Female Name of the Village Cultivator Agricultural
Labour Business Salaried
Employee (Govt.)
Salaried Employee (Pvt.)
Casual Labour (Non-Agriculture)
BELU 1.18 0.00 0.00 0.00 2.35 0.00
SINDRANI 0.00 0.00 0.00 1.56 0.00 0.00
KOLA 0.00 0.00 0.00 0.00 0.00 0.00
HARIHARPUR 0.00 1.69 3.39 0.00 0.00 0.00 PURBBA RAMCHANDRAPUR 1.30 2.60 0.00 0.00 0.00 0.00
RAMPUR 0.00 1.79 0.00 0.00 0.00 0.00
CHANDPARA 0.00 0.00 0.00 6.35 0.00 0.00
CHHEKATI 1.92 0.00 0.00 0.00 3.85 0.00
AMUDIA 0.00 0.00 0.00 0.00 0.00 3.13
PANCHGHARA 0.00 4.62 0.00 0.00 0.00 0.00
NADURIA 5.00 0.00 0.00 0.00 0.00 0.00
KAZLA 1.67 13.33 0.00 0.00 1.67 0.00
NAPRA 0.00 0.00 0.00 1.47 0.00 0.00
PADMAPUKUR 0.00 1.27 0.00 0.00 0.00 0.00
RAMPUR 5.33 1.33 0.00 0.00 0.00 0.00 CHHOTHA KANTHALIA 0.00 0.00 3.64 0.00 0.00 1.82
BAHIRA 0.00 0.00 0.00 0.00 0.00 3.51
KAMDUNI 0.00 0.00 0.00 53.52 0.00 0.00
KOLA 4.00 0.00 0.00 0.00 0.00 0.00
BISWANATHPUR 1.28 1.28 0.00 1.28 0.00 2.56 ALIPUR 0.00 0.00 0.00 0.00 0.00 0.00
GOKNA 1.43 5.71 0.00 0.00 0.00 0.00 GOCHHARATI BHYABLA 0.00 4.76 0.00 0.00 0.00 0.00
SALIPUR 2.63 1.32 0.00 0.00 1.32 0.00
ADAMPUR 0.00 1.41 0.00 0.00 0.00 5.63 BAGDOBAMACHHI BHANGA 0.00 0.00 0.00 0.00 0.00 0.00
NITYABARIA 0.00 0.00 0.00 0.00 0.00 0.00
SADIGACHHI 0.00 0.00 0.00 0.00 1.28 0.00
TAKIPUR 3.45 0.00 0.00 0.00 0.00 0.00
KALITALA 0.00 0.00 0.00 0.00 0.00 0.00
Source: Village survey data
32
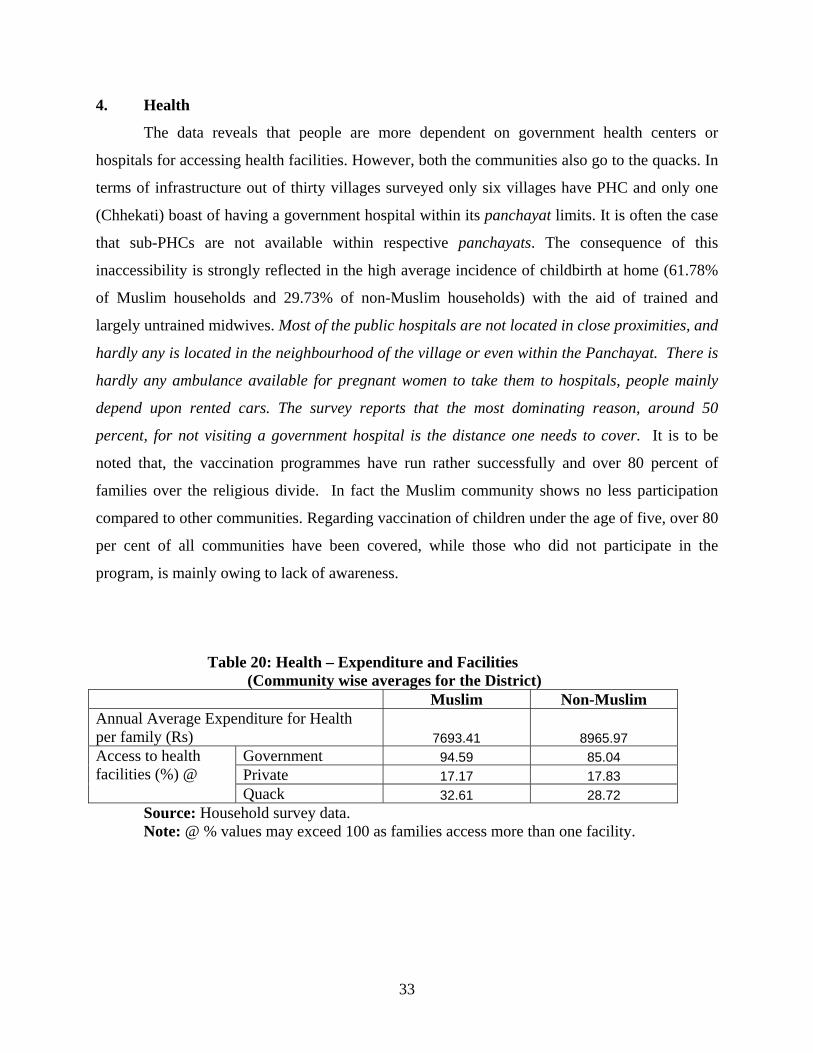
4. Health
The data reveals that people are more dependent on government health centers or
hospitals for accessing health facilities. However, both the communities also go to the quacks. In
terms of infrastructure out of thirty villages surveyed only six villages have PHC and only one
(Chhekati) boast of having a government hospital within its panchayat limits. It is often the case
that sub-PHCs are not available within respective panchayats. The consequence of this
inaccessibility is strongly reflected in the high average incidence of childbirth at home (61.78%
of Muslim households and 29.73% of non-Muslim households) with the aid of trained and
largely untrained midwives. Most of the public hospitals are not located in close proximities, and
hardly any is located in the neighbourhood of the village or even within the Panchayat. There is
hardly any ambulance available for pregnant women to take them to hospitals, people mainly
depend upon rented cars. The survey reports that the most dominating reason, around 50
percent, for not visiting a government hospital is the distance one needs to cover. It is to be
noted that, the vaccination programmes have run rather successfully and over 80 percent of
families over the religious divide. In fact the Muslim community shows no less participation
compared to other communities. Regarding vaccination of children under the age of five, over 80
per cent of all communities have been covered, while those who did not participate in the
program, is mainly owing to lack of awareness.
Table 20: Health – Expenditure and Facilities (Community wise averages for the District) Muslim Non-Muslim Annual Average Expenditure for Health per family (Rs) 7693.41 8965.97
Government 94.59 85.04 Private 17.17 17.83
Access to health facilities (%) @
Quack 32.61 28.72 Source: Household survey data. Note: @ % values may exceed 100 as families access more than one facility.
33
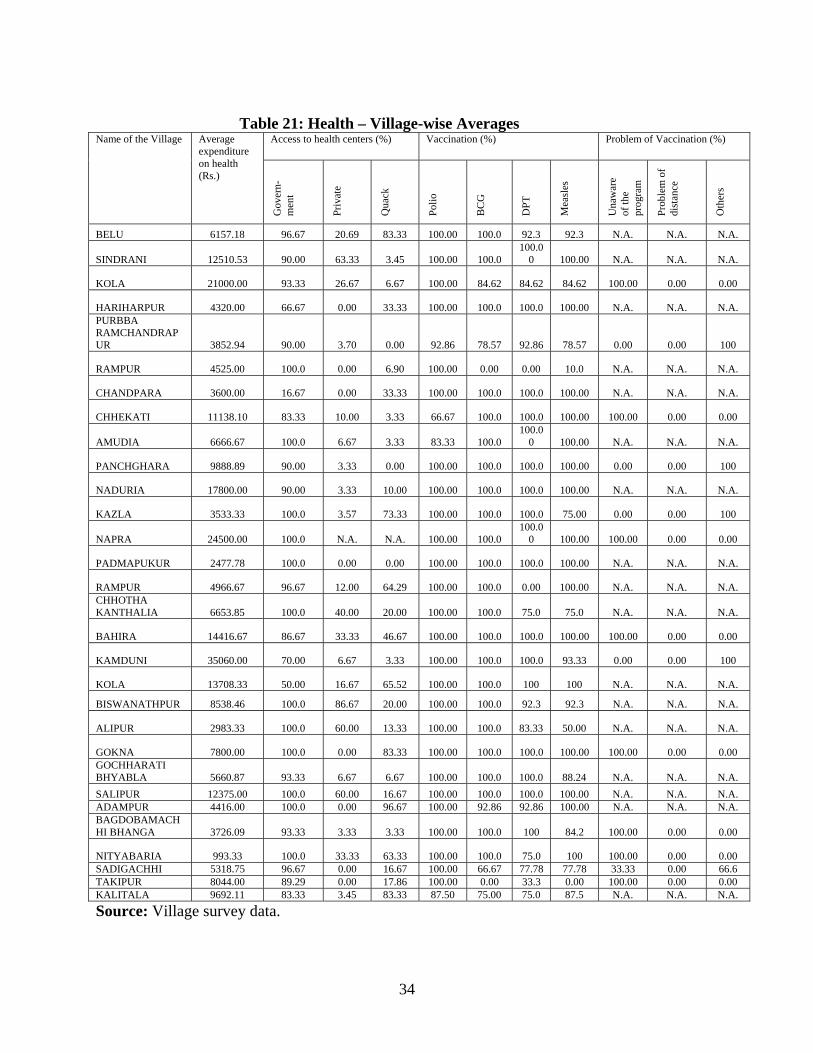
Table 21: Health – Village-wise Averages
Access to health centers (%) Vaccination (%) Problem of Vaccination (%) Name of the Village Average expenditure on health (Rs.)
Gov
ern-
men
t
Priv
ate
Qua
ck
Polio
BC
G
DPT
Mea
sles
Una
war
e of
the
prog
ram
Prob
lem
of
dist
ance
Oth
ers
BELU 6157.18 96.67 20.69 83.33 100.00 100.0 92.3 92.3 N.A. N.A. N.A.
SINDRANI 12510.53 90.00 63.33 3.45 100.00 100.0 100.0
0 100.00 N.A. N.A. N.A.
KOLA 21000.00 93.33 26.67 6.67 100.00 84.62 84.62 84.62 100.00 0.00 0.00
HARIHARPUR 4320.00 66.67 0.00 33.33 100.00 100.0 100.0 100.00 N.A. N.A. N.A. PURBBA RAMCHANDRAPUR 3852.94 90.00 3.70 0.00 92.86 78.57 92.86 78.57 0.00 0.00 100
RAMPUR 4525.00 100.0 0.00 6.90 100.00 0.00 0.00 10.0 N.A. N.A. N.A.
CHANDPARA 3600.00 16.67 0.00 33.33 100.00 100.0 100.0 100.00 N.A. N.A. N.A.
CHHEKATI 11138.10 83.33 10.00 3.33 66.67 100.0 100.0 100.00 100.00 0.00 0.00
AMUDIA 6666.67 100.0 6.67 3.33 83.33 100.0 100.0
0 100.00 N.A. N.A. N.A.
PANCHGHARA 9888.89 90.00 3.33 0.00 100.00 100.0 100.0 100.00 0.00 0.00 100
NADURIA 17800.00 90.00 3.33 10.00 100.00 100.0 100.0 100.00 N.A. N.A. N.A.
KAZLA 3533.33 100.0 3.57 73.33 100.00 100.0 100.0 75.00 0.00 0.00 100
NAPRA 24500.00 100.0 N.A. N.A. 100.00 100.0 100.0
0 100.00 100.00 0.00 0.00
PADMAPUKUR 2477.78 100.0 0.00 0.00 100.00 100.0 100.0 100.00 N.A. N.A. N.A.
RAMPUR 4966.67 96.67 12.00 64.29 100.00 100.0 0.00 100.00 N.A. N.A. N.A. CHHOTHA KANTHALIA 6653.85 100.0 40.00 20.00 100.00 100.0 75.0 75.0 N.A. N.A. N.A.
BAHIRA 14416.67 86.67 33.33 46.67 100.00 100.0 100.0 100.00 100.00 0.00 0.00
KAMDUNI 35060.00 70.00 6.67 3.33 100.00 100.0 100.0 93.33 0.00 0.00 100
KOLA 13708.33 50.00 16.67 65.52 100.00 100.0 100 100 N.A. N.A. N.A.
BISWANATHPUR 8538.46 100.0 86.67 20.00 100.00 100.0 92.3 92.3 N.A. N.A. N.A.
ALIPUR 2983.33 100.0 60.00 13.33 100.00 100.0 83.33 50.00 N.A. N.A. N.A.
GOKNA 7800.00 100.0 0.00 83.33 100.00 100.0 100.0 100.00 100.00 0.00 0.00 GOCHHARATI BHYABLA 5660.87 93.33 6.67 6.67 100.00 100.0 100.0 88.24 N.A. N.A. N.A. SALIPUR 12375.00 100.0 60.00 16.67 100.00 100.0 100.0 100.00 N.A. N.A. N.A. ADAMPUR 4416.00 100.0 0.00 96.67 100.00 92.86 92.86 100.00 N.A. N.A. N.A. BAGDOBAMACHHI BHANGA 3726.09 93.33 3.33 3.33 100.00 100.0 100 84.2 100.00 0.00 0.00
NITYABARIA 993.33 100.0 33.33 63.33 100.00 100.0 75.0 100 100.00 0.00 0.00 SADIGACHHI 5318.75 96.67 0.00 16.67 100.00 66.67 77.78 77.78 33.33 0.00 66.6 TAKIPUR 8044.00 89.29 0.00 17.86 100.00 0.00 33.3 0.00 100.00 0.00 0.00 KALITALA 9692.11 83.33 3.45 83.33 87.50 75.00 75.0 87.5 N.A. N.A. N.A.
Source: Village survey data.
34
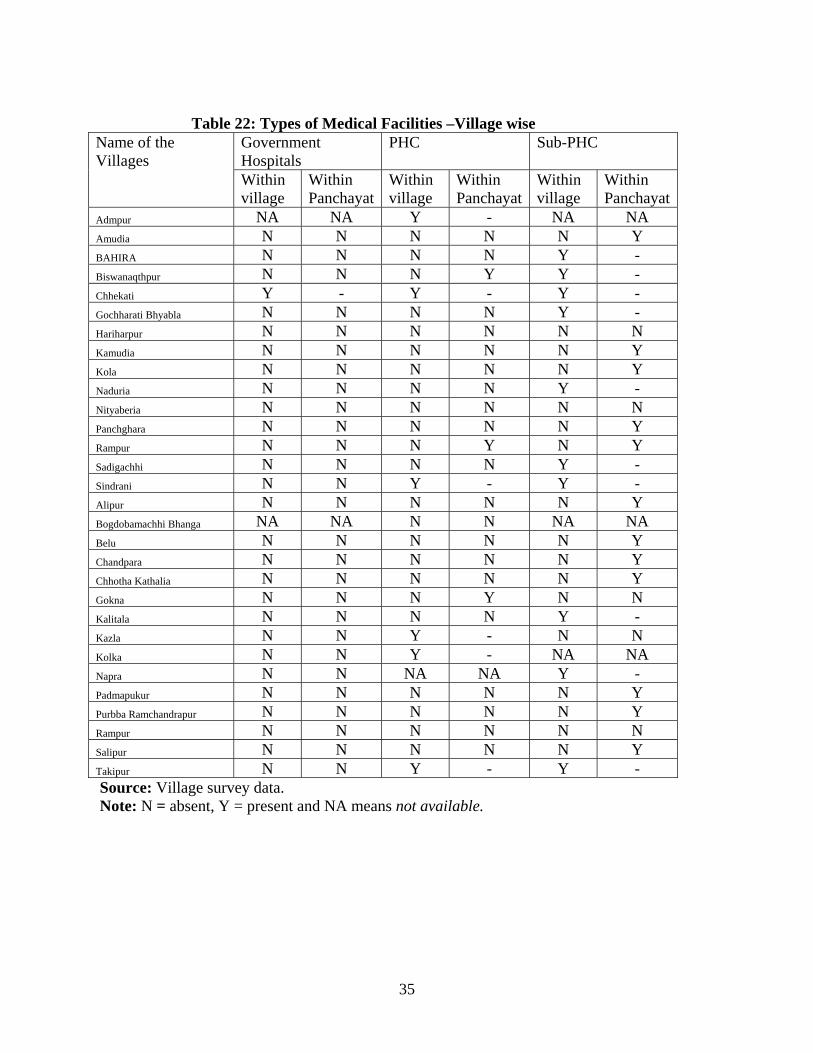
Table 22: Types of Medical Facilities –Village wise
Government Hospitals
PHC Sub-PHC Name of the Villages
Within village
Within Panchayat
Within village
Within Panchayat
Within village
Within Panchayat
Admpur NA NA Y - NA NA Amudia N N N N N Y BAHIRA N N N N Y - Biswanaqthpur N N N Y Y - Chhekati Y - Y - Y - Gochharati Bhyabla N N N N Y - Hariharpur N N N N N N Kamudia N N N N N Y Kola N N N N N Y Naduria N N N N Y - Nityaberia N N N N N N Panchghara N N N N N Y Rampur N N N Y N Y Sadigachhi N N N N Y - Sindrani N N Y - Y - Alipur N N N N N Y Bogdobamachhi Bhanga NA NA N N NA NA Belu N N N N N Y Chandpara N N N N N Y Chhotha Kathalia N N N N N Y Gokna N N N Y N N Kalitala N N N N Y - Kazla N N Y - N N Kolka N N Y - NA NA Napra N N NA NA Y - Padmapukur N N N N N Y Purbba Ramchandrapur N N N N N Y Rampur N N N N N N Salipur N N N N N Y Takipur N N Y - Y - Source: Village survey data. Note: N = absent, Y = present and NA means not available.
35
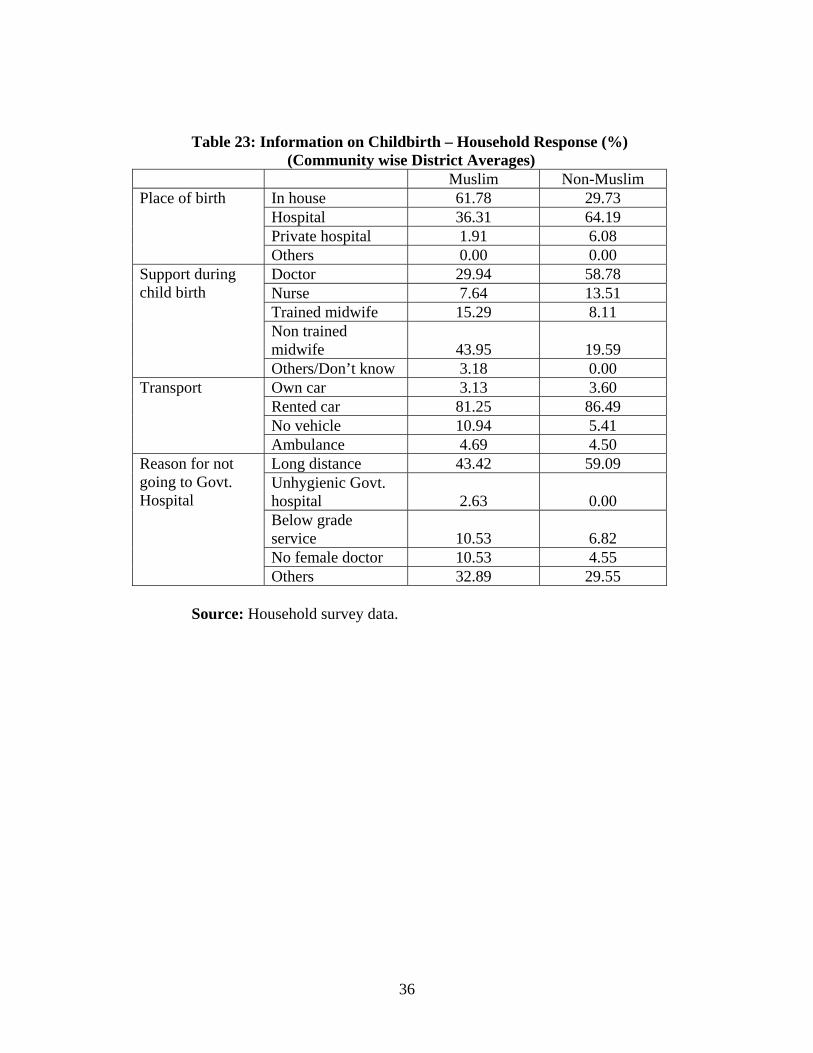
Table 23: Information on Childbirth – Household Response (%) (Community wise District Averages)
Muslim Non-Muslim In house 61.78 29.73 Hospital 36.31 64.19 Private hospital 1.91 6.08
Place of birth
Others 0.00 0.00 Doctor 29.94 58.78 Nurse 7.64 13.51 Trained midwife 15.29 8.11 Non trained midwife 43.95 19.59
Support during child birth
Others/Don’t know 3.18 0.00 Own car 3.13 3.60 Rented car 81.25 86.49 No vehicle 10.94 5.41
Transport
Ambulance 4.69 4.50 Long distance 43.42 59.09 Unhygienic Govt. hospital 2.63 0.00 Below grade service 10.53 6.82 No female doctor 10.53 4.55
Reason for not going to Govt. Hospital
Others 32.89 29.55
Source: Household survey data.
36

Table 24: Information on Child Birth – Village-wise (%)
Place of birth Reasons for not visiting Government places
Nam
e of
vill
ages
At h
ome
Gov
ern-
men
t H
ospi
tal
Priv
ate
Hos
pita
l
Oth
ers
Prob
lem
of
dist
ance
Un-
clea
nlin
ess
Inef
ficie
nt
serv
ices
by
/N
o fe
mal
e do
ctor
s
Oth
ers
BELU 45.45 54.55 0.00 0.00 66.67 0.00 0.00 0.00 33.33
SINDRANI 25.00 50.00 25.00 0.00 0.00 0.00 11.11 44.44 44.44
KOLA 41.18 52.94 5.88 0.00 0.00 0.00 0.00 0.00 100.00
HARIHARPUR 90.00 10.00 0.00 0.00 100.00 0.00 0.00 0.00 0.00 PURBBA RAMCHANDRAPUR 41.67 50.00 8.33 0.00 50.00 0.00 0.00 0.00 50.00
RAMPUR 0.00 100.00 0.00 0.00 N.A. N.A. N.A. N.A. N.A.
CHANDPARA 0.00 75.00 25.00 0.00 N.A. N.A. N.A. N.A. N.A.
CHHEKATI 33.33 55.56 11.11 0.00 100.00 0.00 0.00 0.00 0.00
AMUDIA 100.00 0.00 0.00 0.00 100.00 0.00 0.00 0.00 0.00
PANCHGHARA 38.46 61.54 0.00 0.00 66.67 0.00 0.00 0.00 33.33
NADURIA 53.85 46.15 0.00 0.00 14.29 0.00 0.00 0.00 85.71
KAZLA 0.00 100.00 0.00 0.00 N.A. N.A. N.A. N.A. N.A.
NAPRA 63.64 36.36 0.00 0.00 0.00 0.00 0.00 0.00 100.00
PADMAPUKUR 27.27 72.73 0.00 0.00 0.00 50.00 50.00 0.00 0.00
RAMPUR 20.00 80.00 0.00 0.00 100.00 0.00 0.00 0.00 0.00 CHHOTHA KANTHALIA 12.50 87.50 0.00 0.00 0.00 0.00 0.00 0.00 100.00
BAHIRA 28.57 57.14 14.29 0.00 100.00 0.00 0.00 0.00 0.00 KAMDUNI 8.33 91.67 0.00 0.00 N.A. N.A. N.A. N.A. N.A. KOLA 83.33 16.67 0.00 0.00 75.00 0.00 0.00 0.00 25.00
BISWANATHPUR 17.65 58.82 23.53 0.00 0.00 0.00 42.86 0.00 57.14
ALIPUR 14.29 85.71 0.00 0.00 N.A. N.A. N.A. N.A. N.A. GOKNA 40.00 60.00 0.00 0.00 100.00 0.00 0.00 0.00 0.00 GOCHHARATI BHYABLA 75.00 25.00 0.00 0.00 0.00 0.00 36.36 54.55 9.09 SALIPUR 85.71 14.29 0.00 0.00 66.67 0.00 33.33 0.00 0.00
ADAMPUR 78.57 21.43 0.00 0.00 0.00 0.00 0.00 0.00 100.00 BAGDOBAMACHHI BHANGA 84.21 15.79 0.00 0.00 100.00 0.00 0.00 0.00 0.00 NITYABARIA 0.00 100.00 0.00 0.00 100.00 0.00 0.00 0.00 0.00
SADIGACHHI 75.00 25.00 0.00 0.00 83.33 0.00 0.00 0.00 16.67
TAKIPUR 60.00 40.00 0.00 0.00 N.A. N.A. N.A. N.A. N.A.
KALITALA 75.00 25.00 0.00 0.00 100.00 0.00 0.00 0.00 0.00
Source: Household survey data.
37
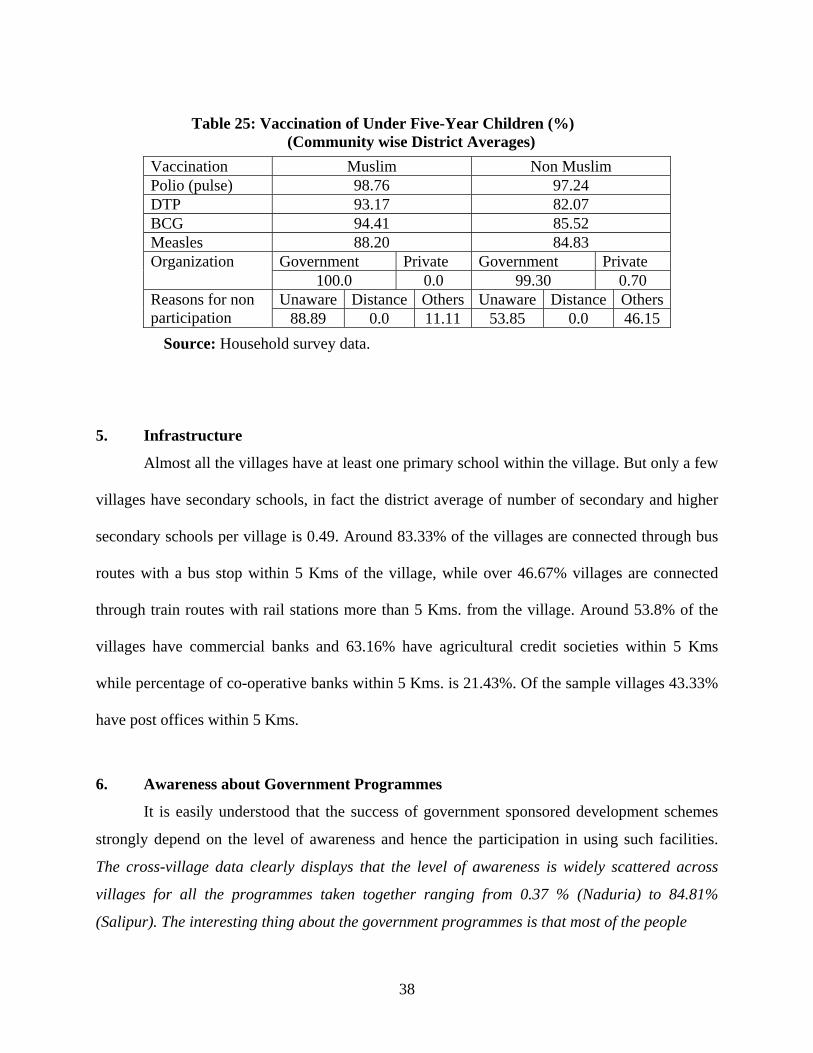
Table 25: Vaccination of Under Five-Year Children (%)
(Community wise District Averages) Vaccination Muslim Non Muslim Polio (pulse) 98.76 97.24 DTP 93.17 82.07 BCG 94.41 85.52 Measles 88.20 84.83
Government Private Government Private Organization 100.0 0.0 99.30 0.70
Unaware Distance Others Unaware Distance OthersReasons for non participation 88.89 0.0 11.11 53.85 0.0 46.15
Source: Household survey data. 5. Infrastructure
Almost all the villages have at least one primary school within the village. But only a few
villages have secondary schools, in fact the district average of number of secondary and higher
secondary schools per village is 0.49. Around 83.33% of the villages are connected through bus
routes with a bus stop within 5 Kms of the village, while over 46.67% villages are connected
through train routes with rail stations more than 5 Kms. from the village. Around 53.8% of the
villages have commercial banks and 63.16% have agricultural credit societies within 5 Kms
while percentage of co-operative banks within 5 Kms. is 21.43%. Of the sample villages 43.33%
have post offices within 5 Kms.
6. Awareness about Government Programmes
It is easily understood that the success of government sponsored development schemes
strongly depend on the level of awareness and hence the participation in using such facilities.
The cross-village data clearly displays that the level of awareness is widely scattered across
villages for all the programmes taken together ranging from 0.37 % (Naduria) to 84.81%
(Salipur). The interesting thing about the government programmes is that most of the people
38

Table 26: Awareness and Efficacy of the Government Sponsored Development
Programmes – District Average for Muslims (%)
Help received from for accessing benefit
Programme % of people aware
% of beneficiary Pra
dhan GP Office
NGO
Self Others
% of cases where Commission paid
SGSY 39.59 5.84 66.67 0.0 0.0 11.11 22.22 0.0 NREGS 86.89 29.29 74.22 18.56 2.06 4.12 1.03 1.01 IAY 61.18 7.14 94.12 5.88 0.0 0.0 0.0 0.0 Old age pension
51.16 3.52 57.14 28.57 0.0 14.29 20.0 0.0
Swajal dhara
27.51 23.36 78.26 8.70 4.35 0.0 8.70 4.04
Irrigation 21.34 10.84 0.0 50.0 0.0 50.0 0.0 0.0 ARWSP 25.71 43.48 43.48 0.0 17.4 2.17 36.96 12.0 SSA 71.21 40.07 26.26 7.07 0.0 7.07 59.60 1.80 TSC/SSUP 12.34 4.17 3.33 40.0 23.33 0.0 33.33 0.0
Source: Household survey data. Table 27: Awareness and Efficacy of the Government Sponsored Development
Programmes – District Average for non-Muslims (%) Help received from for accessing benefit Programme % of
people aware
% of beneficiary
Pra dhan
GP Office
NGO Self Others % of cases where Commission paid
SGSY 51.76 12.5 66.67 12.12 0.0 3.03 21.1 3.03 NREGS 88.43 35.92 75.32 18.35 0.0 3.16 3.16 1.23 IAY 77.84 8.56 81.82 18.18 0.0 0.0 0.0 2.94 Old age pension
69.80 2.53 85.71 0.0 0.0 0.0 14.29 0.0
Swajal dhara
35.49 35.36 89.66 3.45 0.0 0.0 6.90 1.56
Irrigation 33.73 23.26 14.29 0.0 0.0 71.43 14.3 2.5 ARWSP 29.22 39.61 60.0 14.55 0.0 0.0 25.45 26.17 SSA 74.51 26.84 36.49 17.57 0.0 10.81 35.14 0.0 TSC /SSUP 11.37 10.34 0.0 62.5 12.5 0.0 25.0 0.0
Source: Household Survey Data. Note: NA means not available.
39
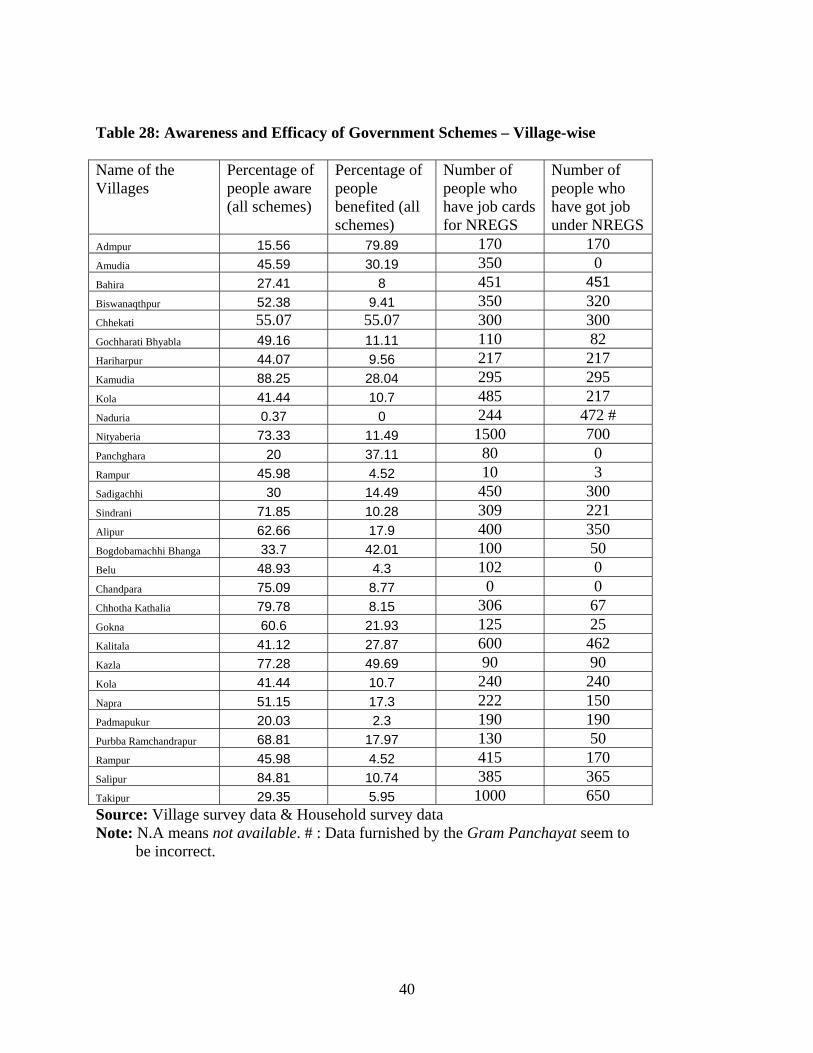
Table 28: Awareness and Efficacy of Government Schemes – Village-wise Name of the Villages
Percentage of people aware (all schemes)
Percentage of people benefited (all schemes)
Number of people who have job cards for NREGS
Number of people who have got job under NREGS
Admpur 15.56 79.89 170 170 Amudia 45.59 30.19 350 0 Bahira 27.41 8 451 451 Biswanaqthpur 52.38 9.41 350 320 Chhekati 55.07 55.07 300 300 Gochharati Bhyabla 49.16 11.11 110 82 Hariharpur 44.07 9.56 217 217 Kamudia 88.25 28.04 295 295 Kola 41.44 10.7 485 217 Naduria 0.37 0 244 472 # Nityaberia 73.33 11.49 1500 700 Panchghara 20 37.11 80 0 Rampur 45.98 4.52 10 3 Sadigachhi 30 14.49 450 300 Sindrani 71.85 10.28 309 221 Alipur 62.66 17.9 400 350 Bogdobamachhi Bhanga 33.7 42.01 100 50 Belu 48.93 4.3 102 0 Chandpara 75.09 8.77 0 0 Chhotha Kathalia 79.78 8.15 306 67 Gokna 60.6 21.93 125 25 Kalitala 41.12 27.87 600 462 Kazla 77.28 49.69 90 90 Kola 41.44 10.7 240 240 Napra 51.15 17.3 222 150 Padmapukur 20.03 2.3 190 190 Purbba Ramchandrapur 68.81 17.97 130 50 Rampur 45.98 4.52 415 170 Salipur 84.81 10.74 385 365 Takipur 29.35 5.95 1000 650 Source: Village survey data & Household survey data Note: N.A means not available. # : Data furnished by the Gram Panchayat seem to be incorrect.
40
across communities, i.e. over 80% are aware about the NREGS but a moderate section of that (
around 30%) have benefited. Next, for IAY (over 61.18% among Muslims and around 77.84%
among non-Muslims) are aware, but the percentage of beneficiaries as we have also seen
witnessed previously under the section on housing facilities that, is pretty low (not more than
10%). There are many other facilities and schemes that the central government have been
running for quite some time and which very few respondents have heard of. These include: old
age and widow pension, SSA, SGSY, AWRP, TSC and Swajaldhara. Apparently, the popularity
of the NREGS with ready source of income and cash flow seems to receive the highest attention
despite longer-term benefits associated with many others already in operation. At this stage, we
are not convinced that adding more programmes would be beneficial, unless interest and
participation in the existing ones can be maximized with due emphasis on the awareness part of
the schemes which could run equally well for all communities. The major source of information
in cases of profitable job opportunities have come from the Panchayat Pradhan himself/herself
or from the GP office, and there is no report of the fact that NGOs have been of significant help
in this connection.
7. Other Issues
We use Tables 29-32 to reflect on a score of other features that are no less important
in understanding the reasons behind the acute underdevelopment in these communities,
compared to the more well known indicators often invoked for the purpose. These are as
follows. About 0.26% percent of the Muslim and 1.77% percent non-Muslim respondent
families have health insurance and there is around 8% disparity between non-Muslim and
Muslim households with regard to purchase of life insurance. Percentage of people buying crop
insurance is negligible, and those who deposit money with the bank vary between 22.11% for the
Muslims and 28.35% for the non-Muslims, with a higher average deposit value for the latter.
Among the Muslim households the relatively affluent ones also hold term deposits and that value
there also exceeds that by the non-Muslim families. And yet, the level of indebtedness is high
41
among both communities exceeding 35% of the households surveyed. The average interest rate
paid (see Table 30) clearly indicates that the source is still the traditional moneylenders and more
than one-third of respondents in either community have used this source at some point. The
meager percentage of people approaching the commercial banks or other government provided
sources is rather negligible and once again reflects on the issue of lack of awareness and
sometimes even lack of trust with such institutions. It is also the breakdown of the reasons of
indebtedness (vide Table 31) that ties the borrowers with informal moneylenders, since a large
part of the loan (Muslims, 21.91%; non-Muslims 21.31%) is taken for covering medical
expenses. Of the families surveyed around a third of both the Muslims and non-Muslims have
BPL ration card (Table 33). More than 65% of the Muslims and over 60% of the non-Muslims
report the public distribution system to be inefficient, either in terms of inadequacy, inferior
quality, less in amount, irregularity and so on. Added to it is the unwillingness of the dealers to
sell the commodities (reported by Muslims, 18.77%; non- Muslims, 19.68%; Table 33). On the
whole therefore, the assessment re-opens the possibilities of improving upon the lacunae that
have been plaguing the district for long enough.
42
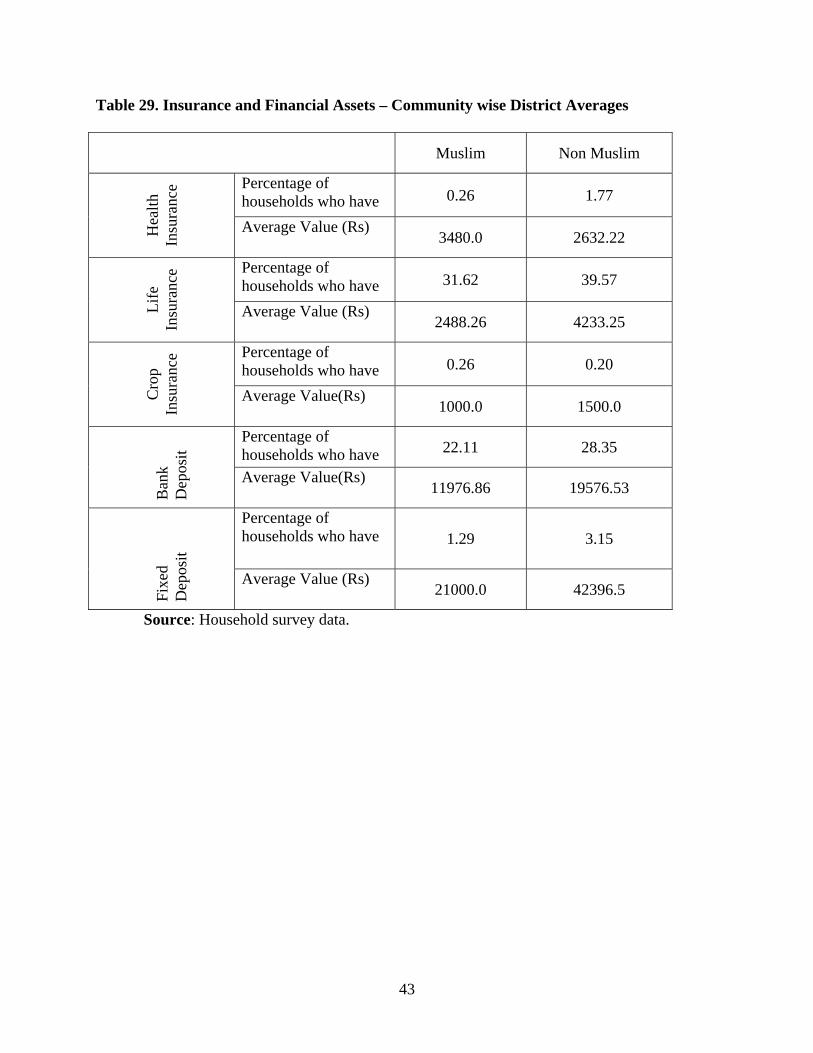
Table 29. Insurance and Financial Assets – Community wise District Averages
Muslim Non Muslim
Percentage of households who have 0.26 1.77
Hea
lth
Insu
ranc
e
Average Value (Rs) 3480.0 2632.22
Percentage of households who have 31.62 39.57
Life
In
sura
nce
Average Value (Rs) 2488.26 4233.25
Percentage of households who have 0.26 0.20
Cro
p In
sura
nce
Average Value(Rs) 1000.0 1500.0
Percentage of households who have 22.11 28.35
Ban
k D
epos
it
Average Value(Rs) 11976.86 19576.53
Percentage of households who have 1.29 3.15
Fixe
d D
epos
it
Average Value (Rs) 21000.0 42396.5
Source: Household survey data.
43

Table 30: Indebtedness - Sources and Conditions of Loan
(Community wise District Averages)
Muslim Non Muslim
Percentage of households indebted
44.73 35.88 Average Interest Rate
34.40 33.26
Government 7.47 1.65
Commercial Bank 8.62 4.40
Rural Bank 4.02 7.69
Co-operative Bank 5.75 4.95
Self Help Group/Non Governmental Organization 6.32 5.49
Moneylender 36.78 43.41
Big landowner/Jotedar 2.30 1.65
Relative 23.56 24.18
Sour
ces o
f ava
iling
loan
s (%
)
Others 5.17 6.59
Only Interest 75.30 81.77
Physical labour 3.61 4.42
Land mortgage 4.82 4.42
Con
ditio
ns &
Ter
ms o
f Lo
an (%
)
Ornament mortgage 4.82 1.66
Source: Household survey data.
44

Table 31: Indebtedness - Reasons and Nature of Loan (Community wise District Averages)
Muslim Non Muslim
Capital related expenditure 6.36 10.93
Purchase of agricultural equipment 21.39 12.02 Purchase of land/home
6.36 4.37 Repairing of house
13.87 22.40 Marriage/other social function
7.51 7.10 Medical expenditure
21.97 21.31 Purchase of cattle
2.89 1.09 Investment
5.20 5.46
R
easo
ns o
f Loa
n
Others 14.45 15.30
Terms – Cash only 95.38 96.13 Source: Household survey data.
45
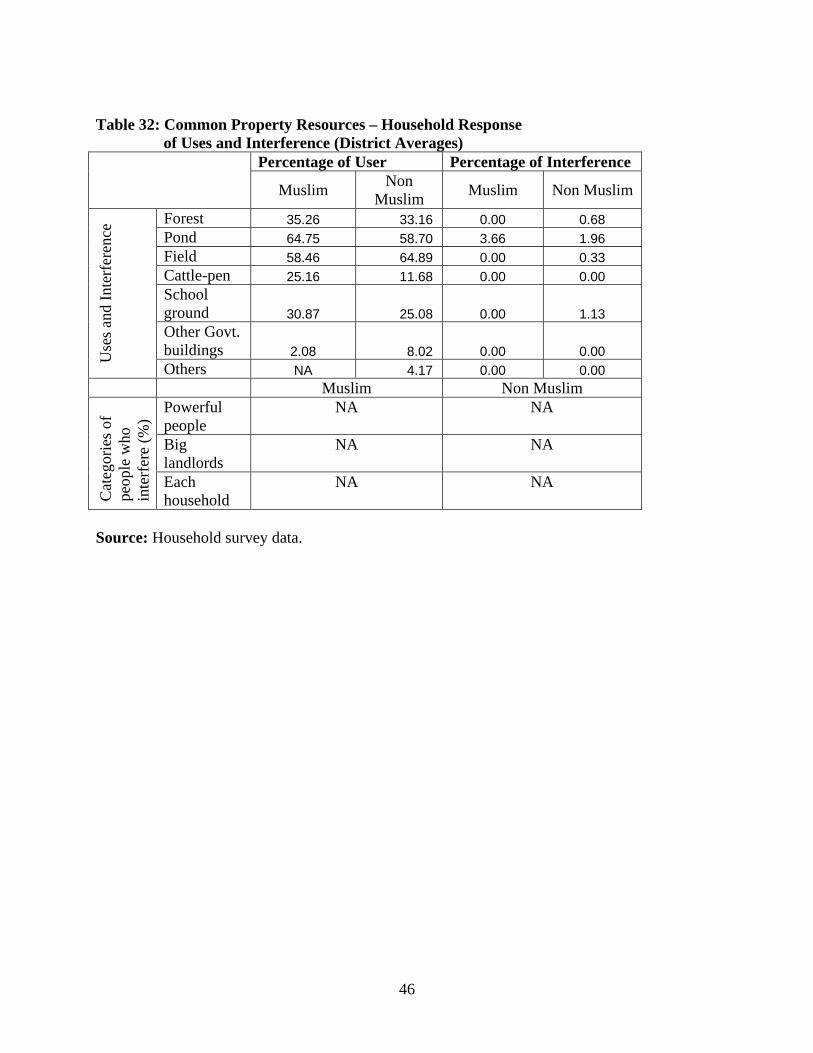
Table 32: Common Property Resources – Household Response
of Uses and Interference (District Averages)
Percentage of User Percentage of Interference
Muslim Non Muslim Muslim Non Muslim
Forest 35.26 33.16 0.00 0.68 Pond 64.75 58.70 3.66 1.96 Field 58.46 64.89 0.00 0.33 Cattle-pen 25.16 11.68 0.00 0.00 School ground 30.87 25.08 0.00 1.13 Other Govt. buildings 2.08 8.02 0.00 0.00 U
ses a
nd In
terf
eren
ce
Others NA 4.17 0.00 0.00 Muslim Non Muslim
Powerful people
NA NA
Big landlords
NA NA
Cat
egor
ies o
f pe
ople
who
in
terf
ere
(%)
Each household
NA NA
Source: Household survey data.
46
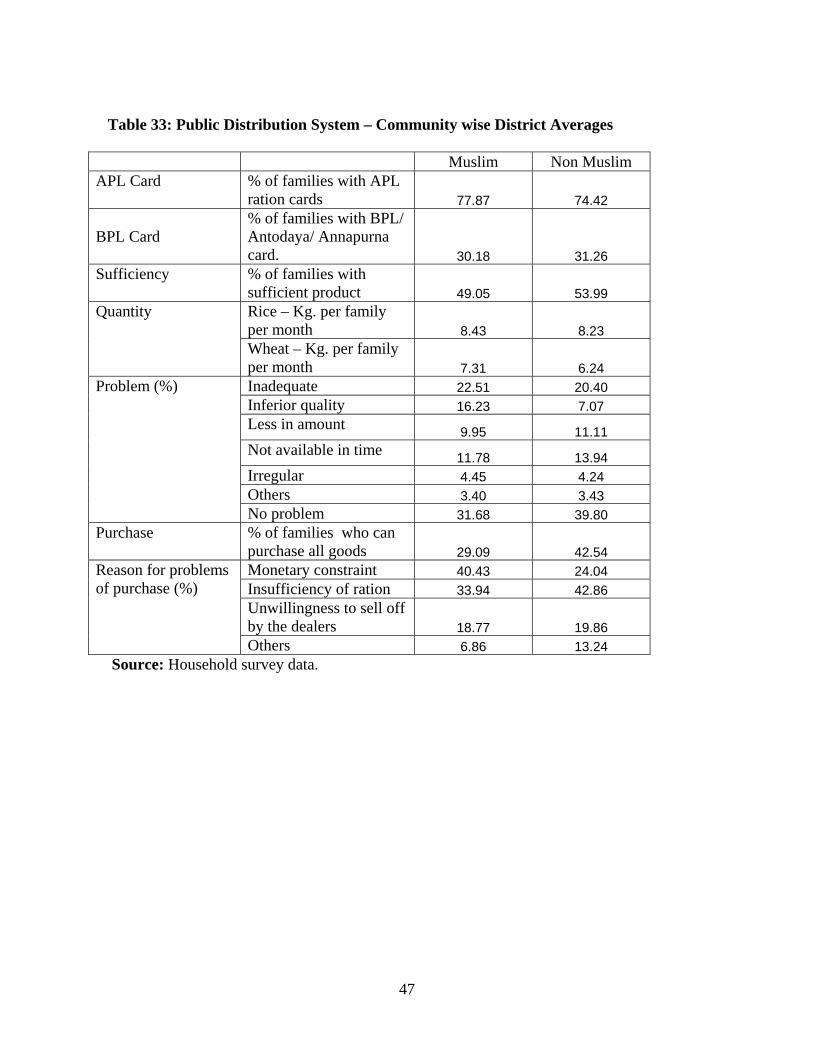
Table 33: Public Distribution System – Community wise District Averages Muslim Non Muslim APL Card
% of families with APL ration cards 77.87 74.42
BPL Card
% of families with BPL/ Antodaya/ Annapurna card. 30.18 31.26
Sufficiency
% of families with sufficient product 49.05 53.99 Rice – Kg. per family per month 8.43 8.23
Quantity
Wheat – Kg. per family per month 7.31 6.24 Inadequate 22.51 20.40 Inferior quality 16.23 7.07 Less in amount 9.95 11.11 Not available in time 11.78 13.94 Irregular 4.45 4.24 Others 3.40 3.43
Problem (%)
No problem 31.68 39.80 Purchase % of families who can
purchase all goods 29.09 42.54 Monetary constraint 40.43 24.04 Insufficiency of ration 33.94 42.86 Unwillingness to sell off by the dealers 18.77 19.86
Reason for problems of purchase (%)
Others 6.86 13.24 Source: Household survey data.
47
Recommendations
We have discussed the conditions of the district in terms of the major indicators; we have
provided the current status of the most important eight indicators identified by the Ministry of
Minority Affairs, viz. the four religion specific indicators and the four basic amenities indicators.
In addition we have also provided the status of the many other indicators that we thought to be of
relevance. Some of these are calculated at a more disaggregated level for a particular indicator.
For example we have gone into a detailed account of status of education, at different levels as we
thought that only literacy is inadequate. We also provided the status of training in vocational
trades and the demand for such training. This is important, in our opinion, as we tried to relate
the same with job market situation for the general populace.
The above analysis is very broad in nature and requires intervention at a very larger scale
and change in the attitude of the process of policy planning. Since the approach of the Multi-
sector Development Plan funded by the Ministry of Minority Affairs is supplementary in nature
and does not intend to change the very nature of the plan process, it is suggested that the district
administration may start working on priority basis with the additional fund in the areas where the
deficit can very easily be identified at the district level or at the village or in the pockets of the
district. Hence we provide the deficit of the district for the religion specific socio-economic
indicators and the basic amenities indicators where the deficit has been calculated as the
deviation of the survey averages from national averages provided by the NSSO 2005 and NHFS-
3 in Table 34 below. In addition to these indicators we have also discussed about some of the
indicators, which in our opinion are extremely important for the development of the district.
48
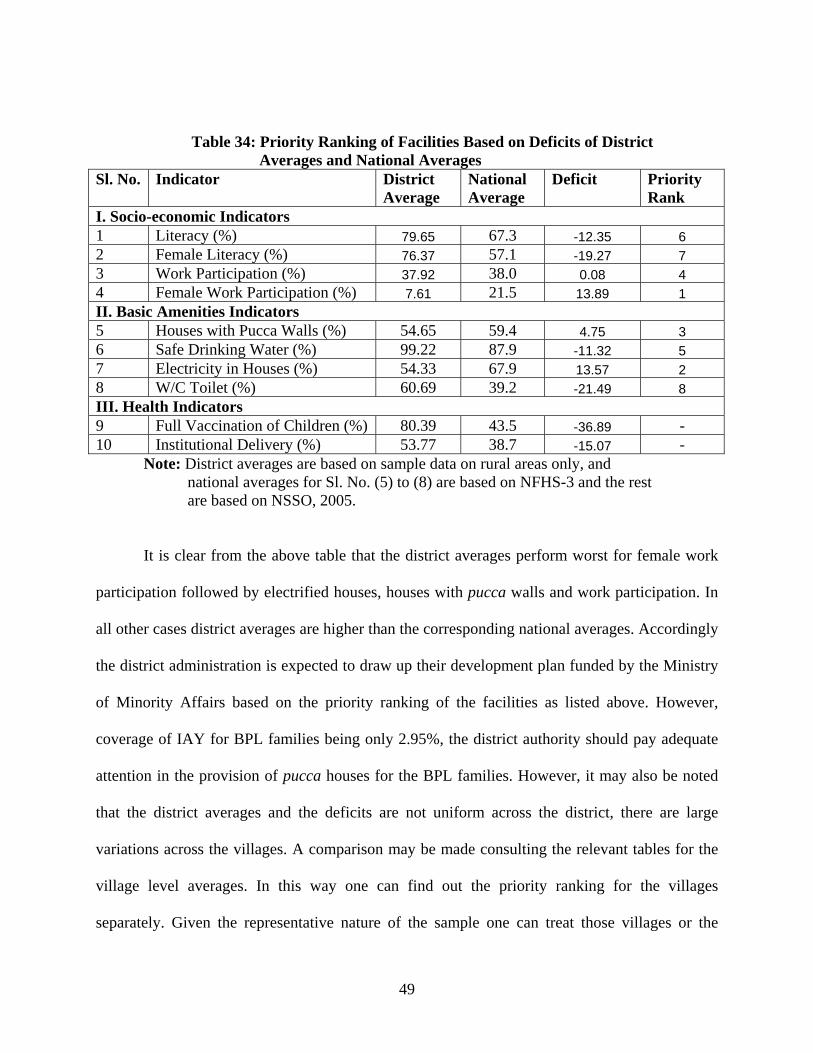
Table 34: Priority Ranking of Facilities Based on Deficits of District Averages and National Averages
Sl. No. Indicator District Average
National Average
Deficit Priority Rank
I. Socio-economic Indicators 1 Literacy (%) 79.65 67.3 -12.35 6 2 Female Literacy (%) 76.37 57.1 -19.27 7 3 Work Participation (%) 37.92 38.0 0.08 4 4 Female Work Participation (%) 7.61 21.5 13.89 1 II. Basic Amenities Indicators 5 Houses with Pucca Walls (%) 54.65 59.4 4.75 3 6 Safe Drinking Water (%) 99.22 87.9 -11.32 5 7 Electricity in Houses (%) 54.33 67.9 13.57 2 8 W/C Toilet (%) 60.69 39.2 -21.49 8 III. Health Indicators 9 Full Vaccination of Children (%) 80.39 43.5 -36.89 - 10 Institutional Delivery (%) 53.77 38.7 -15.07 -
Note: District averages are based on sample data on rural areas only, and national averages for Sl. No. (5) to (8) are based on NFHS-3 and the rest
are based on NSSO, 2005.
It is clear from the above table that the district averages perform worst for female work
participation followed by electrified houses, houses with pucca walls and work participation. In
all other cases district averages are higher than the corresponding national averages. Accordingly
the district administration is expected to draw up their development plan funded by the Ministry
of Minority Affairs based on the priority ranking of the facilities as listed above. However,
coverage of IAY for BPL families being only 2.95%, the district authority should pay adequate
attention in the provision of pucca houses for the BPL families. However, it may also be noted
that the district averages and the deficits are not uniform across the district, there are large
variations across the villages. A comparison may be made consulting the relevant tables for the
village level averages. In this way one can find out the priority ranking for the villages
separately. Given the representative nature of the sample one can treat those villages or the
49

blocks where they are situated as the pockets of relative backwardness in terms of the above
indicators. We draw the attention of the district administration to be cautious when drawing plan
for the district.
In addition to the above priority ranking of facilities we also like to point out that there
are some findings that the study team of the CSSSC thinks very important from the standpoint of
the development of the district. This is specially so where district averages are higher than the
corresponding national averages. In such cases it makes better sense to concentrate the efforts of
the district administration areas other than the above ten indicators as suggested by the Ministry.
These are given below.
• Though pucca walled house receives a rank of 3, percentage of BPL families covered
under IAY is extremely poor, 2.95 %. So we think it is an important area where the
district administration should top up.
• The average number of primary schools per village is 1.45 which sounds reasonably
good. But the district average of the number of primary teachers per school (3.57 per
school) is in fact higher than the national average (2.84 per school based on Census
2001), but the national average itself is very poor. It means that on an average all the four
classes in a primary school cannot be held. So though the district average is better than
the national average, the district administration should pay attention to this.
• So far secondary schools are concerned, the performance of the district is very poor –
0.49 secondary and higher secondary schools per village. This also needs intervention.
• Apparently the district performs very poor in terms of health related infrastructure. So
looking at only vaccination or institutional delivery is inadequate. A mere 3.57% of
villages have government hospitals in its vicinity, 28.38 % of villages have primary
50

health centers or sub-centres situated within the village, average distance of primary
health center or sub-centres is 3.48 Km., average distance of government hospital is
14.82 Km., average distance of private hospital or nursing home is 14.34 Km. A large
percentage of families – 32.61% Muslims and 28.72% non-Muslims go to quacks for
treatment though some of them also go to government hospitals or private practitioners.
For taking pregnant women to hospitals for delivery the major means is rented cars, there
is hardly any ambulance available for this purpose in the villages. This is an important
area where the policy makers should think of providing at least one ambulance per
village.
• For the ICDS centers only 48.28 % are housed in government building while 32.25 %
have good quality building and average number of visits of ICDS employees is only 5.61
days in a year.
• In addition to the above specific developmental gap of the district it may be noted that
intra district variation of the development indicators is very high. The blocks far off from
the district head quarter or sub-divisional towns are extremely backward, the fruits of
development have benefited mainly the areas that are close to urban conglomerates. Care
should be given to intra district variation of backwardness when drawing up multi sector
development plan.
51
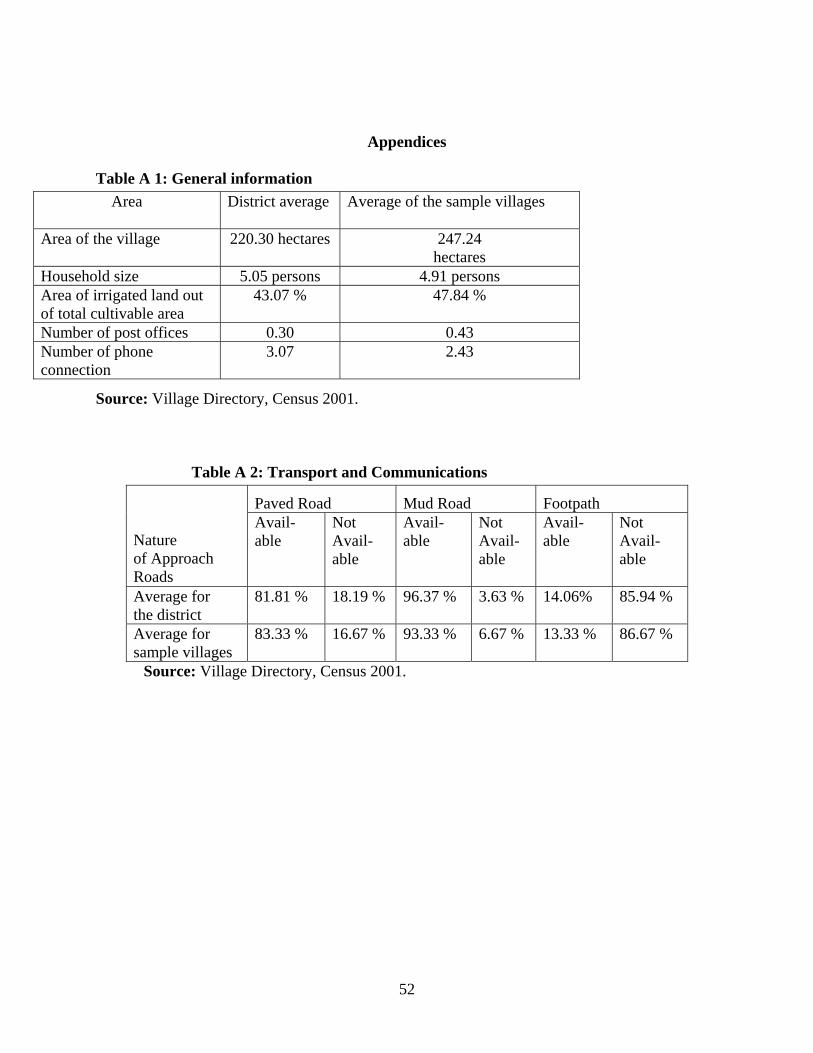
Appendices Table A 1: General information
Area District average Average of the sample villages
Area of the village 220.30 hectares 247.24 hectares
Household size 5.05 persons 4.91 persons Area of irrigated land out of total cultivable area
43.07 % 47.84 %
Number of post offices 0.30 0.43 Number of phone connection
3.07 2.43
Source: Village Directory, Census 2001.
Table A 2: Transport and Communications
Source: Village Directory, Census 2001.
Paved Road Mud Road Footpath
Nature of Approach Roads
Avail-able
Not Avail- able
Avail- able
Not Avail- able
Avail- able
Not Avail- able
Average for the district
81.81 % 18.19 % 96.37 % 3.63 % 14.06% 85.94 %
Average for sample villages
83.33 % 16.67 % 93.33 % 6.67 % 13.33 % 86.67 %
52
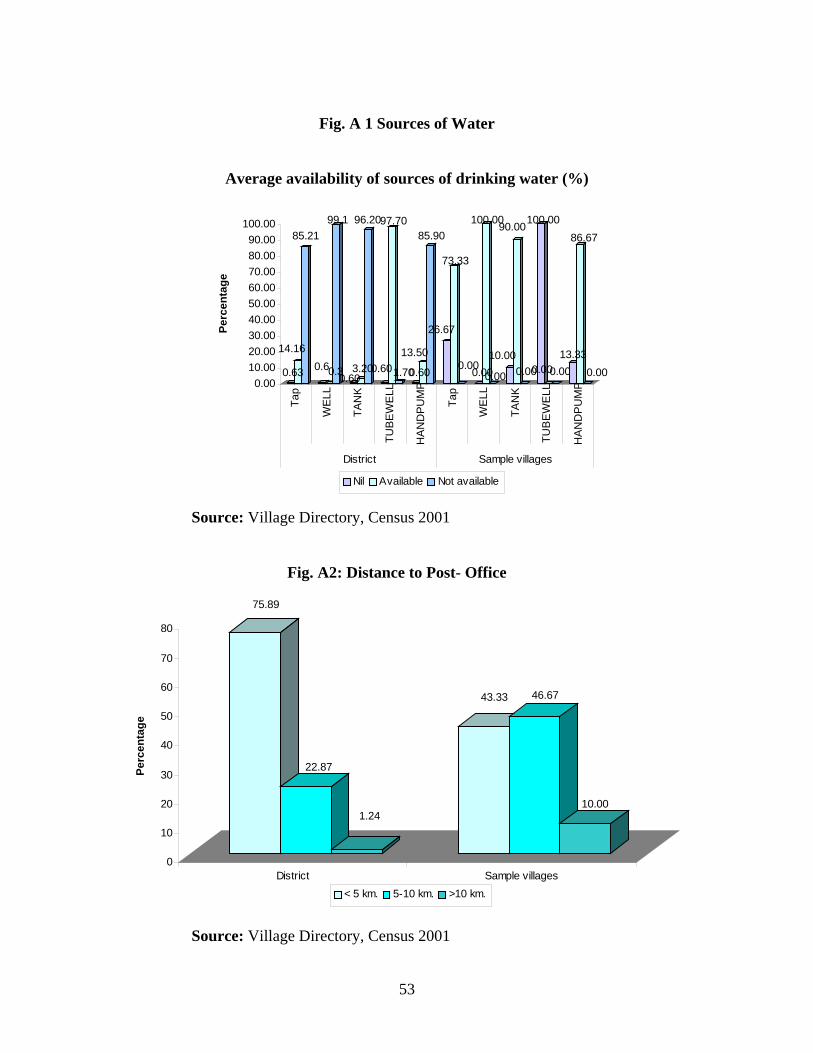
Fig. A 1 Sources of Water
Average availability of sources of drinking water (%)
0.63
14.16
85.21
0.60.3
99.1
0.603.20
96.20
0.60
97.70
1.700.60
13.50
85.90
26.67
73.33
0.000.00
100.00
0.00
10.00
90.00
0.00
100.00
0.000.0013.33
86.67
0.000.00
10.0020.0030.0040.0050.0060.0070.0080.0090.00
100.00Pe
rcen
tage
Tap
WE
LL
TAN
K
TUB
EW
ELL
HA
ND
PU
MP
Tap
WE
LL
TAN
K
TUB
EW
ELL
HA
ND
PU
MP
District Sample villages
Nil Available Not available
Source: Village Directory, Census 2001
Fig. A2: Distance to Post- Office
75.89
22.87
1.24
43.33 46.67
10.00
0
10
20
30
40
50
60
70
80
Perc
enta
ge
District Sample villages< 5 km. 5-10 km. >10 km.
Source: Village Directory, Census 2001
53
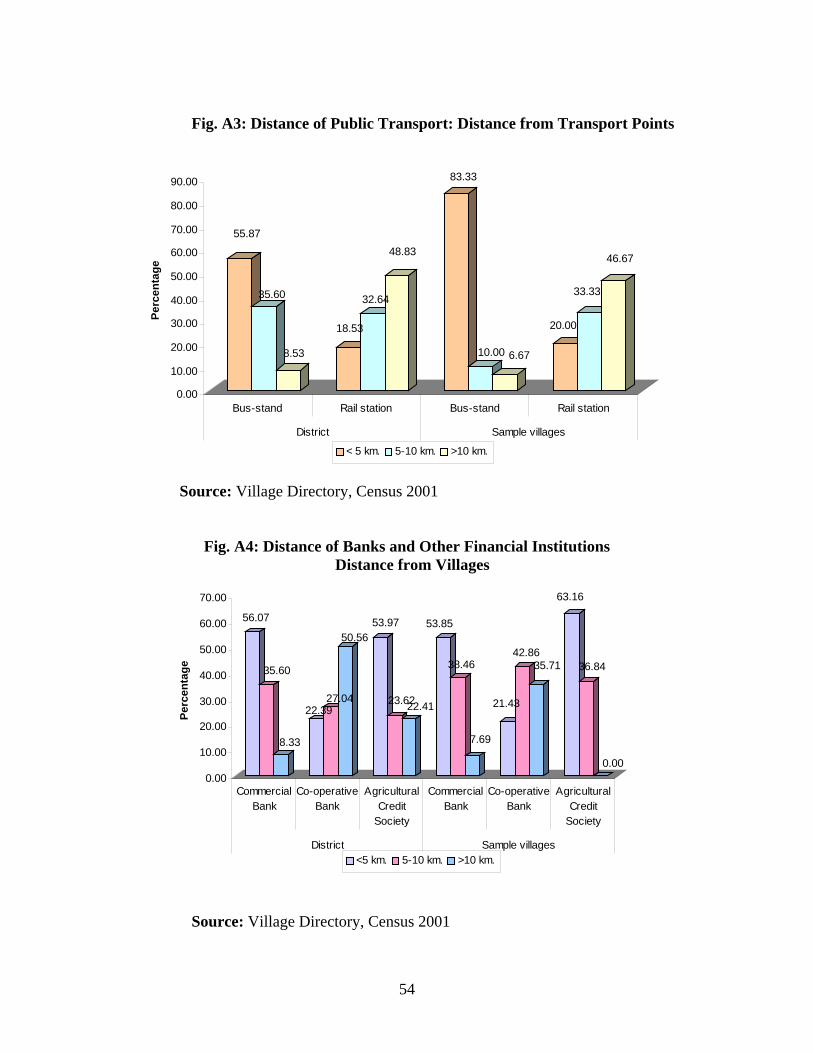
Fig. A3: Distance of Public Transport: Distance from Transport Points
55.87
35.60
8.53
18.53
32.64
48.83
83.33
10.00 6.67
20.00
33.33
46.67
0.00
10.00
20.00
30.00
40.00
50.00
60.00
70.00
80.00
90.00
Perc
enta
ge
Bus-stand Rail station Bus-stand Rail station
District Sample villages
< 5 km. 5-10 km. >10 km.
Source: Village Directory, Census 2001
Fig. A4: Distance of Banks and Other Financial Institutions Distance from Villages
56.07
35.60
8.33
22.3927.04
50.5653.97
23.6222.41
53.85
38.46
7.69
21.43
42.8635.71
63.16
36.84
0.000.00
10.00
20.00
30.00
40.00
50.00
60.00
70.00
Perc
enta
ge
CommercialBank
Co-operativeBank
AgriculturalCredit
Society
CommercialBank
Co-operativeBank
AgriculturalCredit
Society
District Sample villages<5 km. 5-10 km. >10 km.
Source: Village Directory, Census 2001
54

Fig. A5: Irrigation
Area of irrigated cultivable land
43.07%
47.84%
40.00%
41.00%
42.00%
43.00%
44.00%
45.00%
46.00%
47.00%
48.00%Pe
rcen
tage
District Sample villagesDistrict Sample villages
Source: Village Directory, Census 2001.
55

Sampling Methodology
The primary unit for survey is census village. A sample of villages will be selected for
each district. If the population of the district is greater than 0.5 million then a total of 30 villages
will be chosen for the district and if the population is less than or equal to 0.5 million then 25
villages will be chosen for the district. For the purpose of sampling the district is classified into
three strata Si (i=1,2,3). For stratification of villages in the district percentage of minority
population will be used as the criteria. But since there is no published data on minority
population at the village level, one has to work with percentage of minority population at the
level of CD block.
Let N be the no. of CD blocks in a district and pj (j=1,…..,N) be the percentage of minority
population of the j th. block. These N blocks are then arranged in descending order (one can also
use ascending order) by pj. The top 20%, middle 50% and the bottom 30% constitutes S1, S2 and
S3 respectively. Each Si contains the villages belonging to the respective blocks. Let Pi (i =1,2,3)
be the proportion of rural population in Si to district rural population. No. of villages from each
strata will be chosen by the proportion of population of that strata in the total. Then denoting the
no. of villages to be drawn from Si by ni one obtains
ni = (Pi) 25, if the district population is less than equal to 0.5 million
= (Pi) 30, if the district population is greater than 0.5 million,
subject to a minimum of 6 villages in each stratum.
The villages are chosen by the method of PPS (probability proportional to population)
with replacement from each of Si where aggregate population of villages are the size criteria (as
per census 2001).
After the sample villages are chosen by the method described above the next task is to
choose the sample of households for each village. If population of the sample village is less than
or equal to 1200 all households will be listed. If population of the village is more than 1200, 3 or
more hamlet groups will be chosen. For this purpose one may exactly follow the methodology of
NSSO for hamlet group formation. A total of two hamlet groups will be chosen from these
hamlet groups. Out of these two, one hamlet group will be the one with highest minority
population (for the district). Another hamlet group will be chosen randomly from the remaining
hamlet groups. The households of chosen hamlet groups will be listed. While listing the
56
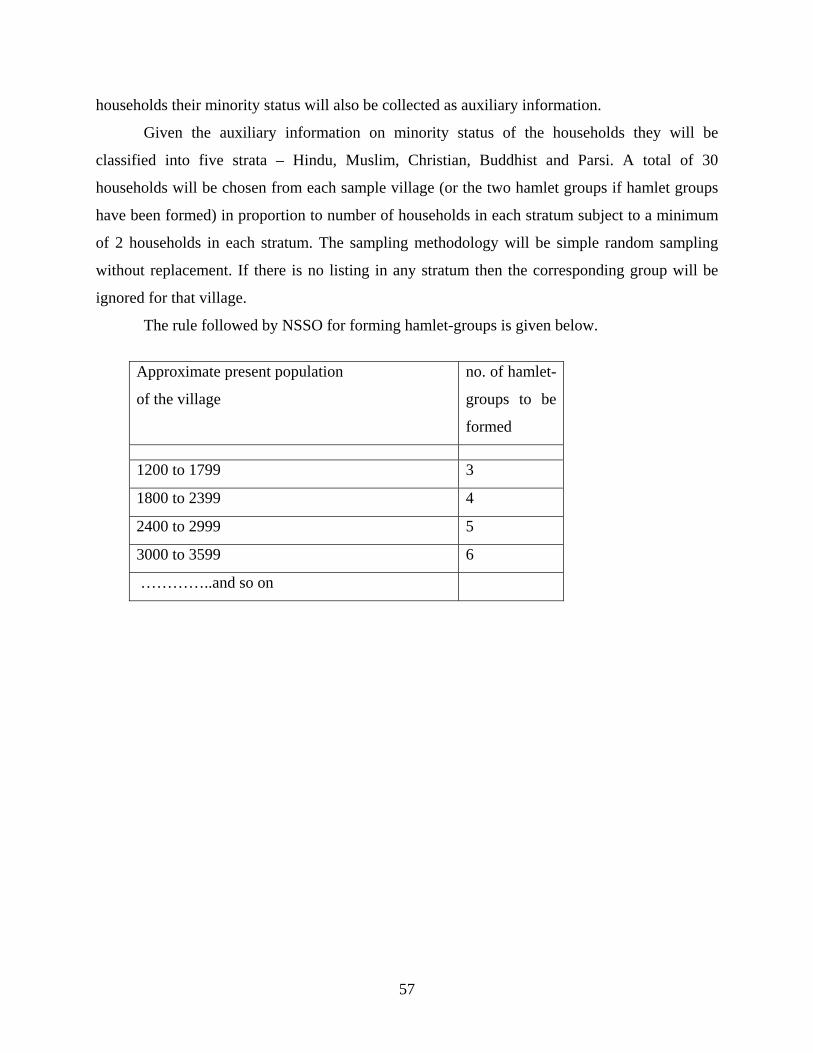
households their minority status will also be collected as auxiliary information.
Given the auxiliary information on minority status of the households they will be
classified into five strata – Hindu, Muslim, Christian, Buddhist and Parsi. A total of 30
households will be chosen from each sample village (or the two hamlet groups if hamlet groups
have been formed) in proportion to number of households in each stratum subject to a minimum
of 2 households in each stratum. The sampling methodology will be simple random sampling
without replacement. If there is no listing in any stratum then the corresponding group will be
ignored for that village.
The rule followed by NSSO for forming hamlet-groups is given below.
Approximate present population
of the village
no. of hamlet-
groups to be
formed
1200 to 1799 3
1800 to 2399 4
2400 to 2999 5
3000 to 3599 6
…………..and so on
57