minnesota’s water quality monitoring strategy 2011-2012€™s water quality monitoring strategy...
TRANSCRIPT

z c
September 2011
Minnesota’s Water Quality Monitoring Strategy 2011 to 2021 A report prepared for the U.S. Environmental Protection Agency

Minnesota Pollution Control Agency 520 Lafayette Road North | Saint Paul, MN 55155-4194 | www.pca.state.mn.us | 651-296-6300 Toll free 800-657-3864 | TTY 651-282-5332 This report is available in alternative formats upon request, and online at www.pca.state.mn.us
Document number: p-gen1-10
Acknowledgements
MPCA Water Quality Monitoring Leadership Team: Pat Carey, Mary Jean Fenske, Lee Ganske, Dan Helwig, John Hensel, Paul Hoff, Juline Holleran, Louise Hotka, Marc Jacobs, Katrina Kessler, Reed Larson, Timothy Larson, Brian Livingston, Katherine Logan, Laurel Mezner, Scott Niemela, Catherine O’Dell, Glenn Skuta, Stephen Thompson, Mark Tomasek, Dana Vanderbosch, Jim Ziegler
Others from the MPCA: Byron Adams, Jesse Anderson, Pam Anderson, Heidi Bauman, Pat Baskfield, Gerry Blaha, Michael Bourdaghs, Linda Carroll, Dave Christopherson, Jason Ewert, Mark Ferrey, Peter Fastner, Roger Fisher, Brian Fredrickson, John Genet, Mark Gernes, Doug Hansen, Steve Heiskary, David L. Johnson, Gregory Johnson, Sharon Kroening, Kim Laing, Deb Lindlief, Shannon Lotthammer, Jennifer Maleitzke, Bruce Monson, Howard Markus, Bill Priebe, Angela Preimesberger, Johanna Schussler, Bradley Sielaff, Carol Sinden, Laurie Sovell, Summer Streets, Mike Trojan, Wendy Turri, Bruce Wilson
Partner Organizations: Kent Johnson, Metropolitan Council Environmental Services Heather Johnson, Dan Stoddard, Minnesota Department of Agriculture Jan Falteisek, Jeannette Leete, Jason Moeckel, Julie Westerlund, David Wright, Minnesota Department of Natural Resources, Sheila Grow, Bruce Olsen, Minnesota Department of Health, James Stark, James Fallon, Don Hansen U.S. Geological Survey
The MPCA is reducing printing and mailing costs by using the Internet to distribute reports and information to wider audience. Visit our web site for more information.
MPCA reports are printed on 100% post-consumer recycled content paper manufactured without chlorine or chlorine derivatives.

Contents
Introduction ............................................................................................................................ 1 Minnesota’s Clean Water Legacy Act and the Clean Water, Land and Legacy Amendment ...... 1
Passage of the Clean Water Legacy Act ................................................................................................... 2 Development and passage of the Clean Water, Land and Legacy Amendment ........................................ 2 Partnerships in protecting Minnesota’s waters ....................................................................................... 3
Moving to a Watershed Approach ........................................................................................... 4 Benefits of the watershed approach ........................................................................................................ 5
Types of Monitoring ................................................................................................................ 6 Organization of the Strategy .................................................................................................... 7
Section 1: Goals and Objectives ....................................................................................... 8 Section 1.1: Goals and Objectives ............................................................................................ 9
1.1.a Minnesota Pollution Control Agency’s strategic goals for water quality protection and restoration ............................................................................................................................................. 9 1.1.b Minnesota’s Nonpoint Source Management Plan monitoring goals ............................................. 10
Section 2: Surface Water ................................................................................................. 12 Section 2.1: Condition Monitoring Strategy ........................................................................... 13
2.1.a Major watershed condition monitoring ....................................................................................... 13 2.1.b Targeted monitoring activities..................................................................................................... 21 2.1.c Probabilistic monitoring activities ................................................................................................ 24 2.1.d Special studies monitoring ........................................................................................................... 27
Section 2.2: Problem Investigation Monitoring Strategy ........................................................ 30 Section 2.3: Effectiveness Monitoring Strategy ...................................................................... 32 Section 2.4: Surface Water Monitoring Purposes, Designs and Indicators .............................. 33
2.4.a Surface water monitoring purposes ............................................................................................. 33 2.4.b Surface water monitoring designs ............................................................................................... 44 2.4.c Surface water monitoring indicators ............................................................................................ 44
Section 2.5: External Organization Monitoring ...................................................................... 51 2.5.a Minnesota Department of Agriculture surface water quality monitoring activities ...................... 51 2.5.b Minnesota Department of Natural Resources surface water quality monitoring activities ............ 53 2.5.c Metropolitan Council Environmental Services surface water quality monitoring activities ............ 56 2.5.d U.S. Geological Survey surface water quality monitoring activities .............................................. 60
Section 2.6: Monitoring Quality Assurance ............................................................................ 66 Section 2.7: Data Management ............................................................................................. 66 Section 2.8: Data Analysis ...................................................................................................... 67
2.8.a Comparison to standards (305b/303d) ......................................................................................... 67 2.8.b Evaluation of water quality trends ............................................................................................... 71
Section 2.9: Data Reporting ................................................................................................... 73 Section 2.10: Programmatic Evaluation ................................................................................. 76 Section 2.11: General Support and Infrastructure Planning ................................................... 78
2.12.a Identified needs ......................................................................................................................... 78

Section 3: Groundwater .................................................................................................. 81 Section 3.1: Minnesota’s Multi-Agency Approach to Monitoring Groundwater ..................... 82 Section 3.2: Condition Monitoring Strategy ........................................................................... 83
3.2.a Condition monitoring purposes .................................................................................................... 83 3.2.b Condition monitoring designs ...................................................................................................... 83 3.2.c Condition monitoring indicators ................................................................................................... 88
Section 3.3: Problem Investigation Monitoring Strategy ........................................................ 90 Section 3.4: Effectiveness Monitoring Strategy ...................................................................... 91 Section 3.5: External Organization Monitoring ...................................................................... 91
3.5.a Minnesota Department of Agriculture groundwater quality monitoring ...................................... 92 3.5.b Minnesota Department of Health groundwater quality monitoring activities .............................. 93 3.5.c Minnesota Department of Natural Resources groundwater quality monitoring activities ............. 94 3.5.d Metropolitan Council Environmental Services groundwater quality monitoring activities ............ 95 3.5.e U.S. Geological Survey groundwater quality monitoring projects ................................................. 96
Section 3.6: Monitoring Quality Assurance ............................................................................ 97 Section 3.7: Data Management ............................................................................................. 98 Section 3.8: Data Analysis ...................................................................................................... 98 Section 3.9: Data Reporting ................................................................................................... 99 Section 3.10: Programmatic Evaluation ............................................................................... 100 Section 3.11: General Support and Infrastructure Planning ................................................. 100 Section 3.12: Identified Needs ............................................................................................. 101
Attachment 1: MPCA Water Monitoring Approaches ....................................................... 102
Attachment 2: Agreement to Operate an Integrated Ground Water Quality Monitoring System for the State of Minnesota ...................................................................................... 103

Minnesota’s Water Quality Monitoring Strategy 2011-2012 • September 2011 Minnesota Pollution Control Agency
1
Introduction Minnesota has an abundance of water resources – more surface water than any other of the 48 contiguous states. Minnesota boasts an estimated 105,000 miles of rivers and streams, 12,200 lakes, and 10.6 million acres of wetlands; in addition, Minnesota has generous reserves of good quality groundwater. Plentiful, accessible water is important to Minnesota’s agricultural and business economy, and is the reason that water recreation, such as fishing, canoeing and kayaking, swimming and other pursuits, makes up a large part of the state’s tourism revenue - a $10 billion dollar a year industry. However, the sheer abundance of water creates challenges for monitoring, assessing, protecting, and restoring Minnesota waters.
The Minnesota Pollution Control Agency (MPCA) and its partner agencies and organizations conduct numerous surface and groundwater monitoring activities to provide information about the status of the state’s water resources and to identify potential or actual threats to the quality of surface and groundwater, choose options for protecting and restoring waters that are impaired, and evaluate the effectiveness of implemented management plans. The goal of the MPCA and its partners is to provide information to assess – and ultimately to restore or protect – the integrity of Minnesota’s waters.
To be effective in conducting monitoring that will meet Minnesotan’s needs for information, Minnesota needs an overall guiding strategy. The MPCA has been developing the watershed approach since 2007 as a key strategy and organizing principle to guide its surface and groundwater quality monitoring activities and many other aspects of the agency’s water program. Two landmark events that have enabled the MPCA to develop and begin implementing the watershed approach are passage of Minnesota’s Clean Water Legacy Act (CWLA) in 2006 and passage of the Clean Water, Land and Legacy Amendment (Amendment) in 2008. The CWLA and the Amendment have provided a structure and a source of revenue that have greatly improved the ability of the MPCA and its partner agencies and organizations to achieve the MPCA’s strategic plan vision of clean, sustainable surface and groundwater.
This introduction provides important background for Minnesota’s Water Quality Monitoring Strategy, 2011-2021. This includes additional information about passage of the CWLA and Amendment; an overview of the watershed approach and how it benefits the agency’s goals to assess, protect, and restore Minnesota’s waters; a description of the monitoring types included in this Strategy; and finally a brief description of the Strategy’s organization.
Minnesota’s Clean Water Legacy Act and the Clean Water, Land and Legacy Amendment When the MPCA began addressing impaired waters in the late 1990s, only a small percentage of the state’s waters had been monitored and assessed, though the list of impairments to the state’s waters was already extensive and growing. MPCA managers felt a growing concern that the existing funding would not be able to adequately address the Clean Water Act’s requirement to assess all waters of the state, list waters that do not meet standards and conduct total maximum daily load (TMDL) studies in order to set pollutant reduction goals needed to restore waters. This concern was validated by the Minnesota Legislative Auditor in January 2002, when it documented the significant under-funding of these Clean Water Act requirements in its report on MPCA funding.

Passage of the Clean Water Legacy Act The Legislative Auditor’s Report, and subsequent legislative actions and recommendations, resulted in the MPCA initiating an impaired waters stakeholder process at the end of 2003 to bring agriculture, environment, business, and local unit of government representatives together, along with a number of state agencies, to develop policy and funding recommendations to address Minnesota’s impaired waters. This group became known as the “Group of 16” or “G16.”
In February 2004, the G16 provided its policy recommendations to the Minnesota Legislature. However, funding to implement the group’s recommendations was not available. The recommendations gained traction in 2005 when issues related to wastewater treatment plant discharges located upstream of impaired waters, and impacts to growth, became prominent. A combination of these factors led to development and passage of the CWLA in 2006. The CWLA can be found at www.revisor.mn.gov/bin/getpub.php?pubtype=stat_chap&year=current&chapter=114d.
The CWLA required creation of an oversight committee to provide advice to legislative and executive branches of government on the administration and implementation of the CWLA and to facilitate coordination between all stakeholders playing a role in achieving clean water for all Minnesotans. This committee is known as the Clean Water Council; more information about the Clean Water Council can be found at www.pca.state.mn.us/index.php/about-mpca/mpca-overview/councils-and-forums/clean-water-council/clean-water-council.html?menuid=&missing=0&redirect=1.
Development and passage of the Clean Water, Land and Legacy Amendment Following passage of the CWLA, stakeholders wanted to ensure a long-term source of sustainable funding for restoring and protecting Minnesota’s waters. A further campaign with additional stakeholders resulted in a ballot initiative to amend Minnesota’s Constitution.
On November 4, 2008, Minnesota voters approved the Clean Water, Land and Legacy Amendment to protect drinking water sources; to protect, enhance, and restore wetlands, prairies, forests, and fish, game, and wildlife habitat; to preserve arts and cultural heritage; to support parks and trails; and to protect, enhance, and restore lakes, rivers, streams, and groundwater.
The Amendment increased Minnesota’s sales and use tax rate by three-eighths of one percent on taxable sales, starting July 1, 2009, continuing through 2034. One-third of those funds are dedicated to a Clean Water Fund (CWF) to protect, enhance, and restore water quality in lakes, rivers, streams, and groundwater, with at least five percent of the fund targeted to protect drinking water sources. When passed, it was explicitly stated that these funds are to supplement, not supplant, existing funding for state agencies.
In the 2009 Legislative session, the MPCA received $51.16M for the FY2010-11 biennium from the newly-created CWF. Activities funded included significantly enhanced monitoring, TMDL and protection strategy development, and implementation.
Minnesota’s Water Quality Monitoring Strategy 2011-2012 • September 2011 Minnesota Pollution Control Agency
2

Minnesota’s Water Quality Monitoring Strategy 2011-2012 • September 2011 Minnesota Pollution Control Agency
3
Partnerships in protecting Minnesota’s waters The MPCA and six other agency partners collaborate in Minnesota’s water resource management activities under the CWF:
• Minnesota Department of Natural Resources (MDNR)
• Minnesota Department of Agriculture (MDA)
• Minnesota Department of Health (MDH)
• Minnesota Board of Water and Soil Resources (BWSR)
• Minnesota Public Facilities Authority (MPFA)
• Metropolitan Council (Met Council)
Additionally, these agencies collaborate with the University of Minnesota’s Water Resources Center, the Minnesota State University Water Resources Center, the Natural Resources Research Institute at the University of Minnesota Duluth, and other academia. To facilitate this collaboration, the Clean Water Fund Interagency Coordination Team (Coordination Team) was established. The purposes of the Coordination Team are:
• coordinating state agency clean water activities to achieve CWF outcomes
• coordinating and leveraging funding opportunities to achieve CWF purposes
• enhancing institutional knowledge for future water management activities
• providing consistent CWF information for public use, reporting and administrative procedures
Coordination Team members represent the perspectives of their organization and serve as spokespersons for the Coordination Team within the agency/organization that they represent. The team employs systematic water quality protection and restoration strategies for the 25-year life of the Amendment funding, using existing programs to avoid adding additional bureaucratic layers and to eliminate duplication of water management activities.
The Coordination Team has further established the following interagency sub teams (Figure 1) to achieve sustainable management and protection of the state’s surface water and groundwater resources:
• surface water monitoring/assessment • protection/restoration strategy development • implementation • research • groundwater/drinking water • measures/outcomes • communications
An overall system expectation is that each sub team will be integrally linked to the other sub teams to achieve the overall broad goal of protecting the state’s public health, economic health and ecosystem health.

Figure 1. Interagency Clean Water Fund sub teams
Protecting and restoring Minnesota’s waters is a priority for all of the agencies and organizations that receive a part of the CWF. Although the agencies have varied and unique missions, partnership and coordination around water quality management activities has been occurring for years. With passage of the Amendment, this coordination has been institutionalized into a system. Because the CWF will exist for 25 years, agencies will employ adaptive management strategies to ensure the best environmental outcomes are achieved throughout the life of the funding.
Moving to a Watershed Approach Since preparation of the 2004 – 2014 Water Quality Monitoring Strategy, the MPCA has changed the organizing approach for its water program from the major river basin scale (there are portions of 10 major river basins within the state of Minnesota) to the “major,” or eight-digit hydrologic unit code (HUC) level, watershed approach. There are 81 of these major watersheds in Minnesota. The MPCA and its partners began implementing the watershed approach in 2007 following a pilot monitoring study that was conducted in the Snake River Watershed in 2006.
Minnesota’s Water Quality Monitoring Strategy 2011-2012 • September 2011 Minnesota Pollution Control Agency
4

Minnesota’s Water Quality Monitoring Strategy 2011-2012 • September 2011 Minnesota Pollution Control Agency
5
The MPCA’s watershed approach involves intensively monitoring the streams and lakes within a major watershed to: determine the overall health of these water resources, identify impaired waters, and identify waters in need of additional protection efforts to prevent impairments. Follow-up monitoring is then conducted in impaired sub-watersheds to determine the cause(s) of the impairments (i.e. the “stressors” impacting the biological community) and begin identification of pollutant sources and priority management zones. A restoration plan (Total Maximum Daily Load or TMDL) and/or protection strategy and implementation plan is then written for the watershed; following this, partnering agencies and watershed stakeholders can begin best management practice improvements based on these efforts. Regulatory efforts continue throughout the process and are adjusted as needed to achieve the clean water goals.
A key element of the watershed approach is the goal to assess the condition of Minnesota’s waters (all 81 watersheds) via a 10-year cycle that starts over again after the first 10-year cycle is complete. During the second 10-year cycle, the same progression of intensive monitoring to assess current condition and detect any changes, followed by updating of protection and restoration strategies, and then additional implementation efforts, is pursued in each watershed.
Benefits of the watershed approach The intensive nature of the monitoring conducted as part of the watershed approach leads to one of the approach’s significant benefits – the identification of most, if not all, impairment problems and protection needs within the watershed at one time. This provides the opportunity to address the needs in the watershed through a coordinated strategy development process. This is much different than past monitoring efforts, when limited monitoring resources were distributed broadly within the major basins and not concentrated in defined areas. As a result, the MPCA often identified some impairments in an area during one year, and additional impairments in the same area in later years during follow up monitoring conducted for the TMDL study; this often necessitated a separate TMDL study or slowed the progress of the one underway, and was inefficient and confusing. The watershed approach prevents this from occurring through more comprehensive monitoring and assessment, enabling the development of watershed-wide studies that will address both protection and restoration needs.
Another major benefit of the watershed approach is that it provides predictability in the monitoring schedule. By establishing a schedule for monitoring all of the state’s major watersheds every 10 years, the state can accomplish the following:
• Provide advance notice to interested stakeholders, local governments and volunteers regarding monitoring plans.
• Assist local groups in ramping up their monitoring efforts to provide data in advance of or in between agency monitoring efforts.
• Provide stakeholders a heads up as to when they can expect the TMDL study and protection strategy work to begin in their area.
• Ensure that comprehensive information on the status of water quality – and water quality management efforts – is collected, evaluated and provided to state and local partners at least once each decade.
These advantages simplify planning for all aspects of implementation of the federal Clean Water Act.

Minnesota’s Water Quality Monitoring Strategy 2011-2012 • September 2011 Minnesota Pollution Control Agency
6
Types of Monitoring The purpose of this monitoring strategy is to document all elements of the MPCA’s monitoring program strategy for surface water and groundwater. The MPCA generally categorizes its monitoring activities according to the monitoring purpose and how the monitoring data are assessed and used. Monitoring activities usually fall into one of three “use” categories, as follows:
• Condition monitoring: This type of monitoring is used to identify overall environmental status and trends by examining the condition of individual water bodies or aquifers in terms of their ability to meet established standards and criteria. Condition monitoring may include chemical, physical, or biological measures. The focus of condition monitoring is on understanding the status of the resource, identifying changes over time, and identifying and defining problems at the overall system level. Examples include: the intensive watershed monitoring conducted in Minnesota’s major watersheds; probabilistic monitoring conducted at various scales to evaluate the quality of lakes, rivers, and wetlands; and ambient groundwater quality monitoring.
• Problem investigation monitoring: This monitoring involves investigating specific problems or protection concerns to allow for the development of a management approach to protect or improve the resource. Problem investigation monitoring is used to determine the specific causes of impairments to surface water, to evaluate the extent and magnitude of a contaminant plume in groundwater, and to quantify inputs/loads of contaminants to a water body from various sources. It is also used to determine the actions needed to return a resource to a condition that meets standards or goals. Examples include: stressor identification (ID) monitoring in a major watershed that contains impaired waters; monitoring of groundwater and possibly surface water at chemical release sites; and monitoring conducted for Clean Water Partnership and federal Clean Water Act Section 319 projects.
• Effectiveness monitoring: This type of monitoring is used to determine the effectiveness of a specific regulatory or voluntary management action taken to improve impaired waters or remediate contaminated groundwater. Effectiveness monitoring allows for the evaluation and refinement of a selected management or remedial action over time to ensure the approach is ultimately successful. Examples of effectiveness monitoring are monitoring conducted following implementation of watershed protection and restoration strategies or best management practices (BMPs) at various scales, such as the subwatershed, watershed, or basin. Also, effluent monitoring that is done to assess the compliance of a facility with a permit, rule or statute (i.e. compliance tracking); in this example, the monitoring data provide information about how regulatory actions applied to a facility affect the facility’s contributions to the associated water bodies (not the effect of the facility’s contribution on the water body itself).
These definitions are important in distinguishing and understanding the purposes of various monitoring efforts; however, it should be noted there is often a degree of overlap between the various categories. This is most often the case with condition and effectiveness monitoring, as the difference between the two monitoring types is largely a matter of scale. Effectiveness monitoring is often done at the management practice scale, to evaluate specific management actions, but can also be done at larger scales in a less-refined way. That is, condition monitoring can be applied as a tool to track the system-wide effectiveness of broader environmental protection efforts. In reviewing this report, it will be important to keep in mind the monitoring type being discussed in order to understand how a particular monitoring effort fits into the overall strategy.

Minnesota’s Water Quality Monitoring Strategy 2011-2012 • September 2011 Minnesota Pollution Control Agency
7
• Special studies monitoring: Some monitoring activities do not neatly fit into the monitoring types discussed above. This is especially true of special studies monitoring. This category includes a number of different lake and stream studies that are more research-focused. Examples of special studies monitoring include monitoring related to emerging issues (pharmaceuticals, wastewater compounds, etc.); monitoring related to critical toxic pollutants such as mercury; monitoring focused on specific geographic areas; and monitoring focused on a specific problem or to answer a specific question. This type of monitoring is generally characterized by a very narrow focus and a study of relatively short duration.
Organization of the Strategy Minnesota’s Water Quality Monitoring Strategy 2011 – 2021 contains three main sections that discuss overall goals and objectives, surface water and groundwater. The surface water and groundwater sections discuss Minnesota’s strategies by monitoring type: condition, problem investigation, and effectiveness. Frequent links to obtain additional information are included.

Minnesota’s Water Quality Monitoring Strategy 2011-2012 • September 2011 Minnesota Pollution Control Agency
8
Section 1: Goals and Objectives

Minnesota’s Water Quality Monitoring Strategy 2011-2012 • September 2011 Minnesota Pollution Control Agency
9
Section 1.1: Goals and Objectives The MPCA’s strategic plan, last revised in 2008, charts the agency’s direction for the next several years. It contains a balance of goals and objectives reflecting the agency’s “core” regulatory work — permitting, inspections, compliance, enforcement — and its non-regulatory work – monitoring and assessment, planning, and also agency aspirations needed to better align results with our mission. The agency’s goals for water quality protection and restoration are provided below. Additional water quality monitoring goals related to nonpoint source pollution are outlined in the state of Minnesota’s 2008 Nonpoint Source Management Plan (NSMP).
1.1.a Minnesota Pollution Control Agency’s strategic goals for water quality protection and restoration The MPCA’s vision for water is that Minnesota has clean, sustainable surface and groundwater. The strategic plan includes three key goals to help the MPCA in its efforts to achieve this vision.
Goal W.1. Assess the condition of Minnesota’s groundwater systems and provide information on the effectiveness of BMPs to assist the agency’s efforts to prevent and reduce degradation of groundwater and support groundwater conservation.
Objective W1a) Assess the ambient condition of Minnesota’s groundwater, focusing on vulnerable aquifers in nonagricultural areas.
Objective W1b) By December 31, 2012, and every five years thereafter, report on the condition of Minnesota’s groundwater.
Objective W1c) By December 31, 2010, identify BMPs employed by programs to prevent or reduce groundwater degradation, highlight those for which more data are needed to evaluate effectiveness, and develop a plan for addressing the data gaps.
Goal W.2. Assess the chemical, physical and biological integrity of Minnesota’s lakes, streams and wetlands to identify if designated uses are being met, and provide information on the condition of waters.
Objective W2a) By December 31, 2017, sample and assess Minnesota’s 81 major watersheds to determine if they meet designated aquatic life, recreation and consumption beneficial uses, and to identify pollutant load trends.
Objective W2b) By January 1, 2017, gather water quality data and assess 100 percent of the lakes 500 acres and larger; at least 25 percent of the lakes between 100 and 499 acres; and continue to expand the Citizen Lake and Citizen Stream Monitoring programs by 5 percent per year.
Objective W2c) Beginning in 2010, evaluate the overall state-wide quality of Minnesota’s wetlands using probabilistic surveys every three years to determine if wetland programs are meeting the goal of no net loss of wetland quality and assist the MDNR and BWSR in their evaluation of wetland quantity.

Minnesota’s Water Quality Monitoring Strategy 2011-2012 • September 2011 Minnesota Pollution Control Agency
10
Objective W2d) By April 1, 2010, and every two years thereafter, identify impaired waters, report that information to the U.S. Environmental Protection Agency (EPA) according to their requirements, and provide information about impaired and unimpaired waters to Minnesotans.
Goal W.3. Protect and improve the chemical, physical and biological integrity of Minnesota’s lakes, streams and wetlands. Protect and improve the chemical, physical and biological integrity of Minnesota’s lakes, streams and wetlands.
Objective W3a) By May 1, 2011, and every three years thereafter, review Minnesota’s water quality standards to incorporate standards that reflect current science and information.
Objective W3b) Wastewater National Pollutant Discharge Elimination System (NPDES) facilities do not contribute to the impairment or degradation of state waters.
Objective W3c) By January 1, 2014, strengthen local programs to reduce the percentage of subsurface soil treatment systems (SSTS) characterized as failing or imminent threats to public health and safety from 39 percent to less than 5 percent.
Objective W3d) NPDES Stormwater sources do not contribute to the impairment or degradation of state waters.
1.1.b Minnesota’s Nonpoint Source Management Plan monitoring goals Minnesota’s 2008 NSMP, prepared by the MPCA in partnership with a consortium of federal, state, and local organizations as part of EPA’s Clean Water Act Section 319 planning process, includes water quality monitoring goals related to nonpoint source pollution.
NPS 1. Develop baseline data necessary to allow establishment of good status and trend information relative to surface water and groundwater at the state/regional level.
NPS 2. Establish reference conditions, criteria or standards for those water body types or types of measurement for which such references do not currently exist.
NPS 3. Improve monitoring designed to characterize nonpoint source (NPS) contributions to water quality problems.
NPS 4. Promote effective use of BMPs through assessing the improvement in water quality relative to specific NPS reduction actions.
NPS 5. Design monitoring programs to meet management information needs concerning identified geographic areas or issues of concern, then use information obtained for resource management decision-making.
NPS 6. Improve communication linkages both between state and local resource managers, as well as among the various local, state and federal agencies within the state for purposes of expanding the water quality monitoring database and enhancing accessibility to it.
Minnesota’s Water Quality Monitoring Strategy 2011-2012 • September 2011 Minnesota Pollution Control Agency
11
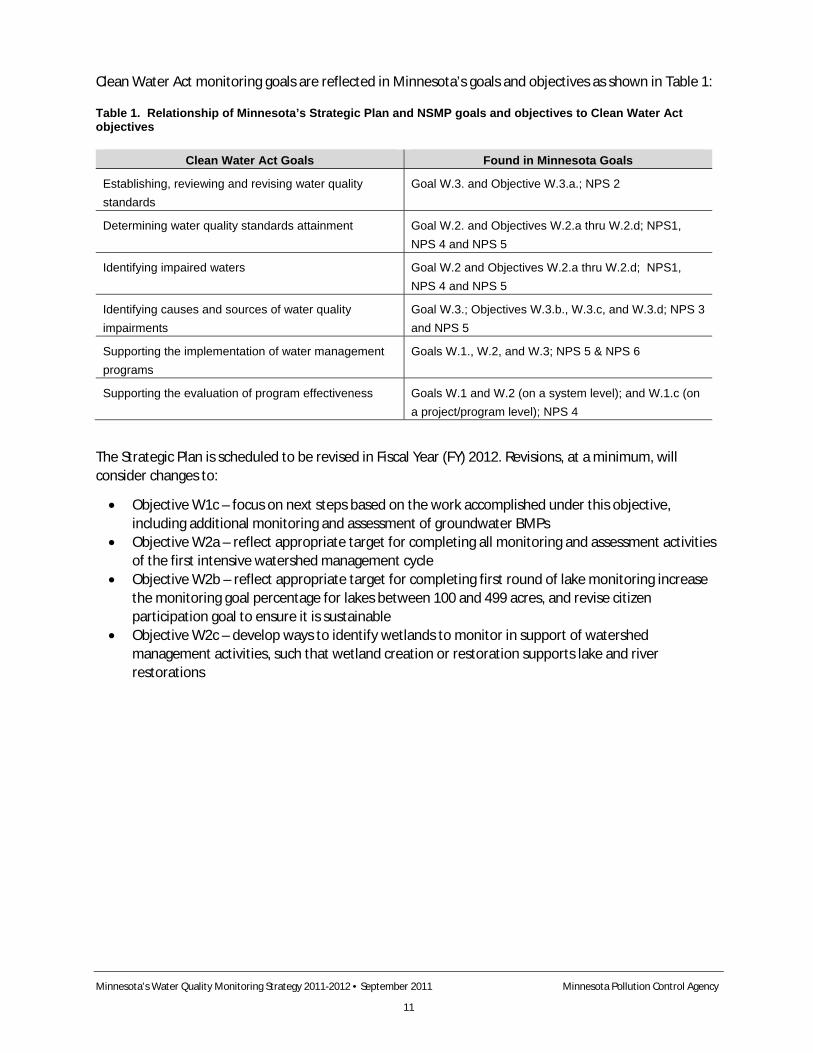
Clean Water Act monitoring goals are reflected in Minnesota’s goals and objectives as shown in Table 1:
Table 1. Relationship of Minnesota’s Strategic Plan and NSMP goals and objectives to Clean Water Act objectives
Clean Water Act Goals Found in Minnesota Goals
Establishing, reviewing and revising water quality standards
Goal W.3. and Objective W.3.a.; NPS 2
Determining water quality standards attainment Goal W.2. and Objectives W.2.a thru W.2.d; NPS1, NPS 4 and NPS 5
Identifying impaired waters Goal W.2 and Objectives W.2.a thru W.2.d; NPS1, NPS 4 and NPS 5
Identifying causes and sources of water quality impairments
Goal W.3.; Objectives W.3.b., W.3.c, and W.3.d; NPS 3 and NPS 5
Supporting the implementation of water management programs
Goals W.1., W.2, and W.3; NPS 5 & NPS 6
Supporting the evaluation of program effectiveness Goals W.1 and W.2 (on a system level); and W.1.c (on a project/program level); NPS 4
The Strategic Plan is scheduled to be revised in Fiscal Year (FY) 2012. Revisions, at a minimum, will consider changes to:
• Objective W1c – focus on next steps based on the work accomplished under this objective, including additional monitoring and assessment of groundwater BMPs
• Objective W2a – reflect appropriate target for completing all monitoring and assessment activities of the first intensive watershed management cycle
• Objective W2b – reflect appropriate target for completing first round of lake monitoring increase the monitoring goal percentage for lakes between 100 and 499 acres, and revise citizen participation goal to ensure it is sustainable
• Objective W2c – develop ways to identify wetlands to monitor in support of watershed management activities, such that wetland creation or restoration supports lake and river restorations

Minnesota’s Water Quality Monitoring Strategy 2011-2012 • September 2011 Minnesota Pollution Control Agency
12
Section 2: Surface Water

Minnesota’s Water Quality Monitoring Strategy 2011-2012 • September 2011 Minnesota Pollution Control Agency
13
Section 2.1: Condition Monitoring Strategy Water quality condition monitoring is the starting point in implementing the Clean Water Act-mandated process of assessing water quality, planning for water quality protection or restoration, implementation of protective or corrective measures, and follow-up effectiveness monitoring. Water quality monitoring results are used to determine whether a water body meets standards and whether water is impaired and in need of restoration or unimpaired and in need of protection.
The MPCA’s primary condition monitoring activities are organized around Minnesota’s 81 major watersheds. The MPCA has established a schedule for intensively monitoring each major watershed over a 2 year period, once every 10 years, and in addition, monitoring the major watershed outlets for all 81 major watersheds every year. An outcome of this monitoring is the identification of waters that are impaired (i.e., do not meet standards) and need restoration, and identification of waters in need of further protection to prevent impairment.
The MPCA also conducts targeted monitoring to collect information about specific water resources, such as reference lakes or wetlands, and probabilistic (random) surveys of Minnesota lakes, streams, and wetlands to determine water quality condition and trends over time on a statewide or eco-region scale. The probabilistic studies allow the MPCA and others to gather monitoring data that is representative of conditions at scales larger than the major watershed scale.
While the overarching purpose of the MPCA’s condition monitoring activities is to assess the condition of Minnesota’s surface water resources, these data are also used to assess potential and actual threats to water quality and to evaluate the effectiveness of management activities taken to address impairments and other threats to water quality.
Monitoring conducted by the MPCA’s citizen monitoring programs by other local, state, and federal agencies, and data collected using remote sensing, are also used for this purpose.
2.1.a Major watershed condition monitoring In 2007, the MPCA began organizing its statewide condition monitoring program around Minnesota’s 81 major watersheds (i.e. 8-digit Hydrologic Unit Code or HUC level watershed) and monitoring the condition of its rivers, streams, and lakes on a watershed by watershed basis. Using this watershed approach, the MPCA conducts monitoring in an average 8 major watersheds each year, and will complete statewide monitoring over a 10-year period. The current 10-year schedule for watershed monitoring is shown in Figure 2, with more information located here: www.pca.state.mn.us/index.php/water/water-monitoring-and-reporting/water-quality-and-pollutants/water-quality-condition-monitoring/water-quality-condition-monitoring.html

Figure 2. Schedule for intensive watershed monitoring
Minnesota’s Water Quality Monitoring Strategy 2011-2012 • September 2011 Minnesota Pollution Control Agency
14
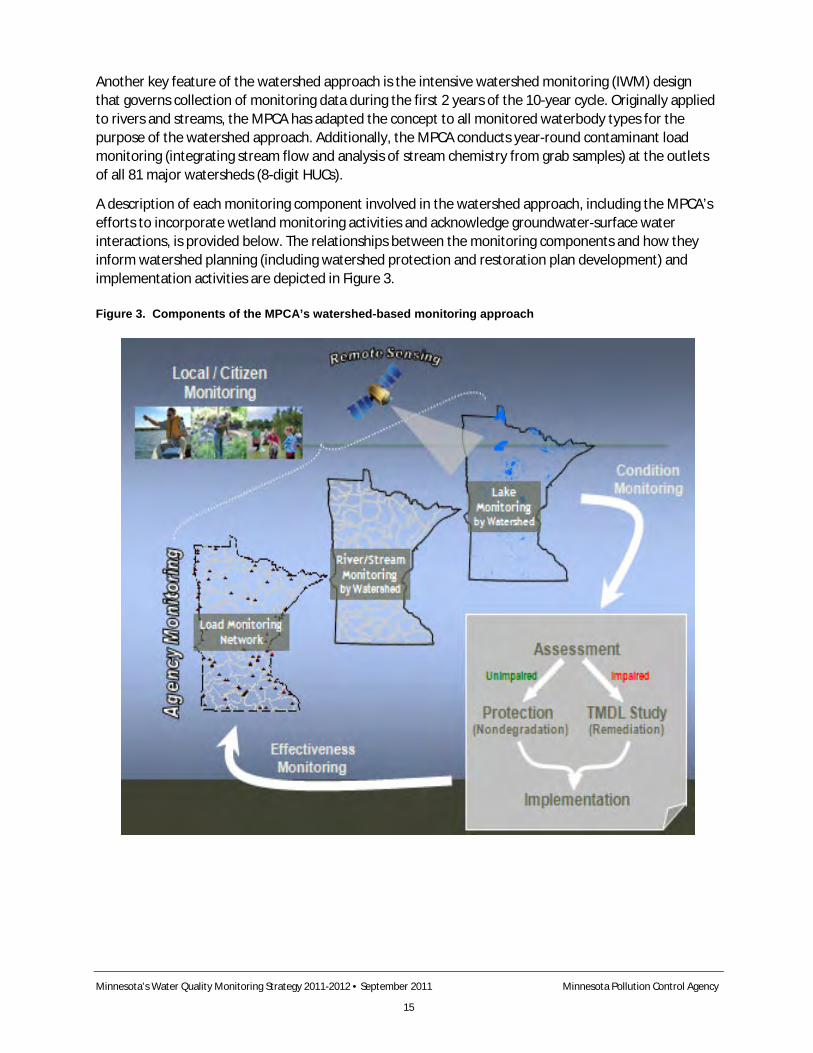
Another key feature of the watershed approach is the intensive watershed monitoring (IWM) design that governs collection of monitoring data during the first 2 years of the 10-year cycle. Originally applied to rivers and streams, the MPCA has adapted the concept to all monitored waterbody types for the purpose of the watershed approach. Additionally, the MPCA conducts year-round contaminant load monitoring (integrating stream flow and analysis of stream chemistry from grab samples) at the outlets of all 81 major watersheds (8-digit HUCs).
A description of each monitoring component involved in the watershed approach, including the MPCA’s efforts to incorporate wetland monitoring activities and acknowledge groundwater-surface water interactions, is provided below. The relationships between the monitoring components and how they inform watershed planning (including watershed protection and restoration plan development) and implementation activities are depicted in Figure 3.
Figure 3. Components of the MPCA’s watershed-based monitoring approach
Minnesota’s Water Quality Monitoring Strategy 2011-2012 • September 2011 Minnesota Pollution Control Agency
15

Monitoring rivers and streams in the major watersheds
The IWM design for rivers and streams within the major watersheds incorporates sampling locations selected from the subwatershed (approximately 11-digit HUC) and “minor” (14-digit HUC) watersheds contained within the major (8-digit HUC) watershed, as well as at the major, subwatershed and minor watershed outlets (Figure 4). Combining information from the intermediate and minor watersheds within the major watershed provides a robust assessment of water quality without monitoring every single stream reach. The IWM approach improves the quality of the information about water quality within a watershed, and also results in efficiency gains.
Figure 4. Intensive watershed monitoring stations in the Snake River Watershed
Minnesota’s Water Quality Monitoring Strategy 2011-2012 • September 2011 Minnesota Pollution Control Agency
16
!(Major Watersheds !( !(
!(
!(
!(
!(!(
!(
!(
!(
!(
!(
!(
!(
!(
!(
!(!(
!(
!(
!(!(
!(
!(!(!(
!(
!(
!(
!(
!(!(
!(
!(
!(!(
!(!(
!(!(
!(
!(
!(!(
!(
!(
!(
!(
!(!(
!(!(
!(!(
!(!(
!(
!(
!(
!(!(
!(
!(
Snake River Watershed(8-Digit HUC)
±
Legend!( Minor Watershed Sites
!( HUC-11 Watershed Sites
!( HUC-8 Major Watershed Site
0 84 Miles
Lakes
Streams
Minor Watersheds
11-Digit HUC Watersheds

Minnesota’s Water Quality Monitoring Strategy 2011-2012 • September 2011 Minnesota Pollution Control Agency
17
Biological monitoring is an important component of the MPCA’s monitoring approach. It is an effective tool for assessing water resource quality, regardless of whether the stressor impacting the stream reach is chemical, physical, or biological in nature. The biological community represented by biological samples (the number and variety of species present) provides an indication of overall stream health when compared to the index of biological integrity (IBI) appropriate for the particular stream. Biological monitoring is often able to detect water quality impairments that other monitoring methods may miss or underestimate. For more information about the MPCA’s biological monitoring program, visit www.pca.state.mn.us/index.php/water/water-monitoring-and-reporting/biological-monitoring/biological-monitoring-of-water-in-minnesota.html
Monitoring lakes in the major watersheds
Lake monitoring poses challenges that are different from rivers and streams. Minnesota has about 12,200 lakes greater than 10 acres in size. Of those, about 2,300 are between 100 and 500 acres, and about 700 are 500 acres or larger. Since it would be prohibitively expensive to monitor all of Minnesota’s lakes – just like it would be to sample every stream reach – the MPCA has developed a lakes sampling strategy.
The MPCA’s goal is to sample all lakes 500 acres or larger and at least 50 percent of lakes 100 to 500 acres in size over each 10-year IWM schedule. This translates to sampling about 100 lakes each year. The MPCA also monitors some smaller lakes, but typically only when these lakes can easily be worked into the monitoring schedule. The MPCA primarily relies on local partners funded through Surface Water Assessment Grants (SWAG) to sample lakes smaller than 100 acres in size, as well as additional lakes in the 100 to 500 acre size range.
The MPCA conducts two years of lake chemistry monitoring to obtain data sufficient for assessment. In addition, to obtain a snapshot of water quality in lakes that are not sampled and to supplement the chemical and physical monitoring that is conducted on sampled lakes, the MPCA uses satellite remote sensing information and other indicators of lake water quality that may be available for individual lakes. Remote sensing is used primarily to provide an indication of lake clarity; remote sensing “snapshots” collected over time can provide an indication of changing lake clarity, at relatively low cost.
The MPCA does not currently conduct biological monitoring in lakes. However, the MPCA is collaborating with the MDNR to develop lake IBIs for fish and aquatic plants. It is anticipated that development of lake IBIs will be completed in the next three to five years. For more information about monitoring of lakes, see: www.pca.state.mn.us/index.php/water/water-types-and-programs/surface-water/lakes/lakes-and-lake-monitoring-in-minnesota.html.
Monitoring wetlands in the major watersheds
At this time, the MPCA’s wetland monitoring activities are not integrated into the watershed approach in a systematic way. Wetlands pose a particular challenge for monitoring and assessment because of their vast number (a recent survey indicates there are 10.6 million acres of wetlands in Minnesota) and complexity (wetland hydrology, biology and function is extremely varied). Nevertheless, incorporation of wetlands into the watershed approach is proceeding.
The MPCA is developing a landscape wetland assessment technique using remote sensing data that will enable the MPCA to coarsely interpret plant community integrity at a landscape scale. Following preliminary investigation of the technique in 2007, the MPCA collected field data in 2009 and 2010 from a set of minor watersheds as part of a pilot project to develop an initial imagery classification system.

Minnesota’s Water Quality Monitoring Strategy 2011-2012 • September 2011 Minnesota Pollution Control Agency
18
When the classification system is completed, the technique will enable broad-scale wetland condition to be defined using remote sensing data to estimate wetland plant diversity and the extent of any invasive wetland plant species.
The MPCA is planning to evaluate the suitability of this technique to provide an overall estimate of wetland condition at the major watershed scale in 2013. A second important goal of the pilot will be to determine how wetland information and expertise can best be applied to support the assessment, protection and restoration of the state’s lakes and streams under the watershed approach. It is anticipated that wetlands will be formally incorporated into the watershed approach following completion of the pilot.
Note that the MPCA does not routinely monitor wetlands for the purpose of watershed assessment, except for wetlands that are connected to or affect an adjacent or nearby impaired water body. However, the MPCA is monitoring wetlands on a statewide basis, as described in Section 2.1.C.
Monitoring groundwater in the major watersheds
The MPCA does not conduct groundwater monitoring by major watershed, since groundwater does not flow according to watershed boundaries the way surface water does. Yet, groundwater is a major component of the hydrologic cycle and it affects, and is affected by, surface water with respect to both quality and quantity.
Because of its importance, information about groundwater quality and quantity within the major watersheds derived from readily available sources of information, including groundwater monitoring data collected by the MPCA, is included in each Watershed Assessment Report. (Watershed Assessment Reports are prepared for each major watershed after IWM condition monitoring and assessment activities are completed.)
MPCA groundwater quality monitoring activities are discussed in Section 3.
Major watershed load monitoring
Watershed load monitoring involves defining the amount of a parameter (e.g. phosphorus, nitrate, etc.) passing through a monitoring point in the watershed per unit time. Contaminant loads are calculated by integrating stream flow gaging data and stream chemistry data. Determination of loads at the watershed outlet makes it possible to compare watersheds to each other and in relation to the watershed characteristics. Watershed loads can also be used to assess trends in the water quality of a specific watershed over time and to see how data, from a given year, compare to the long term record for a watershed. This information is particularly helpful in putting the IWM data into a longer term context, given that intensive monitoring occurs in each watershed 2 of every 10 years. It is also critical for developing and monitoring the effectiveness of watershed restoration and protection plans at the broad watershed scale.
To collect the data needed to calculate watershed load, the MPCA relies on the Major Watershed Load Monitoring network (MWLMN) that involves permanent flow and chemistry monitoring stations at the outlets of the state’s 81 major (8-digit HUC) watersheds. The network is a partnership effort between the MPCA and the MDNR, along with the U.S. Geological Survey (USGS) and the Met Council. The MWLMN provides the cornerstone to the watershed approach in that it involves continuous flow and water quality data collection, which enables computation of annual load for each watershed, each year. The MWLMN operates year round and from year to year.

Minnesota’s Water Quality Monitoring Strategy 2011-2012 • September 2011 Minnesota Pollution Control Agency
19
In addition to the primary watershed load monitoring conducted at the major watershed outlets, the MPCA is working with the MDNR on selecting and operating temporary load monitoring stations at selected subwatershed (approximately 11-digit HUC level) outlets located within the major watersheds. Subwatershed load monitoring stations are important for watershed studies, by providing finer scale data to calibrate numerical watershed flow models, to inform “stressor ID” efforts, and to better define areas of concern. The MPCA anticipates that from three to eight subwatershed load monitoring stations may be sited within each major watershed for a period of 3 years, aligning with the IWM monitoring and rotation. After the 3 years, subwatershed load monitoring stations will be moved to other major watersheds that are just beginning IWM monitoring.
Note that though plans for subwatershed load monitoring have been committed to by MPCA and MDNR, they are contingent on requested appropriations for fiscal years 2012-13 and beyond, and should be considered preliminary at this time.
Local partner and volunteer citizen monitoring
Local partner and volunteer citizen monitoring are important components of the watershed approach. While the MPCA focuses its condition monitoring efforts on the major watersheds during years 1 and 2 of the 10-year schedule, local partner and volunteer citizens monitoring provides both additional data needed to complete assessments and data that are used to evaluate the status and trends of water bodies in the years between the 10-year cycles.
Local partners can obtain funding for monitoring through the MPCA’s SWAG program. The SWAG program is competitive; it is designed to provide funding to projects that will result in the collection of water quality data of the proper type, adequate frequency, and quality to determine the chemical, physical, and biological integrity of Minnesota lakes and streams, and to identify if designated uses are being met. The SWAG program is an important part of the MPCA’s overall strategy because it engages local partners in the condition monitoring process. Long term and early engagement by local stakeholders in monitoring and assessing water resources is an important element in the successful implementation of watershed restoration and protection strategies.
The MPCA coordinates two statewide volunteer citizen monitoring programs: the Citizen Lake Monitoring Program (CLMP) and the Citizen Stream Monitoring Program (CSMP). The CLMP was started in 1973 and is one of the nation’s largest and longest running volunteer lake monitoring programs. The CSMP began in 1998. Volunteers in both programs primarily monitor lake and stream clarity.
With the MPCA’s move to the watershed approach, the MPCA has streamlined the volunteer monitoring programs by preparing volunteer recruitment lists for lakes and streams for which condition data are desired to supplement agency assessment monitoring; the goal is to retain the recruited volunteers to continue monitoring in the years between MPCA monitoring visits. Also, in administering the SWAG program, the MPCA has revised the SWAG application materials to include priority and grant ranking criteria so that local stakeholder proposals for watersheds in which monitoring data are most needed receive higher scoring. The initiation of the subwatershed load monitoring network will further target SWAG resources to the watersheds.
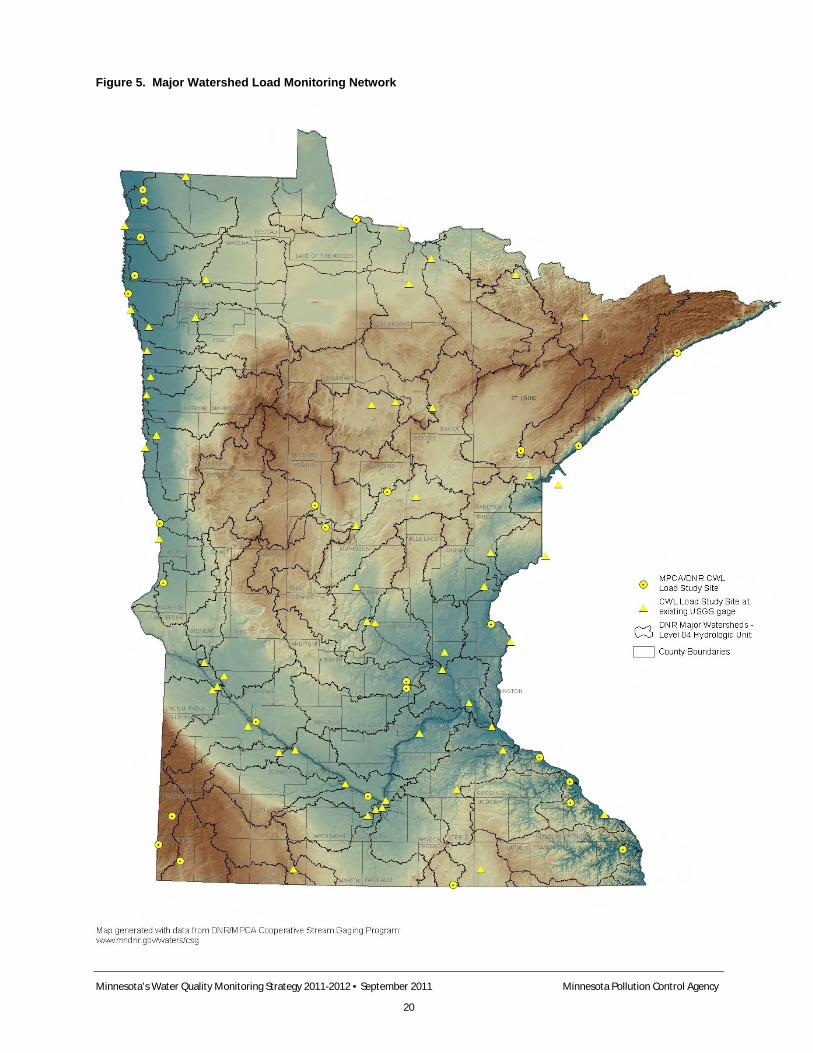
Figure 5. Major Watershed Load Monitoring Network
Minnesota’s Water Quality Monitoring Strategy 2011-2012 • September 2011 Minnesota Pollution Control Agency
20

Minnesota’s Water Quality Monitoring Strategy 2011-2012 • September 2011 Minnesota Pollution Control Agency
21
Although not part of the watershed approach, the MPCA also participates in a county-led wetland citizen monitoring program known as the Wetland Health Evaluation Program (WHEP) http://mnwhep.org/. WHEP has operated since 1996 in Dakota County and since 2000 in Hennepin County, both located in the Twin Cities Metropolitan (Metro) Area. Local cities within each county identify wetlands they would like to have monitored and help their respective county coordinator recruit citizen volunteers. Participating cities provide funding to the counties to operate the program. The MPCA primarily provides technical expertise and training for WHEP volunteers, to enable them to identify wetland plants and invertebrates at a level sufficient to use the simplified IBIs employed by the program. Cities have found the WHEP data useful in their wetland management programs to track the impacts of development and implementation of BMPs on wetland health.
More information about the MPCA’s citizen volunteer monitoring programs is available at www.pca.state.mn.us/cmp.
Condition monitoring and the watershed approach: looking to the future
Over time, the monitoring data collected via the 10-year rotating cycle from the major watersheds and annually from the watershed outlets, can be used to identify trends in water quality. Trend data help determine whether water quality conditions are improving or worsening, and also provides information to assess the effectiveness of management actions in improving the quality of the state’s waters overall.
2.1.b Targeted monitoring activities In addition to the major watershed monitoring described above, the MPCA carries out several other monitoring projects that provide additional information about the condition of the state’s water resources. These other monitoring activities are set up for very specific purposes; however, they also contribute data that are captured in the assessment process.
The former Minnesota Milestone Program
The Minnesota Milestone Program began in 1953 with the goal of developing long-term water quality data from a set of designated stream sites located across the state. When the MPCA was created in 1967, it was given responsibility for the Milestone Program. The Milestone Program has been in continuous operation since this time.
The Milestone Program data have been important in developing an understanding of the overall health and long-term water quality trends of Minnesota’s rivers based on concentration data. However, at the end of the 2010 field monitoring season, the Milestone Program was discontinued. Establishment of the major watershed load stations has provided a well distributed set of monitoring sites from which pollutant load data will be collected on an on-going basis; these stations will now be used to provide information about long-term water quality trends in Minnesota. More information about the Milestone Program and the trends that have been identified using these long term data are available at www.pca.state.mn.us/index.php/water/water-types-and-programs/surface-water/streams-and-rivers/minnesota-milestone-river-monitoring-program.html?menuid=&missing=0&redirect=1.
Sentinel Lakes Monitoring Program
The Sentinel Lakes Program is part of a long-term, collaborative monitoring effort that is being led by the MDNR. The overall program, referred to as, “SLICE – Sustaining Lakes in a Changing Environment,” is designed to provide data that will help with understanding and predicting the consequences of land use

Minnesota’s Water Quality Monitoring Strategy 2011-2012 • September 2011 Minnesota Pollution Control Agency
22
and climate change on lake habitats. The MPCA’s role in this effort primarily involves collecting and assessing water quality monitoring data from the 24 lakes located across the state that are monitored under this program. MDNR with its partner agencies is planning to expand the program beyond lakes to a Sentinel Watershed program, at the subwatershed scale; this plan is contingent upon funding. For more information about Sentinel Lakes and SLICE, visit: www.MDNR.state.mn.us/fisheries/slice/sentinel.html.
Ambient trace metal stream sampling
The MPCA conducted ambient trace metal sampling in Minnesota’s nine major river basins beginning in 1995 and ending in April 2009. Approximately 10 sites were selected in each major river basin and sampled four to five times during a 3-year period for trace level concentrations of metals (in the Lower Mississippi Basin, four samples were collected from each site during a 1-year period). The purpose of the program was to evaluate the presence and extent of trace concentrations of metals at sites within and between river basins, and to assess the need for water quality standards or other policy changes to address the findings.
Based upon the results of this survey, no further monitoring of metals at trace level concentrations was deemed necessary.
Large River Monitoring Program
Large rivers (i.e. the rivers flowing in Minnesota’s major river basins such as the Mississippi River and the Red River) are not explicitly addressed in the watershed approach. The MPCA Basin River Sampling Strategy Development team is working to develop a monitoring strategy with a 10-year schedule that provides sufficient data to assess the aquatic life, aquatic recreation and aquatic consumption uses of large rivers. The strategy is being developed to dovetail with the watershed approach such that little to no additional staffing will be needed for implementation. The strategy is being developed as resources allow. For the Mississippi River, the strategy will be coordinated with interstate efforts such as monitoring discussions of the Upper Mississippi River Basin Association’s Water Quality Task Force and Water Quality Executive Committee.
Minnesota Comprehensive Wetland Assessment, Monitoring, and Mapping Strategy
Potential impacts to wetlands in Minnesota are regulated by federal and state statutes, by several state agencies (MPCA, MDNR and BWSR) as well as local units of government. Although roles and responsibilities vary depending upon the specifics of each action, generally speaking, the MPCA is responsible for assessment of wetland quality, and the MDNR is responsible for assessing wetland quantity.
Wetlands pose a particular challenge for monitoring and assessment because of their vast number and areal extent. To address this challenge, in 2006 an interagency workgroup including state and federal agency partners convened to develop a comprehensive strategy for assessing wetlands in Minnesota. This strategy is known as the Comprehensive Wetland Assessment, Monitoring, and Mapping Strategy (CWAMMS), and it provided the framework that enabled the MPCA and MDNR to conduct the first statewide survey of wetland quality and quantity between 2006 and 2009, using the 3-year rotating ecoregion design that was developed as part of CWAMMS. The following paragraphs provide more detail about CWAMMS and associated development work that is improving the MPCA’s ability to characterize and assess the quality of Minnesota’s wetlands.

The CWAMMS recommended three actions to enable Minnesota to adequately assess status and trends in wetland quantity (area) and quality (condition). These included: 1) initiating a Minnesota probabilistic (random) survey of wetland quantity and quality; 2) updating Minnesota’s coverage in the National Wetland Inventory (NWI); and 3) developing an integrated online wetland regulatory and conservation accounting system to track ongoing changes in wetland area in Minnesota.
The first recommendation was implemented with the first statewide probabilistic survey of wetland quality and quantity, which was completed in 2009. The MPCA used the ecoregion-based plant and invertebrate IBIs it developed over several years to perform the survey of wetland quality. This survey focused exclusively on depressional or marsh-type wetlands. Funding for the initial survey work came from an EPA Wetland Development Grant Pilot and State Heritage Enhancement funds. More information is available here: http://www.pca.state.mn.us/index.php/water/water-monitoring-and-reporting/biological-monitoring/wetland-monitoring/wetland-monitoring-plants.html.
On the second recommended action, the MDNR is leading the effort to update Minnesota’s NWI coverage, a project that will be implemented over multiple years: http://www.MDNR.state.mn.us/eco/wetlands/nwi_proj.html. This effort requires acquisition of recent high resolution spring leaf-off color-infrared imagery. The new spring imagery is being acquired by region with interpretation and map production following, also by region (Figure 6). The initial interpretation and mapping update includes the 13-county Twin Cities Metro Area. It is expected that the statewide NWI coverage update will be completed by 2019, dependent on funding.
Figure 6. Proposed National Wetland Inventory Mapping Phases (Source: MDNR)
The third recommended action, development of an online accounting system to track changes in wetland extent from conservation program and permitting data, is proceeding as funding can be obtained. To date, a scoping and design project to develop a project schema has been completed, but funding to develop and program the actual system has not been forthcoming. One potential avenue under consideration is developing a parallel application based upon the U.S. Army Corps of Engineers Regional Internet Bank Information Tracking System.
The CWAMMS protocol developed for the statewide survey of wetland quality is evolving because of the opportunity presented by the National Wetland Condition Assessment, which will be conducted for the first time in 2011 as part of EPA’s National Aquatic Resource Survey program. This is discussed in more detail in the next section. For more information about CWAMMS, see: www.pca.state.mn.us/index.php/water/water-types-and-programs/surface-water/wetlands/minnesota-comprehensive-wetland-assessment-monitoring-and-mapping.html.
Minnesota’s Water Quality Monitoring Strategy 2011-2012 • September 2011 Minnesota Pollution Control Agency
23
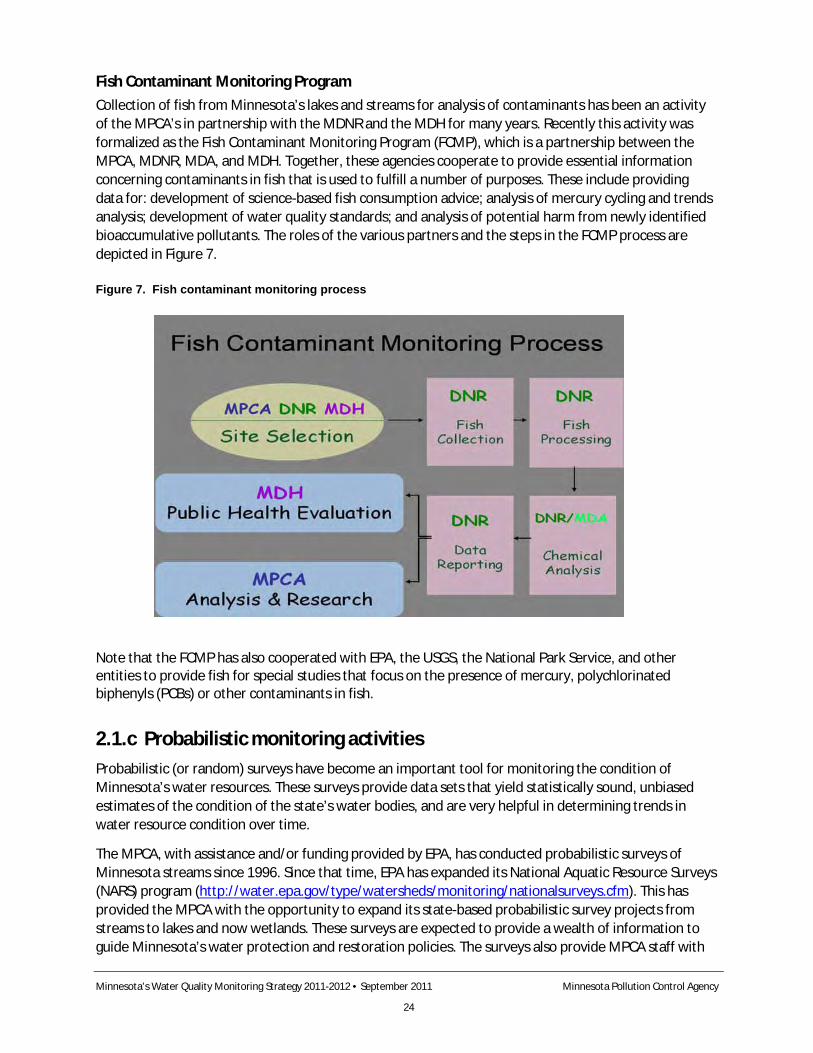
Fish Contaminant Monitoring Program
Collection of fish from Minnesota’s lakes and streams for analysis of contaminants has been an activity of the MPCA’s in partnership with the MDNR and the MDH for many years. Recently this activity was formalized as the Fish Contaminant Monitoring Program (FCMP), which is a partnership between the MPCA, MDNR, MDA, and MDH. Together, these agencies cooperate to provide essential information concerning contaminants in fish that is used to fulfill a number of purposes. These include providing data for: development of science-based fish consumption advice; analysis of mercury cycling and trends analysis; development of water quality standards; and analysis of potential harm from newly identified bioaccumulative pollutants. The roles of the various partners and the steps in the FCMP process are depicted in Figure 7.
Figure 7. Fish contaminant monitoring process
Note that the FCMP has also cooperated with EPA, the USGS, the National Park Service, and other entities to provide fish for special studies that focus on the presence of mercury, polychlorinated biphenyls (PCBs) or other contaminants in fish.
2.1.c Probabilistic monitoring activities Probabilistic (or random) surveys have become an important tool for monitoring the condition of Minnesota’s water resources. These surveys provide data sets that yield statistically sound, unbiased estimates of the condition of the state’s water bodies, and are very helpful in determining trends in water resource condition over time.
The MPCA, with assistance and/or funding provided by EPA, has conducted probabilistic surveys of Minnesota streams since 1996. Since that time, EPA has expanded its National Aquatic Resource Surveys (NARS) program (http://water.epa.gov/type/watersheds/monitoring/nationalsurveys.cfm). This has provided the MPCA with the opportunity to expand its state-based probabilistic survey projects from streams to lakes and now wetlands. These surveys are expected to provide a wealth of information to guide Minnesota’s water protection and restoration policies. The surveys also provide MPCA staff with
Minnesota’s Water Quality Monitoring Strategy 2011-2012 • September 2011 Minnesota Pollution Control Agency
24

Minnesota’s Water Quality Monitoring Strategy 2011-2012 • September 2011 Minnesota Pollution Control Agency
25
the opportunity to gain new expertise by working collaboratively with EPA and other state scientists; and a relatively inexpensive means to determine if new or emerging chemicals or biological indicators are sufficiently widespread to be included in the MPCA’s ongoing monitoring programs.
The following paragraphs describe the EPA NARS (i.e. national) surveys that have been conducted in Minnesota, and the random surveys that are scaled to Minnesota and are conducted either independently or in conjunction with the EPA NARS surveys.
National Aquatic Resource Surveys
The EPA’s NARS includes the National Rivers and Streams Assessment (NRSA), the National Lakes Assessment (NLA), the National Wetland Condition Assessment (NWCA) and the National Coastal Assessment (NCA). The EPA plans to conduct these surveys on a national basis every five years. Brief background on each of these national surveys is provided below.
• National Rivers and Streams Assessment
The EPA’s NRSA was first conducted in Minnesota in 2004, at which time it included two separate surveys: the wadeable and non-wadeable stream surveys. In 2009, EPA revised the NRSA so that the wadeable and non-wadeable streams surveys are combined into one survey referred to as the flowing waters survey, which is conducted over two years.
EPA contractors conducted the flowing waters survey in Minnesota in 2009, and sampled 48 sites. A final report summarizing the results of the 2009 national survey is scheduled to be released in 2011. More information about the EPA’s NRSA is available at the MPCA’s website: www.pca.state.mn.us/index.php/water/water-monitoring-and-reporting/water-quality-and-pollutants/water-quality-condition-monitoring/random-survey-of-the-nation-s-rivers-and-streams.html
The MPCA is now conducting its own Minnesota Random Rivers and Streams Assessment in conjunction with the EPA NRSA. This is described in more detail later in this section.
National Lakes Assessment
• The EPA’s NLA survey was first conducted in Minnesota in 2007. A total of 41 Minnesota lakes were randomly selected by EPA to provide a statistically sound data set for the national survey. An up-to-date listing and overall study design is available on the EPA NLA webpage: http://water.epa.gov/type/lakes/lakessurvey_index.cfm.
The MPCA and MDNR wanted to take advantage of the opportunity presented by the NLA to conduct a state-based probabilistic assessment of lake quality; therefore the MPCA and MDNR, together with other state and federal agencies, including the MDA, the U.S. Forest Service and the USGS, randomly selected 9 additional lakes for sampling to bring the total to 50 lakes, which makes the resulting data set valid on the scale of Minnesota. In addition to the added lakes, several other enhancements to the survey were undertaken with the assistance of many collaborators.
More information about the NLA survey and the Minnesota results is available at: www.pca.state.mn.us/index.php/water/water-types-and-programs/surface-water/lakes/lake-water-quality/national-lakes-assessment-project-nlap.html?menuid=&missing=0&redirect=1.
The MPCA plans to participate again in the NLA Survey that is scheduled for 2012.
• National Wetland Condition Assessment
The EPA’s first NWCA is occurring in 2011. The MPCA participated in planning for the NWCA and also assisted with protocol review and development.
Sampling for the EPA NWCA survey in Minnesota includes 22 sites. More information about the NWCA survey is available at: http://water.epa.gov/type/wetlands/assessment/survey/index.cfm.
The MPCA is now conducting its own Minnesota Random Wetland Survey in conjunction with the EPA NWCA. This is described in more detail later in this section.
• National Coastal Survey – Minnesota’s Lake Superior shoreline
Sampling for the EPA’s National Coastal Survey took place most recently in 2010, and for the first time, the survey included the Great Lakes. The MPCA was asked to participate in planning for and conducting the survey along Minnesota’s border with Lake Superior. However, the MPCA has limited experience monitoring Lake Superior and lacks the necessary equipment to safely conduct the sampling; therefore, the MPCA contracted the sampling work to EPA subcontractors. A total of nine sites were randomly selected in Minnesota’s near-shore waters of Lake Superior; the sites were successfully sampled by EPA subcontractors in September 2010.
The MPCA also cooperates in a number of monitoring projects with other Great Lakes states and Canada through its participation on the Lake Superior Binational Program and other Great Lakes wide organizations.
Minnesota Random Rivers and Streams Survey
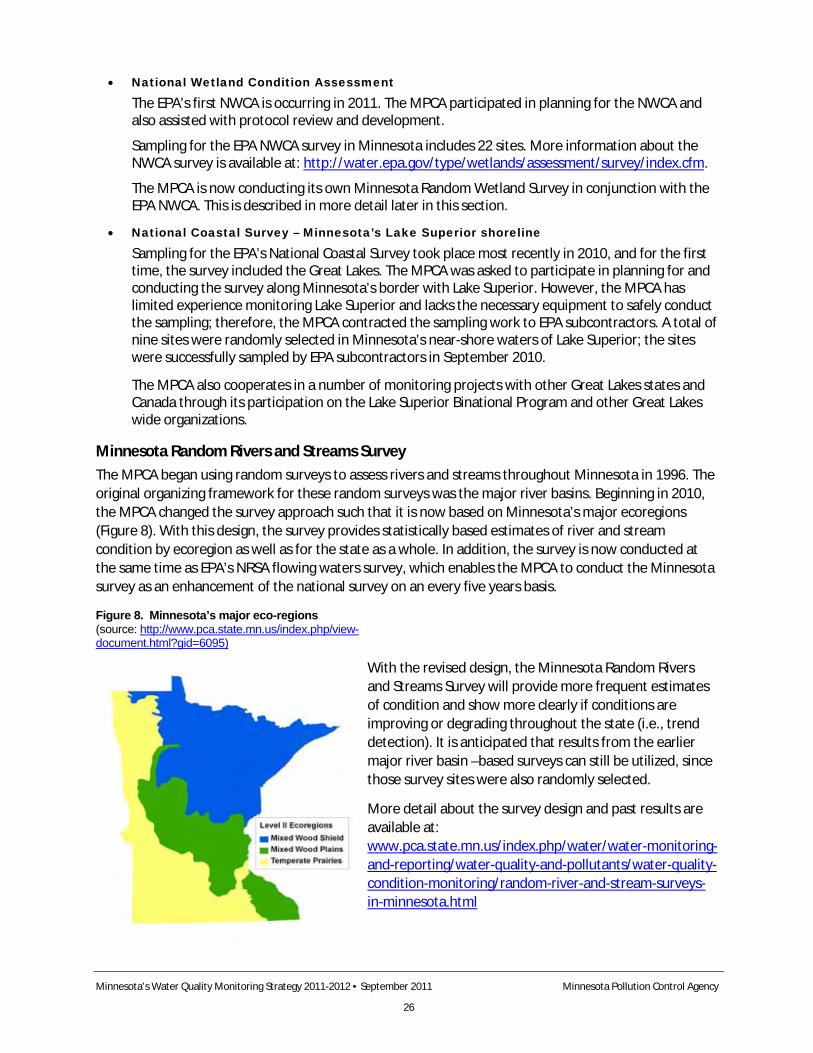
The MPCA began using random surveys to assess rivers and streams throughout Minnesota in 1996. The original organizing framework for these random surveys was the major river basins. Beginning in 2010, the MPCA changed the survey approach such that it is now based on Minnesota’s major ecoregions (Figure 8). With this design, the survey provides statistically based estimates of river and stream condition by ecoregion as well as for the state as a whole. In addition, the survey is now conducted at the same time as EPA’s NRSA flowing waters survey, which enables the MPCA to conduct the Minnesota survey as an enhancement of the national survey on an every five years basis.
Figure 8. Minnesota’s major eco-regions (source: http://www.pca.state.mn.us/index.php/view- document.html?gid=6095)
With the revised design, the Minnesota Random Rivers and Streams Survey will provide more frequent estimates of condition and show more clearly if conditions are improving or degrading throughout the state (i.e., trend detection). It is anticipated that results from the earlier major river basin –based surveys can still be utilized, since those survey sites were also randomly selected.
More detail about the survey design and past results are available at: www.pca.state.mn.us/index.php/water/water-monitoring-and-reporting/water-quality-and-pollutants/water-quality-condition-monitoring/random-river-and-stream-surveys-in-minnesota.html
Minnesota’s Water Quality Monitoring Strategy 2011-2012 • September 2011 Minnesota Pollution Control Agency
26

Minnesota’s Water Quality Monitoring Strategy 2011-2012 • September 2011 Minnesota Pollution Control Agency
27
Minnesota Random Wetland Survey
The first statewide survey of depressional (i.e. marsh) wetland condition was conducted by the MPCA from 2006 to 2009 using the CWAMMS protocol, as described previously. While the MPCA was conducting this survey, it was also involved in planning and protocol development for EPA’s first NWCA in 2011. As a result of this interaction and opportunity, the MPCA revised its approach for the Statewide Wetland Condition Survey to better integrate with the NWCA. The revised approach incorporates all wetland types (i.e. not just depressional) and employs an assessment tool called Floristic Quality Assessment (FQA); the survey using this revised approach is now referred to as the Minnesota Random Wetland Survey.
FQA is a vegetation-based ecological condition assessment tool that is being used increasingly by wetland scientists to evaluate wetland quality, including wetland types without open water such as meadows and bogs. FQA is based upon the Coefficient of Conservatism (C), which is a numerical rating assigned to individual plant species that expresses the species’ fidelity to natural habitats and tolerance to disturbance (due to natural and anthropogenic causes). Metrics derived from the C-values for plant species occurring at a given site, such as the Mean C and/or Floristic Quality Index (FQI), are then used to assess site condition. The MPCA completed a project to assign C-values to Minnesota’s wetland flora in 2007 (http://www.pca.state.mn.us/index.php/water/water-types-and-programs/surface-water/wetlands/floristic-quality-assessment-for-minnesota-wetlands.html).
Since 2007, the MPCA has continued development of FQA with funding provided by an EPA Wetland Program Development grant. The additional work has included developing: 1) a standardized rapid sampling protocol that involves a timed meander approach and a simplified plant species list; and 2) data driven assessment criteria. These enhancements allow wetland professionals with moderate botanical expertise to make good quality wetland condition assessments with a reasonable level of effort for all wetland types.
The Minnesota Random Wetland Survey will be conducted in 2011 and 2012 in conjunction with EPA’s NWCA, and will provide ecoregion based as well as statewide estimates of wetland condition.
Minnesota Depressional Wetland Survey
The survey of Minnesota’s depressional wetlands conducted using the IBI-based protocol developed for CWAMMS will continue as the Minnesota Depressional Wetland Survey. Depressional wetlands include shallow and deep marshes that are permanent landscape features and provide important, on-going ecologic and hydrologic functions. It is anticipated that the next Minnesota Depressional Wetland Survey will be conducted in 2012 and 2013. Note that both the Minnesota Random Wetland Survey and the Minnesota Depressional Wetland Survey are made possible by funding received from EPA’s NWCA program; the MPCA does not have dedicated state funding to conduct wetland condition surveys. In addition, the probabilistic surveys of wetland quality are developed from the MDNR’s survey of wetland quantity. The MDNR’s statewide probabilistic survey of wetland quantity is now called the Minnesota’s Wetland Status and Trends Monitoring Program (WSTMP); more information about WSTMP is available here: http://www.MDNR.state.mn.us/eco/wetlands/wstm_prog.html.
2.1.d Special studies monitoring The MPCA plans to stay abreast of newly recognized environmental contaminants and other issues that have the potential to cause known or suspected adverse ecological or human health effects but are not well understood, to help inform lawmakers, regulators, the public, and industry. The Legislature

Minnesota’s Water Quality Monitoring Strategy 2011-2012 • September 2011 Minnesota Pollution Control Agency
28
approved funding for some of these efforts in recent biennial budgets. Partnering with other scientists at universities, state agencies, and federal agencies, the MPCA is conducting the following specific investigations.
Pharmaceuticals, household and industrial-use products
The MPCA has been collaborating with researchers from the local and national USGS offices since 2000 and St. Cloud State University (SCSU) since 2004 to monitor the presence of pharmaceuticals, personal care products, and other wastewater associated chemicals in Minnesota's waters. Several of these studies included an analysis of how fish are affected by these chemicals.
The first state reconnaissance study by the USGS, the MPCA and the MDH showed that industrial and household-use compounds and pharmaceuticals are present in streams, groundwater, wastewater and landfill effluents. Steroids, nonprescription drugs, and insect repellents were the chemical groups most frequently detected, with detergent degradates and plasticizers measured in the highest concentrations. The complete report may be found at: http://water.usgs.gov/pubs/sir/2004/5138/.
In 2010, the MPCA sampled 150 stream locations for 24 chemicals that included pharmaceuticals and personal care products. This sampling was done in collaboration with the Minnesota Random Rivers and Streams Survey. Analysis of these samples was performed by the MDH laboratory in spring of 2011.
Also in 2010, the MPCA contracted with the USGS using funds made available by EPA through the NARS National Coastal Survey to conduct monitoring of chemicals of concern in the Duluth/Superior Harbor, which is part of the St. Louis River Area of Concern (AOC). The St. Louis River is the largest U.S. tributary to Lake Superior, and the AOC portion is adjacent to the largest urban area on Lake Superior. The Duluth/Superior Harbor is heavily impacted by historical industrial pollution, but little is known about the persistence and fate of chemicals of emerging concern (pharmaceuticals, antibiotics, hormones, organic wastewater compounds, and perfluorinated compounds) in this complex hydrological setting.
Using a combination of a stratified sampling design and a sampling protocol that follows hydrologic gradients, the USGS collected surface water and sediment samples from 30 locations in Minnesota’s portion of the AOC in August 2010. Twenty five sites were chosen at random, and five sites were pre-selected as suspected sources of contamination. The USGS contributed an additional $41,000 to the project budget, and worked with the Wisconsin MDNR to sample three additional sites in Wisconsin’s portion of the Duluth/Superior Harbor, thereby improving the scope of the project. The USGS is scheduled to provide a draft report to the MPCA by December 31, 2011.
Endocrine disrupting compounds
Building on the results of the 2002 USGS survey of pharmaceuticals, household, and industrial products in the aquatic environment described above, scientists from the USGS, SCSU, the University of Minnesota, the University of St. Thomas, and the MPCA are continuing to investigate the significance, sources, and occurrence of compounds with endocrine-disrupting activity in Minnesota’s waste streams and waters.
Endocrine disruption is a broad term referring to both natural and synthetic compounds that cause adverse effects in humans, fish, or wildlife by mimicking or altering the endocrine systems of organisms. Originally, studies of endocrine disrupting chemicals (EDCs) focused on those chemicals affecting the estrogenic, androgenic (testosterone), or thyroid systems of humans and wildlife. However, the scope of interest has expanded to include other signaling chemicals in humans and wildlife, such as neurochemicals.

Minnesota’s Water Quality Monitoring Strategy 2011-2012 • September 2011 Minnesota Pollution Control Agency
29
In January 2008, the MPCA completed a report to the Minnesota Legislature titled Endocrine Disrupting Compounds. This report summarizes what is understood about the range of EDCs and their effects on humans, fish, and wildlife, as well as reviewing possibilities for preventing the release of EDCs to the environment and the options for treatment at wastewater treatment plants. The report is available at: www.pca.state.mn.us/index.php/about-mpca/legislative-issues/legislative-reports/legislative-reports.html?menuid=&missing=0&redirect=1.
Subsequently, with special funding from the Minnesota Legislature, the MPCA, in cooperation with USGS and SCSU, designed and conducted the statewide EDC study which included the analysis of surface water and sediment in 12 Minnesota lakes and 4 rivers and streams. This study also included an analysis of effects in fish collected from the same locations. The study was completed in June 2009 and can be found at www.pca.state.mn.us/index.php/water/water-monitoring-and-reporting/water-quality-and-pollutants/endocrine-disrupting-compounds.html.
The MPCA collaborated with the USGS, SCSU, and the University of St. Thomas on a survey of wastewater treatment plants across Minnesota. This study, which focused on 25 wastewater treatment plants of different capacity and treatment type, included the chemical analysis of surface water and sediment as well as study of fish at locations where surface water and sediment samples were collected. The final report can be found at http://www.pca.state.mn.us/index.php/view-document.html?gid=15610. Finally, the MPCA is involved in a continuation of the 2007-2009 statewide EDC study, examining in more detail the presence and effects of EDCs on a single Minnesota lake from a variety of point and nonpoint sources. Results of this study will be reported in 2011.
Note that the MPCA collected ambient groundwater for analysis of EDCs as part of its ambient monitoring network for the first time in 2010. This is discussed at more length in Section 3.
These studies all pursue investigation of EDCs in the context of environmental protection using a multidisciplinary and collaborative approach, and build on national studies and perspectives. Beginning with the 2012 field season, MPCA plans to continue EDC monitoring in conjunction with the national and statewide probabilistic surveys to build trend information over time.
Perfluorinated chemicals
Perfluorinated chemicals (PFCs) such as perfluorooctanesulfonic acid (PFOS), perfluorooctanoic acid, (PFOA), perfluorobutanoic acid (PFBA) and others, are manmade chemicals used to manufacture products that are heat and stain resistant and repel water. PFCs used in emulsifier and surfactant applications are found in fabric, carpet and paper coatings, floor polish, shampoos, and fire-fighting foam. PFCs are used to make fluoropolymers, which then are used in the production of many personal care products, textiles, non-stick surfaces and fire-fighting foam. PFCs are widespread and persistent in the environment and they have been found in animals and people all over the globe.
In Minnesota, 3M manufactured PFOS and PFOA from approximately 1950 until they were phased out in 2002. During that time, PFCs were released into the Mississippi River in effluent from the 3M Cottage Grove wastewater treatment plant. In addition, four sites in Washington County were identified where 3M disposed of PFC wastes prior to the advent of modern solid and hazardous waste laws and regulations aimed at protecting groundwater.

Minnesota’s Water Quality Monitoring Strategy 2011-2012 • September 2011 Minnesota Pollution Control Agency
30
In 2007, the MPCA and 3M entered into a Consent Order regarding the release and discharge of PFCs from certain sites. The consent decree sets forth specific remediation steps that 3M is required to take regarding PFC releases. A copy of the consent decree is available at: http://www.pca.state.mn.us/index.php/view-document.html?gid=2860
The Consent Order also provided 3M funds for the MPCA to investigate the broader presence of PFCs in the ambient environment and numerous studies are underway to do that. MPCA investigations have detected PFOS at elevated concentrations in fish taken from the Mississippi River near the 3M Cottage Grove plant and downstream, as well as in metro area lakes with no known connection to 3M’s manufacturing or waste disposal. Mississippi River Pool 2, which received 3M Cottage Grove effluent during the years of PFOS and PFOA manufacturing, is listed as impaired water, due to PFOS. This is based on fish tissue PFOS concentrations that prompted the MDH to issue a one-meal per month consumption advisory for certain species in that pool. Preliminary work in advance of a PFOS TMDL for Pool 2 also is underway, and TMDLs likely will be prepared for several PFOS-impaired lakes.
In addition to fish tissue, PFCs have been found in some shallow groundwater wells, in stormwater and in stormwater ponds, in the influent, effluent and sludge of wastewater treatment plants, in landfill leachate and gas, in sediments, in agricultural soils, in ambient air, in blood of swallows and bald eagles, and in insects. Several findings of elevated PFOS concentrations have been traced to chrome platers using PFOS-containing products in plating or for chrome mist suppression. The MPCA has worked with the local plating trade association to reduce or eliminate PFCs from these operations. The MPCA and the MDH continue to examine potential sources of exposure to PFCs. An extensive description of all MPCA and MDH activities, and links to many PFC-related reports and studies is available on the following webpages: www.pca.state.mn.us/cleanup/pfc/index.html and www.health.state.mn.us/divs/eh/hazardous/topics/pfcshealth.html.
Section 2.2: Problem Investigation Monitoring Strategy Problem investigation monitoring is used to investigate a specific problem or protection concern in order to develop management approaches for improving or protecting the resource. Problem investigation monitoring is also used to identify the specific causes of a problem and to quantify inputs or loads from various sources – both point and nonpoint. The MPCA’s Strategic Plan Problem Investigation Monitoring Goals and Objectives are found in Goals W.1. and W.3., and reflect the need for both protection and restoration.
Within the watershed approach, problem investigation monitoring is a key step that occurs after condition monitoring and assessment are completed to identify the stressors that are causing the impairments (i.e. stressor ID monitoring). The subwatershed load monitoring that is conducted as part of the watershed approach is also a form of problem investigation monitoring, in that it provides critical information that is used both to diagnose stressors and prepare TMDL calculations used in developing watershed restoration and protection strategies. Finally, the MPCA and partners conduct problem investigation monitoring to evaluate regulatory concerns (e.g. NPDES) or localized water quality concerns (e.g. lake eutrophication). More information is provided below.

Minnesota’s Water Quality Monitoring Strategy 2011-2012 • September 2011 Minnesota Pollution Control Agency
31
Stressor identification monitoring Stressor ID is a formal and rigorous process that identifies stressors causing biological impairment of aquatic ecosystems, and provides a structure for organizing the scientific evidence supporting the conclusions (EPA, 2000). In simpler terms, it is the process of identifying the major factors causing harm to fish and other river and stream life. Stressor ID is a key component of the major watershed restoration and protection projects being carried out under Minnesota’s Clean Water Legacy Act.
Stressor ID monitoring may include additional biological sampling, water quality monitoring, or collection of a variety of other data (e.g. stream physical or geomorphology surveys, aerial photography, etc.). With the MPCA’s transition to the watershed approach, stressor ID takes place at the major watershed scale (or subwatershed scale in the Metro Area).
Stressor ID monitoring is conducted in year 3 and sometimes year 4 of the watershed cycle, after completion of the intensive watershed monitoring (condition monitoring) that takes place in years 1 and 2.
Stressor ID is explained further in the MPCA’s TMDL protocol document for biologically impaired waters www.pca.state.mn.us/publications/wq-iw1-23.pdf, as well as in the EPA stressor ID document: http://water.epa.gov/scitech/swguidance/standards/criteria/aqlife/biocriteria/stressorfacts.cfm
Watershed load monitoring Watershed load monitoring (described in more detail in Section 2.1.A above) occurs at the outlets of Minnesota’s 81 major watersheds on a monthly basis, year round. The load monitoring conducted at the major watershed scale is typically supplemented by two or more additional load monitoring stations that are deployed at the subwatershed scale. These additional load monitoring stations are deployed at locations where data are needed to provide information about unique features or areas within the major watershed, and to support development of watershed restoration and protection plans. The additional load monitoring stations are temporary, and are intended to operate for a period of three years, after which they are moved to other major watersheds.
Load monitoring provides important information about potential stressors within a watershed. It also provides critical information for preparing numerical watershed flow models and allocating pollutant load reductions within the watershed.
Other problem investigation monitoring Minnesota’s strategy relies on a variety of partners to conduct problem investigation monitoring. This includes the following:
• monitoring conducted by regulated parties in support of regulatory programs (e.g. NPDES)
• monitoring conducted by MPCA contractors for TMDL studies
• monitoring conducted by local partners to investigate local problems or protection concerns (e.g. through Clean Water Partnership grants, for county water planning, by local lake associations, etc.)
• monitoring conducted by the MPCA to fill gaps for special projects (e.g. wasteload determinations, fish kills, etc)
• monitoring conducted by other organizations to fill additional needs (e.g. USGS, Metropolitan Council Environmental Services)

Minnesota’s Water Quality Monitoring Strategy 2011-2012 • September 2011 Minnesota Pollution Control Agency
32
Section 2.3: Effectiveness Monitoring Strategy Effectiveness monitoring is used to determine the effectiveness of specific regulatory or voluntary management actions taken to improve and restore an impaired water body or bodies. Effectiveness monitoring allows for the evaluation and refinement of the implemented management approach to ensure it is ultimately successful. Effectiveness monitoring can occur at a variety of scales, from small project–based scales to the system (resource) scale.
Minnesota’s effectiveness monitoring strategy relies on monitoring activities that are conducted by a variety of parties. This includes regulated parties, local implementers, MPCA contractors, the MPCA, and other organizations who conduct effectiveness monitoring to evaluate specific management practices or groups of practices in a specific area. Since the MPCA’s adoption of the watershed approach, most effectiveness monitoring activities are ultimately targeted at evaluating the steps taken to improve water quality and provide long term protection of water resources within the major watersheds.
All types of effectiveness monitoring share the need to compare the collected monitoring data to other data: either previously collected monitoring data, a water quality standard, paired resources (e.g. a paired watershed study), reference sites, or differing scales. Table 2 provides examples of various types of effectiveness monitoring that are conducted in Minnesota.
Table 2. Types, scales and purposes of effectiveness monitoring in Minnesota
Scale Description Answers the questions: Focus Examples
Plot Scale Effectiveness
Research-level monitoring directed at individual practices in controlled setting.
Does the BMP work? What’s the effect of implementing the BMP?
Focus is on inputs and outputs for a single practice. Uses statistical methods, replicates and controls.
U of M, USDA Ag Research Service efforts. Usually not MPCA.
Field Scale Effectiveness
Monitoring directed at single or sets of practices in a “real world” setting. Compliance monitoring could be considered a subset of this.
Do the BMPs work in an uncontrolled setting? Do the practices result in facility compliance?
Focus is on physical and chemical changes related to single or sets of practices; must monitor land use/land use changes, wet/dry cycles for background knowledge.
Compliance monitoring, BMP effectiveness monitoring
Project/ Program Scale Effectiveness
Monitoring directed at sets of practices or activities implemented over a larger area with multiple landowners and operators. Effectiveness is evaluated using ranges of values, rather than one specific or pass/fail value.
How much $$ was spent? How many regulations enforced, BMPs adopted? Are behaviors changing (social changes)? Are the cleanup plans working? Is water quality getting better?
Focus is on environ-mental (physical, chemical, biological), program and social indicators; measures aggregate effects and outcomes; must monitor land use/land use changes, wet/dry cycles for background knowledge.
Clean Water Partnership projects, pre-watershed approach TMDL implementation plans, CWA Section 319 project monitoring.

Minnesota’s Water Quality Monitoring Strategy 2011-2012 • September 2011 Minnesota Pollution Control Agency
33
Scale Description Answers the questions: Focus Examples
System (resource) Scale Effectiveness
Monitoring directed at environmental conditions within major watersheds, major eco-regions, or statewide.
Are water quality goals and standards being met? Is the water quality getting better or worse (trends)?
Focus is on environmental (physical, chemical, biological) indicators
IWM condition Monitoring in the major watersheds, statewide or eco-region-based, random surveys of lakes, rivers and streams and wetlands
In some cases, the MPCA incorporates effectiveness monitoring into ongoing project-level activities, such as Clean Water Partnership and Clean Water Act Section 319 projects, and selected regulatory management programs. For example, effectiveness monitoring is used in Clean Water Partnership and Clean Water Act Section 319 projects to evaluate implementation plans and adapt them, as needed. This is also the case for TMDL projects that were implemented prior to adoption of the watershed approach. Effectiveness monitoring of Minnesota’s first approved TMDL, the Southeast Minnesota Regional Fecal Coliform TMDL, will be conducted beginning in 2011 in the Cannon River Watershed, in accordance with the 10-year watershed schedule. In regulatory management programs, effectiveness monitoring is conducted for compliance purposes relative to industrial wastewater and NPDES permits, some feedlots, and some land-based domestic wastewater treatment and dispersal systems.
With the MPCA’s adoption of the watershed approach, the condition monitoring conducted in the first 2 years of the 10-year cycle becomes dual purpose monitoring in cycles following the first 10-year cycle, since at this point the Major Watershed Restoration and Protection Plan developed for the watershed is in on-going implementation. Thus, the condition monitoring conducted in years 1 and 2 in the second, and subsequent, 10-year cycles is an indication of the effectiveness of the implemented measures from the previous cycle. This monitoring will also provide data that can be used to delist impaired waters.
Similarly, the random surveys conducted at 5-year intervals on Minnesota’s rivers and streams, lakes, wetlands, and coastal Lake Superior provide an overall, systems wide indication of the effectiveness of measures being taken statewide to improve and protect water quality.
Section 2.4: Surface Water Monitoring Purposes, Designs, and Indicators This section provides additional detail concerning the purposes, designs and indicators of the MPCA’s monitoring activities. As in previous sections, the monitoring activities are organized by monitoring type–condition, problem investigation, and effectiveness.
2.4.a Surface water monitoring purposes For each of the MPCA’s current monitoring activities, the activity start date (in parentheses), the monitoring purpose, the monitoring design used to meet the monitoring purpose, and the key monitoring parameters are provided. The monitoring parameters for each monitoring activity are also provided in a summary table included as Attachment 1.
Minnesota’s Water Quality Monitoring Strategy 2011-2012 • September 2011 Minnesota Pollution Control Agency
34
Condition monitoring activities
Rivers and streams
• Biological intensive watershed monitoring (IWM): (2007). The primary purpose of the biological intensive watershed monitoring is to collect data for determination of the aquatic life use support. Biological monitoring is conducted during the first year of the IWM cycle (year one of two).
The IWM strategy utilizes a nested watershed design, in which the intermediate-sized (approximately 11- or 12-digit HUC) and minor (14-digit HUC) watersheds are sampled along with the major watershed outlet to provide a complete assessment of watershed biological health. Sampling locations are selected near the watershed outlets at all scales (i.e. approx. 11-, 14-and 8 digit HUC levels). The number of sites sampled per major watershed varies with the watershed size and the number of subwatersheds it contains, but typically about 60 sites are sampled in each watershed (Figure 4).
At each biological monitoring site, fish, invertebrates, and water chemistry samples are collected, and habitat quality is documented. In addition, fish are collected at the watershed outlet to provide fish tissue for analysis to evaluate human consumption concerns (aquatic consumption use).
Fish are collected using electro-shocking techniques, and invertebrates are sampled with dip nets. The water chemistry parameters are a subset of the parameters collected at the chemistry IWM sites; their main purpose is to document water chemistry conditions at the time the biological samples are collected. Fish sampling is typically conducted between mid-June and mid-September, while invertebrate sampling typically takes place between early August and late September.
• Chemistry intensive watershed monitoring (IWM): (2007). The chemistry IWM fulfills several purposes. In the context of the MPCA’s watershed approach, the chemistry intensive watershed monitoring provides integrated stream chemistry data at various watershed scales within the major watersheds to pair with the watershed stream biological monitoring data. This enables a holistic and robust assessment of the watershed condition, which is then used to determine the need for watershed protection and restoration. Chemistry IWM also provides stream chemistry data with which to assess water quality for compliance with individual water quality standards and for aquatic life and aquatic recreation support.
Chemistry monitoring is conducted during the first year of the IWM cycle (year one of two) and continues into the second year for selected parameters (e.g. bacteria). The monitoring design employs a nested sampling design similar to that used for the biological IWM monitoring, with sampling sites located at the outlet of each approximately 11-digit HUC and at the major 8-digit watershed outlet. This results in about 10 chemistry intensive watershed monitoring locations in each major watershed.
At each monitoring location, sampling is conducted approximately 10 times during year one of the IWM cycle to characterize water quality during average and low flow conditions. The samples are analyzed for nitrate-nitrite, Kjeldahl nitrogen, ammonia, dissolved oxygen, total phosphorus, total suspended solids, total volatile solids, E. coli, pH, conductivity, temperature, transparency, and other parameters. During year two of the IWM cycle, additional E. coli data are collected, as well as other parameters, from selected sites on an as needed basis.

Minnesota’s Water Quality Monitoring Strategy 2011-2012 • September 2011 Minnesota Pollution Control Agency
35
• Major watershed load monitoring (IWM): (2007). Major watershed load monitoring (MWLM) fulfills several purposes. In the context of the watershed approach, MWLM provides critical water quality and water discharge information at the outlet of each major watershed for identifying baseline or acceptable loads to maintain and protect water resources, as well as reductions needed to attain water quality goals. Over time, MWLM will provide data to assess long term trends in major watershed water quality and load; and, when watersheds are compared to each other, MWLM will make it possible to measure and compare regional differences and long-term trends in water quality across the state.
The MWLM design is based on the MWLMN which consists of permanent flow monitoring stations at the outlet of each of Minnesota’s 81 major watersheds, excepting a few that drain landscapes contained primarily in neighboring states. Permanent flow monitoring stations are also located along the main stems of Minnesota’s major rivers, including the Red, Minnesota, Mississippi, and Rainy Rivers (Figure 5). On average, the major watersheds have a drainage area of about 1,400 square miles.
The MWLMN records water discharge measurements from the major watershed on a continuous basis, year round, every year. Water quality samples are also collected at the flow monitoring stations on a regular basis year round, every year such that on-going records of load will be available for each major watershed. With this design, an estimated 30-35 mid-stream grab samples are collected per year from each watershed load monitoring station. Monitoring is targeted to characterize major precipitation events, particularly spring runoff; base flow conditions, which typically occur during the winter months; and background flow conditions, primarily during the summer months. The water quality samples are analyzed for conventional pollutants, pH, conductivity and transparency. These water quality and discharge data are then used to compute annual pollutant loads for nitrate plus nitrite nitrogen, total phosphorus, dissolved orthophosphate, and total suspended sediment.
The MWLMN was initiated in 2007 with appropriations from the Minnesota Legislature, and as of 2010 all 82 permanent flow monitoring stations have been installed. The MPCA is planning to expand the MWLMN beginning in 2012 by siting temporary load monitoring stations at the sub-watershed (approximately 11-digit HUC level) outlets within the major watersheds, for the purpose of refining the stressor ID and restoration planning processes. The sampling design (parameters and frequency) will mirror those at the major watershed outlets.
• Fish contaminant monitoring (IWM): (2007). The purpose of fish contaminant monitoring is to collect fish for determination of aquatic consumption use support. The monitoring design involves the collection of fish at the outlet of each major watershed for analysis of mercury and PCBs. Fish contaminant monitoring is conducted as part of the biological intensive watershed monitoring during the first year of the IWM cycle. Depending upon the watershed, additional locations may be sampled and/or the fish may be analyzed for additional contaminants.
For the analysis of mercury content, it is important to sample top carnivore species, while rough fish species are important for PCB analysis. Species preferences for top carnivores are: walleye, northern pike, smallmouth bass, channel catfish, and bluegill. Species preferences for rough fish are: common carp, redhorse sucker, and white sucker. An adequate distribution of fish size classes (edible size) is critical to characterize contamination level, since contaminant concentrations increase with fish size and/or length.

Minnesota’s Water Quality Monitoring Strategy 2011-2012 • September 2011 Minnesota Pollution Control Agency
36
• Citizen Stream Monitoring Program: (1998). The purpose of the CSMP is to obtain assistance from volunteers to monitor river water clarity on stream reaches the MPCA is unable to monitor. The volunteer citizens use a transparency tube to measure water clarity; these data are then used to establish baseline conditions, set goals, assess trends, and identify steams that are candidates for more intensive monitoring. CSMP-collected transparency tube data are also used in the stream assessment process.
Volunteers monitor the clarity of their local streams and rivers on a weekly basis from April through October. Volunteers also have had the option of recording 24 hour rainfall amounts at their homes, but this aspect of the CSMP was transferred to the national Community Collaborative Rain, Hail and Snow Network in spring 2011. Currently, there are about 700 volunteers participating in the CSMP.
• Minnesota Random Rivers and Streams Survey: (1996). The purpose of the Minnesota Random Rivers and Streams Survey is to provide a statistically based, regional estimate of river and stream condition. The survey design since 2010, when the last survey was conducted, is based upon Minnesota’s three major eco-regions; 50 randomly selected river and stream sites within each eco-region are sampled once during the field season, for a total of 150 sites. The survey design calls for the Minnesota Random Rivers and Streams survey to be conducted at five year intervals in conjunction with EPA’s National Rivers and Streams Assessment program (NRSA).
The survey parameters include fish, invertebrates, habitat, land use, limited chemistry, and other parameters at all or a subset of sites. For example, in 2010 the MPCA made use of funding provided by EPA to monitor for pharmaceutical and personal care products, and water column total organic carbon at all 150 survey sites, and for pesticides at 100 sites. The next Minnesota Random Rivers and Streams survey will be conducted in 2015.
Lakes
• Lake Monitoring (IWM): (1985). The primary purpose of Minnesota’s lake water quality monitoring is to provide data to assess lake trophic status and determine whether lakes meet water quality standards for aquatic recreational use support. The MPCA’s lake monitoring goal is to sample all lakes 500 acres or larger and at least 50 percent of lakes 100 to 500 acres in size within the state over a 10-year period. This translates to sampling about 100 lakes each year. As of 2009, the MPCA’s lake monitoring was synchronized with the IWM schedule, such that targeted lakes are monitored by major watershed.
The lake monitoring design calls for monitoring to be conducted on a monthly basis from May to September for a period of two years (i.e., years 1 and 2 of the 10-year cycle). The primary monitoring parameters are total phosphorus, chlorophyll-a, and Secchi depth (i.e., the distance light will travel in lake water), all of which are indicators of a lakes’ trophic status. In addition, the lakes are monitored for several other parameters, including pheophytin, total Kjeldahl nitrogen, nitrite plus nitrate, water color, suspended solids, temperature, dissolved oxygen, and alkalinity.
• Citizen Lake Monitoring Program: (1973). The purpose of the CLMP is to obtain assistance from volunteers to monitor lake transparency on targeted lakes the MPCA is unable to monitor. The transparency data are used to establish baseline conditions, set goals, assess trends, and identify lakes that are candidates for more intensive monitoring.
The volunteer citizens monitor lake clarity using a Secchi disc on a weekly basis throughout the open water months, typically May through September. CLMP Secchi disc data are used to support

Minnesota’s Water Quality Monitoring Strategy 2011-2012 • September 2011 Minnesota Pollution Control Agency
37
the lake assessment process, as well as to calculate water clarity trends on lakes where sufficient data have been collected. Currently about 1,200 citizens are involved in this program and monitor more than 2,200 sites.
• Citizen Lake Monitoring Program Plus: (with local lake associations since 1985, and individual volunteers since 2009). Known as the advanced CLMP program, or CLMP+, the purpose of this citizen monitoring program is to provide monitoring data that can be used for assessment of aquatic recreation use support for targeted lakes that the MPCA is unable to monitor. In addition, the data provided by CLMP+ are used to develop status and trend reports and to recommend actions for local lake management efforts.
The volunteers in CLMP+ are trained to collect a suite of water quality parameters, including temperature, dissolved oxygen, phosphorus and chlorophyll-a. The CLMP+ monitoring design requires the volunteers to collect monthly water chemistry samples, and weekly Secchi disc and temperature and dissolved oxygen profiles from May to September for a period of two years. The resulting water quality data are sufficient to meet the requirements for assessment of the lake for aquatic recreation use support.
The number of volunteers participating in this program is currently very small (on the order of 10 individuals since 2009).
• Minnesota enhancement of EPA’s National Lakes Assessment: (2007). Minnesota’s enhancement of EPA’s NLA provides a statistically based, statewide estimate of lake condition. A total of 50 randomly selected lakes are required to provide a statistically valid dataset on a statewide scale. The MPCA is participating in planning for the 2012 NLA survey.
The monitoring design includes collecting samples from the lakes once during the field season. A wide variety of measurements are made as a part of the survey, including: total suspended solids, total suspended volatile solids, total phosphorus, chlorophyll-a, pheophytin, ammonium, temperature, dissolved oxygen, and a number of others.
• Remote sensing lake monitoring: (1970). The purpose of remote sensing lake monitoring is to obtain dense, low cost information about the condition of Minnesota’s lakes that helps prioritize and direct the MPCA’s on- the- ground lake monitoring activities. Although remote sensing data do not meet the requirements for assessment data, it can be used to identify lakes that may be impaired or experiencing changing lake clarity, and provide information about lakes that are inaccessible or difficult to monitor repeatedly.
The MPCA contracts with the University of Minnesota’s Remote Sensing Laboratory to analyze aerial photography and satellite imagery to assess lake water clarity. The remote sensing survey is conducted at five year intervals on all lakes greater than 20 acres in size.
• Sentinel Lakes: (2008). Sentinel Lakes is a long term, collaborative monitoring program being led by the MDNR; its purpose is to understand and eventually predict the consequences of land use and climate change on lake habitats. The MPCA’s participation primarily involves collecting and assessing water quality monitoring data from the Sentinel Lakes.
The monitoring program includes two phases. Phase I, taking place between 2008 and 2012 and referred to as the Sentinel Lakes program, involves extensive monitoring of the twenty four Sentinel Lakes. This includes monitoring of the lakes’ water chemistry, fisheries, habitat and other factors, as well as detailed assessment of the watershed and related characteristics. The MPCA

Minnesota’s Water Quality Monitoring Strategy 2011-2012 • September 2011 Minnesota Pollution Control Agency
38
collects the water quality data, which is very similar to the monitoring conducted by the MPCA for IWM lake monitoring. The MDNR and other program partners conduct monitoring of zooplankton, aquatic plants and fish, and document the watershed condition and other parameters. The MPCA and MDNR are developing comprehensive reports on each of the 24 lakes; all reports are planned for completion by summer 2012.
Phase II is the longer term program referred to as “SLICE - Sustaining Lakes in a Changing Environment.” For Phase II, the Phase I data collected from the Sentinel Lakes will be used to design a more limited but longer term monitoring program that incorporates the most sensitive indicators of the status of lake habitat and fish communities. Phase II will include monitoring of the Sentinel Lakes as well as a large number of random lakes for the purpose of assessing status and trends in lake habitats and communities, and eventually, for forecasting changes in the lakes based upon possible changes to climate and surrounding land cover. More information about the Sentinel Lakes program is available here: http://www.pca.state.mn.us/index.php/water/water-types-and-programs/surface-water/lakes/lake-water-quality/sentinel-lakes.html.
• Fish Contaminant Monitoring Program: (1968). The purpose of the multi-agency FCMP is to collect fish from Minnesota’s lakes and streams for analysis of contaminants to fulfill a variety of purposes. The MPCA uses the results to assess lakes for aquatic consumption use support; to assess long term trends in fish tissue concentrations of mercury; and to better understand the factors that affect the observed changes in fish mercury levels over time. The long term trend of mercury in fish tissue concentrations is also used to as an indicator of effectiveness relative to Minnesota’s statewide mercury TMDL.
Each year, the partnering agencies jointly select lakes and rivers for fish collection and analysis to meet the program objectives; about 80 water bodies are sampled annually. The collected fish are tested for mercury and PCBs, and sometimes for additional contaminants as part of special studies.
Wetlands
• Major Watershed Wetland Monitoring (IWM): (anticipated in 2013). The MPCA is planning to conduct a pilot project in 2013 to evaluate the utility and feasibility of landscape level wetland assessment techniques for assessing wetland condition at the major watershed scale. The purpose of major watershed wetland monitoring is to integrate wetlands into the overall evaluation of watershed health and to support the assessment, protection and restoration of the watershed’s lakes and streams.
During the pilot, the remote sensing- based technique the agency has been developing since 2007 will be tested. This technique enables broad scale wetland condition to be defined on the basis of wetland plant diversity estimates and the extent of invasive wetland plant species. Other techniques that will likely be used include: rapid wetland plant communities assessments; limited wetland water chemistry and water level fluctuation monitoring; and desktop GIS analysis of wetland position and connectivity and landscape stressors.
• Minnesota Random Wetland Survey: (2011). The purpose of the Minnesota Random Wetland Survey is to provide a statistically based estimate of wetland condition at the ecoregion and statewide scale. The survey design for the next Minnesota Random Wetland Survey includes evaluation of all wetland types. Fifty randomly selected wetlands will be assessed in each of

Minnesota’s Water Quality Monitoring Strategy 2011-2012 • September 2011 Minnesota Pollution Control Agency
39
Minnesota’s three major ecoregions, for a total of 150 sites. The survey design calls for the Minnesota Random Wetland survey to be conducted at five year intervals in conjunction with EPA’s NWCA, the next of which will be conducted in 2011 and 2012.
Floristic Quality Assessment will be used as the primary indicator of wetland quality. More information about FQA is available here: http://www.pca.state.mn.us/index.php/water/water-types-and-programs/surface-water/wetlands/floristic-quality-assessment-for-minnesota-wetlands.html.
• Minnesota Depressional Wetland Survey: (2009). The purpose of the Minnesota Depressional Wetland Survey is to provide a statistically based estimate of the condition of Minnesota’s depressional wetlands at the ecoregion scale. For this survey, the MPCA expects to sample approximately 100 randomly selected depressional wetlands in two of Minnesota’s three ecoregions (the Mixed Wood Shield in the northeastern part of the state is dominated by other classes of wetlands and so will not be included in the survey.) The next Minnesota Depressional Wetland Survey will be conducted in 2012 and 2013.
The survey will be conducted using the wetland invertebrate and plant community IBIs the MPCA developed and used in the first statewide probabilistic wetland condition survey that was completed in 2009. Monitored parameters will include wetland plants, invertebrates and limited water chemistry.
• Wetland Health Evaluation Program (1996): WHEP is a citizen volunteer monitoring program operating in and organized by two metro-area counties (Dakota and Hennepin), for which the MPCA provides annual training. The purpose of WHEP is to provide data that can be used by local units of government for water resource and city planning decision making. Monitored parameters include aquatic plants and aquatic invertebrates to the family level.
Problem investigation monitoring activities
• Total Maximum Daily Load development monitoring: (1999). TMDL development monitoring is conducted for the purpose of completing a TMDL study for an impaired water. In the context of the MPCA’s watershed approach, TMDL studies are watershed focused and are included in the more comprehensive Watershed Restoration and Protection Strategy, which also includes protection strategies for unimpaired waters located within the watershed.
Monitoring conducted for the purpose of developing a TMDL is focused on further identifying the causes and sources of stressors impacting the water body. The monitoring typically includes chemical, physical, and biological parameters that are determined on the basis of the specific impairments and/or stressors identified and the watershed characteristics. The monitoring may be conducted by local groups, contractors, or the MPCA.
Specific types of monitoring that may be conducted under the category of TMDL development monitoring include the following:
Stressor identification monitoring: (2007). This monitoring is conducted in support of the stressor ID process, which is a formal and rigorous process that identifies stressors causing biological and other impairments to aquatic ecosystems; in other words, stressor ID focuses on the major factors causing harm to fish and other river and stream life. Although stressor ID

Minnesota’s Water Quality Monitoring Strategy 2011-2012 • September 2011 Minnesota Pollution Control Agency
40
is primarily geared towards biological impairments, some aspects of the stressor ID process may be used to evaluate the nature of chemical impairments, like low dissolved oxygen (DO) levels (which can also be a stressor to biota).
Stressor ID monitoring typically occurs during year 3 of the 10-year watershed cycle, after assessment of biological and chemical IWM data is completed, although it may begin earlier. Stressor ID monitoring may include any of the standard IWM chemical and biological monitoring parameters, hydrogeomorphological parameters (see below), stable isotopes, pesticides, etc.
Fluvial geomorphology: (2007). Fluvial geomorphology assessment is typically conducted as part of stressor ID monitoring for impaired waters, but it is also applied to watersheds that are not impaired but are being evaluated for protection purposes.
With regard to stressor ID, fluvial geomorphology is used to assess the physical condition of a stream and how the physical condition may be impacting biota that inhabit the stream. More broadly, fluvial geomorphology provides critical information, including the status of stream stability and the capacity of the stream segments for improvement and protection activities, to inform watershed modeling studies and selection of stream segments that are suitable for implementation activities.
The data collected for a geomorphology assessment are specific to each watershed. Monitored parameters may include: stream channel cross-sectional profiles, longitudinal profiles, pebble counts, bed load measures, turbidity, total suspended solids, measures of embeddedness, Pfankuch channel stability evaluation, and stream classification.
• Clean Water Partnership projects: (1987). The state Clean Water Partnership (CWP) program supports locally-based monitoring projects. The purpose of the CWP program is to provide funding for diagnostic work and implementation activities that protect and improve water quality. The MPCA manages the CWP program and selects and funds successful projects. The diagnostic projects involve flow-based monitoring of watershed inputs and outputs to a lake, river, or wetland to determine loadings in areas of local concern, develop goals, and identify strategies for achieving goals. The flow monitoring data collected by CWP projects is also used in developing watershed flow models.
Monitored parameters are project dependent, but most commonly involve those related to stormwater and agricultural runoff – nutrients, bacteria, sediment, flow and hydrological modifications.
• Fishkill investigations and discharge violations: (1950s). Monitoring conducted in connection with these issues is used for incident response, water quality impact documentation and enforcement case development (in support of emergency response, NPDES and feedlot programs). Monitoring is case-specific, but usually the monitoring design involves upstream and downstream sampling, and sampling of candidate causes, if suspected. The MPCA will typically collect samples for water quality analysis and samples of the released material, if it is available. If fish or wildlife is affected, specimens are collected in conjunction with MDNR.
Commonly, when the investigation involves manure and wastewater releases, monitoring parameters include general chemistry (pH, conductivity, total suspended solids (TSS), turbidity, chloride, sulfate, BOD5), nutrients (ammonia-nitrogen, TKN, NO2+NO3-N, Total phosphorus-P), metals, and either E. coli or fecal coliform, depending on the suspected discharge. In the case of

Minnesota’s Water Quality Monitoring Strategy 2011-2012 • September 2011 Minnesota Pollution Control Agency
41
industrial releases or releases of unknown origin, most of above is included as well as more comprehensive suites of metals, volatile organic compounds (VOCs), SVOCs and pesticides, and others as the case requires.
• Waste load allocation surveys to support NPDES program: (1977). The purpose of this monitoring is to provide data that can be used to determine appropriate effluent limits for a discharge so that water quality standards in the receiving water are maintained and the designated uses are protected; the effluent limits are then incorporated into NPDES permits.
Most of this monitoring was conducted in the past, in support of municipal wastewater treatment plants (WWTPs) scheduled for construction under the federal construction grants program; the grant program ceased in the mid-1990s, and so did much of this monitoring. Importantly, the information and knowledge gained by the MPCA through this monitoring work has enabled the MPCA to determine appropriate effluent limits for a permittee with a high level of confidence. However, the MPCA retains the capability to conduct these monitoring surveys when necessary.
The monitoring typically involves two to three day surveys conducted under low-flow conditions on streams and rivers that are, or will become, receiving waters for WWTPs or other NPDES permittees. Typical monitoring parameters include: diurnal DO, temperature, pH, flow, time of travel, physical measurements of the stream channel, carbonaceous biochemical oxygen demand (CBOD), nutrients, chlorophyll a, TSS, turbidity, conductivity, alkalinity, chloride, and sometimes metals. Composite sampling of the wastewater effluent is also conducted, if conditions allow.
Approximately 100 monitoring surveys were conducted for WWTPs constructed with grants from the federal construction grants program during the time the grant program was available.
• Stormwater monitoring for wasteload allocations to support NPDES program: (2006). The MPCA conducts very little, if any, actual sampling of stormwater for the purpose of determining stormwater wasteload allocations as part of the NPDES program. Generally, stormwater wasteload allocations are determined through the use of numerical models. However, stormwater monitoring data collected by MPCA partners, such as watershed management organizations or other local units of government, are occasionally used for the purpose of supporting TMDL studies, determining stormwater hotspots, or otherwise characterizing the quality of stormwater in a geographic area. When available, these data may be used to calibrate or otherwise adjust stormwater wasteload allocations determined via modeling.
Minnesota Pollution Control Agency effectiveness monitoring activities
• Total Maximum Daily Load implementation monitoring: (2003). The purpose of this monitoring is to evaluate the effectiveness of TMDL implementation plans and associated BMPs. This monitoring may be conducted by a local partner or the MPCA. At this point, little monitoring of this type has been performed as there is first the need to allow for enough implementation efforts to happen to make a difference. A monitoring effort on Minnesota’s first completed TMDL, the Southeast Minnesota Regional Fecal Coliform TMDL (November 2002), is beginning in 2011 with IWM condition monitoring in the Cannon River Watershed plus additional enhancements. Under the watershed approach, IWM condition monitoring conducted following TMDL implementation also provides effectiveness monitoring data.
TMDL monitoring design is customized on the basis of the impairment and the type of BMP implemented. In cases where a TMDL is implemented for a pesticide impairment, MDA monitoring program efforts will play a large role, and may need to be enhanced to satisfy TMDL requirements.

Minnesota’s Water Quality Monitoring Strategy 2011-2012 • September 2011 Minnesota Pollution Control Agency
42
The monitoring parameters may include E coli, fecal coliform, turbidity, dissolved oxygen, ammonia, chloride, pH, temperature, impaired biota, excess nutrients, mercury and PCB in water, mercury and PCB in fish tissue, or various toxics.
• Monitoring for delisting an impaired water body: (2003). Monitoring for the purpose of delisting an impaired water body may be TMDL implementation monitoring, as described above. However, in some cases the specific data required to make a determination that a water body is no longer impaired and is eligible to be delisted may not be provided in its entirety through TMDL implementation monitoring. In this case, a local partner or the MPCA may conduct additional monitoring for the purpose of providing the data needed to complete a delisting review. In other cases, this monitoring may be performed in situations where a TMDL has not been performed, but implementation efforts have been undertaken anyway that have addressed water body impairments.
The purpose of this monitoring is to evaluate the effectiveness of TMDL implementation and ultimately to delist a particular water body. At a minimum, the monitoring will meet the delisting guidance in MPCA’s Guidance for Assessing Water Quality Impairments. As described above, the monitoring design is customized based upon the impairment, BMP implemented, and the identified data gaps.
• Stormwater best management practices implementation assessments (2004). To advance stormwater management science, the MPCA has formed several technical advisory panels with many partners, including representatives from cities, developers, professional engineers and environmental groups. The University of Minnesota, under contract with the MPCA, has developed BMP standard assessment methods (http://stormwater.safl.umn.edu/), infiltration studies and trout stream thermal monitoring protocols (the latter is focused on the Vermillion River in the Twin Cities Metro Area and along the North Shore of Lake Superior) http://www.pca.state.mn.us/index.php/water/water-types-and-programs/stormwater/stormwater-management/stormwater-research-and-assessment.html?menuid=&redirect=1.
Based on these new and existing standard assessment methods, Minnesota watershed districts, conservation districts, cities and counties are conducting extensive stormwater BMP performance and urban stream monitoring. Most of this activity is taking place in the Twin Cities Metro Area and is being directly supported or required by the MPCA, including the following: (1) requiring continuous flow/mass balance stormwater monitoring in the new Phase I Municipal Separate Storm Sewer Systems (MS4) stormwater permits for the cities of Minneapolis and St. Paul; (2) encouraging stormwater and urban stream monitoring by a number of local partners, such as the Capitol Region Watershed District in St. Paul; (3) incorporating TMDL wasteload allocations into MS4 permits and; (4) coordinating with several monitoring partners to pool stormwater data collected along the Mississippi River corridor between Minneapolis and St. Paul to enable refined mass-balance calculations. Lastly, the MPCA has partnered with 24 different groups to advance new stormwater Low Impact Development (volume control approaches) as well as traditional rate control BMPs in the Minimal Impact Design Standards project (http://www.pca.state.mn.us/index.php/water/water-types-and-programs/stormwater/stormwater-minimal-impact-design-standards-mids.html ).

Minnesota’s Water Quality Monitoring Strategy 2011-2012 • September 2011 Minnesota Pollution Control Agency
43
• NPDES effluent monitoring (1970s): NPDES effluent monitoring is conducted to provide information about the effluent being discharged by a facility. The monitoring is conducted by permittees in accordance with the terms of their NPDES permit. Ultimately, the monitoring provides data for the purposes of compliance determination, standards development or enforcement.
The monitoring requirements vary by the size and type of the facility. The required frequency of monitoring varies by parameter, and ranges from continuous monitoring to collection of a few samples per year. NPDES permits held by animal feedlots may require tile-line discharge monitoring.
Typical monitoring parameters required by NPDES permits include: 1) for domestic wastewater: flow, CBOD, TSS, pH, P, DO, Fecal coliform, chlorine residual; and 2) for industrial: flow, TSS, pH, temperature. Additional parameters may be required, including biochemical oxygen demand (BOD), P, metals, ammonia, and others as determined by permittee-specific evaluation.
• Up- and down-stream monitoring to support the NPDES permit program (ongoing): This monitoring is conducted by NPDES permittees to provide information that is used for several purposes related to their NPDES permit, including the following: evaluating effluent limits; making compliance determinations; fulfilling the requirements of a variance process; or for understanding variability of treatment permit conditions.
The monitoring design and parameters are specific to each permit and receiving water. The required frequency of sampling ranges from once per week to conditions-based monitoring, such as during low-flow conditions. Parameters vary, but typically include DO, temperature, pH, ammonia, and phosphorus. Approximately 103 permittees are currently conducting receiving water monitoring at 242 stations.
• Monitoring associated with feedlot regulatory activities: (1994). This monitoring is conducted as part of enforcement case development. The monitoring design is case specific. Monitoring parameters include E-coli and BOD.
• Monitoring associated with land based domestic wastewater treatment and dispersal systems: (1980). Land-based domestic wastewater treatment and dispersal systems include subsurface sewage treatment systems (SSTS), spray/drip irrigation systems and rapid infiltration systems. The monitoring conducted in association with these systems is done to evaluate the systems’ hydraulic function and treatment system effectiveness, and to determine whether the systems are meeting public health and environmental protection goals.
The MPCA regulates all SSTS discharging more than 10,000 gallons per day. In addition, the MPCA regulates all spray/drip irrigation and rapid infiltration systems. The MPCA issues State Disposal System (SDS) permits for these three system types. Local units of government regulate SSTS discharging less than 10,000 gallons per day through local permits that specify monitoring frequencies and parameters.
The monitoring requirements vary by system type, system size and site conditions; the larger systems generally have more rigorous monitoring requirements than the smaller systems, which pose less risk. Monitoring parameters may include: CBOD, TSS, oil and grease, pH, chloride, specific conductance, temperature, groundwater elevation, fecal organisms, phosphorus, nitrogen, sludge and scum levels in septic tanks, water ponded in a drainfield, presence of burrowing animals, and fencing/safety devices.

Minnesota’s Water Quality Monitoring Strategy 2011-2012 • September 2011 Minnesota Pollution Control Agency
44
• Monitoring to evaluate Clean Water Partnership implementation projects and Clean Water Act Section 319 projects: (Early 1990s). The CWP and CWA Section 319 programs provide technical assistance and funding to local partners undertaking TMDL implementation projects that protect and improve water quality. These projects primarily address nonpoint pollution. Successful projects receive funding from the MPCA provided by the CWP and CWA Section 319 programs, with additional funding provided by the local partner.
The monitoring designs vary by project, but are typically targeted at assessing the effectiveness of nonpoint source water pollution control efforts that have been implemented. The monitoring parameters are determined by the specifics of the project, but commonly include those related to stormwater and agricultural runoff, including nutrients, bacteria, nitrogen, phosphorus, sediment, flow and hydrological modifications.
As these descriptions indicate, the MPCA conducts many monitoring activities to fulfill a variety of purposes. Each monitoring activity has one or more designed objectives, although in most cases the data are also used for one or more secondary purposes. Tables 5 – 7 provide an overview of the MPCA’s monitoring activities and the key water quality management areas they support.
2.4.b Surface water monitoring designs
Minnesota currently uses a mix of monitoring designs to address the varying purposes and associated data needs for its monitoring programs. Monitoring designs differ in terms of at least three variables: how the monitoring site is selected (fixed, random, self-selected/project selected); how often the sampling occurs (periodic, continuous, or targeted); and which parameters are sampled. The MPCA’s condition monitoring strategy alone employs a combination of designs: three examples are provided in Table 3.
Table 3. MPCA condition monitoring design types and examples
Design Type MPCA Monitoring Activity Example Comments
Fixed station IWM chemistry, biological and load monitoring stations
MPCA uses for condition and trend information; over time, will provide long-term information
Random (Probabilistic) Minnesota Random Rivers and Streams Survey, Minnesota Random Lakes Survey
MPCA uses random design to provide confidence in applying information to a larger area
Self-selected/Project selected
Citizen Lake Monitoring Program, Citizen Stream Monitoring Program, Fish Contaminant Monitoring Program
Provides great degree of geographic coverage; combined with other information can be used for a variety of purposes, including as a targeting tool
2.4.c Surface water monitoring indicators The indicators used in MPCA’s monitoring activities vary by monitoring purpose. Condition monitoring for rivers and lakes, for example, includes monitoring for a standard set of chemicals and water quality characteristics, as described in the summaries of MPCA monitoring activities above. Other monitoring efforts for rivers and lakes may involve sampling for additional chemicals or water quality characteristics in order to fulfill the purpose of the specific monitoring activity.

Minnesota’s Water Quality Monitoring Strategy 2011-2012 • September 2011 Minnesota Pollution Control Agency
45
Table 4 outlines the core indicators used for assessing the condition of Minnesota’s waters. The indicators are provided by aquatic use support and type of water body. Note that the core indicators are different for streams, lakes and wetlands.
Table 4. Core indicators for assessing the condition of Minnesota’s waters
Aquatic Use Streams Lakes Wetlands
Aquatic Life Fish and invertebrate IBI Ammonia Chloride Nutrients Dissolved oxygen Metals Pesticides pH Temperature Turbidity/TSS
Chloride (Fish and plant IBIs are under development by MDNR)
Plant and invertebrate IBI
Aquatic Recreation E coli
Nutrients Transparency Chlorophyll
N/A
Aquatic Consumption1 Fish PCBs Fish mercury PFCs Mercury in water column
Fish PCBs Fish mercury PFCs
N/A
Drinking water Nitrate
During monitoring activities, the MPCA records “field parameters” such as temperature, DO, conductivity and pH (some of which are noted in Table 4) and observational data, such as the recreational suitability of the water, and the flow and stage of the water in the case of streams. MPCA biologists also collect stream physical water body characteristics (fluvial geomorphology such as bottom type and bank stability), prevailing habitat and surrounding land use. While these physical indicators can be important considerations in assessing the condition of water bodies, they generally are not used on their own as the basis for determination of an impaired water use. For example, waters are not listed as impaired on the basis of habitat or hydrologic regime. For this reason, these characteristics or indicators are not included in Table 4.
The MPCA has developed its bioassessment capacities considerably since 2006. With the MPCA’s adoption of the watershed approach, the MPCA has increased the spatial intensity of its biological sampling stations, thus significantly enhancing the data available for aquatic life use assessment of rivers and streams. The combination of the intensified biological sampling framework and strategically located intensive water chemistry monitoring stations provide for comprehensive assessments. In addition, these indicators form the foundation for the identification of biological stressors and are useful in documenting trends over time.
1 The Minnesota Department of Natural Resources collects these data in cooperation with the Departments of Agriculture and Health, and MPCA, via the Minnesota Fish Contaminant Monitoring Program (FCMP).

Minnesota’s Water Quality Monitoring Strategy 2011-2012 • September 2011 Minnesota Pollution Control Agency
46
The MPCA relies on the core indicators to assess lakes for aquatic recreation use support, but also considers other parameters to fully characterize the condition of a lake for reporting purposes. For example, lake morphometry, watershed characteristics, lake catchment land use, precipitation and climate, surrounding geology, and Minnesota Lake Eutrophication Analysis Procedures modeling are all considered when characterizing lakes for assessment and placing them in context with eco-region expectations. In addition, temporal trends in lakes are evaluated based upon current and historic trophic status data.
Similarly in streams, monitoring may include additional indicators, depending on the particular purpose or need. As an example, on the Lower Mississippi River, an interstate water, MPCA uses PCBs and mercury in fish to assess for aquatic consumption. In this case, the state of Wisconsin has identified the need and provides the data for use in Minnesota’s assessments. Examples of differing purposes requiring additional indicators can also be found in stream nutrient criteria development. To develop nutrient criteria for streams, data on nutrients and solids in streams are necessary, requiring monitoring efforts to add these indicators that are not part of the core set of indicators (Table 4).
Problem investigation and effectiveness monitoring also may require different indicators and parameters because these monitoring activities are focused on a specific problem or remedial activity that may involve additional chemicals of concern.
MPCA is currently developing several enhancements to its monitoring activities. River eutrophication standards, similar to the lake eutrophication standards that were promulgated in 2008, are in development. To improve our ability to use stream transparency for trend analysis, we are also following the advice of University of Minnesota statisticians and are switching from using two size transparency tubes (60 cm and 100 cm, depending on the typical clarity of the stream site) to one single tube that all monitors would use (100 cm). This equipment transition is in progress and should be completed by spring 2012.
At a programmatic level, the MPCA tracks another set of indicators to evaluate the effectiveness of its monitoring program. Programmatic indicators used for surface water monitoring include: percent of major watersheds assessed; percent of lakes with sufficient data to assess; percent of priority watershed monitoring conducted by local partners; lakes and streams monitored by citizen volunteers; and the impairment/unimpairment rate of lakes and streams. By tracking these programmatic indicators over time, the MPCA can assess Minnesota’s progress in monitoring its waters.
In the future, MPCA may consider developing additional indicators for such things as emerging issues, as well as diagnostic indicators, microbial stressors, methods comparability studies, biological condition/human disturbance gradient, etc. Note that MPCA staff completed a methods comparability study related to coliform bacteria and E. coli prior to adopting E. coli as the standard method for bacteria in 2008. The MPCA is currently involved in a second methods comparability study to relate turbidity measurements to TSS results, in advance of the MPCA’s adoption of TSS as the standard method for evaluation of turbidity in 2012. In each case, the updated analytical method is an improvement over the prior method; the methods comparability studies provide an opportunity to review the comparability of past results and also, in some cases, to develop a reasonable conversion such that past data can be used for evaluation of trends. These studies are important because the parameters are core indicators that play an important role in determining whether a body of water is impaired.

Table 5. Relationship of MPCA condition monitoring activities to key water quality management areas
Basic
Reporting
WQ Standards Watersheds/NPS Watersheds
/NPS
NPDES/Other Permitting Civic Engagement
Monitoring Activity
Status Trends Tiered Uses
UAA Refined Water Quality Criteria
Anti-deg
Site-specific CriteriaMod.
NPS/BMP/ Local Issues
Habitat List/ Delist
TMDL Dev.
Permit Effluent Limits
Priority Setting
Stormw
ater
WET limits/ Cond.
Presence/ Severity/ Extent
Compliance/ Enforcement
Promote water stewardship
Major WS Biological (IWM)
3 3 3
Major WS Chemistry (IWM)
3 3 3
Major WS Lakes (IWM) 3
Major WS Wetlands (IWM)
3 3 3 3 3 3 3 3
Major & Sub WS Load (IWM)
3
Fish Contaminants, including IWM
MN Random Rivers & Streams Survey*
3
MN Random Lakes Survey* 3
MN Random Wetland Survey*
3 3 3
MN Random Depressional 3 3 3
Minnesota’s Water Quality Monitoring Strategy 2011-2012 • September 2011 Minnesota Pollution Control Agency
47

Minnesota’s Water Quality Monitoring Strategy 2011-2012 • September 2011 Minnesota Pollution Control Agency
48
Basic
Reporting
WQ Standards Watersheds/NPS Watersheds
/NPS
NPDES/Other Permitting Civic Engagement
Monitoring Activity
Status Trends Tiered Uses
UAA Refined Water Quality Criteria
Anti-deg
Site-specific CriteriaMod.
NPS/BMP/ Local Issues
Habitat List/ Delist
TMDL Dev.
Permit Effluent Limits
Priority Setting
Stormw
ater
WET limits/ Cond.
Presence/ Severity/ Extent
Compliance/ Enforcement
Promote water stewardship
Wetland Survey*
CSMP CLMP/CLMP+ Remote Sensing Lake Monitoring
3
Sentinel Lakes 3 3Special Studies Monitoring (PFCs, EDCs)
*= conducted in association with EPA’s National Aquatic Resource Surveys = Design objective = Secondary use 3= Planned/potential future use

Minnesota’s Water Quality Monitoring Strategy 2011-2012 • September 2011 Minnesota Pollution Control Agency
49
Table 6. Relationship of MPCA problem investigation monitoring activities to key water quality management areas
Basic
Reporting
WQ Standards Watersheds/NPS TMDL/303d/
305b
NPDES/Other Permitting Civic
Engagement
Monitoring Activity
Status Trends Tiered Uses
UAA Refined Water Quality Criteria
Anti-deg
Site-specific Criteria Mod.
NPS/BMP Diagnosis
Habitat List/ Delist
TMDL Dev.
Permit Effluent Limits
Priority Setting
Stormw
ater
WET limits/ Cond.
Presence/Severity/
Extent
Compliance/Enforcement
Promote Water
Stewardship
TMDL Development /Stressor ID monitoring
3 3 3 3
CWP projects Fishkill investiga-tions and discharge violations
Waste load allocation Surveys /NPDES
3 3
= Design objective = Secondary use 3= Planned/potential future use

Minnesota’s Water Quality Monitoring Strategy 2011-2012 • September 2011 Minnesota Pollution Control Agency
50
Table 7. Relationship of MPCA effectiveness monitoring activities* to key water quality management areas
Basic Reporting
WQ Standards Watersheds/NPS TMDL/303d/ 305b
NPDES/Other Permitting Civic Engagement
Monitoring Activity
Status Trends Tiered Uses
UAA Refined Water Quality Criteria
Anti-deg
Site-specific Criteria Mod.
NPS/BMP Effectiveness
Habitat List/ Delist
TMDL Dev.
Permit EffluentLimits
Priority Setting
Stormw
ater
WET limits/ Cond.
Presence/Severity/Extent
Compliance/ Enforcement
Promote Water
Stewardship
TMDL Implementation 3
Monitoring for Delisting 3
Storm-water BMP Implementation
3
NPDES effluent monitoring
Up/down stream NPDES monitoring
Feedlot regulatory monitoring
Land-based WW treatment /dispersal regulatory monitoring
CWP Implementation/ CWA Section 319 projects
= Design objective *Although not included in this table, the IWM condition monitoring activities from = Secondary use Table 5 become effectiveness monitoring activities when they are repeated as part 3 = Planned/potential future use of the ten year major watershed schedule rotation.

Minnesota’s Water Quality Monitoring Strategy 2011-2012 • September 2011 Minnesota Pollution Control Agency
51
Section 2.5: External Organization Monitoring The following provides a brief description of the monitoring purposes, designs and activities of other Minnesota organizations involved in surface water quality monitoring: the Minnesota Department of Agriculture (MDA); the Minnesota Department of Natural Resources (MDNR); the U.S. Geological Survey (USGS); and the Metropolitan Council Environmental Services (MCES). The MPCA and other state agencies with responsibility for water resource management in Minnesota have been coordinating their monitoring activities via the Clean Water Fund Interagency Coordination Team’s Surface Water Monitoring subteam to make the best and most efficient use of the new funding opportunities that became available with establishment of the Clean Water Fund (CWF). Monitoring activities that have previously been described because of MPCA’s participation will not be described in detail in this section.
2.5.a Minnesota Department of Agriculture surface water quality monitoring activities The primary goal of MDA’s surface water monitoring activities is to provide information on the impact of pesticides in Minnesota’s surface waters as directed by the Minnesota Pesticide Control Law, Minn. Stat. ch. 18B. Protection of Minnesota’s citizens and water resources from pesticides is the fundamental purpose of this goal. To achieve this goal the following objectives have been identified:
1. Measure pesticide concentrations in representative streams and rivers in agricultural and urban areas of Minnesota.
2. Provide analysis of pesticide concentration dynamics (magnitude, duration and frequency of detections) at locations that have demonstrated the potential to exceed standards or other relevant numeric criteria.
3. Collect other relevant information related to pesticide fate and transport such as flow, persistence and use.
4. Compile, analyze and disseminate the information developed through the monitoring program to policy makers, scientists, and citizens.
5. Document the effectiveness of actions taken to prevent or minimize the impacts associated with pesticides and nutrients and verify that water body impacts are, indeed, minimized or do not lead to impairments of use.
6. Monitor for nutrients along with pesticides by conducting special monitoring activities specifically to evaluate fertilizer BMPs.
MDA has developed regionally based water quality monitoring networks for the purpose of collecting and reporting groundwater and surface water monitoring data. These 10 Pesticide Monitoring Regions (PMRs) are based on areas of similar agricultural practices and hydrologic/geologic characteristics (Figure 9). These agroecoregions also consider climatological data.
In 2006, the MDA began monitoring surface water utilizing the tiered structure defined and described in an MDA Surface Water Monitoring Design Document which is available at: www.mda.state.mn.us/monitoring. Within the tiered structure, there are three different levels (tiers) of monitoring intensity. Tier 1 site locations are distributed throughout most of the agricultural areas of the state and are sampled four times during an eight week period from May 1 through June 30. The objective is to provide a general assessment of water quality during peak pesticide detection periods

Minnesota’s Water Quality Monitoring Strategy 2011-2012 • September 2011 Minnesota Pollution Control Agency
52
from watersheds throughout the state. At Tier 2 and 3 site locations, the frequency of sampling increases to provide better information for duration assessment or the length of time pesticide concentrations remain at a particular level.
MDA’s long-term intensive surface water monitoring efforts (known as Tier 3) has historically focused on two primary areas of the state: southeastern Minnesota and the Minnesota River Basin. In 2009, an additional Tier 3 location was established in the Red River Valley in northwestern Minnesota on the Buffalo River near Georgetown. In 2010 there were seven MDA Tier 3 monitoring sites in operation, three of which are located in the Minnesota River Basin, three in southeastern Minnesota and one in the Red River Basin. Surface water monitoring at most of the intensively monitored sites includes both equal-flow increment and equal-time increment composite sample collection during storm flow periods using stage activated automated samplers. Since 2006, the MDA has made an effort to collect storm flow samples on an ETI basis at Tier 3 sites to generate data that were more readily comparable to duration based standards or reference values. Base flow periods are typically characterized by grab samples collected between storm events.
In 2008 the MDA was awarded a Legislative-Citizen Commission on Minnesota Resources (LCCMR) grant for the purpose of developing additional capabilities for analyzing for pesticides in groundwater and surface water. Previous laboratory analyses consisted of separate analytical procedures for base neutral pesticides, chloroacetanilide degradates, and chlorophenoxy acid herbicides. This meant that each analysis needed a separately collected container for each different procedure, which had become problematic in some circumstances. To increase laboratory efficiency and capacity, the MDA used the LCCMR grant to purchase equipment for a liquid chromatography with tandem mass spectrometry (LC-MS/MS) analytical method capable of detecting a much broader suite of chemicals, and at lower concentrations for some chemicals. In addition to the LCCMR funding, a separate legislative appropriation made it possible to purchase a second LC-MS/MS for running additional samples. The MDA laboratory also continues to run a gas chromatography mass spectrometry (GC/MS) procedure for analytes not captured by the new LC-MS/MS.
This switch to new methods has greatly expanded the MDA’s monitoring capability. Whereas in 2009, MDA looked for approximately 44 chemicals between the three different analytical procedures, in 2010 MDA can look for over 100 different chemicals between the two different analytical procedures. The MDA laboratory was able to maintain all the analytes from the previous methods. The most significant component of the new methods is the ability to quantify concentrations for many of these chemicals at much lower levels. All of the pesticides now analyzed with the LC-MS/MS are being quantified at parts per trillion (ppt) levels.
The program develops a full report on the monitoring results every year. These reports are made available on the MDA webpage www.mda.state.mn.us/monitoring and are shared with the MPCA, MDH, and other interested agencies, organizations or individuals.

Figure 9. MDA water quality monitoring regions
2.5.b Minnesota Department of Natural Resources surface water quality monitoring activities Two of MDNR’s core missions are to conserve and manage the state’s natural resources, including its surface water resources, and provide for commercial uses of natural resources in a way that creates a sustainable quality of life. Since the MPCA and MDNR require similar types of data to carry out their statutory responsibilities, the agencies collaborate on how water quality, water quantity and aquatic community status are measured, including: planning their instrument deployment; instrument maintenance; and data collection, storage and evaluation activities. This collaboration ensures the highest degree of efficiency and effectiveness.
Minnesota Department of Natural Resources stream hydrology
The Division of Ecological and Water Resources (DEWR) collects data and provides information on stream flows in Minnesota that is needed to carry out the MDNR’s statutory responsibilities and water management programs. Primary clientele are: MDNR staff who use stream flow information to make permit decisions and monitor flooding; the MPCA who uses stream flow information to calculate pollutant loads for TMDL studies and other uses; consulting engineering firms; and other MDNR staff, state agencies, local governments, researchers, and members of the public who need stream flow information for water planning and management decisions.
Minnesota’s Water Quality Monitoring Strategy 2011-2012 • September 2011 Minnesota Pollution Control Agency
53

Minnesota’s Water Quality Monitoring Strategy 2011-2012 • September 2011 Minnesota Pollution Control Agency
54
The MDNR installs, upgrades, and calibrates stream gages and collects, compiles, analyzes and distributes the hydrologic data collected at the gaging stations. These stations include many of the gaging stations located at the state’s major watersheds (8 –digit HUC) and associated subwatersheds that are part of the MPCA’s Major Watershed Load Monitoring (MWLM). The MDNR’s gaging station network also includes stations that provide data for an interagency Flood Forecasting/Warning system. The stream gaging data are used by the MDNR to evaluate trends in stream base flow conditions, determine the frequency and magnitude of floods and low flows, and assist in assessing changes in watershed condition that may be caused by land use changes or changes in climate changes. The MDNR also uses the stream gaging data to develop hydrologic models to evaluate problems involving surface/groundwater interactions and to make decisions regarding suspensions of certain water appropriation permits.
The continuous flow data from the gaging stations is stored in the HYDSTRA database that the MDNR and MPCA jointly operate and maintain. This database is being replaced in 2011 by the AQUARIUS database. The continuous flow data are available to state agencies and the public via the Cooperative Stream Gaging website, also jointly operated and maintained by the MDNR and MPCA. The Cooperative Stream Gaging website provides a portal for state agencies and the public to access real-time stream flow data, site photos, water quality information, and other information. The website is available at this location: http://www.MDNR.state.mn.us/waters/csg/index.html.
Examples of information available from the Cooperative Stream Gaging website include:
• streamflow gage location, site characteristics, reader, type of gage, and drainage area
• stage/discharge rating curves and equations
• stream flows
• hourly headwater and tailwater readings
• flow statistics
• flood damage stages
Minnesota Department of Natural Resources lake hydrology
The DEWR collects information about lake levels that is used by the MDNR to determine the control elevations of public waters. The primary means for obtaining this information is the MDNR’s Lake Level Minnesota Program, which recruits volunteer citizens and local partner organizations to collect and report lake levels measurements at more than 900 locations throughout the state. Each spring, MDNR DEWR staff reset and survey the lake gages at each monitoring location to prepare them for the field season. The volunteer citizens and local organizations then monitor lake levels using the gages throughout the open water season.
The lake level data are available on the MDNR’s website through a searchable tool called Lake Finder. Lake Finder makes data for more than 4,500 lakes and rivers throughout Minnesota immediately available to state agency staff, local units of government and residents. Lake Finder data include: fish species and abundance, lake depth maps, lake water quality data and lake water clarity data (from the MPCA), satellite-based water clarity information (from the University of Minnesota),lake notes, and fish consumption advice (from the MDH). Lake Finder also provides information about lakes infested with invasive species.

Minnesota’s Water Quality Monitoring Strategy 2011-2012 • September 2011 Minnesota Pollution Control Agency
55
Other lake-related activities
Sustaining Lakes in a Changing Environment Program
The Division of Fish and Wildlife administers this statewide, collaborative long-term lake monitoring program that assesses status and trends of lake ecosystem indicators in selected lakes that are representative of the state's most common aquatic environments. The information gathered through this program will be used to develop management approaches that can mitigate or minimize negative impacts caused by conventional "high-impact" residential development and agriculture, aquatic plant removal, invasive species and climate change. The MPCA is MDNR’s primary partner on this project. More information about the Sustaining Lakes in a Changing Environment (SLICE) Program is available: http://www.MDNR.state.mn.us/fisheries/slice/index.html
Fish Contaminant Monitoring Program
Division of Ecological and Water Resources chairs the interagency team that makes up Minnesota’s Fish Contaminant Monitoring Program. The team coordinates staff and financial resources to provide essential data that are used by several agencies for a number of purposes, including: developing science-based fish-consumption advice; evaluating mercury cycling, analyzing water quality trends, developing water quality standards, and evaluating the potential harm of newly identified bioaccumulative pollutants. The MDNR is responsible for fish collection, processing, and data analysis, as well as other aspects of the program. More information about the FCMP is available: http://www.MDNR.state.mn.us/eco/fcmcs/index.html
Lake Index of Biological Integrity
The MDNR’s divisions of Fish & Wildlife and Ecological and Water Resources collect information on game fish populations and aquatic plant communities in lakes to inform its efforts to manage fish and waterfowl populations. Recently MDNR began augmenting their data collection to inform water quality assessment efforts by developing an Index of Biotic Integrity (IBI). This is the same approach the MPCA uses to help determine whether streams, rivers, and wetlands in Minnesota are impacted by water pollution (http://www.pca.state.mn.us/index.php/water/water-monitoring-and-reporting/biological-monitoring/about-biological-monitoring/about-biological-monitoring.html).
The MDNR has developed a fish-based IBI for certain lake types in Minnesota and is currently focused on expanding the tool so that it can be used throughout the state. The primary use of the lake IBI is to identify lakes that may have water quality impairments; work that will contribute directly to assessment efforts. Further development of the lake IBI involves sampling a wide range of lakes, from high-quality systems to those with significant water quality impacts, plus detailed statistical analysis to understand how community structure and composition changes in response to water quality. The MDNR is also evaluating whether existing aquatic plant assessment data are sufficient to support IBI development.
The MDNR expects to have one or more lake IBIs developed and verified by 2015 so that this approach can be incorporated into the MCA’s watershed assessment process.
Other Minnesota Department of Natural Resources Monitoring
To support MDNR’s statutory responsibilities in the areas of wildlife management, the MDNR conducts monitoring and performs assessments of lakes, streams and wetlands for the purpose of evaluating wildlife and ecological health.
The Section of Wildlife’s Shallow Lakes Program surveys shallow lakes across the state every summer. These surveys include: aquatic vegetation, water depth, and water clarity. A water chemistry sample is analyzed for total phosphorus and conductivity. Observations of wildlife use are also recorded. These

Minnesota’s Water Quality Monitoring Strategy 2011-2012 • September 2011 Minnesota Pollution Control Agency
56
data provide baseline information on wildlife habitat conditions and help determine management actions. Subsequent surveys document results of management actions to determine management success, develop adaptive management strategies, and show the public results of management.
A subset of 45 shallow lakes is monitored on a regular and ongoing basis. On these lakes, vegetation surveys are conducted every third year and waterfowl use is monitored every fall.
To support MDNR’s statutory responsibility to protect and preserve rare species and improve biodiversity the Division of Ecological and Water Resources is inventorying the distribution of rare resources and high quality natural communities across Minnesota and tracking changes in the abundance of key populations and communities.
Finally, to help maintain the ecosystems services that healthy aquatic ecosystems provide, the MDNR’s divisions of Ecological and Water Resources and Fish & Wildlife are collecting and organizing data to describe the status of five key aquatic ecosystem attributes, their biotic communities, water quality, hydrology, geomorphology, and connectivity. The Watershed Assessment Tool (http://www.MDNR.state.mn.us/watershed_tool/index.html) is a platform that organizes and helps interpret data layers that describe aquatic ecosystem health. The MPCA uses these data when evaluating water bodies that are in need of restoration and protection, as part of the stressor ID process.
2.5.c Metropolitan Council Environmental Services surface water quality monitoring activities The Environmental Monitoring and Assessment Section of the Metropolitan Council Environmental Services (MCES) conducts water quality monitoring of rivers, streams, lakes, and wastewater treatment plant discharges in the Minneapolis-St. Paul seven-county Metro Area. Monitoring is conducted through several programs as described below.
Large river monitoring
The large river monitoring program originated in 1927 when a predecessor agency began assessing the water quality of the Mississippi River after it had been declared a public health hazard. The monitoring program has evolved over the years to reflect changing needs and water quality issues. Today, monitoring is conducted to meet NPDES permit requirements, assess the performance and effectiveness of MCES wastewater treatment plants, measure compliance with state water quality standards and criteria, determine the biological health of large river ecosystems, and obtain information on the sources and water quality impacts of nonpoint source pollutants. The large river monitoring program is comprised of several sub-programs as described below.
• Automatic monitoring - The automatic monitoring network was initiated in 1973 as a cooperative program with the USGS. The network consists of six monitors located along the Mississippi (UM 836.8, above the Metro Plant; UM 831.0 at Newport; UM 826.7 at Grey Cloud Island; and UM 815.6, above Lock & Dam No. 2), Minnesota (MI 3.5 at Fort Snelling), and Vermillion Rivers (VR 15.6 near Farmington). MCES currently operates this program. The monitors continuously measure and record the dissolved oxygen content, temperature, pH, and specific conductance of the river water.

Minnesota’s Water Quality Monitoring Strategy 2011-2012 • September 2011 Minnesota Pollution Control Agency
57
Turbidity is also measured at Fort Snelling only. These variables are good indicators of river quality, the effectiveness of treatment plant operations, and problems caused or aggravated by diurnal (24-hour cyclic) phenomena.
• Conventional monitoring - Conventional pollutant monitoring is conducted to complement automatic monitoring. On a weekly to biweekly basis, river samples are manually collected at additional fixed sites between the automatic monitoring stations and are analyzed for numerous variables that cannot be measured by the automatic monitors. Conventional monitoring more fully characterizes water quality and helps to determine specific sources and levels of pollution. Analyses are conducted in the field as well as in the MCES laboratory.
Along the Mississippi River, 11 conventional monitoring sites are located between Anoka on the north end and Lock and Dam No. 3 near Red Wing on the south end of the Twin Cities Metro Area. The Minnesota River is monitored at five locations, beginning at Jordan near the western boundary of the Metro Area and ending at Fort Snelling near the confluence with the Mississippi River. The St. Croix River is monitored at two locations, upstream of the St. Croix Valley Plant at Stillwater, MN and near the river mouth at Prescott, WI. Three sites are monitored on the Vermillion River, and one site is monitored on the Rum River just prior to its confluence with the Mississippi River in Anoka.
• Toxics water monitoring – On a bimonthly to annual basis, river water samples are collected from seven sites on the Mississippi River, three sites on the Minnesota River, and two sites each on the St. Croix and Vermillion Rivers for analysis of toxic contaminants, including 14 trace elements (metals) and numerous organic compounds. Results of these analyses help determine the extent and nature of any toxics problems that may exist, and also help determine the effectiveness of the MCES Industrial Waste Control (Pretreatment) Program. Since concentrations of trace elements and organic compounds in river water tend to be an order of magnitude lower than concentrations of conventional variables, detection and analysis of these toxic compounds is more difficult.
• Biological monitoring - Biological monitoring serves as a useful screening tool for assessing the integrated effects of water pollution on aquatic organisms. The composition of the biological communities reflects water quality and is indicative of the various stresses to the ecosystem. On a two-three year basis, nine biological stations are monitored on the Mississippi River, two each on the Minnesota and St. Croix Rivers, and one on the Vermillion River. Four organism groups are monitored, with each representing a different portion of the riverine community. Taxonomic identification, organism counts, and diversity index calculations are performed on these four biological groups, which include phytoplankton, periphyton, zooplankton, and macroinvertebrates.
• Riverbed sediment monitoring, biological - At selected river monitoring sites on an occasional (5-10 year) basis, riverbed sediment samples are obtained to measure the toxicity of contaminants to sediment-dwelling organisms. Sediment toxicity testing is conducted in the laboratory with chironomids and amphipods, which are placed in beakers with riverbed sediment samples for a 10-day period. Mortality rates of these aquatic organisms are determined. Sediment samples are also collected for the purpose of counting and identifying the indigenous species of sediment macroinvertebrates. Chemical monitoring (see below) of the sediment is conducted in conjunction with toxicity testing and biological monitoring. The combination of toxicity testing, biological monitoring, and chemical monitoring is referred to as the sediment quality triad approach for evaluating the impacts of contaminants that accumulate in riverbed sediment.

Minnesota’s Water Quality Monitoring Strategy 2011-2012 • September 2011 Minnesota Pollution Control Agency
58
• Riverbed sediment monitoring, chemical – Concurrent with the collection of riverbed sediment samples for toxicity testing and biological analysis, riverbed sediment samples are also collected for chemical analysis of trace elements (metals) and organic compounds (acids, base-neutrals and pesticides). The MPCA has developed numeric sediment quality guidelines for trace elements and organic compounds that are protective of sediment-dwelling organisms. To provide additional information, biological monitoring (see above) is also conducted to determine sediment toxicity.
Stream monitoring
Stormwater runoff in both urban and rural areas carries nonpoint source pollutants from diverse and widely scattered sources to Metro Area streams and rivers. Twenty-one streams are monitored in the Metro Area to: determine the extent of nonpoint source pollutant loading from tributaries to the Mississippi, Minnesota, and St. Croix Rivers; provide the information necessary for development of target pollutant loads for these tributary watersheds; and evaluate the effectiveness of watershed best management practices for reducing nonpoint source pollution and improving water quality in streams and rivers. These streams are monitored during significant runoff events, such as snowmelt and heavy rainfall, and during base flow conditions, to help determine the sources and extent of nonpoint sources of pollution. Automated measurements of water stage, in conjunction with rating curves, are used to estimate flow rates in all streams. During runoff events, automated water samples and occasional grab samples are obtained for analysis of a wide variety of nonpoint source pollutants. During baseflow conditions, grab samples are obtained for water quality analysis.
• Automatic monitoring of physical parameters - Continuous automatic monitoring of stream flow, stage (water height), conductivity, and temperature is conducted at 22 stream stations.
• Automatic sampling of pollutants - Conducted at the same stations and as a complement to the automatic monitoring, automatic sampling occurs when automated samplers are triggered by a runoff event and subsequently collect a composited water sample during the course of the event hydrograph, for analysis of a wide variety of nonpoint source pollutants. These samples are analyzed in the MCES laboratory.
• Grab sampling - Grab samples are also collected at the stream monitoring sites and supplement the information obtained from automatic monitoring and sampling. Grab samples are collected to characterize water quality during both baseflow and runoff event conditions. These samples are analyzed in the MCES laboratory.
• Precipitation monitoring - Continuous precipitation monitoring is conducted at most stream monitoring stations and at three additional stations: one near Farmington in Dakota County, one in western Carver County, and one near Lake Minnetonka in Hennepin County. These three additional stations help determine the precipitation amounts reaching some of the southern- and western-most Metro Area watersheds.
• Biological monitoring - On an annual basis, multi-habitat macroinvertebrate samples are obtained at 14 of the 22 stream monitoring stations.
Lake monitoring
The Metropolitan Council has conducted water quality monitoring of Metro Area lakes since 1980. Both MCES staff and citizen volunteers have been obtaining the monitoring data. The MCES Citizen-Assisted Monitoring Program (CAMP) has been very successful at involving citizens in lake monitoring efforts and

Minnesota’s Water Quality Monitoring Strategy 2011-2012 • September 2011 Minnesota Pollution Control Agency
59
greatly expanding the number of lakes with water quality data. The long-term goal of the MCES lake monitoring program is to obtain and provide information that enables cities, counties, lake associations, and watershed management districts to better manage Metro Area lakes, thereby protecting and improving lake water quality.
• MCES monitoring - MCES staff conducts bi-weekly monitoring (April-October) of approximately 12-14 Metro Area lakes per year, on a rotating schedule. Lakes are monitored for a variety of trophic status indicators (total phosphorus, chlorophyll-a, Secchi transparency, dissolved oxygen, etc.), to determine the lakes’ basic ecology, to assess possible water quality trends, and to help quantify lake responses to management efforts by cities, counties, and watershed districts. Information from the MCES lake monitoring program (such as a lake’s degrading water quality trend) can lead to a more intensive lake and watershed study (see special lake monitoring projects below).
• Citizen-assisted monitoring - CAMP is an MCES-managed program where citizen volunteers monitor the water quality of Metro Area lakes. In 2009, 189 CAMP lakes were monitored by 142 citizen volunteers. On a bi-weekly basis (April-October), each volunteer collects a surface water sample for laboratory analysis of total phosphorus, total Kjeldahl nitrogen, and chlorophyll-a, obtains a Secchi transparency measurement, and provides some user perception information about the lake’s physical and recreational condition. The main purpose of CAMP is to provide lake and watershed managers with water quality information that will not only help them properly manage these resources, but will also help document water quality impacts and trends. An added benefit of the program is the volunteers’ increased awareness of their lakes’ condition, which has fostered local efforts to protect lakes and promote support for lake management.
• Lake monitoring projects - MCES research projects are occasionally conducted on individual lakes in an attempt to answer pre-determined questions. Additional monitoring may include in-lake plankton analyses and macrophyte surveys and assessment of water quality, water quantity, and land use within the watershed. This information may subsequently be used for in-lake and watershed computer modeling of pollutant sources, loads, and impacts on water quality. For example, an emphasis of a special project may be the determination of nutrient sources and loads to a lake, thereby providing valuable information for lake management efforts. MCES is currently partnering with the MPCA to evaluate chloride levels in select Metro Area lakes, to determine the impacts of winter road de-icing activities.
• Special lake monitoring - Special monitoring is conducted on Metro Area lakes on an “as-needed” basis. Special monitoring may include such things as coliform bacteria tests on lakes affected by sewer breaks or algal analysis on lakes causing illness in domestic animals.
Wastewater treatment plant monitoring
Performance monitoring of all seven MCES wastewater treatment plant discharges is conducted annually to meet NPDES permit requirements and to assess the quality of treated wastewater discharged to the large rivers in the Metro Area. Both biological and chemical monitoring are conducted on the wastewater treatment plant discharges. In addition, the chemical characteristics of groundwater in the vicinity of some MCES wastewater treatment plants are measured through a network of monitoring wells.

Minnesota’s Water Quality Monitoring Strategy 2011-2012 • September 2011 Minnesota Pollution Control Agency
60
• Effluent toxicity testing, biological – Biological toxicity testing consists of a set of tests that are conducted in a controlled environment to determine the biological effects of a substance, factor, or condition on living organisms. It is valuable to conduct such tests to help determine the toxicity of numerous chemicals contained in wastewater treatment plant effluents, and to determine the effects of these effluent discharges on aquatic organisms in Metro Area receiving waters. The MCES toxicity testing program began in 1979 in response to both federal and state laws prohibiting the discharge of toxic materials in toxic amounts. Two types of toxicity tests are conducted: acute and chronic. Acute tests are short-term (one-four day) mortality tests that determine the immediate toxicity of the effluent and also indicate whether or not additional testing is required. Chronic tests are longer-term (seven day) tests that measure the potential long-term toxic effects of the effluent on test organism survival, growth, and reproduction. Effluent toxicity testing began as a self-monitoring tool; however NPDES permits for MCES treatment plants have required toxicity testing since 1988.
• Effluent toxicity testing, physical/chemical - Physical and chemical monitoring of wastewater treatment plant effluents is conducted concurrently with biological toxicity testing, to characterize levels of toxic substances in the effluents, and to identify those substances that may be causing any biological effects evident during toxicity testing. Physical and chemical effluent analyses include: temperature, dissolved oxygen, pH, specific conductance, alkalinity, hardness, ammonia, metals, and organic compounds.
• Effluent suspended sediment toxics monitoring – Monitoring of toxics associated with the suspended sediment in Metro Plant effluent has been conducted since 1990, as required by the Metro Plant NPDES permit. Ninety-day composite samples are collected quarterly in the Metro Plant effluent channel and at an upstream control site in the Mississippi River. The suspended sediment samples are analyzed for 36 contaminants of interest, including 7 metals and 25 pesticides, 7 of which are various aroclors of polychlorinated biphenyl (PCB).
Data management and assessment
In support of the Water Monitoring Programs summarized above, the Environmental Monitoring and Water Resources Assessment Sections manage water data and information via the MCES Environmental Information Management System, interpret and report water quality data and information, conduct water quality modeling to support MCES facility planning, participate in local, state, and federal water resource planning and management efforts, and provide assistance with public education and community outreach efforts.
In 2011, MCES began partnering with the MPCA and MDNR on use of the AQUARIUS time-series database.
2.5.d U.S. Geological Survey surface water quality monitoring activities The USGS conducts a variety of surface water and groundwater monitoring activities in the state. Many of its activities and investigations are conducted in cooperation with other organizations that support the work of those agencies. As an example, USGS flow gaging work on major rivers is used by a variety of federal, state and local agencies, including the MPCA. The USGS is also a key partner on several of the special studies monitoring projects initiated by the MPCA. Below is a brief description of the various USGS surface water and surface water/groundwater monitoring projects that are recent/currently underway. More information on the Minnesota office of USGS can be found at: http://mn.water.usgs.gov/index.html

Minnesota’s Water Quality Monitoring Strategy 2011-2012 • September 2011 Minnesota Pollution Control Agency
61
U.S. Geological Survey surface water quality monitoring projects
• Lake septic discharge (MPCA, LCCMR, St Cloud State University)
The project quantifies the occurrence of estrogenic or pharmaceutical compounds in Minnesota lakes that receive groundwater inputs from septic systems. In addition, the project assesses the hydrology and ecology of the watershed contributing to water or sediment concentrations of estrogenic and pharmaceutical compounds in the surveyed lakes as well as the biological exposure and response to known estrogenic and pharmaceutical compound contamination in lakes.
Dates: July 1, 2010 - June 30, 2013
• Kabetogama-Namakan streamflow (National Park Service)
Objectives are to collect nutrient and cyanobacterial samples and measure streamflow between two lakes in Voyageurs National Park-- Namakan and Kabetogama. The narrows between Namakan and Kabetogama is a hydrologically complex where water flows in both directions. This prohibits the use of traditional streamflow methods. The newer technology, along with the collection of nutrient and cyanobacterial samples, are being used in order to determine the timing, direction, and rate of water flow, and to better define the effects of nutrients and algal blooms on the water resources of the Park as well as to clarify the effects of changes in reservoir operation.
Dates: October 1, 2011 - September 30, 2013
• Potential benefits of perpetual easements on phosphorus reduction (West Fork Beaver Creek) (Board of Water and Soil Resource and LCCMR)
This study examines whether the age of land retirement is related to changes in total phosphorus concentrations in the West Fork Beaver Creek watershed. Water samples will be collected. Statistical analyses will include Hawk Creek Watershed Project data and USGS data.
Dates: October 1, 2011 - September 30, 2013
• Endocrine active chemicals/pharmaceuticals in Minnesota wastewaters and surface waters (MPCA, St. Cloud State University, St. Thomas University)
This study examines the occurrence of selected organic and inorganic chemicals in wastewater effluent and surface waters. Pharmaceuticals and endocrine active chemicals enter surface water from point and nonpoint sources including wastewater treatment plant (WWTP) discharges, land application of biosolids, and agriculture. These chemicals are widely used in domestic, commercial, and agricultural practices, and are commonly detected in surface waters. To evaluate the relative effect of WWTP effluent loading relative to nonpoint sources, a statewide study is being conducted in streams of differing environmental settings. Each field site consisted of a location upstream of the WWTP discharge, the WWTP effluent, and downstream of the WWTP discharge.
Dates: September 2009 - December 2010
• Lake endocrine disruption
The study assesses vulnerability of lake-fish communities to endocrine disruption from water and sediment using pond mesocosms. Adult fathead minnows are introduced into mesocosm tanks and allowed to spawn. Experimental exposures to 17-beta estradiol are conducted for adults and fry. Physical and chemical are collected weekly. Water samples from the mesocosm tanks and the
Minnesota’s Water Quality Monitoring Strategy 2011-2012 • September 2011 Minnesota Pollution Control Agency
62
feedstock tanks are collected and analyzed for 17-beta estradiol. Significant differences are maintained between controls and treatment doses. Physical and chemical data are collected from the mesocosm treatment tanks.
Dates: July 1, 2009 - June 30, 2013
• Presence of selected endocrine active chemicals and pharmaceuticals in water and sediment from the St. Louis River, St. Louis Bay, and Superior Bay (MPCA and Wisconsin MDNR)
This project seeks to identify the extent to which pharmaceuticals, including hormones and other wastewater compounds, occur in the St. Louis River, St. Louis Bay, and Superior Bay and to what extent the compounds may have accumulated in surface sediments of the study area. Sampling is being conducted at 30 sites and is being submitted for laboratory analyses.
Dates: October 1, 2011 - September 30, 2012
U.S. Geological Survey surface water monitoring projects
• Stream gaging network
The USGS operates approximately 90 continuous streamflow, 13 river stage, 14 lake stage, and 83 crest-stage gaging stations in Minnesota through cooperative agreements with state, federal, land ocal agencies. Two new gages were installed in the Kawishiwi River Basin as part of Federal Energy Regulatory Commission requirements.
Dates: On-going
• Stream quality (Elm Creek Water Management Organization)
Elm Creek water-quality monitoring is being conducted in the northwest metro (USGS). Manual and automated samples are collected during runoff and approximately monthly for analysis of nutrients, total and volatile suspended solids, and chloride. These data and stream flow have been collected since 1988.
Dates: On-going
• Stream sediment (MPCA)
Suspended-sediment monitoring at the Minnesota River at Mankato (USGS, MPCA) has been conducted since 1967. Data are used to determine daily suspended-sediment loads in the Minnesota River.
Dates: On-going
• Sediment transport at selected sites--South Branch of the Wild Rice River, Northwest Minnesota (Wild Rice Watershed District)
Sediment data are collected and include streamflow, bed load, cross-sectional suspended sediment concentrations, turbidity, and water transparency at selected sites in the Wild Rice River Basin. The sites include: (1) Wild Rice River near Twin Valley, (2) Wild Rice River near Ada, (3) Wild Rice River at Hendrum, (4) South Branch Wild Rice River at Ulen, and (5) South Branch Wild Rice River at County Road 27 near Felton. Four bed load samples were collected from monitoring sites at Ada and Felton. Results were presented at the Federal Interagency Sediment Conference.
Dates: November 2006 – September 2011

Minnesota’s Water Quality Monitoring Strategy 2011-2012 • September 2011 Minnesota Pollution Control Agency
63
• Statewide Sediment Network (MPCA)
The objectives of this study are to 1) collect site-specific streamflow, cross-sectional suspended sediment concentrations (SSC) data and point samples of SSC, turbidity, and water transparency at selected stream sites in Minnesota, 2) provide online web-based real-time continuous turbidity measurements at three sites (Zumbro River at Kellogg; Des Moines River at Jackson; South Branch Buffalo River near Sabin) and 3) sample, compute, and publish daily suspended sediment load at the USGS stream gage on the Minnesota River at Mankato, Minnesota (station ID 05325000). The sites include (1) Knife River near Two Harbors, (2) South Branch Buffalo River at Sabin, (3) Little Fork River near Littlefork, (4) Buffalo Creek near Glencoe, (5) Little Cobb near Beauford, (6) Zumbro River at Kellogg, (7) Des Moines River at Jackson, and (8) Minnesota River at Mankato. The focus is now on the implementation of surrogate technologies using continuous turbidity monitoring to estimate time-series measurements of SSC and suspended-sediment loads for 3 sites.
Dates: March 2007 - September 2011
• Rice Creek Sediment Study (Rice Creek Watershed District)
The objectives of this study are to 1) describe SSC and loads as a function of streamflow and turbidity at the USGS gage site in Mounds View, 2) calculate SSC and loads from continuously monitored turbidity and streamflow, and 3) calculate bedload transport, total sediment loads, and contribution of stream bedload to total sediment load. A continuous turbidity monitor was installed and sampling began at approximately six-week intervals. The focus will be to obtain water samples during the rising limb of the hydrograph.
Dates: March 2010 - September 2012
U.S. Geological Survey surface water quality/ biological monitoring projects
• Amphibian Research and Monitoring Initiative – (Federal Department of Interior, Upper Midwest Region)
This project assesses the status of amphibians in the Upper Midwest and investigates potential causative factors for amphibian declines, and integrates information on hydrologic factors into the interpretation of amphibian population status and trends. Precipitation gages were installed in the Highland Lake District and St. Croix National Scenic Riverway. Groundwater and surface water interaction assessments were conducted at four sites. Surface water and pore-water temperatures were measured at a 65 locations along the perimeter of the four Tamarac National Wildlife Refuge sites. Eighteen pore-water and four surface water samples were collected at the four Tamarac National Wildlife Refuge sites. Temperature and isotope data indicated several locations where groundwater flows into the sites. Water quality data were compared to wetland water level data and amphibian data to gain a better understanding of any relation between amphibian populations and hydrology.
Dates: June, 2000 – On-going
• Mercury bioaccumulation in stream ecosystems (NAWQA mercury topical study)
The objective of this USGS National Water Quality Assessment (NAWQA) project is to determine the effects of source strength, cycling, and food-web interactions (food-web complexity) on bioaccumulation of mercury in fish in stream ecosystems. The team is working on assembling

Minnesota’s Water Quality Monitoring Strategy 2011-2012 • September 2011 Minnesota Pollution Control Agency
64
databases from multiple laboratories, verifying data, and analyzing data in support of publications in preparation. Several papers and journal articles were published or are being prepared.
Dates: May 2001 - September 2012
• Sentinel Lakes (MPCA, MDNR)
This project assesses consequences of changing water quality on deep-water habitat of coldwater fish populations through the use of water quality models. Data are being collected from three lakes. The lakes are monitored for influent and effluent nutrient loads, internal nutrient concentrations, lake levels, and physical and chemical field parameters. Inflows, outflows and ambient lake stations at two depths are sampled monthly for nutrients, major ions, chlorophyll-a, and particulate carbon and nitrogen. Continuous lake level data are recorded using pressure transducers. Continuous water temperature data from thermistors deployed at multiple depths are collected in all three lakes. At each monthly sampling, profile data are collected for dissolved oxygen, pH, temperature, chlorophyll-a in vivo fluorescence, and specific conductance. Data from these multiple sampling efforts are coupled with ambient lake monitoring data collected by the MPCA.
Dates: July 1, 2009 - June 30, 2012
U.S. Geological Survey groundwater/surface water quality monitoring projects
• National Water-Quality Assessment of the Upper Mississippi River Basin
The objectives or this study are to describe the status and trends in the quality of a large representative part of the Upper Mississippi River Basin’s surface and groundwater resources and to provide scientific understanding of the primary natural and human factors affecting the quality of these resources. Water quality sampling was completed approximately monthly intervals at Shingle Creek near Minneapolis. This is a long-term status and tends site for the NAWQA program. Samples were collected for the analysis of nutrients, suspended sediment, chloride, sulfate, and pesticides. Algae, Invertebrates, and fish were collected and habitat characterized during 2010. Stream discharge measurements were continued at this site in addition to two other NAWQA sites (Mississippi River near Hastings, Minnesota and Little Cobb River near Beauford). Progress was made on the Nutrient Enrichment Effects Team reports to describe the temporal patterns in stream nutrients and determine the effects of nutrients on stream biota.
Dates: October 1993 - continuing
• Measurement of lake stage, field water-quality parameter profiles at the outlet of Sturgeon Lake and development of a plan for future hydrologic analyses of the Prairie Island Indian Community, near Welch, Minnesota (Prairie Island Indian Community)
The objective of this project is to collect continuous stage measurements at Sturgeon and Clear Lakes. Continuous water-level, temperature, and rainfall measurements were made in two wells. Depth-integrated field water quality parameters measurements were collected at the outflow of Sturgeon Lake.
Dates: October 2009 – indefinite
• Assessment of groundwater flow conditions in the Stoney Brook Watershed, Fond du Lac Reservation, Minnesota (Fond du Lac Reservation)
This project assesses groundwater resources and how these resources affect drainage through the judicial ditch system in the Stoney Brook watershed. Data from pressure transducers installed in the monitoring wells and precipitation gages were collected and analyzed. Groundwater-level,

Minnesota’s Water Quality Monitoring Strategy 2011-2012 • September 2011 Minnesota Pollution Control Agency
65
open-channel flow, and precipitation data were analyzed to estimate specific yields, groundwater recharge rates, and evapotranspiration rates in the Stoney Brook watershed. Monthly groundwater recharge rates were estimated from changes in groundwater levels in thirteen monitoring wells following recharge events (snowmelt and storms) and baseflow analysis of open-channel flows. Specific yields (ratio of infiltrated precipitation to the height of water-table rise following a precipitation event) were also estimated from changes in groundwater levels in six monitoring wells following precipitation events. Daily evapotranspiration estimates were determined from daily fluctuation in groundwater levels in shallow monitoring wells. These hydrologic parameter estimates are used in surface-water models of the watershed to assess flow in ditches in the watershed.
Dates: March 1, 2006 – September 30, 2010
• Assessment of groundwater flow and groundwater and surface water interaction in the Rochester Area, MN (Rochester Public Utilities)
The primary objectives of this study are (1) develop tool(s) to assess ground-water flow conditions in the city of Rochester, MN and (2) evaluate groundwater management scenarios throughout the Rochester Metropolitan Area. Hydrography and stratigraphy for the groundwater-flow and water-use data were compiled. Elevations from the stratigraphy for the model were compared to digital elevation models of the land surface, and corrections are being made to the stratigraphy to match the digital elevation model. The current stratigraphy for the model consists of six layers representing Paleozoic bedrock in the modeling area. Three sites along Silver Creek were located for a bromide injection test. A tracer test was conducted to assess groundwater and surface-water interaction along the creek near the well.
Dates: January 1, 2008 – September 30, 2012
Geographic information systems/surface water
• Basin characteristics (USGS, MDOT, MDNR)
The objective of this project is to create a hydrologically enhanced Digital Elevation Model for use in an automated basin characteristics (drainage area, area of lakes and wetlands, stream length and stream slope) program that will generate 2, 5, 10, 25, 50, and 100 year estimated peak-flows on unregulated streams in Minnesota.
• Stream slope research (USGS, MDOT)
The objective of this project is to analyze differences between the observed method of determining stream slope and an automated method using hydro enhanced digital elevation models. Changes in processing and programming procedures will be evaluated for improvements in slope estimation and compatibility with ArcHydro Data Model and StreamStats web based stream and watershed information.
• National Hydrography Dataset project (USGS, MPCA)
The National Hydrography Dataset (NHD) 1:24,000 (http://nhd.usgs.gov/). This comprehensive set of digital spatial data contains information about surface-water features such as lakes, ponds, streams, rivers, springs and wells. Within the NHD, surface water features are combined to form "reaches," which provide the framework for linking water-related data to the NHD surface water drainage network. These linkages enable the analysis and display of these water-related data in upstream and downstream order.

Minnesota’s Water Quality Monitoring Strategy 2011-2012 • September 2011 Minnesota Pollution Control Agency
66
Section 2.6: Monitoring Quality Assurance Nearly all decisions made to protect, maintain, and improve surface water quality are based on the monitoring data that are collected to assess its condition. For this reason, it is imperative that the MPCA has quality assurance/quality control standards for these data.
The MPCA's quality assurance/quality control coordinators oversee implementation of the agency’s quality assurance/quality control standards. This includes data collection, selection of laboratories, selection of parameters to be measured, the consistency of data analysis and confidence in data quality. In addition, local partners and others, submitting data to the MPCA for use in assessment, are required to submit a Quality Assurance Project/Program Plan, as well as to follow the data collection, management, and reporting requirements specified in the MPCA’s Volunteer Surface Water Monitoring Guide.
The MPCA’s Quality Management Plan was approved by the EPA in 2007. It is being updated for 2012. For monitoring projects, the MPCA and its partners follow the Quality Management Plan in implementing monitoring protocols. The MPCA’s Quality Management Plan is available here: http://www.pca.state.mn.us/index.php/view-document.html?gid=5479
Section 2.7: Data Management The monitoring data collected by the MPCA and others are stored and made available to scientists, citizens, and other interested parties in a variety of ways. This section describes the primary data storage repositories where water quality monitoring data are stored.
STORET and EQuIS STORET (short for STOrage and RETrieval) is the EPA repository for water quality, biological and physical data. Until fall 2009, STORET was supported and maintained by EPA and used by Minnesota, as well as many other state environmental agencies to contain raw biological, chemical, and physical data on surface and groundwater collected by federal, state and local agencies, Indian tribes, volunteer groups, academics and others. The EPA continues to provide a national warehouse for water quality data, but is no longer supporting the STORET database. Consequently, the MPCA selected a new water quality data management system to fully support Minnesota’s needs. The planning process for selecting a new system included meeting with internal and external stakeholders to obtain input on potential enhancements and improvements that could be considered in a new database.
The MPCA selected a commercial software product called EQuIS, http://www.earthsoft.com/, to be the new database management system to replace STORET. Implementation of EQuIS is ongoing. More information about STORET is available here: http://www.pca.state.mn.us/index.php/water/water-monitoring-and-reporting/equis/equis-program-and-surface-water-data.html For more information about the transition from STORET to EQuIS, see: www.pca.state.mn.us/index.php/water/water-monitoring-and-reporting/storet/storet-redesign.html.

Minnesota’s Water Quality Monitoring Strategy 2011-2012 • September 2011 Minnesota Pollution Control Agency
67
HYDSTRA and AQUARIUS Stream flow data are continuously collected from stations located at the outlets of each of the 81 major watersheds (8-digit HUCs). Stream flow is also collected from many of the intermediate watersheds. These time-series data are stored, managed and made available to agency staff, partners and citizens in HYDSTRA, a unique database and processing software package. The MPCA and MDNR are partners in operating and maintaining the HYDSTRA system.
HYDSTRA is a collection of database management tools and hydrologic software packages which allows users to store and organize historical data, graphically analyze and edit hydrologic data, store and access digital photos, maps and other documents associated with stream files. HYDSTRA also offers various output formats, both graphical and tabular, to share stream data with others.
Stream flow, and flood forecast/warning system gage data are automatically downloaded into HYDSTRA via telemetry. Stream flow and stage data collected at MDNR Waters' special project sites or reported to MDNR Waters by hydropower facility operators are also stored in HYDSTRA. Stream flow and flood warning gage data can be accessed at the MDNR/MPCA Cooperative Stream Gaging website at: www.MDNR.state.mn.us/waters/csg/index.html.
The MDNR and MPCA are currently in the process of replacing HYDSTRA with a system called AQUARIUS. This replacement time-series database system will be built on a modern platform which will be less complicated and easier to learn and use. The new system will allow for better user control, provide better security, and be more accessible to external data users.
Access database for biological data The MPCA uses a custom, in-house Access™ database to store the fish and invertebrate data collected from Minnesota’s streams, lakes and wetlands. The chemical data collected at the time of biological sample collection are also stored in this database.
The MPCA and MDNR are coordinating to ensure that the database each agency uses to store information on biological samples allows for data sharing.
Section 2.8: Data Analysis This section contains a description of the principal data analysis activities conducted by the MPCA. These include comparison of monitoring data against standards; calculation of water quality trends; and calculation of loads.
2.8.a Comparison to standards (305b/303d) Through the integrated 305(b)/303(d) process, Minnesota assesses water quality monitoring data and compares them against state water quality standards to ensure that the state’s waters are able to support aquatic life, aquatic consumption, and aquatic recreation uses.
Minnesota uses all available data to conduct the integrated 305(b)/303(d) process; this includes data collected by the MPCA, and data collected by other governmental agencies and local partners. The data must be collected within the 10-year period preceding the assessment year to be valid for assessment purposes. Figure 10 illustrates the data and considerations that are part of the assessment process.

Figure 10. Data used in Minnesota’s assessment process
Minnesota’s Water Quality Monitoring Strategy 2011-2012 • September 2011 Minnesota Pollution Control Agency
68
The formal process the MPCA followed to conduct water quality assessments through the 2010 305b/303d List is documented in the Guidance Manual for Assessing the Quality of Minnesota Surface Water http://www.pca.state.mn.us/index.php/view-document.html?gid=7165. Currently, the MPCA is fine tuning a re-designed assessment process that will be fully implemented for the 2012 305b/303d List. The re-designed assessment process is a consequence of the MPCA’s adoption of the watershed approach; it became clear soon after adopting this approach that the MPCA’s statewide assessment process had to change. One important reason was the greatly increased volume of data that were generated using the intensive watershed monitoring design (Figure 11); a more fundamental reason was that many of the benefits of the watershed approach could not be realized unless the assessment process focused on the eight or so watersheds for which intensive watershed monitoring is completed each year.
Key aspects of the re-designed assessment process include creation of a Watershed Assessment Team (WAT) for each watershed. The WAT, consisting of fish and invertebrate biologists, stream and lake chemists, and the watershed project manager, performs most of the data review and analysis necessary to evaluate the condition of the watershed and determine the existence of any impairments.
Analysis Listing Data Collection meeting Data Requirements
Remote Sensing data
• # of samples • How collected and
analyzed • Provided to MPCA
• Compare to standards/criteria for designated uses
• Natural occurrences
• Unusual flow conditions
• Double check for methods
• Timing of exceedances and knowledge of activities in watersheds
MPCA Intensive Watershed Monitoring (streams, lakes and wetlands) Other
monitoring organizations’ data (USGS, Met Council, etc.)
citizen monitoring, local partner monitoring (grants or contracts) funds)

Figure 11. Quantity of assessable water quality monitoring data by year
Assessable Data
0
100000
200000
300000
400000
500000
600000
700000
2000 2002 2004 2006 2008 2010
Assessment Year
Dat
a C
ount
Minnesota’s Water Quality Monitoring Strategy 2011-2012 • September 2011 Minnesota Pollution Control Agency
69
AssessableData
In the re-designed assessment process, the first step is to review the results of an “automated” pre-assessment of all available chemical and biological data for the watershed. The pre-assessment is a computerized screening of the data that identifies waterbodies meeting minimum data requirements, and having appropriate periods of record. For this step, the WAT members review the data from their area of expertise; for example the fish biologists review fish data, stream chemists review stream data, etc. The WAT members conduct this step individually at their desks (the “desktop review”) and consider a wide range of factors that can affect water quality and use-impairment. For example, WAT members may consider:
• the quality and quantity of all available data • the magnitude, duration and frequency of exceedances • timing of exceedances • naturally occurring conditions that affect pollutant concentrations and toxicity • weather and flow conditions • Cconsistency of the preliminary assessment with information on other numeric or narrative water
quality standards • known influences on water quality in the watershed • any changes in the watershed that have affected water quality
When each WAT member has completed the desktop review of the data they are responsible for, the comprehensive watershed assessment meeting is held. During this meeting, the WAT reviews the data from the watershed as a group, focusing in particular on areas where data are not consistent or questions are raised. Additional MPCA staff, such as stressor ID staff, wetland scientists, and others with knowledge of or interest in the watershed, may also attend the comprehensive watershed assessment

Minnesota’s Water Quality Monitoring Strategy 2011-2012 • September 2011 Minnesota Pollution Control Agency
70
meeting. Based on all relevant information, considered together and in the appropriate context, the WAT makes impairment decisions for lakes and streams in the watershed regarding each beneficial use for which data are available.
The decisions made by the WAT in the comprehensive watershed assessment meeting are subsequently presented at the professional judgment team (PJT) meeting. This meeting includes the WAT and sometimes additional MPCA staff, as well as local resource managers that work in or have authority within the watershed. The purpose of the PJT is to share the results of the watershed assessment process with knowledgeable local experts prior to finalizing these decisions. This enables the MPCA to share and discuss decisions, and also provides local resource managers with the opportunity to provide any special knowledge they may have of developments or activities within the watershed that should be taken into account.
The MPCA assembles and chairs the PJT meetings, and takes responsibility for all WAT decisions regarding impairment. While consensus of opinion on impairment decisions is the goal and is normally achieved, if consensus cannot be obtained, the MPCA will make the final decision. All professional judgment decisions are recorded on an Assessment Data and Process Document Transparency Form.
Note that there are a few uses and water body types for which Minnesota undertakes only limited assessments; these include surface water protected for drinking water, aquatic life use support for lakes, and wetlands. The reasons for this are described below.
Drinking water: The MPCA assesses surface waters that are protected for drinking water for nitrates. The MPCA made this policy change in 2008 because of longstanding concerns about elevated nitrate concentrations in drinking water in the southeast portion of the state. This is the only drinking water based standard for which the MPCA assesses surface water protected for drinking water.
Note that many pollutants monitored by the MPCA in surface water are not relevant to drinking water intended for people (e.g. dissolved oxygen, ammonia). In addition, the aquatic life standards for many pollutants are typically more stringent than the corresponding human health-based drinking water standards (e.g. mercury and other metals).
Aquatic life standards for lakes: Good metrics to assess aquatic life use support for lakes in Minnesota do not currently exist. Existing DO standards are not particularly useful for this purpose as lakes routinely exhibit a range of DO concentrations over depth (from surface to bottom) during stratification. While nutrients such as phosphorus certainly can affect aquatic life, the MPCA’s phosphorus standard for lakes is currently based primarily on aquatic recreation use support (though aquatic life uses were considered in development of the nutrient standards). With regard to IBIs for fish in lakes, fish stocking poses problems since the species stocked may not be native to that particular lake and the water quality and habitat may be only marginally suitable for the species (e.g., walleye stocking) or some of the species may not naturally reproduce in the lake in which they are placed (e.g. stream trout).
The MPCA is closely monitoring the MDNR’s development of fish and plant IBIs for lakes and the University of Minnesota’s algal IBI development work for potential use in assessments in the future. (Note that the MPCA does include chlorophyll-a - a measure of primary productivity-, and semi-qualitative assessments of algal forms in our individual lake assessments.)
Wetlands: At this time, the MPCA does not routinely monitor wetlands for the purpose of assessment, except for wetlands that are connected to or strongly affect an adjacent or nearby impaired water body. As described in previous sections, the MPCA has been developing protocols and tools for

Minnesota’s Water Quality Monitoring Strategy 2011-2012 • September 2011 Minnesota Pollution Control Agency
71
assessing wetland quality for the past several years; the MPCA anticipates conducting a pilot project to evaluate the use of one or more of these protocols to define broad scale wetland condition as part of the watershed approach in 2013.
A detailed description of the MPCA’s assessment process can be found in the MPCA’s Guidance Manual for Assessing the Quality of Minnesota Surface Water http://www.pca.state.mn.us/index.php/view-document.html?gid=7165.
2.8.b Evaluation of water quality trends The MPCA evaluates water quality trends in Minnesota’s surface waters through two different efforts: 1) analysis of data from a number of specifically chosen, long-term monitoring sites from across the state, and 2) analysis of the large quantities of data collected by volunteers through the Citizen Lake Monitoring Program (CLMP) and the Citizen Stream Monitoring Program (CSMP).
As part of the first effort, through the Minnesota Milestone Program, MPCA staff monitored a set of 80 designated stream sites throughout the state, beginning as early as 1953. The resulting data have been used to analyze trends in levels of BOD, TSS, fecal coliform bacteria, ammonia, total phosphorus, and nitrite/nitrate; the Milestone data have been important in developing an understanding of the overall health and long-term water quality trends of Minnesota’s rivers. At the end of the 2010 field monitoring season, the Milestone Program was discontinued. Establishment of the MWLM network has provided a well-distributed set of monitoring sites from which data will be collected on an on-going basis; the load monitoring stations will now be used to provide information about long-term water quality trends in Minnesota, discussed more below. In addition, the recently established (2008) Sentinel Lakes monitoring program will provide a body of data similar to that provided by MWLM that can be used to calculate trends over time in lakes.
More information about the Milestone Program and the trends that have been identified using these long-term data is available at: http://www.pca.state.mn.us/index.php/water/water-types-and-programs/surface-water/streams-and-rivers/minnesota-milestone-river-monitoring-program.html?menuid=&missing=0&redirect=1 .
For the second effort, the MPCA uses lake and stream water clarity data collected by citizen volunteers across the state. Lake transparency is monitored using Secchi discs; stream transparency is monitored using a transparency tube. More information about the measurements and methods used to calculate transparency and trends are provided below.
2.8.b.1 Lake transparency trends
Secchi transparency is a low-cost water quality indicator that is easily collected by volunteers and has a long history of use on many Minnesota lakes. For most lakes in Minnesota, Secchi transparency provides an indirect measure of the amount of algae in the water, which is related to the lake’s trophic status (nutrient richness), a rough measure of water quality. For these reasons, the MPCA annually analyzes its Secchi transparency dataset to determine trends in lake water quality over time.
The statistical trend analysis performed by the MPCA requires that a lake have a minimum of eight years of Secchi disc data collected between May and September. Lake transparency may vary from year to year in response to changes in rainfall amounts, watershed runoff and many other factors. Using datasets with more than eight years of data help to account for these factors.

Minnesota’s Water Quality Monitoring Strategy 2011-2012 • September 2011 Minnesota Pollution Control Agency
72
All available Secchi transparency data from the MPCA’s water quality database are used in the annual assessments. The majority of these data are collected by the hundreds of volunteers in the MPCA’s CLMP.
To determine water quality trends, the MPCA uses a seasonal Kendall statistical test on lakes with 8 or more years of data and 25 or more comparable season-year pairs. A probability (p) level of p ≤ 0.1 is used, which yields a 10 percent chance of identifying a trend where one does not exist.
2.8.b.2 Stream transparency trends
Like Secchi transparency in lakes, stream transparency is a low-cost water quality indicator that is easily collected by volunteers. Stream transparency is an indirect measure of the amount of dissolved and suspended materials present in water. For most streams in Minnesota, the amount of solids suspended in the water is the most important factor: the more suspended materials, the lower the water transparency. In streams and rivers, soil particles (predominantly silts and clays) have the strongest influence on transparency, as water flows downstream, carrying and depositing this sediment. Too much sediment in the water is a significant pollutant itself, whether it is suspended in the water column or deposited on stream bottoms. Suspended sediment reduces light penetration, which is needed for the growth of beneficial aquatic plants. It also interferes with the ability of fish to see and capture their prey. For these reasons, the MPCA recently initiated an annual analysis of its stream transparency dataset to determine trends in stream water quality over time.
Stream transparency may vary from year to year in response to changes in rainfall amounts, watershed runoff, and other factors. To account for this year to year variability and detect real trends over time, the statistical trend analysis performed by the MPCA requires that a stream site has a minimum of 8 years of transparency tube data collected between April and September.
All available transparency tube data from the MPCA’s water quality database are used in the annual trend analysis. The majority of these data are collected by volunteers in the MPCA’s CSMP.
To determine stream water quality trends, the MPCA uses a seasonal Kendall statistical test on streams with 8 or more years of data and 25 or more comparable season-year pairs. In addition to stream transparency, observed stream stage estimates are used when enough observations are available to meet the above data threshold. A probability (p) level of p ≤ 0.1 is used, which yields a 10 percent chance of identifying a trend where one does not exist. The first set of results using this method will be produced during spring 2011 on data collected through 2010.
2.8.b.3 Calculating loadings of nutrients and solids
Problem investigation monitoring through MPCA administered Clean Water Partnership projects and TMDL studies, and through the MPCA’s MWLMN, use a regression approach to computing pollutant loads. Regression approaches develop one or more relationships between concentration and flow based on collected samples, then use the relationship(s) to estimate representative concentrations for the days not sampled. MPCA uses FLUX32, an interactive program originally developed by Dr. Bill Walker and the U.S. Army Corps of Engineers (USACE) and recently upgraded to a Windows platform by the MPCA and USACE, for estimating the loadings of nutrients or other water quality components passing a tributary sampling station over a given period of time. These estimates can be used in formulating nutrient balances over annual or seasonal averaging periods. Data requirements include: 1) grab-sample nutrient concentrations and associated discharge, and 2) a complete flow record for the period of interest (mean daily flows).

Minnesota’s Water Quality Monitoring Strategy 2011-2012 • September 2011 Minnesota Pollution Control Agency
73
Flow is usually determined by routinely measuring the stage, or water height, while simultaneously measuring discharge over a wide range of flow conditions. A rating curve [mathematical equation(s)] is then computed to convert stage to discharge. Once a gaging station is established, stage measurements are made using automatic equipment and converted to flow by computer programs. However, flow measurements continue to be taken every four to five weeks to verify the integrity of the curve and to account for shifts in the curve (i.e. due to deposition or scour of bed material) that occur over time.
Fifteen to thirty five mid-stream grab samples are collected per site per year depending on stream type, condition and season length, with sampling frequency greatest during periods of moderate to high flow. Because positive correlations between concentration and flow exist for many of the monitored analytes, computation of accurate load estimates requires frequent sampling during major runoff events to characterize shifting concentration/flow relationships and between storm differences that may occur in these relationships. Low flow periods are also sampled and are well represented, but sampling frequency tends to be less as concentrations are generally more stable when compared to periods of elevated flow. Despite discharge related differences in sample collection frequency, this staggered approach to sampling generally results in samples being well distributed over the entire range of flows.
Using six calculation techniques, FLUX maps the flow/concentration relationship developed from the sample record onto the entire flow record to calculate total mass discharge and associated error statistics. An option to stratify the data into groups based upon flow, date, and/or season is also included.
Section 2.9: Data Reporting The monitoring data collected by the MPCA and others are stored and made available to scientists, citizens, and other interested parties in a variety of ways.
Environmental Data Access Easily accessible monitoring data help Minnesotans play an active role in protecting and improving their environment. The MPCA’s Environmental Data Access (EDA) system, available since 2003, allows users to view and download environmental data that are collected and stored by the agency and its partner organizations. The interactive, web-based system includes a web map where monitoring locations are displayed geographically. Originally, EDA contained surface water, groundwater and air quality data. In mid-2011, the scope of EDA was expanded to include all environmental data available on the MPCA website, and EDA was given a more prominent position on the MPCA homepage. This step was initiated as a part of the Watershed Data Integration Project, described below in Section 2.12.A.
The EDA's surface water section displays data from surface water monitoring sites located around Minnesota using either a map-based or text-based search. Using the map-based search, you can also view the conditions of lakes, rivers or streams that have had their water quality assessed.
Using EDA’s tools, users can:
• quickly access statewide water quality data on a site-by-site basis • display site-specific data by specifying the name of a lake, river, or other related location • view the degree of impairment and how impairment affects recreation, aquatic life, and drinking
water

Minnesota’s Water Quality Monitoring Strategy 2011-2012 • September 2011 Minnesota Pollution Control Agency
74
More than a dozen local, state and federal organizations have collected the data that are available through the EDA's surface water section. All data included are thoroughly quality assured before they are made available on the site. The data webpage was designed with considerable input from MPCA’s monitoring partner stakeholders (local government and citizen monitoring groups). As a result, the webpage addresses the most critical information need identified by those stakeholders – making the MPCA’s data accessible. More information about EDA, and a link to the EDA system, can be found here: www.pca.state.mn.us/eda.
Watershed webpages In August 2011, the MPCA launched a new, interactive feature on its website that uses an interactive map to help users identify the watershed they live or play in. Once located, users will have access to information about the watershed, including data from water bodies in it, lists of projects planned or underway, MPCA or partner contacts, and a host of other watershed-specific details. The watershed pages can be accessed here: http://www.pca.state.mn.us/index.php/water/types-and-programs/watersheds/map.html.
Prepared reports Currently, much of the MPCA’s data reporting occurs through the preparation of reports that provide context and interpretation of the monitoring data that have been collected; most of these reports are available via the MPCA’s website.
These reports fulfill a range of purposes. They include Major Watershed Assessment reports, lake assessment reports, special study reports, technical reports, newsletters, legislative reports, and EPA-required reports. The following paragraphs highlight some of the monitoring data-based, surface water quality reports prepared by the MPCA, with web links where they are available.
Continuing Planning Process Report is a report states are required to prepare under Section 303(e) of the Clean Water Act to describe the processes and procedures they will use in their water quality planning activities in order to carry out the requirements of the CWA. The MPCA updated its CPP in 2010 to incorporate the watershed approach, and it was approved by EPA in early 2011: http://www.pca.state.mn.us/index.php/view-document.html?gid=15647
Major watershed assessment reports: Major watershed assessment reports are prepared for each major (8-digit HUC) watershed when the two years of intensive watershed monitoring (years 1 and 2 of the 10-year cycle) are complete and the data have been assessed. These reports are designed to provide a summary of all relevant data from the major watersheds for use in stressor ID work and watershed protection and restoration strategy development. The MPCA began issuing these reports in mid-2011. They can be accessed through the watershed webpages.
Lake assessment reports: Under the watershed approach, lakes are now assessed as part of the major watershed in which they are located and the lake assessment results are provided in the major watershed assessment reports (above). The lake information is limited primarily to lake chemistry, because of space constraints created by the need to cover all water resources within the specific watershed. Since the MPCA has historically prepared in-depth individual lake assessment reports, the MPCA is currently preparing supplemental, lake-focused assessment reports for the major watersheds

Minnesota’s Water Quality Monitoring Strategy 2011-2012 • September 2011 Minnesota Pollution Control Agency
75
that include the broader set of information the MPCA has traditionally provided, including information on lake morphometry, trophic status and trend analysis, if available. An example of this report is available here: http://www.pca.state.mn.us/index.php/view-document.html?gid=15462 . Lake Assessment Reports for the past several years are available on the MPCA’s website: http://www.pca.state.mn.us/index.php/water/water-types-and-programs/surface-water/lakes/lake-water-quality/lake-water-quality.html?menuid=&redirect=1.
The MPCA participates in EPA’s National Aquatic Resource Surveys (NARS). Information on the NARS National Lakes Assessment as well as the results from the Minnesota enhancement of the 2007 NLA that examine statewide patterns in various chemical, physical and biological parameters can be found at http://www.pca.state.mn.us/index.php/water/water-types-and-programs/surface-water/lakes/lake-water-quality/national-lakes-assessment-project-nlap.html. Information from the other NARS (i.e., 2010 flowing waters, 2011 wetlands) will be posted on the MPCA’s website, together with results from the broader, state based surveys conducted at the same time, as they become available.
Annual reports of the Citizen Lake Monitoring Program and Citizen Stream Monitoring Program on the transparency of Minnesota lakes and streams: The reports are distributed to monitoring partners, citizen participants, local officials, etc. and are also available on the agency’s website at: for CLMP: http://www.pca.state.mn.us/index.php/view-document.html?gid=13769; for CSMP: http://www.pca.state.mn.us/index.php/view-document.html?gid=14037. In the past, the MPCA provided hard-copy reports on water quality to its citizen volunteers for the specific sites/water bodies that they monitor. The MPCA is currently developing a web interface where the volunteers as well as the general public can access this information on-line; the webpage is scheduled to be functional in 2012. In addition, the MPCA has prepared periodic newsletters for citizen volunteers (the Secchi Reader Newsletter for CLMP and the Stream Reader for CSMP); as of 2011, the newsletters will be combined into one newsletter called the Transparency Times. The MPCA also produces a biennial report on citizen water monitoring for the Minnesota legislature. The most recent report is found at: http://www.pca.state.mn.us/index.php/component/option,com_docman/task,doc_view/gid,15392
Minnesota Water Quality, Surface Water Section: Report to the Congress of the United States: The MPCA began providing the Water Quality Integrated Report to the EPA in 2004. This report combines the requirements of Sections 305(b) and 303(d) through a biennially (even years) electronic report accompanied by an abbreviated narrative report. The report and list are submitted to EPA in April of even-numbered years. The most recent report is available here: http://www.pca.state.mn.us/index.php/view-document.html?gid=5968
Watershed Achievements Report, annual report to the U.S. Environmental Protection Agency on Clean Water Act Section 319 and Clean Water Partnership projects in Minnesota, describes Minnesota’s efforts to protect, maintain and improve the state’s waters by reducing nonpoint source water pollution. The report is submitted annually to EPA and is excerpted as needed for use in providing information to Minnesota’s legislature and other decision-making bodies. http://www.pca.state.mn.us/index.php/view-document.html?gid=14224
Legislative reports include reports of special studies, such as the recently completed Wastewater Treatment Plant Endocrine Disrupting Chemical Monitoring Study http://www.pca.state.mn.us/index.php/view-document.html?gid=15610, as well as mandated reports the MPCA prepares for the Minnesota Environmental Quality Board (EQB) in support of long term

Minnesota’s Water Quality Monitoring Strategy 2011-2012 • September 2011 Minnesota Pollution Control Agency
76
planning, such as the Biennial Assessment of Water Quality Degradation Trends and Prevention Efforts, which is available in the Appendix of the Minnesota State Water Plan http://www.eqb.state.mn.us/documents/2010_Minnesota_Water_Plan.pdf
A variety of fact sheets, guidance documents, technical reports, and other publications relating to water are available on the MPCA’s website: http://www.pca.state.mn.us/index.php/water/water-publications/water-publications.html. These include some of the more recent publications relating to wetland assessment techniques, such as Floristic Quality Assessment for Minnesota Wetlands, and also this older but well used guide for Citizen Volunteers: http://www.pca.state.mn.us/index.php/water/water-monitoring-and-reporting/volunteer-water-monitoring/volunteer-surface-water-monitoring-guide.html?menuid=&redirect=1.
Aimed at scientific and technical audiences, the MPCA periodically publishes its Environmental Bulletin series. This series is designed to highlight environmental outcomes and results of scientific studies the MPCA and its partners conduct in air, water and waste management. The two most recent Bulletins have focused on water-related issues: Development of Fish Consumption Rates for Children, and Blue-green Algal Toxin (Microcystin) Levels in Minnesota Lakes. http://www.pca.state.mn.us/index.php/about-mpca/mpca-publications/environmental-bulletin.html.
Minnesota Nonpoint Source Management Program Plan: A report to EPA required under Section 319 of the Clean Water Act. This report provides information on nonpoint source pollution and strategies for improving water resources; it is updated about every 5 years based on determination of need. The current version is from 2008. http://www.pca.state.mn.us/index.php/water/water-types-and-programs/water-nonpoint-source-issues/minnesota-nonpoint-source-management-program-plan-nsmpp.html?menuid=&redirect=1
Finally, to help guide internal decision making, MPCA’s Environmental Information Report (EIR) contains assessments of a wide variety of environmental stresses facing Minnesota, and identifies and compares their causes, after taking into account current environmental programs. The EIR provides an assessment of confidence in the measurements, as well as an indication of current trends for the various stressors and sources that contribute to environmental risks. The original EIR was completed in 2003 and includes extensive documentation and additional background in nine technical support appendices. The EIR was updated in 2009. The EIR is available on the MPCA’s website at: http://www.pca.state.mn.us/index.php/about-mpca/mpca-overview/agency-strategy/environmental-information-report.html?menuid=&redirect=1
Section 2.10: Programmatic Evaluation The MPCA’s shift to the watershed approach has provided a unifying framework for organizing and refining the water quality monitoring, planning, and implementation activities that are its mission. Just as important, establishment of the Clean Water Fund (CWF) has led to a new level of interagency coordination and cooperation, and a desire on the part of state agencies, citizens and the legislature to ensure the wise and efficient use of the resources provided.
The MPCA has and continues to make extensive use of process mapping, Kaizen events, and other process improvement tools to find more effective ways to conduct its work. These have included creating process maps of the impaired waters listing process and the 305b assessment process; and conducting a Kaizen event around the 305b assessment process.

Minnesota’s Water Quality Monitoring Strategy 2011-2012 • September 2011 Minnesota Pollution Control Agency
77
In January 2011, more than 20 MPCA managers and division directors were involved in a five-day Kaizen event focused on constructing an integrated system for managing the agency’s water programs (i.e. industrial and municipal permitting, stormwater, feedlots, monitoring, TMDLs, etc.) using the watershed approach as the framework.
The objectives of the five-day event were:
• Develop a high level systems map of the current approach and the desired watershed approach.
• Identify (1) gaps, (2) need for coordination, linkages, and handoffs, (3) paths for information and data flow, and (4) key goals, strategies and measures to achieve the desired watershed approach.
After generating a list of more than 17 issues in need of attention, six items were chosen for immediate action. These will be focused on in the FY12-13 biennium:
• better use of monitoring and assessment information to help target agency activities (such as compliance, enforcement, and prevention)
• further clarifying the process, roles and key content for developing strategies for restoration and protection, and implementation plans
• watershed Data Integration (IT project)
• EPA support of and partnership in the watershed approach
• measuring, tracking, and reporting results and outcomes
• communicating progress
The MPCA also conducts annual program assessments as part of its Environmental Performance Partnership Agreement with EPA Region 5 and the MPCA Strategic Plan. Progress with respect to the MPCA Strategic Plan goals and objectives is evaluated each spring with an operational review of the agency’s outputs and program efficiency; and each fall with a strategic review of the agency’s environmental outcomes.
In addition to these internal program evaluations, the state Clean Water Council (CWC) prepares biennial legislative reports that provide information on the activities for which CWF money has been or will be spent for the current biennium, and the activities for which money is recommended to be spent in the next biennium. The biennial report also incorporates an implementation plan that explains Minnesota’s framework for identifying and cleaning up impaired waters, addressing general procedures and timeframes, and establishing priorities. The Legislative Coordinating Committee has established a website via which anyone can search for information about projects on which the CWF monies (as well as other state funds directed towards the environment) are being spent (http://www.legacy.leg.mn/) to provide transparency to Minnesotans.
In support of these efforts, the MPCA and its sister agencies on the Clean Water Fund Interagency Coordination Team have spent several months developing a framework by which the effectiveness of CWF expenditures can be evaluated. The framework is available on the CWF website: http://www.pca.state.mn.us/index.php/view-document.html?gid=15911.

Minnesota’s Water Quality Monitoring Strategy 2011-2012 • September 2011 Minnesota Pollution Control Agency
78
Section 2.11: General Support and Infrastructure Planning As indicated in the 2004 – 2014 Strategy, the MPCA has worked closely with numerous partners, citizens, and the Legislature to develop its current monitoring strategy. Passage of the Clean Water Legacy Act in 2006 and the Constitutional Amendment in 2008 creating the CWF has put Minnesota in an enviable position: because of these landmark events, Minnesota has been able to implement, or is in the process of implementing, a number of the needs identified in the 2004 – 2014 Strategy.
Note that the CWF is intended to provide a long term (25 years) source of sustained funding for restoring and protecting Minnesota’s waters. When passed, it was explicitly stated that these funds are to supplement, not supplant, existing funding for state agencies. It is unclear at this time how budget difficulties at the state and federal levels will affect the MPCA and its partnering agencies.
Table 8 shows the level of funding the MPCA received in the FY10-11 biennium for surface water monitoring. The MPCA has requested a similar amount of funding for FY12-13, and anticipates similar requests into the future to maintain its monitoring activities and programs.
Table 8. MPCA Surface Water Monitoring Budget, Fiscal Years 2010 – 2011 (July 1, 2009, to June 30, 2011)
MPCA Surface Water Monitoring Budget
State Funding $17,169,596
Federal Funding $954,404 Total $18,124,000
2.12.a Identified needs At this time, Minnesota has two needs it considers high priority to continue implementation of its Water Quality Monitoring Strategy. The first centers on making the monitoring and other data collected in support of watershed assessment, protection, and restoration more readily available to water resource professionals and citizens alike. The MPCA is addressing these needs through its Watershed Data Integration Project (WDIP). The second need is more profound and involves the need for continued support and partnership from EPA as Minnesota progresses in its adoption of the watershed approach, implementation of new water quality criteria and standards, and incorporation of biological indicators and Tiered Aquatic Life Use (TALU) into Minnesota’s water quality monitoring and assessment strategy. More information about these needs is provided below.
Watershed Data Integration Project
The watershed management process is inherently data intensive. The MPCA specialists working on each phase of the 10-year cycle generate new data and draw on existing data from the preceding phases. Other organizations participating in the process contribute data at every stage and wish to be informed about progress.
The MPCA’s capabilities for electronic handling and sharing of all these data have not kept pace with the program’s rapid maturation over the last few years. The MPCA has eight separate surface water data systems, with few interconnections among them. Other important data are maintained only in spreadsheets or text files. As a consequence, staff often must spend considerable time piecing

information together from disparate sources, and most data cannot be accessed online by partner organizations and the general public. To address these shortcomings, the MPCA has undertaken a multi-year WDIP (Figure 12).
Figure 12. Phases 1 through 3, MPCA Watershed Data Integration Project
Phase 1, completed in 2009, accomplished two baseline tasks: a business process analysis of the watershed program that developed a business object model, and focus group discussions to identify business and system needs and priorities for improved data management and access. Phase 2, to be completed in mid-2011, will produce three major outcomes that lay the foundation for future progress in the WDIP. These include the following:
An enhanced waterbody inventory: The MPCA’s database of descriptive information on Minnesota’s lakes, wetlands, and river/stream segments has been modified to strengthen its role as the essential linchpin for data integration. Useful new data elements were added and obsolete fields removed, aligning the inventory with current business practices and information needs. The inventory will be relocated to the “core” (enterprise-level) sector of the MPCA’s data architecture, where this critical shared resource will be subject to more stringent data integrity protections. Additionally, the data structure was changed to allow a waterbody to be represented as located in multiple political subdivisions—i.e., it crosses municipality, county, or legislative district lines—allowing more accurate retrieval of the waters (or impairments) within a given jurisdiction.
New web-based data retrievals: Since 2003, the MPCA has provided web-based access to water quality monitoring data via its “Environmental Data Access” webpages. The MPCA is now developing web-based retrieval of other kinds of data to meet common information needs. For example, by mid-2011 visitors to the website will be able to:
• Examine information regarding the MPCA’s assessment of a given waterbody, including the parameters that were evaluated and the assessment team’s comments.
Minnesota’s Water Quality Monitoring Strategy 2011-2012 • September 2011 Minnesota Pollution Control Agency
79

Minnesota’s Water Quality Monitoring Strategy 2011-2012 • September 2011 Minnesota Pollution Control Agency
80
• Search the Impaired Waters List online to determine the impairments in a geographic area and the status of MPCA activities to address them.
• Retrieve lists of MPCA restoration/protection studies (“TMDL projects”), e.g., by geographic area or project status.
Technical vision and phased plan for additional improvements: The MPCA is also preparing a detailed technical vision and a phased development plan for additional work in the WDIP Phase 3 and beyond.
These Phase 2 activities were funded by a legislative appropriation from the CWF. In Phase 3 and succeeding phases, the MPCA will implement numerous data integration and access improvements in accordance with the development plan. Among these:
• A unified watershed data architecture that “pre-integrates” the data from all phases of the watershed management process, dramatically reducing the need for costly ad hoc integrations. The goal is not to create one monolithic system but rather a properly organized and efficient data structure underlying all surface water-related systems, current and future.
• A web-based “virtual central file room” where project participants and the interested public have convenient online access to all of the data and documents associated with each phase of a watershed’s 10-year management cycle.
• Additional web-based data retrievals to meet both internal and external needs.
• MPCA received $2 million from the 2011 Legislature for Phase 3 activities in FY12-13.
Continuing EPA partnership and support
The MPCA has made, and is continuing to make, significant changes to the way it monitors and evaluates the health of Minnesota’s plentiful rivers, lakes, wetlands, and groundwater. Many of these changes were in planning for years prior to a source of stable funding becoming available with passage of the Minnesota Clean Water, Land and Legacy Amendment in 2008, while others are natural adaptations that have developed with implementation of the watershed approach. As the MPCA and its partners endeavor to improve the way we monitor, assess, protect and restore Minnesota’s waters, we need the continued partnership and support of EPA. The MPCA looks forward to future conversations with EPA as we continue to advance the watershed approach, develop and implement river eutrophication criteria and other new standards, incorporate biological indicators into our monitoring and assessment efforts, and develop and implement the TALU framework for assessing rivers and streams.

Minnesota’s Water Quality Monitoring Strategy 2011-2012 • September 2011 Minnesota Pollution Control Agency
81
Section 3: Groundwater

Section 3.1: Minnesota’s Multi-Agency Approach to Monitoring Groundwater The Minnesota Pollution Control Agency (MPCA), Minnesota Department of Agriculture (MDA), and Minnesota Department of Health (MDH) each have important statutory responsibilities in protecting the quality of Minnesota’s groundwater, while the Minnesota Department of Natural Resources (MDNR) is primarily responsible for protecting the quantity of groundwater.
The MPCA and MDA conduct groundwater condition monitoring to assess ambient groundwater quality. The MDH conducts groundwater quality monitoring in order to regulate public and private water supply wells and to evaluate the risk to human health from contaminants in groundwater. Since 2004, the MPCA, MDA, and MDH have coordinated their monitoring activities in accordance with the Integrated Ground Water Monitoring Strategy, which is outlined in a Memorandum of Agreement dated February 11, 2004, (Attachment 2). The primary roles of Minnesota’s state agencies in monitoring groundwater are illustrated in Figure 13 below.
Figure 13. Groundwater monitoring responsibilities of Minnesota state agencies
More recently, the MPCA, MDA, MDH, and MDNR, together with the Metropolitan Council and the Minnesota Board of Soil and Water Resources (BWSR), have coordinated groundwater monitoring and related activities through the Clean Water Fund Interagency Coordination Team (Coordination Team) subteam for groundwater/drinking water, which meets on a monthly basis.
Minnesota’s Water Quality Monitoring Strategy 2011-2012 • September 2011 Minnesota Pollution Control Agency
82

Minnesota’s Water Quality Monitoring Strategy 2011-2012 • September 2011 Minnesota Pollution Control Agency
83
Section 3.2: Condition Monitoring Strategy The MPCA’s condition monitoring strategy for groundwater is based upon its statutory responsibility to protect the quality of Minnesota’s groundwater, as described above. Detailed information concerning the purpose, design and indicators of the agency’s groundwater condition monitoring activity is provided below.
3.2.a Condition monitoring purposes The overarching purpose of Minnesota’s condition monitoring activities is to evaluate the quality of Minnesota’s groundwater resources. These data can also be used to evaluate potential and/or actual threats to groundwater quality and to monitor groundwater quality trends over time. This type of monitoring is commonly referred to as ambient groundwater monitoring, because the monitoring is designed to measure the overall or general quality of the groundwater, not localized pollution sources such as chemical spills or hazardous waste sites.
The MPCA and MDA cooperate to conduct statewide condition monitoring of Minnesota’s groundwater quality in accordance with the 2004 MOA. The agencies divide their groundwater quality monitoring responsibilities as follows: the MPCA conducts condition monitoring to assess non-agricultural contaminants, primarily in urban parts of the state. The MDA conducts condition monitoring to assess agricultural chemicals (e.g. pesticides and fertilizers), primarily in agricultural regions of the state.
Both the MPCA and MDA’s condition monitoring activities target aquifers that are vulnerable to anthropogenic (human - made) contamination. Minnesota has many other aquifers and aquifer systems, however, most are located deep below the land surface, and many are protected by confining beds that retard the flow of groundwater and any associated contamination. These circumstances plus age-dating of groundwater suggests that previous MPCA groundwater quality sampling efforts adequately represents the current quality of these aquifers. For further information, consult the MPCA’s 1998 Baseline Study of groundwater quality in the state’s principal aquifers: http://www.pca.state.mn.us/index.php/water/water-types-and-programs/groundwater/groundwater-monitoring-and-assessment/statewide-baseline-study.html
3.2.b Condition monitoring designs The MPCA’s ambient groundwater condition monitoring focuses on aquifers in urban and undeveloped parts of the state that are vulnerable to anthropogenic contamination. The MPCA monitors the condition in two key aquifers: 1) the Paleozoic-age, Prairie du Chien Jordan formation, an extensive bedrock formation; and 2) the Quaternary age, sand and gravel aquifers. These are the two most heavily used aquifers in the state in terms of the amount of groundwater that is withdrawn to supply water for domestic use and agricultural purposes. The Prairie du Chien-Jordan aquifer consists of the Paleozoic era fractured dolomite of the Prairie du Chien Group and the underlying Jordan sandstone; it is the uppermost geologic unit in the southeastern part of the state, where it is visible in roadcuts, eroded valleys, and quarries (Figure 14). In these areas, soil overlying the aquifers tends to be thin as well as permeable, such that it readily transmits water. The other monitored aquifers, the Quaternary sand and gravel (also known as glacial drift) aquifers, are located across Minnesota but are concentrated in the central part of the state (Figure 15).

Figure 14. Areas where the Prairie du Chien-Jordan is the uppermost bedrock aquifer and locations of well sampled by the MPCA’s ambient groundwater quality monitoring network
Note: [Surficial geology and depth to bedrock data from the Minnesota Geological Survey. Darker areas show where the aquifer
is closer to the land surface].
From 2004 to 2009, the MPCA’s ambient groundwater condition monitoring activities primarily utilized existing wells, both monitoring and low producing domestic wells. This strategy was used to re-start the MPCA’s groundwater condition monitoring activities within budgeted resources and avoid the cost of drilling dedicated monitoring wells. Shallow Quaternary aquifer wells sampled from 2004 to 2009 were randomly selected from a pre-screened pool of approximately 1,000 wells tapping groundwater considered vulnerable to contamination. Similarly, Prairie du Chien-Jordan wells were randomly selected from a pool of approximately 10,000 existing domestic wells located in parts of the aquifer considered susceptible to contamination.
While this approach succeeded in providing a reasonable selection of wells that met the MPCA’s basic criteria for its ambient monitoring project at very low cost, the MPCA’s analysis of the monitoring results in 2009 revealed a number of limitations and deficiencies in the monitoring design and data. For example, sampling existing wells that are mostly privately owned depends on the continued cooperation of the property owner. This cooperative relationship cannot always be maintained, especially when property ownership changes. Furthermore, existing wells are not always in the locations needed to obtain unbiased and representative condition data. Based on this analysis, in 2009, the MPCA requested
Minnesota’s Water Quality Monitoring Strategy 2011-2012 • September 2011 Minnesota Pollution Control Agency
84
Minnesota’s Water Quality Monitoring Strategy 2011-2012 • September 2011 Minnesota Pollution Control Agency
85
and received funds from Minnesota’s newly established CWF to fund installation and sampling permanent monitoring wells; implementation of the new Ambient Groundwater Quality Monitoring Network Improvement Plan began in 2010.
The revised network continues to focus on monitoring the upper parts of the Quaternary sand and gravel and Prairie du Chien-Jordan aquifers. The following paragraphs provide more detail about the revised ambient groundwater quality monitoring network design.
Revised Quaternary sand and gravel aquifer network design
The MPCA commonly refers to its network of Quaternary sand and gravel wells as the “Early Warning Network,” because these wells are designed to monitor the uppermost portion of the aquifers where groundwater is most vulnerable to contamination. The wells provide an early indication of any groundwater contamination that may eventually seep to other underlying aquifers and also any emerging groundwater quality trends, which is important to protection of the state’s groundwater resources.
The Early Warning Network was developed using a random stratified statistical design that discerns the effects of land-use setting and the natural composition of the aquifer on groundwater quality (Figure 16). The Quaternary sand and gravel aquifer composition varies according to the provenance of the glacial materials that formed the particular aquifer. Glacial deposits originating from the northwest typically are carbonaceous, yellow brown to gray in color, and contain shale. In contrast, glacial deposits originating from the northeast generally are siliceous, reddish in color, and do not contain shale (Figure 15). These differences in composition affect the natural water quality of the aquifers and also may affect contaminant attenuation.
As during 2004 – 2009, the Early Warning Network targets four land use/land cover settings: 1) sewered residential areas, 2) unsewered residential areas, 3) commercial/industrial areas, and 4) undeveloped areas. (Agricultural land use is not included since the MDA monitors groundwater quality in agricultural areas.) Wells included in the revised network are required to be located within fairly homogeneous settings in terms of both glacial lobe provenance and land use/land cover.

Figure 15. Quaternary surficial sand and gravel aquifers in Minnesota by composition [Data from the Minnesota Geological Survey. Aquifers composed of materials classified as a mixed origin are not shown].
Minnesota’s Water Quality Monitoring Strategy 2011-2012 • September 2011 Minnesota Pollution Control Agency
86

Figure 16. Random stratified statistical design of the Quaternary sand and gravel aquifer network
The Ambient Groundwater Quality Monitoring Network Improvement Plan requires a total of 200 wells to meet the statistical requirements associated with fully implementing the revised shallow Quaternary aquifer network. This includes 25 wells in each glacial lobe provenance/land use setting combination (Figure 16). The MPCA’s 2009 analysis showed that about 50 of the existing shallow wells are available for sampling and meet the improvement plan criteria, leaving about 150 wells to be installed (Table 9).
Sixty-one new shallow Quaternary wells were installed during 2010-2011; the remaining wells are expected to be installed at the rate of approximately 50 new monitoring wells per year.
Revised Prairie du Chien-Jordan aquifer network design
The revised Prairie du Chien-Jordan aquifer network design expands the geographic coverage to improve regional characterization of water-quality conditions and track trends throughout the area where the aquifer is most susceptible to contamination. The network likely will continue to consist primarily of existing domestic wells, since these wells typically describe water-quality conditions in the upper part of the aquifer.
Minnesota’s Water Quality Monitoring Strategy 2011-2012 • September 2011 Minnesota Pollution Control Agency
87

Minnesota’s Water Quality Monitoring Strategy 2011-2012 • September 2011 Minnesota Pollution Control Agency
88
Table 9. Number of existing and new wells to be installed as part of the MPCA’s revised shallow Quaternary sand and gravel aquifer monitoring well network
Land Use
Glacial Lobe Provenance Calcareous Siliceous
No. of existing wells in network
No. of wells to be installed
No. of existing wells in network
No. of wells to be installed
Sewered Residential 25 0 0 25 Residential on SSTS 5 20 1 24 Commercial/Industrial 6 19 0 25 Undeveloped 15 10 2 23 Total 51 49 3 97
The Ambient Groundwater Quality Monitoring Network Improvement Plan calls for the revised Prairie du Chien-Jordan network to include 53 wells located approximately 10 miles apart in the area targeted for monitoring. Based on the MPCA’s analysis, 42 existing wells meeting the design criteria are available for sampling, leaving just 11 wells to be installed. Funds have not been appropriated for this well installation. These wells likely will be installed through coordinated efforts between the MPCA and MDNR to select well locations that will serve the needs of both agencies, as possible. Installation of new Prairie du Chien –Jordan monitoring wells by the MPCA likely will start upon completion of the shallow Quaternary aquifer network enhancements.
National Groundwater Monitoring Network Pilot Study
Concurrent with planning for implementation of its Ambient Groundwater Quality Monitoring Network Improvement Plan, the MPCA partnered with the MDNR to conduct one of five pilot studies nationally for the National Groundwater Monitoring Network (NGWMN). The purpose of the pilot study was to test the concepts and approaches for a proposed national groundwater monitoring network. A number of wells in the MPCA’s Ambient Groundwater Quality Monitoring Network are candidates for inclusion in the proposed NGWMN. The Minnesota Pilot Study report is available on the MDNR’s website at the following address: http://files.MDNR.state.mn.us/publications/waters/mn_ngwmn_pilot_project_final_report_march_2011.pdf
3.2.c Condition monitoring indicators Groundwater quality samples from the MPCA’s Ambient Groundwater Monitoring Network are collected annually from all network wells. Since the MPCA began implementation of the Ambient Groundwater Quality Monitoring Network Improvement Plan, the samples were analyzed for a wider suite of indicators of natural and anthropogenic contamination than was done previously, as the concentrations of many of these contaminants affect the potability of the water. Prior to the Ambient Groundwater Quality Monitoring Network Improvement Plan, the primary indicators analyzed were chloride, nitrate, and a suite of volatile organic compounds. Unlike surface waters, all groundwater in Minnesota is protected as an actual or potential source of drinking water.
Approximately 100 indicators are analyzed from each sample collected from the network, including nutrients, major ions, metals, and a suite of 68 volatile organic compounds (Tables 10 and 11). Some of these chemicals, such as nitrate, benzene, cadmium, and chloroform, are primary indicators of drinking-water quality and have published health-based guidance. Other indicators are analyzed to facilitate data

Minnesota’s Water Quality Monitoring Strategy 2011-2012 • September 2011 Minnesota Pollution Control Agency
89
interpretations. For example, groundwater sulfate concentrations recently were analyzed as part of the agency’s efforts to review the current standards for surface waters. Water temperature, pH, specific conductance, alkalinity, and dissolved oxygen concentrations also are measured in the field to facilitate the interpretation of these data.
In addition, approximately 40 ambient network wells are sampled each year to determine concentrations of endocrine disrupting compounds, pharmaceuticals, personal care products, fire retardants, detergent breakdown products, hormones and other emerging contaminants of interest. These contaminants are measured in the groundwater to: 1) determine the occurrence and distribution of these contaminants in the groundwater system, 2) quantify any temporal trends in concentrations, and 3) evaluate, in conjunction with other data collected as part of ambient monitoring, the sources of contaminants in the groundwater. This monitoring is part of a larger statewide effort to determine the occurrence and distribution of emerging contaminants in the hydrologic system. Because of the high cost of these analyses, the actual number and plan for sampling the network wells will be modified from year to year based on analysis of the results received.
Table 10. Nutrients, organic carbon, and inorganic constituents analyzed in water samples from the ambient groundwater quality monitoring network
Aluminum Cobalt Organic plus ammonia nitrogen Arsenic Copper Phosphorus Ammonia nitrogen Iron Potassium Barium Lead Silver Beryllium Lithium Sodium Boron Magnesium Strontium Bromide Manganese Sulfate Cadmium Molybdenum Titanium Calcium Nickel Vanadium Chloride Nitrate plus nitrite nitrogen Zinc Chromium Organic carbon
In 2010, water from most of the network wells was also analyzed to determine mercury concentrations. In 2011, water samples from 20 network wells were analyzed for constituents needed to determine the apparent age of the groundwater using the tritium-helium method.
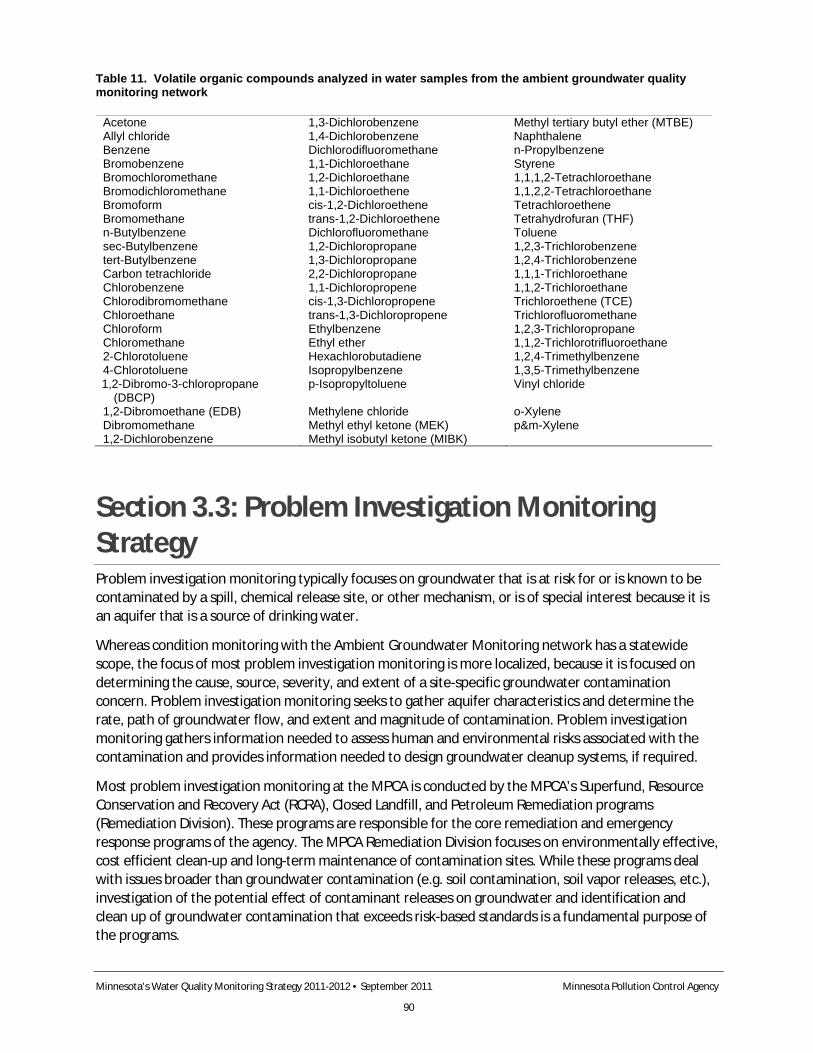
Minnesota’s Water Quality Monitoring Strategy 2011-2012 • September 2011 Minnesota Pollution Control Agency
90
Table 11. Volatile organic compounds analyzed in water samples from the ambient groundwater quality monitoring network
Acetone 1,3-Dichlorobenzene Methyl tertiary butyl ether (MTBE) Allyl chloride 1,4-Dichlorobenzene Naphthalene Benzene Dichlorodifluoromethane n-Propylbenzene Bromobenzene 1,1-Dichloroethane Styrene Bromochloromethane 1,2-Dichloroethane 1,1,1,2-Tetrachloroethane Bromodichloromethane 1,1-Dichloroethene 1,1,2,2-Tetrachloroethane Bromoform cis-1,2-Dichloroethene Tetrachloroethene Bromomethane trans-1,2-Dichloroethene Tetrahydrofuran (THF) n-Butylbenzene Dichlorofluoromethane Toluene sec-Butylbenzene 1,2-Dichloropropane 1,2,3-Trichlorobenzene tert-Butylbenzene 1,3-Dichloropropane 1,2,4-Trichlorobenzene Carbon tetrachloride 2,2-Dichloropropane 1,1,1-Trichloroethane Chlorobenzene 1,1-Dichloropropene 1,1,2-Trichloroethane Chlorodibromomethane cis-1,3-Dichloropropene Trichloroethene (TCE) Chloroethane trans-1,3-Dichloropropene Trichlorofluoromethane Chloroform Ethylbenzene 1,2,3-Trichloropropane Chloromethane Ethyl ether 1,1,2-Trichlorotrifluoroethane 2-Chlorotoluene Hexachlorobutadiene 1,2,4-Trimethylbenzene 4-Chlorotoluene Isopropylbenzene 1,3,5-Trimethylbenzene 1,2-Dibromo-3-chloropropane
(DBCP) p-Isopropyltoluene Vinyl chloride
1,2-Dibromoethane (EDB) Methylene chloride o-Xylene Dibromomethane Methyl ethyl ketone (MEK) p&m-Xylene 1,2-Dichlorobenzene Methyl isobutyl ketone (MIBK)
Section 3.3: Problem Investigation Monitoring Strategy Problem investigation monitoring typically focuses on groundwater that is at risk for or is known to be contaminated by a spill, chemical release site, or other mechanism, or is of special interest because it is an aquifer that is a source of drinking water.
Whereas condition monitoring with the Ambient Groundwater Monitoring network has a statewide scope, the focus of most problem investigation monitoring is more localized, because it is focused on determining the cause, source, severity, and extent of a site-specific groundwater contamination concern. Problem investigation monitoring seeks to gather aquifer characteristics and determine the rate, path of groundwater flow, and extent and magnitude of contamination. Problem investigation monitoring gathers information needed to assess human and environmental risks associated with the contamination and provides information needed to design groundwater cleanup systems, if required.
Most problem investigation monitoring at the MPCA is conducted by the MPCA’s Superfund, Resource Conservation and Recovery Act (RCRA), Closed Landfill, and Petroleum Remediation programs (Remediation Division). These programs are responsible for the core remediation and emergency response programs of the agency. The MPCA Remediation Division focuses on environmentally effective, cost efficient clean-up and long-term maintenance of contamination sites. While these programs deal with issues broader than groundwater contamination (e.g. soil contamination, soil vapor releases, etc.), investigation of the potential effect of contaminant releases on groundwater and identification and clean up of groundwater contamination that exceeds risk-based standards is a fundamental purpose of the programs.

Minnesota’s Water Quality Monitoring Strategy 2011-2012 • September 2011 Minnesota Pollution Control Agency
91
More information about the MPCA’s Remediation programs is available here: http://www.pca.state.mn.us/index.php/waste/waste-and-cleanup/cleanup-programs-and-topics/cleanup-programs/cleanup-programs.html. Risk-based site assessment guidance documents used by the Petroleum Remediation, RCRA and Superfund programs, and Voluntary Investigation and Cleanup Program, including guidance documents for groundwater investigation and cleanup, can be accessed through this link: http://www.pca.state.mn.us/index.php/waste/waste-and-cleanup/cleanup-programs-and-topics/topics/risk-based-site-evaluation-process-guidance-documents.html?menuid=&redirect=1
Section 3.4: Effectiveness Monitoring Strategy Effectiveness monitoring is designed to measure the actual impact of resource management decisions, such as implementation of BMPs. Effectiveness monitoring involves monitoring both before and after implementation, and is conducted in specific locations to provide a measure of whether, and to what extent, responses to a problem were successful.
Groundwater effectiveness monitoring is conducted by the MPCA Remediation Division to demonstrate the effectiveness of remedial actions taken to address impacted soil and groundwater at a site. Over time, the MPCA’s Ambient Groundwater Monitoring Network will provide data that can be used to evaluate the overall effect of non-agricultural anthropogenic activities on Minnesota’s groundwater quality.
The MPCA has also been working to identify data needed to assess the effectiveness of BMPs used to protect groundwater by programs that do not routinely conduct effectiveness monitoring. These programs include:
• subsurface sewage treatment systems • animal feedlots • biosolids • land and water quality permits for land applied industrial wastewaters and by–products • stormwater • solid waste demolition landfills • municipal inflow and infiltration
This work fulfills the MPCA’s strategic plan Goal W.1 and Objective W1c to identify agency programs where collection of groundwater quality data would be beneficial to evaluate the effectiveness of the program BMPs. An initial report on groundwater BMP effectiveness was produced in 2011, and work implementing the report recommendations continues.
Section 3.5: External Organization Monitoring This section provides a brief description of the monitoring purposes, designs and activities of other Minnesota organizations involved in groundwater quality monitoring: MDA; MDNR; USGS; and the MCES.
Recall that the MPCA and other state agencies with responsibility for water resource management in Minnesota have been coordinating their monitoring activities via the Coordination Team to make the

Minnesota’s Water Quality Monitoring Strategy 2011-2012 • September 2011 Minnesota Pollution Control Agency
92
best and most efficient use of the new funding opportunities that became available with establishment of the CWF. Monitoring activities that have previously been described because of MPCA’s participation will not be described in detail in this section.
3.5.a Minnesota Department of Agriculture groundwater quality monitoring The overall goal of the pesticide groundwater monitoring program is to determine the impacts of pesticides on vulnerable groundwater across the state of Minnesota. The desire of MDA decision makers is to have a regionalized assessment that may be used to make sub-state level comparisons of, and decisions on, the impacts of pesticides to vulnerable groundwater resources. Direction for groundwater monitoring by MDA is derived from the Minnesota Pesticide Control Law (M.S. 18B) and the Minnesota Groundwater Protection Act (M.S. 103H).
The groundwater monitoring program has been designed to satisfy the following three primary goals:
1. Evaluate the impacts of pesticides to the most vulnerable groundwater within the 10 MDA Pesticide Monitoring Regions (PMRs) displayed in Figure 9.
2. Determine the frequency of detections, the concentration of detections, and changes in detections and concentration over space and time.
3. Evaluate the need for pesticide best management practices and other pesticide management plan activities in the various regions of the state.
The MDA began monitoring groundwater in November 1985 and redesigned the program in 1998. New wells were installed in 1999, and the MDA began sampling the re-designed monitoring network in January 2000. The current program is established around the goal of providing the information necessary to manage pesticide use for water quality protection on a sub-state, regional basis. Each monitoring site is established to evaluate pesticide impacts to the most vulnerable groundwater conditions in their associated PMR. The first network was established in PMR 4 (central sands), which contains the majority of sites in the program. It was designed for the purpose of tracking trends over time. PMRs 1, 5, 6, 7 and 8 were started in 2004. PMR 9 groundwater has been sampled via naturally occurring springs since 1993. Monitoring of natural springs in PMR 9 is accompanied by sampling of domestic drinking water wells, which started in 2009. PMRs 2 and 3 are not currently monitored for groundwater due to very limited agricultural production in these heavily forested regions. Network design, sampling protocols, well locations, sampling schedules, and so forth, are available in the program’s groundwater design document and annual work plans on the MDA website at: (www.mda.state.mn.us/monitoring).
Previous laboratory analyses consisted of separate analytical procedures for base neutral pesticides, chloroacetanilide degradates, and chlorophenoxy acid herbicides. To increase laboratory efficiency and capacity, the MDA used funds from a legislative appropriation and a Legislative Citizen Commission on Minnesota Resources (LCCMR) grant to purchase two sets of equipment and develop analytical methodology from 2008 - 2010. The liquid chromatography with tandem mass spectrometry (LC-MS/MS) analytical method is capable of detecting a much broader suite of chemicals and at lower concentrations for some chemicals. The number of chemicals available for routine analysis with the new LC-MS/MS method has greatly increased to 110. The MDA laboratory also continued to run a gas chromatography mass spectrometry (GC-MS) procedure for analytes not captured by the new LC-MS/MS.
Minnesota’s Water Quality Monitoring Strategy 2011-2012 • September 2011 Minnesota Pollution Control Agency
93
The most significant component of the new methods is the ability to quantify concentrations for many of these chemicals at much lower levels. All of the pesticides now analyzed with the LC-MS/MS are being quantified at ppt or as nanograms/Liter (ng/L) levels. During this, the first year, compounds were added at various times during the year as validation of specific analytes was completed.
The program develops a full report on the monitoring results every year. These reports are made available on the MDA webpage www.mda.state.mn.us/monitoring and are shared with the MPCA, MDH, and other interested agencies, organizations or individuals.
3.5.b Minnesota Department of Health groundwater quality monitoring activities Groundwater quality monitoring activities support the mission of the MDH, “to protect, maintain, and improve the health of all Minnesotans,” by providing data that are used to evaluate the level of contaminants in groundwater used for drinking water. These data help verify compliance with federal and state regulations, and are used to develop groundwater models that guide water supply planning and other public health efforts to safeguard our drinking water. The following paragraphs provide additional information about MDH’s groundwater quality monitoring activities.
Drinking water protection
MDH assists more than 8,000 community and noncommunity public water supply systems to provide safe and adequate drinking water as outlined in the federal Safe Drinking Water Act (SDWA). MDH staff and laboratory personnel collect and analyze water samples from the public water supply systems for required parameters on a schedule that is dependent on the type of water supply system.
MDH also regulates the construction, repair, and sealing of wells and borings, and regulates new wells that are used for potable uses. Minnesota’s recently revised Water Well Construction Code (Minn. R. 4725) requires that newly constructed drinking water wells be sampled and tested by a certified laboratory for arsenic, coliform bacteria and nitrates to ensure a safe water supply; the analytical results must be sent to MDH as well as the well owner.
MDH also consults with other state programs, federal partners and local governments on the investigation and response to potential threats to water supplies from emerging contaminants, such as perfluorochemicals (PFCs). In the eastern portion of the Twin Cities Metro Area, the MDH has collaborated with the MPCA to sample over 1,000 private wells in multiple areas of Washington County to determine the extent of PFBA (i.e. one of the PFC compounds) in the aquifers, and continues to work with the MPCA to monitor over 400 of those wells.
Source water protection
Ninety-eight percent of public water supplies in Minnesota rely on groundwater as the source. MDH works with public water suppliers to protect the groundwater sources of drinking water through activities designed to identify potential threats and prevent contamination. All community water supply systems in Minnesota will be engaged in wellhead protection planning by 2020. Groundwater monitoring is essential to provide the hydrogeological and geochemical data utilized in developing the wellhead protection plan. Ongoing monitoring of the groundwater used for public drinking water supplies is an integral component of ensuring that safe drinking water is protected against future contamination.

Minnesota’s Water Quality Monitoring Strategy 2011-2012 • September 2011 Minnesota Pollution Control Agency
94
Groundwater monitoring conducted by MDH in support of public water supply protection includes monitoring for tritium and stable isotopes of water. The MDH routinely samples public water supply wells for tritium to determine the residence time or “age” of the water. The “age” of the water is one factor used to assess the vulnerability of wells to contamination. Wells that capture young water are more susceptible to contamination from activities at the land surface than those that capture older water. In settings where surface water bodies are thought to recharge the groundwater aquifers supplying public wells, the MDH also samples for the stable isotopes of water. These stable isotope results can be used to confirm or refute whether recharge is occurring and determine how much of the water pumped by a well originated at a lake or stream. These results are critical for accurate delineation and effective management of wellhead protection areas.
MDH is also involved in other source water protection monitoring initiatives that are focused on specific issues or geographic areas. Several of these are highlighted below.
• Currently, MDH is collecting general water chemistry samples from community public water systems from July 1, 2010, through September 30, 2013, as part of its General Water Chemistry Initiative for Community Public Water Supplies. These data will enable the systems to develop a more in-depth understanding of the water quality from their unique aquifers and well depths, to assess and maintain water quality at entry points and within the distribution system, and to use as baseline data in evaluating potential contamination events.
• From 2008 to 2011, MDH sampled and analyzed for radium in the water from over 100 wells completed in the Mt. Simon and Jordan aquifers across southern Minnesota. This information will be useful to community drinking water suppliers in areas where radium is a constraint on the development of new drinking water sources.
• The MDH recently conducted a pilot study to determine whether assessment monitoring of public water supply wells, as allowed under the federal groundwater rule, should be included in the State’s rule primacy description to the EPA. The study involved monthly sampling of 95 public supply wells for bacteria (total coliform with E. coli follow-up) and general chemistry (ammonia, nitrate, bromide, chloride and sulfate) for one year beginning in February of 2009.
3.5.c Minnesota Department of Natural Resources groundwater quality monitoring activities The MDNR’s statutory responsibilities with regard to groundwater are centered on monitoring and managing groundwater levels, groundwater availability and the long-term sustainability of Minnesota’s groundwater and surface water resources. To this end, MDNR carries out a number of groundwater related programs, including the Groundwater Observation Well Network, the well permitting program, and the water (surface and groundwater) appropriations program, to name a few. As part of this work, the MDNR collects groundwater quality data under specific circumstances, which are described below.
• The MDNR maintains a statewide groundwater level monitoring network. There are currently approximately 750 wells in this statewide network, although the number of wells in the network is undergoing expansion in priority areas. When possible and as funding allows, new wells in the network are intended to be constructed to enable water quality sampling in addition collection of water level data.
• The MDNR in conjunction with the Minnesota Geological Survey (MGS) is conducting an aquifer investigation of the Mt. Simon aquifer to better understand the physical and recharge characteristics of this important aquifer. The investigation will map and monitor water levels of the aquifer in south-central and east-central Minnesota and augment production of county

Minnesota’s Water Quality Monitoring Strategy 2011-2012 • September 2011 Minnesota Pollution Control Agency
95
geologic atlases for this area. Monitoring wells have been installed in 24 locations to assess the physical and recharge characteristics of this important aquifer. Most locations have multiple wells installed and function as a well nest. The wells were sampled for chemical constituents that will help determine the residence time or age of the groundwater in the aquifer. The wells also were instrumented with equipment to continuously record groundwater levels. The well construction design will allow future groundwater sampling by others.
• Another network expansion initiative underway is the installation of additional monitoring wells in the major water supply aquifers in Twin Cities Metro Area. These additional wells are intended to fill identified gaps in the network. Well construction will allow future groundwater chemistry and quality sampling by MDNR or cooperating agencies. Seven wells have been constructed to date, with a long-range plan goal of 60 wells installed.
• As part of an on-going cooperative effort with the MGS, the MDNR prepares the groundwater and pollution sensitivity portion of county geologic atlases. As a part of that effort, groundwater sampling is done at selected wells to better understand groundwater movement and to support groundwater sensitivity mapping. Approximately 80 to 100 wells are sampled in each investigated county to determine major ion, trace element, and tritium concentrations. Stable isotopes concentrations of oxygen and hydrogen are also analyzed to better understand recharge conditions. A few wells suspected of having very old water in each project area are sampled and analyzed for carbon-14 age dating of groundwater. The MDNR maintains a database of water chemistry and isotope data from more than 1,500 wells.
• Minnesota was selected as one of five pilot sites to test the concepts for a proposed NGWNM. The proposed NGWMN will use selected wells from state monitoring networks to be included in a long-term, national-scale assessment of groundwater quantity and quality conditions. Data will be made available from the various state networks through a web-based data portal. The MDNR and MPCA are working cooperatively with staff from the USGS, EPA, and other organizations to evaluate monitoring networks, field practices, and data management systems to identify any monitoring gaps, changes required to conform to the proposed NGWMN criteria, and develop a prototype web-based portal for data sharing. The project area for the Minnesota pilot study is the Cambrian-Ordovician aquifer system located in the southeastern part of the state. In Minnesota, the Cambrian Ordovician aquifer system consists of the Galena limestone, Platteville limestone, St. Peter Sandstone, Prairie du Chien Dolomite, Jordan Sandstone, Tunnel City (Franconia) Sandstone, Wonewoc (Ironton-Galesville) Sandstone, and Mount Simon-Hinckley Sandstone.
3.5.d Metropolitan Council Environmental Services groundwater quality monitoring activities Although MCES primarily conducts surface water quality monitoring of rivers, streams, lakes and wastewater treatment plant discharges in the Minneapolis-St. Paul seven-country Metro Area, it also does some groundwater quality monitoring as described below.
MCES and its predecessor agencies have monitored groundwater at various treatment plant locations since 1975, to determine the impacts of past biosolids disposal practices on local groundwater quality. Groundwater monitoring has been conducted for planning purposes, and to meet NPDES and SDS requirements of the MPCA and local governments. The MCES began monitoring groundwater in 1984 and maintains a database containing all existing MCES groundwater monitoring data. Routine groundwater monitoring is conducted quarterly at the Metro and Seneca Plant ash disposal facilities, and data are reported to the MPCA as required by solid waste permits.

Minnesota’s Water Quality Monitoring Strategy 2011-2012 • September 2011 Minnesota Pollution Control Agency
96
Since some groundwater de-watering is necessary at the Seneca Plant to maintain the structural integrity of the treatment tanks, the Seneca NPDES Permit also requires measurement of surface water flows and groundwater elevation monitoring in the nearby Nichols Fen. This monitoring is conducted in cooperation with the MDNR and the city of Eagan.
3.5.e U.S. Geological Survey groundwater quality monitoring projects The USGS conducts a variety of groundwater monitoring activities in the state. Many of its activities and investigations are conducted in cooperation with other organizations that support the work of those agencies. Below is a brief description of the various USGS groundwater monitoring projects that were recently or are currently underway. More information on the Minnesota office of USGS can be found at: http://mn.water.usgs.gov/index.html
U.S. Geological Survey groundwater quality monitoring and study projects
• Cedar Creek groundwater project using prairie biofuel buffers (LCCMR and University of Minnesota) The overall objective of the USGS portion of this study is to better understand the fate and transport of veterinary pharmaceuticals and nutrients through the unsaturated zone and to the water table beneath diverse prairie grasses, corn, and hay plant communities. The soil hydrology assessment is presented in the master’s thesis: (Trost, J. “Effects of perennial and annual vegetation on a soil water balance and groundwater recharge.” M.S. Thesis, University of Minnesota, 2010). A USGS report will be produced for the cooperator which will report the pharmaceutical fate and transport assessment.
Dates: July 1, 2007 - June 30, 2010
• Assessing two-dimensional regional differences in arsenic concentrations in Minnesota groundwater, 1992 – 2009 (Minnesota Department of Health) The objective of the project is to describe the two- and three-dimensional spatial distribution of arsenic in groundwater in Anoka County, Carlton County, and Ottertail County, Minnesota and to identify data needs for developing a predictive model for high arsenic.
Dates: March 2010 - June 2011
• National Crude Oil Spill Fate and Natural Attenuation Research Site – USGS Toxics Program The FY2010 research objectives for the Bemidji project are organized into three components: unsaturated-zone, saturated-zone, and plume-scale research. Several long-term data collection efforts were continued to support ongoing research into crude oil contamination in the subsurface. Continuous unsaturated zone and groundwater data were collected; including two sites with continuous unsaturated zone moisture, soil temperature, soil water pressure data, and seven sites with continuous water level data. Water levels and oil thicknesses were measured monthly in a subset of wells. An annual synoptic survey of water levels, oil thicknesses, and field parameters (pH, conductivity, dissolved oxygen, and temperature) was completed.
Dates: 1983 – On-going
• National Crude Oil Spill Fate and Natural Attenuation Research Site – Site Management (Minnesota Pollution Control Agency, Enbridge Energy and Beltrami Co.) This project supports the advancement of science, research, and education on the fate, transport, and natural attenuation of crude oil contamination in the subsurface and supports research on

Minnesota’s Water Quality Monitoring Strategy 2011-2012 • September 2011 Minnesota Pollution Control Agency
97
crude oil contamination remediation strategies. Several proposals were received in response to an RFP and proposals were funded.
Dates: February 2009 - February 2014
• Emerging contaminants in shallow groundwater in Minnesota (MPCA) The goal of this project is to determine the magnitude of contamination from endocrine disrupting
compounds (EDCs) as well as from other emerging contaminants of interest in shallow groundwater. EDCs and other emerging contaminants in this study include organic wastewater compounds, pharmaceutical compounds, antibiotics, and endocrine active compounds (hormones). Results will be related to other factors, such as point and nonpoint sources or land use, which may explain the occurrence and distribution of the compounds in shallow groundwater.
Dates: September 2009 - December 30, 2010
U.S. Geological Survey groundwater monitoring and study projects
• Hydrologic changes from wetland and prairie restoration at Glacial Ridge, Polk and Red Lake Counties, Minnesota–low-intensity phase monitoring (Red Lake Watershed District) This project continues the long-term monitoring program to determine hydrologic changes resulting from prairie and wetland restorations and investigate mercury releases from newly restored wetlands at Glacial Ridge. Preliminary statistical data analyses are complete.
Dates: October 2005 – On-going
• Characterization of the hydrogeologic properties and groundwater-flow conditions in the St. Lawrence formation (LCCMR and Minnesota Geological Survey) The objectives of this project are to characterize the hydrogeologic properties and groundwater-flow conditions in the St. Lawrence Formation. The project chief will work with MGS geologists to determine the location for wells to be used in the study and develop a schedule for the borehole geophysical surveys.
Dates: July 1, 2010 – September 30, 2013
Section 3.6: Monitoring Quality Assurance Nearly all decisions made to protect and maintain groundwater quality are based on the monitoring data that are collected to assess its condition. For this reason, it is imperative that the MPCA has quality assurance/quality control standards for these data.
The MPCA's quality assurance/quality control coordinators oversee implementation of the agency’s quality assurance/quality control standards. This includes data collection, selection of laboratories, selection of parameters to be measured, the consistency of data analysis and confidence in data quality.
The MPCA’s Quality Management Plan was approved by the EPA in 2007. It is being updated for 2012. The MPCA’s Quality Management Plan is available here: http://www.pca.state.mn.us/index.php/view-document.html?gid=5479

Minnesota’s Water Quality Monitoring Strategy 2011-2012 • September 2011 Minnesota Pollution Control Agency
98
Section 3.7: Data Management The MPCA’s groundwater data management practices are changing because of the agency’s transition to the EQuIS data management system. This transition will have many positive impacts on the agency’s monitoring, data storage, retrieval, and analysis activities; more information about the transition is provided in Section 2.7 of this report.
The MPCA will complete the migration of groundwater data currently contained in STORET to EQuIS by late-2011. EQuIS contains a module which allows information collected in the field to be captured electronically and uploaded into the database. Staff from the Ambient Groundwater Monitoring Network plan to use this module to compile field-collected information and upload it into EQuIS. The MPCA also plans to obtain data from the laboratories in an electronic format that is compatible with EQuIS.
Section 3.8: Data Analysis The MPCA analyzes its ambient groundwater quality data to determine its suitablility to serve as drinking water, describe the condition of the state’s groundwater, and quantify any changes in the quality of this resource. A variety of visualization and statistical methods are used to meet these varied goals.
All groundwater quality data from the MPCA Ambient Groundwater Monitoring Network are compared to applicable health-based guidance by the MDH or Maximum Contaminant Levels set for drinking water by the EPA. The health based guidance values derived by the MDH include health risk limits, health based values, and risk assessment advice. Health risk limits and health based values are chemical concentrations in drinking water that pose little or no health risk to humans. Health risk limits differ from health based values in that they are promulgated. Risk assessment advice is generally similar to health risk limits and health based values; but these values may be qualitative and have greater uncertainty.
The overall condition of Minnesota’s groundwater is determined separately for the Quaternary sand and gravel wells in the Early Warning Network and the Prairie du Chien Jordan formation aquifers. This approach is used because the natural quality of the state’s aquifers varies due to the differing geologic compositions and groundwater residence times.
When the Early Warning Network is completed, monitoring data collected from the Quaternary sand and gravel wells will be analyzed to show spatial differences in chemical concentrations and quantify any differences in groundwater quality underlying typical urban and undeveloped land use settings. Spatial differences will be shown by maps of chemical concentrations by the well location. Differences among the typical urban and land use settings will be shown by box plots of chemical concentrations by land use setting. These differences in median chemical concentrations among these settings will be quantified using a non-parametric statistical technique, such as the Kruskal-Wallis test.
The data from the other aquifers monitored by the MPCA’s Ambient Groundwater Monitoring Network will be analyzed to show spatial differences in chemical concentrations. This will be done using maps of concentrations by well location.
The VOC and contaminants of emerging concern data will be analyzed to determine the frequency of detection and the maximum concentration. The detection frequencies are calculated using the reporting limit for each indicator and a common reporting for the entire suite of chemicals. A common reporting

Minnesota’s Water Quality Monitoring Strategy 2011-2012 • September 2011 Minnesota Pollution Control Agency
99
limit also is used to calculate detection frequencies because some chemicals may appear to be detected more frequently in the groundwater compared to others because they can be analyzed at a low reporting limit. The limits used to calculate the detection frequency will be raised if laboratory or field quality assurance data indication contamination.
Section 3.9: Data Reporting The ambient groundwater quality data collected by the MPCA are stored and made available to scientists, citizens, and other interested parties in a variety of ways.
Environmental Data Access The MPCA’s Environmental Data Access (EDA) system allows users to view and download groundwater quality data. The EDA’s groundwater section displays data from the MPCA’s Ambient Groundwater Monitoring Network and Closed Landfill Monitoring program. EDA has the choice of a map-based or text-based search. Using the map-based search, the user can view the sampling dates and analytical results for specific wells. More information about EDA, and a link to the EDA system, can be found here: www.pca.state.mn.us/eda.
Prepared reports Much of the MPCA’s groundwater quality data reporting occurs through the preparation of reports that provide context and interpretation of the monitoring data that were collected. Most of these reports are available on the MPCA’s website.
These reports fulfill a range of purposes. They include a condition monitoring report, major watershed assessment reports, and a groundwater monitoring status report. The following paragraphs highlight some of the monitoring data-based, groundwater quality reports, with web links where they are available.
Groundwater condition reports: The MPCA publishes a report every five years describing the general condition of the state’s groundwater. This report is designed to provide an assessment of current condition of the Minnesota’s groundwater resources that are vulnerable to contamination and eventually will identify any emerging trends in water quality. The scope of the reports generally is limited to information collected by the MPCA and MDA ambient groundwater monitoring networks.
Major watershed assessment reports: These reports are prepared for each major (8-digit HUC) watershed when the two years of intensive watershed monitoring (years 1 and 2 of the 10-year watershed management cycle) is complete and the data have been assessed. These reports are designed to provide a complete set of information about the water resources in the watershed for use by local resource managers, watershed management organizations, and other stakeholders. The reports largely contain information on the state’s surface water resources but will also contain information describing the general groundwater resources and available groundwater-quality information, primarily nitrate and arsenic concentration data.
Groundwater monitoring status reports: These reports are prepared every two years for the Environmental Quality Board (EQB) to meet the requirements of the Groundwater Protection Act (Minn. Stat. ch. 103H.175). These reports are designed to report on the status of groundwater

Minnesota’s Water Quality Monitoring Strategy 2011-2012 • September 2011 Minnesota Pollution Control Agency
100
monitoring by the MPCA and other agencies with groundwater responsibilities. The EQB is required to use the information provided by the MPCA and other agencies when preparing its reports on water issues and priorities for the Legislature.
Section 3.10: Programmatic Evaluation The MPCA’s Ambient Groundwater Monitoring Network and associated improvements described in this section are the result of a programmatic evaluation undertaken by the agency in 2009, following collection of five years of monitoring data according to the 2004 groundwater monitoring strategy (see Section 3.2 for more detail). The evaluation revealed a number of deficiencies in the monitoring data collected according to the 2004 protocol, for which the MPCA proposed a revised strategy and requested funding to implement it from the newly available CWF. This combination of factors will lead to significant improvements in the quality and rigor of the MPCA’s groundwater condition monitoring activities.
As described previously in Section 2.10, the MPCA undertakes annual internal program assessments and also is accountable to the state Clean Water Council for monies it has received for its groundwater quality monitoring activities. In addition, the MPCA participates in interagency coordination teams that are intended to eliminate duplication of effort in state agency activities and avoid creation of additional layers of bureaucracy.
Section 3.11: General Support and Infrastructure Planning Table 12 shows the level of funding the MPCA received in the FY10-11 biennium for groundwater monitoring. The MPCA has requested a similar amount of funding for FY12-13, and anticipates similar requests into the future to maintain its monitoring activities and programs.
Table 12. MPCA groundwater monitoring budget, Fiscal Years 2010 – 2011 (July 1, 2009, to June 30, 2011)
MPCA Groundwater Monitoring Budget
State Funding $2,196,384
Federal Funding $663,988
TOTAL $2,860,372

Minnesota’s Water Quality Monitoring Strategy 2011-2012 • September 2011 Minnesota Pollution Control Agency
101
Section 3.12: Identified Needs At this time, the MPCA is implementing the improvements it identified with regard to its groundwater condition monitoring activities, and anticipates that funding to complete the improvements will be available during the coming biennium via the CWF.
An area of need that is becoming more apparent is staffing. The demands on MPCA staff dedicated to groundwater condition monitoring activities have greatly increased during implementation of the network improvements described in this section. The demand for information and interpretation of groundwater monitoring data are also increasing; this trend is expected to continue as the broader set of monitoring data now being collected is better able to support a variety of groundwater quality information needs.
Moreover, the agency’s adoption of the watershed approach has resulted in the collection of data that clearly demonstrate the significant impact groundwater has on surface water resources, in terms of quality, quantity, or both. The relationship of groundwater to surface water quality and its importance to watershed restoration and protection plans represents an additional demand on MPCA groundwater staff.

Minnesota’s Water Quality Monitoring Strategy 2011-2012 • September 2011 Minnesota Pollution Control Agency
102
Attachment 1: MPCA Water Monitoring Approaches
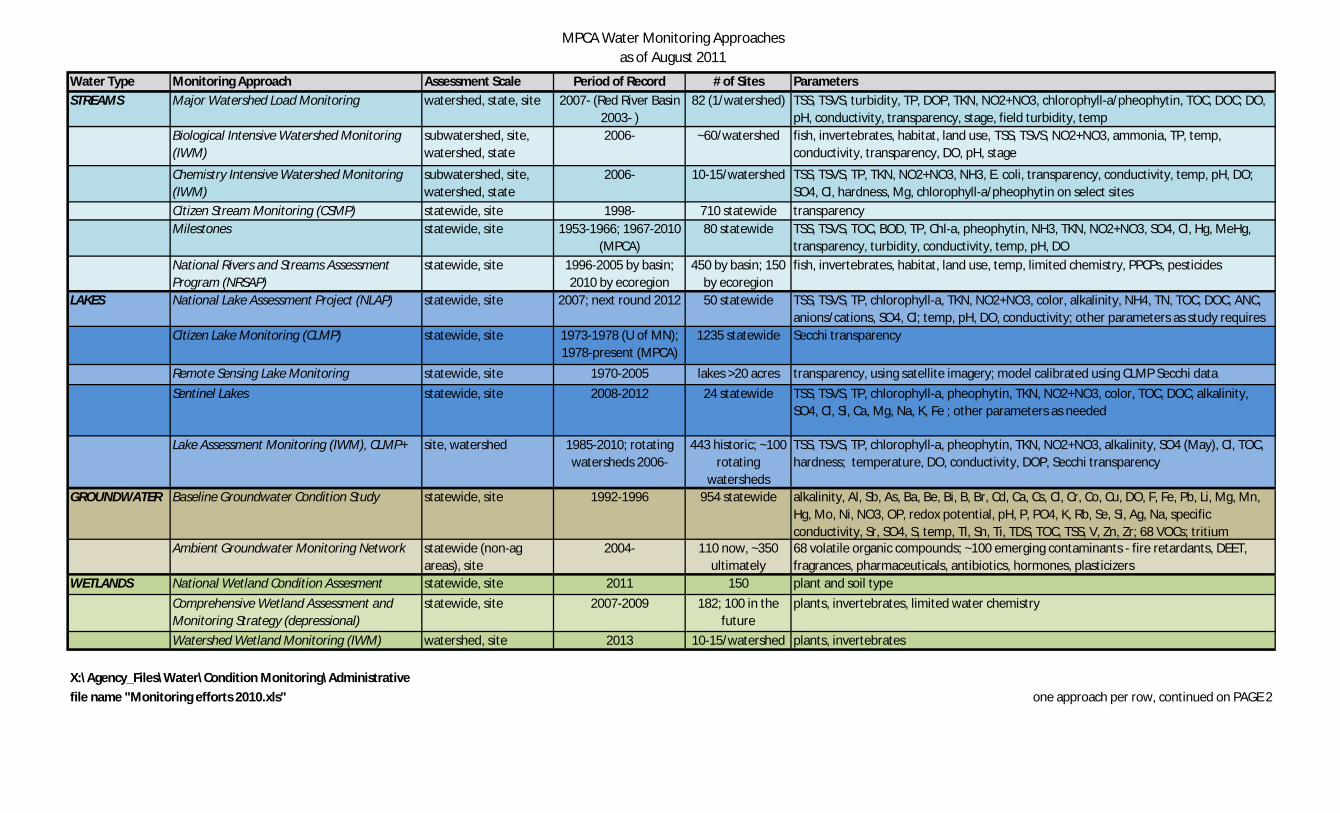
MPCA Water Monitoring Approaches as of August 2011
Water Type Monitoring Approach Assessment Scale Period of Record # of Sites Parameters
STREAMS Major Watershed Load Monitoring watershed, state, site 2007- (Red River Basin 2003- )
82 (1/watershed) TSS, TSVS, turbidity, TP, DOP, TKN, NO2+NO3, chlorophyll-a/pheophytin, TOC, DOC; DO, pH, conductivity, transparency, stage, field turbidity, temp
Biological Intensive Watershed Monitoring (IWM)
subwatershed, site, watershed, state
2006- ~60/watershed fish, invertebrates, habitat, land use, TSS, TSVS, NO2+NO3, ammonia, TP, temp, conductivity, transparency, DO, pH, stage
Chemistry Intensive Watershed Monitoring (IWM)
subwatershed, site, watershed, state
2006- 10-15/watershed TSS, TSVS, TP, TKN, NO2+NO3, NH3, E. coli, transparency, conductivity, temp, pH, DO; SO4, Cl, hardness, Mg, chlorophyll-a/pheophytin on select sites
Citizen Stream Monitoring (CSMP) statewide, site 1998- 710 statewide transparencyMilestones statewide, site 1953-1966; 1967-2010
(MPCA)80 statewide TSS, TSVS, TOC, BOD, TP, Chl-a, pheophytin, NH3, TKN, NO2+NO3, SO4, Cl, Hg, MeHg,
transparency, turbidity, conductivity, temp, pH, DONational Rivers and Streams Assessment Program (NRSAP)
statewide, site 1996-2005 by basin; 2010 by ecoregion
450 by basin; 150 by ecoregion
fish, invertebrates, habitat, land use, temp, limited chemistry, PPCPs, pesticides
LAKES National Lake Assessment Project (NLAP) statewide, site 2007; next round 2012 50 statewide TSS, TSVS, TP, chlorophyll-a, TKN, NO2+NO3, color, alkalinity, NH4, TN, TOC, DOC, ANC, anions/cations, SO4, Cl; temp, pH, DO, conductivity; other parameters as study requires
Citizen Lake Monitoring (CLMP) statewide, site 1973-1978 (U of MN); 1978-present (MPCA)
1235 statewide Secchi transparency
Remote Sensing Lake Monitoring statewide, site 1970-2005 lakes >20 acres transparency, using satellite imagery; model calibrated using CLMP Secchi data
Sentinel Lakes statewide, site 2008-2012 24 statewide TSS, TSVS, TP, chlorophyll-a, pheophytin, TKN, NO2+NO3, color, TOC, DOC, alkalinity, SO4, Cl, Si, Ca, Mg, Na, K, Fe ; other parameters as needed
Lake Assessment Monitoring (IWM), CLMP+ site, watershed 1985-2010; rotating watersheds 2006-
443 historic; ~100 rotating
watersheds
TSS, TSVS, TP, chlorophyll-a, pheophytin, TKN, NO2+NO3, alkalinity, SO4 (May), Cl, TOC, hardness; temperature, DO, conductivity, DOP, Secchi transparency
GROUNDWATER Baseline Groundwater Condition Study statewide, site 1992-1996 954 statewide alkalinity, Al, Sb, As, Ba, Be, Bi, B, Br, Cd, Ca, Cs, Cl, Cr, Co, Cu, DO, F, Fe, Pb, Li, Mg, Mn, Hg, Mo, Ni, NO3, OP, redox potential, pH, P, PO4, K, Rb, Se, Si, Ag, Na, specific conductivity, Sr, SO4, S, temp, Tl, Sn, Ti, TDS, TOC, TSS, V, Zn, Zr; 68 VOCs; tritium
Ambient Groundwater Monitoring Network statewide (non-ag areas), site
2004- 110 now, ~350 ultimately
68 volatile organic compounds; ~100 emerging contaminants - fire retardants, DEET, fragrances, pharmaceuticals, antibiotics, hormones, plasticizers
WETLANDS National Wetland Condition Assesment statewide, site 2011 150 plant and soil type
Comprehensive Wetland Assessment and Monitoring Strategy (depressional)
statewide, site 2007-2009 182; 100 in the future
plants, invertebrates, limited water chemistry
Watershed Wetland Monitoring (IWM) watershed, site 2013 10-15/watershed plants, invertebrates
X:\Agency_Files\Water\Condition Monitoring\Administrative
file name "Monitoring efforts 2010.xls" one approach per row, continued on PAGE 2

MPCA Water Monitoring Approaches as of August 2011
Monitoring Approach (cont.) Sampling Frequency Information Available 8/2011 Comments (funding, network type, site selection, etc.)
Major Watershed Load Monitoring perpetual, ~35 samples/site/yr statewide baseline data 2007-09 (Red River Basin 2003- )
CWF; fixed network
Biological Intensive Watershed Monitoring once/yr; 1 yr/10 yr baseline data for 24 watersheds CWF; rotating watersheds
Chemistry Intensive Watershed Monitoring 2yr/10yr; 10 samples/site (full chem) yr 1; 9 samples/site (bacteria only) yr 2
baseline data for 24 watersheds CWF; rotating watersheds; some monitoring performed locally by SWAG grant recipients in lieu of PCA monitoring
Citizen Stream Monitoring (CSMP) weekly Apr-Sept, and rain event; rain gage annual site/statewide trends CWF; volunteer networkMilestones once/month February-November (10/ yr);
2yr/5yrtrends for 4-5 decades ended 2010; fixed network
National Rivers and Streams Assessment Program (NRSAP)
once/yr; 2yr/5yr older data statewide by basin; new data statewide by ecoregion
federal funds, part of national assessment; random sites
National Lake Assessment Project (NLAP) once/yr; 1yr/5yr statewide baseline federal funds, part of national assessment; random sites
Citizen Lake Monitoring (CLMP) weekly May-Sept. (2 samples/month minimum)
statewide annual condition/ trends CWF; volunteer network; CLMP+ entails water samples, as well as Secchi transparency, data used for assessments
Remote Sensing Lake Monitoring 5 year intervals from 1970 - 2005, 2008 statewide annual condition/ trends work conducted by U of MN using satellite imagery
Sentinel Lakes monthly May-Sept 2008-9; Apr, July, Oct 2009-2012, with additional June, Aug, and Sept monitoring for "Super Sentinel lakes"
preliminary data for 2008-2009 DNR project to determine climate change effects on select lakes; large study with many components (fisheries, habitat, wq, etc.); PCA conducts water quality monitoring portion
Lake Assessment Monitoring monthly May-Sept baseline data for 24 watersheds; historical data on 443 lakes back to 1985
ongoing since 1985; previously much less funding, so would only monitor ~40 lakes/yr, limited parameters; SWAG grants enable additional local monitoring.
Baseline Groundwater Condition Study once summary of condition of state's principal aquifers
Ambient Groundwater Monitoring Network once/yr developing statewide condition/trend CWF; fixed network
National Wetland Condition Assesment once/yr; 1yr/5yr future - report early 2014 federal funds, part of national assessment; random sites
Comprehensive Wetland Assessment and Monitoring Strategy
once/5 yr cycle 1 completed statewide cycle CWF
Watershed Wetland Monitoring once/yr; 1yr/10yr cycle future CWF; rotating watersheds

Minnesota’s Water Quality Monitoring Strategy 2011-2012 • September 2011 Minnesota Pollution Control Agency
103
Attachment 2: Agreement to Operate an Integrated Ground Water Quality
Monitoring System for the State of Minnesota


