minnesota’s changing health insurance landscape: results ... · minnesota’s changing health...
TRANSCRIPT

1
HEALTH ECONOMICS PROGRAM
Minnesota’s Changing Health Insurance Landscape: Results from the 2017 Minnesota Health Access Survey FEBRUARY | 2018
Calendar year 2017 marked a year of substantial disruption in the individual health insurance market, persistent increases in health care costs across types of care, and uncertainty surrounding the future of federal health reform and its impact on premiums, subsidies and health care markets. At the same time, Minnesota continued to experience economic growth and declining unemployment, while wage growth remained flat. It is in this environment, in 2017, that Minnesota saw one of the largest one-time increases in its uninsurance rate, from 4.3 percent in 2015 to 6.3 percent.
This brief summarizes findings from the 2017 Minnesota Health Access Survey, focusing on trends in how Minnesotans obtained health insurance coverage, and providing an understanding for how the 2017 climate may have contributed to contraction of coverage. An accompanying issue brief provides detailed information on the uninsured and changes in their composition over time.1
This biennial telephone survey of the state population is conducted as a partnership between the Minnesota Department of Health and the University of Minnesota, School of Public Health State Health Access Data Assistance Center (SHADAC).
Health Insurance Coverage in 2017 The uninsurance rate rose significantly in Minnesota in 2017, from 4.3 percent in 2015 to 6.3 percent, leaving approximately 349,000 Minnesotans without coverage. This change meant that in 2017 there were about 116,000 more uninsured Minnesotans than in 2015.
Although substantial in magnitude, the higher rate of uninsurance in 2017 remains below 2013 coverage levels, which preceded the implementation of major Affordable Care Act (ACA) reforms and followed the Great Recession in 2007 when the economy was characterized by modest growth. In fact, uninsurance in 2017 was lower than most years since 2001 (Figure 1).
Key Findings: ▪ Minnesota’s uninsurance rate increased
to 6.3 percent in 2017.▪ About 349,000 Minnesotans did not have
health insurance.▪ The increase was due to a decline in
private health insurance – both groupand individual market coverage.
▪ Increasing health care costs, along withvolatility and uncertainty in health carepolicy, likely contributed to these trends.
▪ Most uninsured Minnesotans have accessto some form of subsidized coverage.

R E S U L T S F R O M T H E 2 0 1 7 M I N N E S O T A H E A L T H A C C E S S S U R V E Y
2
Figure 1: Minnesota’s Uninsurance Rate Rose to 6.3 percent in 2017
The increase in uninsurance reflects the continuation of several long-term trends in the private market and in public program coverage. In the private market, two trends significantly impacted coverage, and were not fully offset by increases in public program coverage:
▪ A decline of three percentage points in the share of Minnesotans with coverage offered by employers (from 55.9 percent in 2015 to 52.9 percent in 2017); and
▪ Shrinking enrollment in the individual market by about two percentage points (from 6.2 percent in 2015 to 4.4 percent in 2017).2
Figure 2. Private Coverage Fell while Public Program Coverage Increased in 2017
6.1%
7.7%*7.2%
9.0%* 9.0%8.2%
4.3%*
6.3%*
0%
2%
4%
6%
8%
10%
2001 2004 2007 2009 2011 2013 2015 2017
Source: Minnesota Health Access Surveys, 2001 to 2017* Indicates statistically significant difference from previous year shown at the 95% level
68.1%62.6%* 62.5%
57.6%* 56.6% 55.2% 55.9%52.9%*
4.8% 4.6% 5.1% 5.1% 5.2% 5.4% 6.2% 4.4%*
21.1%25.1%* 25.2%
28.3%* 29.2% 31.1%* 33.6%*36.5%*
0%
10%
20%
30%
40%
50%
60%
70%
2001 2004 2007 2009 2011 2013 2015 2017
Group Individual PublicSource: Minnesota Health Access Surveys, 2001 to 2017* Indicates statistically significant difference from previous year shown at the 95% level
R E S U L T S F R O M T H E 2 0 1 7 M I N N E S O T A H E A L T H A C C E S S S U R V E Y
3
Change in the Sources of Health Insurance Coverage To better understand why more Minnesotans in 2017 do not have health insurance, we look in this section at each type of coverage and discuss the factors that may be influencing the decision to purchase or the opportunity to otherwise gain health insurance coverage. There are two types of private coverage, group coverage, which people obtain through an employer, and individual coverage, coverage purchased on the individual market directly from an insurance carrier, through MNsure, or through navigator or broker. Public coverage includes coverage through Minnesota public health insurance programs (Medical Assistance and MinnesotaCare), Medicare, and Veteran’s Affairs coverage; based on federal definitions, Indian Health Services is not included in public coverage.
Group Coverage While employer-sponsored insurance, or group coverage, remains the primary path to health insurance for most Minnesotans (52.9 percent), the percentage of Minnesotans with access to group coverage continues to decline. High rates of employer coverage have traditionally been the bedrock of Minnesota’s comparatively low rates of uninsurance over time. That is why the marked decline in 2017, by three percentage points, is particularly worrisome.
Of even greater concern is that this decline continues a long-term pattern of erosion. Employer coverage in Minnesota fell markedly in 2004 and 2009, both times following earlier economic downturns. Minnesota did not regain these losses during times of economic recovery. This has contributed to the share of Minnesotans with employer coverage falling by 15 percentage points since 2001, effectively threatening to undermine Minnesota's strong coverage foundation.3,4 Similar trends have been observed for the U.S. in total, with even lower rates of employer coverage at the national level.5
There appear to be two main factors driving the long-term trend of declining coverage through employers. The first is a drop in the share of Minnesotans who are connected to an employer that offers coverage – either by working for such an employer or having a spouse or parent who does. The second is a decline in the share of individuals who take advantage of an employer offer, or take-up available coverage (Figure 3).6
The decline in the number of people in Minnesota connected to an employer that offers coverage mirrors national patterns, as do the factors that help explain the trend:
▪ Fewer employers are offering coverage. Almost 13 percent fewer Minnesota employers were offering coverage in 2016, as compared to 2001, driven by employers with 200 or fewer employees.7 National data found that 44 percent of this type of employer that made the decision not to offer coverage in 2017 did so because of cost.8
▪ Fewer people are working directly for employers. Across the United States, non-traditional forms of employment, such as temporary employment and work as freelancers and contractors, have become more prevalent; these types of jobs rarely offer health insurance coverage, or do so at a high cost.9,10
▪ Fewer people are in the labor market. The labor force participation rate in Minnesota slowed to below population growth levels between 2010 and 2015, and these trends are expected to continue, according to the Minnesota Demographic Center.11

R E S U L T S F R O M T H E 2 0 1 7 M I N N E S O T A H E A L T H A C C E S S S U R V E Y
4
Contributing to this trend is the faster growth of Minnesotans age 65 and older, who are less likely to be employed, compared to people under 65.
Even for people who are connected to an employer offering coverage, there have been changes over time, as noted. The share of employees who are eligible for health insurance coverage through their or a family member’s employer and end up purchasing that coverage (take-up rate) declined steadily from 2001 through 2013, as shown in Figure 3, with statistically significant declines in the rates in 2009, 2011 and 2013. Since then take-up has remained stable, in aggregate, likely reflecting the requirement to obtain health coverage (individual mandate) that the ACA established. Rates of eligibility for people at an employer that offered coverage have remained largely unchanged.
Figure 3. Percentage of Minnesotans (under 65) Connected to an Employer Offering Coverage Declined while Eligibility and Take-up Rates Remain Stable
Anecdotal comments from survey participants with group coverage point to concerns about the cost of coverage. One participant, who as an employer offers coverage and buys health insurance for his own family, commented that his health insurance costs keep going up, while benefits and care remain the same. Another participant obtained insurance through her husband and found they had to cover two deductibles for the year when her husband switched jobs mid-year. This amounted to about $8,000 plus co-pays and premiums for the family, which affected other financial priorities, including the ability to save for retirement.
A range of empirical evidence suggests that the trend in the underlying cost of health care has affected the comprehensiveness of benefits and networks, impacting employers in their decision-making and employees’ consideration about enrolling in coverage. The outcome has been the shifting of more health care costs to employees. Data from the MEPS survey found that in Minnesota, premiums for group coverage have nearly doubled since 2002, with the employee share growing faster than that of the employer. Over the same period, deductibles have tripled, far outpacing trends in inflation and compensation. At the same time, the availability of public program coverage through Medicaid might have drawn some individuals
95.1% 94.9% 93.6%91.8%* 90.1%*
87.7%* 87.3% 87.1%
97.4%94.8%* 96.0%*
94.0%* 94.8% 95.0% 95.8% 95.6%
83.7%80.3%* 81.0%
78.5%* 78.3%76.3%* 77.1%
74.2%*
60%
70%
80%
90%
100%
2001 2004 2007 2009 2011 2013 2015 2017
Take-up Rate (Of those connected and eligible)
Eligible for Employer Coverage (Of those connected)
Connection to Employer that Offers Coverage
Source: Minnesota Health Access Surveys, 2001 to 2017* Indicates statistically significant difference from previous year shown at the 95% level
R E S U L T S F R O M T H E 2 0 1 7 M I N N E S O T A H E A L T H A C C E S S S U R V E Y
5
away from group coverage; and the availability of premiums subsidies in the individual market may have prompted small employers to reconsider offering coverage.12,13,14
Individual Coverage The market for health insurance purchased directly by individuals was subject to a great deal of volatility in 2016 and 2017. Two Minnesota insurers significantly limited their offerings, premiums increased an average of 55 percent, and enrollment capacity limits were put in place, creating uncertainty in some regions of the state about whether coverage would be available to the extent it was needed.15 Given these dynamics and despite efforts by the Minnesota Legislature and Governor Dayton to protect policy holders against the high cost of coverage by issuing premium rebates,16 declines in enrollment could perhaps be expected.
As shown in Figure 2, there was a nearly two percentage point decline in 2017 in the percent of Minnesotans with individual coverage compared to two years earlier (4.4 percent and 6.2 percent respectively). Relative to 2015, approximately 100,000 fewer Minnesotans obtained coverage by purchasing it directly, leaving the market with the lowest enrollment since we began tracking it.17
Despite these changes, survey results indicate that the demographic profile of people in the individual market largely did not change significantly between 2015 and 2017. Over one-fourth of enrollees were over age 55, and nearly half of all enrollees had incomes over 400 percent of the Federal Poverty Guidelines ((FPG), $97,200 for a family of four in 2016). People in both urban and isolated rural areas saw significant declines in enrollment in the individual market.18
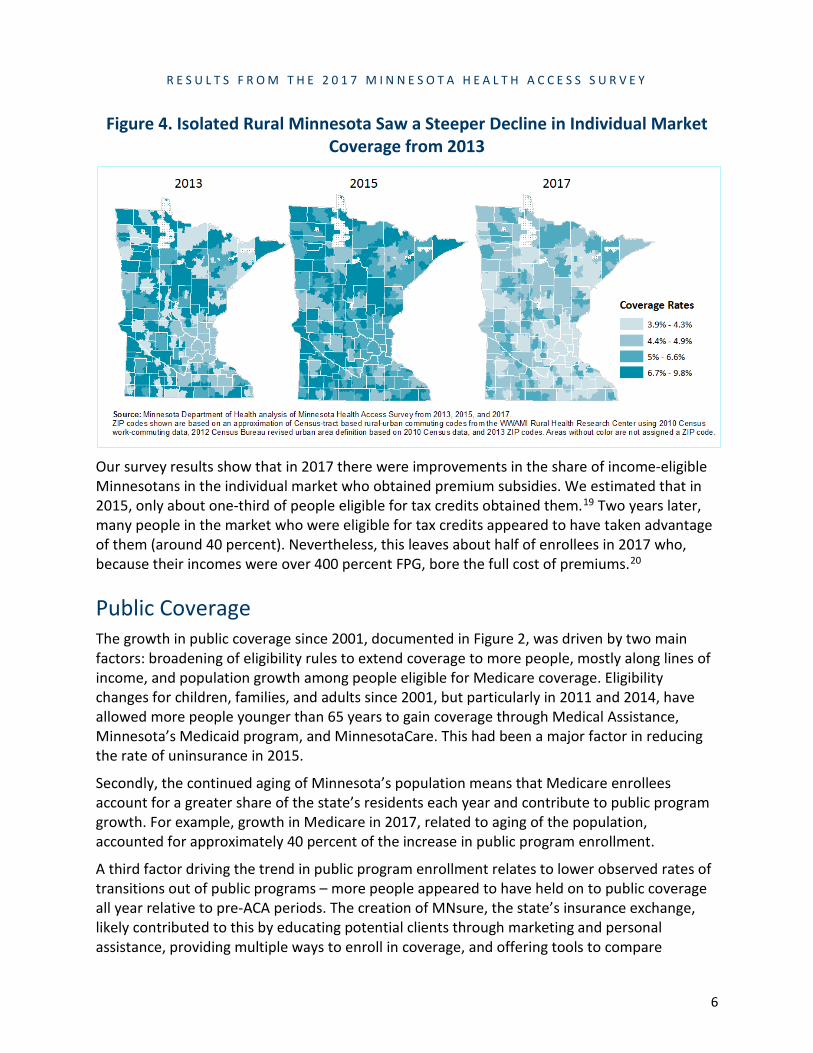
However, the decline of individual coverage in isolated rural areas of the state was particularly notable, because, in the past, these areas were more reliant than urban areas on the individual market as a source of coverage. In 2013, 9.8 percent of Minnesotans living in isolated rural areas were enrolled in the individual market. By 2017 only 4.6 percent of the population in these regions held individual market coverage (Figure 4); both Minnesota insurers that limited their offerings in 2017 had a prior presence in rural Minnesota.
R E S U L T S F R O M T H E 2 0 1 7 M I N N E S O T A H E A L T H A C C E S S S U R V E Y
6
Figure 4. Isolated Rural Minnesota Saw a Steeper Decline in Individual Market Coverage from 2013
Our survey results show that in 2017 there were improvements in the share of income-eligible Minnesotans in the individual market who obtained premium subsidies. We estimated that in 2015, only about one-third of people eligible for tax credits obtained them.19 Two years later, many people in the market who were eligible for tax credits appeared to have taken advantage of them (around 40 percent). Nevertheless, this leaves about half of enrollees in 2017 who, because their incomes were over 400 percent FPG, bore the full cost of premiums.20
Public Coverage The growth in public coverage since 2001, documented in Figure 2, was driven by two main factors: broadening of eligibility rules to extend coverage to more people, mostly along lines of income, and population growth among people eligible for Medicare coverage. Eligibility changes for children, families, and adults since 2001, but particularly in 2011 and 2014, have allowed more people younger than 65 years to gain coverage through Medical Assistance, Minnesota’s Medicaid program, and MinnesotaCare. This had been a major factor in reducing the rate of uninsurance in 2015.
Secondly, the continued aging of Minnesota’s population means that Medicare enrollees account for a greater share of the state’s residents each year and contribute to public program growth. For example, growth in Medicare in 2017, related to aging of the population, accounted for approximately 40 percent of the increase in public program enrollment.
A third factor driving the trend in public program enrollment relates to lower observed rates of transitions out of public programs – more people appeared to have held on to public coverage all year relative to pre-ACA periods. The creation of MNsure, the state’s insurance exchange, likely contributed to this by educating potential clients through marketing and personal assistance, providing multiple ways to enroll in coverage, and offering tools to compare
R E S U L T S F R O M T H E 2 0 1 7 M I N N E S O T A H E A L T H A C C E S S S U R V E Y
7
coverage options.21 As noted, despite the increase in public coverage enrollment in 2017, these gains were not enough to make up for the coinciding decline in private coverage.
Factors Driving Minnesota’s Rise in Uninsurance Historically, increases in uninsurance have typically been lagged responses to economic downturns. Research bears this out across multiple investigations at the national and regional levels, and over time. Minnesota trends since 2001, as noted, have followed this pattern as well. Minnesota’s 2017 increase in uninsurance, however, coincided with a growing economy, low unemployment, and federal and state policies geared toward increasing access to health insurance. As such, factors unrelated to income or employment trends are likely at work.
The survey gave us the opportunity to ask participants directly about the main reason for not having health insurance coverage. In Figure 5 we focus on the subset of uninsured individuals who had coverage at some point in the past, but lost it by the time of the survey.
About half of participants (54.6 percent) cited reasons related to personal transitions: Roughly one-third of uninsured persons with previous coverage reported they did not have insurance because they either lost their job, or their job no longer provided coverage (32.5 percent). Another 18.3 percent said that they were no longer eligible for their insurance without mentioning a specific reason. About 4.5 percent of participants cited changes in family situations that affected access to coverage.
One example of a transition that took place involved the experience of a survey participant who reported that when their insurer left the individual market, they ended up with a gap in coverage because they felt they lacked sufficient information about options for alternative coverage.
The third most frequently cited reason for not maintaining coverage was cost. Cost or not being able to afford health insurance was directly cited by 17.5 percent of the uninsured who previously had coverage. Participants were also asked why they did not get new coverage. The high cost of coverage, or the inability to afford coverage, played a role for an additional 35.6 percent of people who had lost coverage (data not shown). Their reason for losing coverage might be related to the loss of a job, but costs were a barrier to obtaining new coverage. Thus, cost played a role in uninsurance for over half (53.2 percent) of people who no longer had coverage in 2017.
As in the past, complexities associated with maintaining coverage (paperwork) and the perceived value of coverage (benefit) accounted for a smaller share of the population, 20.1 percent in 2017.

R E S U L T S F R O M T H E 2 0 1 7 M I N N E S O T A H E A L T H A C C E S S S U R V E Y
8
Figure 5: Reasons for Losing Insurance Coverage, 2017
Source: 2017 Minnesota Health Access Survey Note: Currently uninsured Minnesotans who previously had some type of health insurance (at any time) were asked the reason for losing coverage; 77 percent provided a reason for loss of coverage. Those who said they did not know or chose not to provide a response are not included in this analysis.
Although we do not have direct data from the survey to determine how uncertainty and volatility in the health care policy environment may have affected individuals’ decisions to obtain or maintain health insurance coverage, the extent of it was unique to 2017 and it likely played a role in the coverage changes. Some evidence from other studies supports this:
▪ Understanding of health insurance coverage has likely improved since passage of the ACA, given greater availability of information and extensive media coverage. However, people without health insurance, especially those with lower incomes consistently had the lowest levels of awareness about health reform. Conflicting and confusing information about the future of health reform in 2017 left them particularly vulnerable to making decisions based on incomplete or inaccurate information and may explain a portion of the decline in coverage.22,23
▪ Although the ACA remains in place, with some modifications, the share of Americans who believed the ACA would be repealed was measured at 50 percent and higher during 2017.24 This may have affected whether people believed they were required to have coverage, whether there would be a penalty for not having coverage, and whether subsidies that kept coverage affordable in the individual market and for Medical Assistance, and MinnesotaCare would continue to be available.
▪ Finally, evidence from one national study found that a significant share (34 percent) of uninsured people who knew about health insurance marketplaces, such as MNsure, did not try to get coverage because they thought the law would be repealed. 25
Other factors likely contributed to individual decisions and the 2017 coverage changes. For example, changes in the individual market in Minnesota included significant changes in premiums, health plan availability and provider network design, which may have affected people’s view of the tradeoffs between costs and value of insurance coverage. Along the same lines, more and more employers are offering high deductible health plans, which have lower
R E S U L T S F R O M T H E 2 0 1 7 M I N N E S O T A H E A L T H A C C E S S S U R V E Y
9
monthly premiums, but leave the employees responsible for paying thousands of dollars for health care before insurance begins to cover costs.26
Lastly, implementation decisions by Congress and the current and past administration may have contributed to health plans’ decisions on which coverage to offer, where to offer it, and how much to charge for it. The decisions not to fund risk corridor payments for plans, not to extend the transitional reinsurance program beyond 2016, not to financially support new market entrants through effective risk adjustment and to discontinue cost sharing reduction payments stand out most.27 However, the design of the essential benefit system and the persistent growth in the underlying cost of care contributed to the increasing cost of coverage and residents’ decision to purchase or maintain coverage.
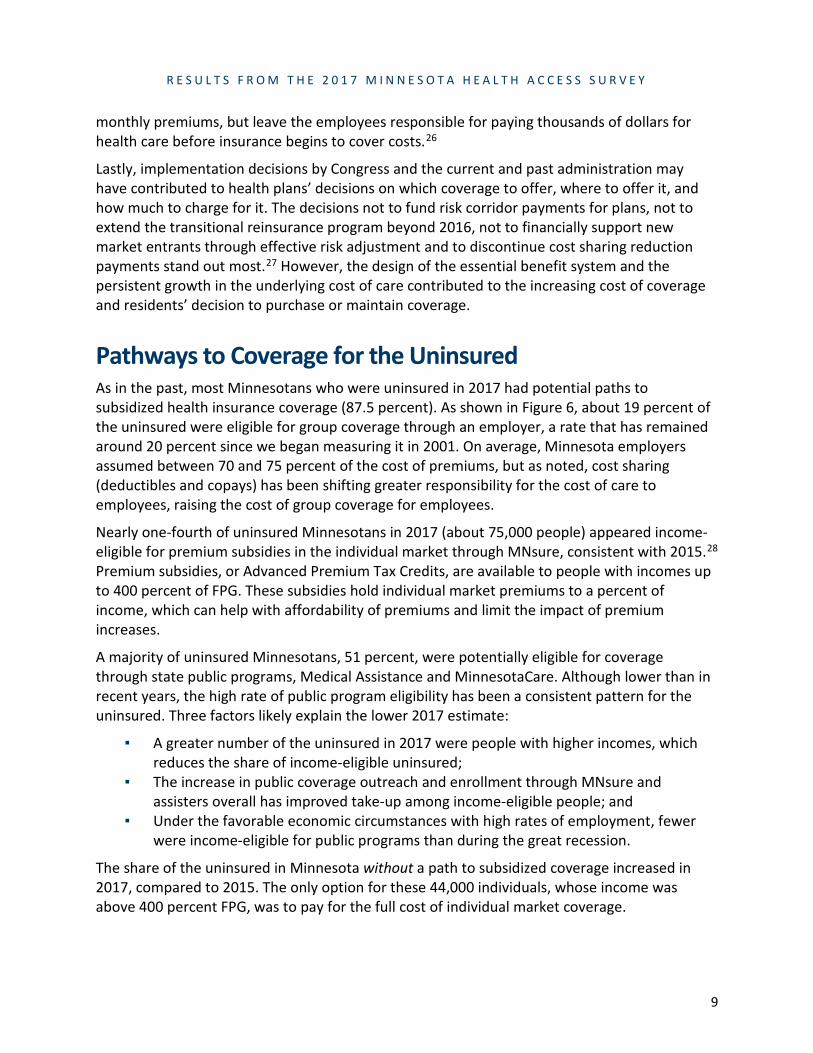
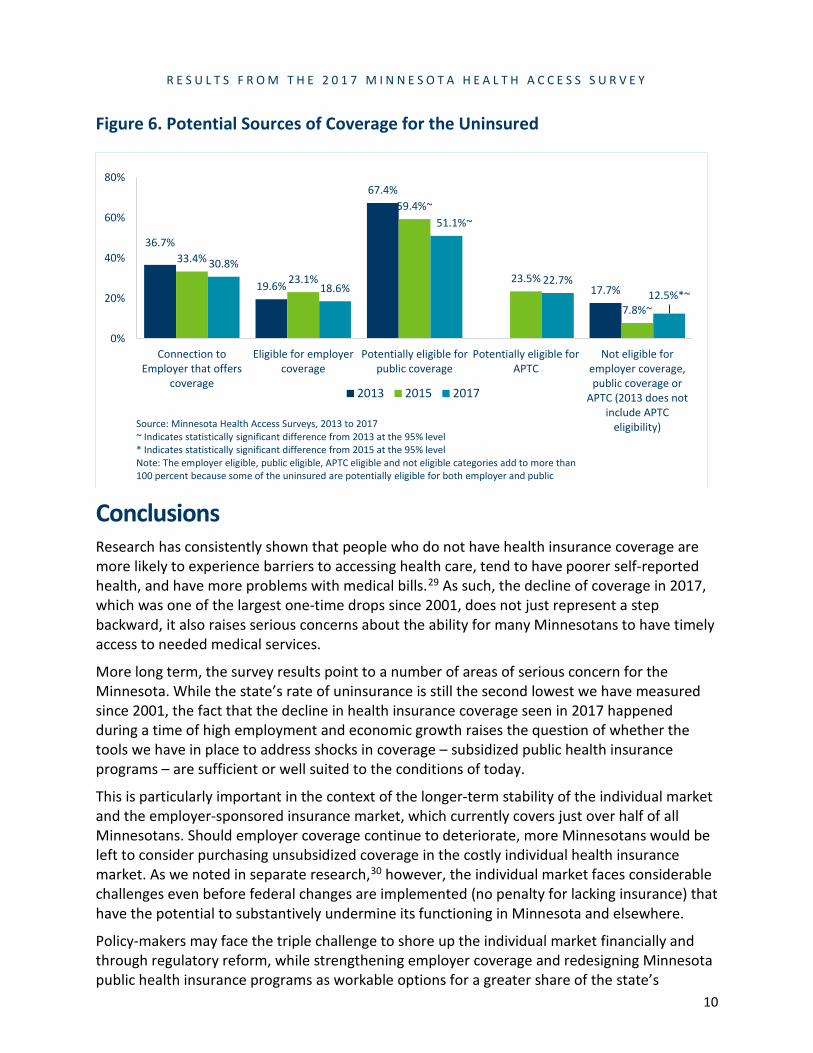
Pathways to Coverage for the Uninsured As in the past, most Minnesotans who were uninsured in 2017 had potential paths to subsidized health insurance coverage (87.5 percent). As shown in Figure 6, about 19 percent of the uninsured were eligible for group coverage through an employer, a rate that has remained around 20 percent since we began measuring it in 2001. On average, Minnesota employers assumed between 70 and 75 percent of the cost of premiums, but as noted, cost sharing (deductibles and copays) has been shifting greater responsibility for the cost of care to employees, raising the cost of group coverage for employees.
Nearly one-fourth of uninsured Minnesotans in 2017 (about 75,000 people) appeared income-eligible for premium subsidies in the individual market through MNsure, consistent with 2015.28 Premium subsidies, or Advanced Premium Tax Credits, are available to people with incomes up to 400 percent of FPG. These subsidies hold individual market premiums to a percent of income, which can help with affordability of premiums and limit the impact of premium increases.
A majority of uninsured Minnesotans, 51 percent, were potentially eligible for coverage through state public programs, Medical Assistance and MinnesotaCare. Although lower than in recent years, the high rate of public program eligibility has been a consistent pattern for the uninsured. Three factors likely explain the lower 2017 estimate:
▪ A greater number of the uninsured in 2017 were people with higher incomes, which reduces the share of income-eligible uninsured;
▪ The increase in public coverage outreach and enrollment through MNsure and assisters overall has improved take-up among income-eligible people; and
▪ Under the favorable economic circumstances with high rates of employment, fewer were income-eligible for public programs than during the great recession.
The share of the uninsured in Minnesota without a path to subsidized coverage increased in 2017, compared to 2015. The only option for these 44,000 individuals, whose income was above 400 percent FPG, was to pay for the full cost of individual market coverage.
R E S U L T S F R O M T H E 2 0 1 7 M I N N E S O T A H E A L T H A C C E S S S U R V E Y
10
Figure 6. Potential Sources of Coverage for the Uninsured
Conclusions
Research has consistently shown that people who do not have health insurance coverage are more likely to experience barriers to accessing health care, tend to have poorer self-reported health, and have more problems with medical bills.29 As such, the decline of coverage in 2017, which was one of the largest one-time drops since 2001, does not just represent a step backward, it also raises serious concerns about the ability for many Minnesotans to have timely access to needed medical services.
More long term, the survey results point to a number of areas of serious concern for the Minnesota. While the state’s rate of uninsurance is still the second lowest we have measured since 2001, the fact that the decline in health insurance coverage seen in 2017 happened during a time of high employment and economic growth raises the question of whether the tools we have in place to address shocks in coverage – subsidized public health insurance programs – are sufficient or well suited to the conditions of today.
This is particularly important in the context of the longer-term stability of the individual market and the employer-sponsored insurance market, which currently covers just over half of all Minnesotans. Should employer coverage continue to deteriorate, more Minnesotans would be left to consider purchasing unsubsidized coverage in the costly individual health insurance market. As we noted in separate research,30 however, the individual market faces considerable challenges even before federal changes are implemented (no penalty for lacking insurance) that have the potential to substantively undermine its functioning in Minnesota and elsewhere.
Policy-makers may face the triple challenge to shore up the individual market financially and through regulatory reform, while strengthening employer coverage and redesigning Minnesota public health insurance programs as workable options for a greater share of the state’s
36.7%
19.6%
67.4%
17.7%
33.4%
23.1%
59.4%~
23.5%
7.8%~
30.8%
18.6%
51.1%~
22.7%12.5%*~
0%
20%
40%
60%
80%
Connection toEmployer that offers
coverage
Eligible for employercoverage
Potentially eligible forpublic coverage
Potentially eligible forAPTC
Not eligible foremployer coverage,public coverage or
APTC (2013 does notinclude APTC
eligibility)
2013 2015 2017
Source: Minnesota Health Access Surveys, 2013 to 2017~ Indicates statistically significant difference from 2013 at the 95% level* Indicates statistically significant difference from 2015 at the 95% levelNote: The employer eligible, public eligible, APTC eligible and not eligible categories add to more than 100 percent because some of the uninsured are potentially eligible for both employer and public
R E S U L T S F R O M T H E 2 0 1 7 M I N N E S O T A H E A L T H A C C E S S S U R V E Y
11
population. The Legislature’s current interest in constraining cost growth and payers’ efforts to purchase value are key aspects of creating a more effective and sustainable health care environment. However, the slow pace at which such reforms have taken hold across the country, their limited success in cost containment, and the increasing pressure from provider consolidation suggests that additional strategies will be needed.
Methodological Notes The Minnesota Health Access (MNHA) surveys are stratified random digit dial telephone surveys, designed to produce stable estimates for regions of the state and the most populous demographic groups. In 2017, landline and cell phone interviews were completed with 12,436 respondents. The margin of sampling error is 1.51 percent. Cell phones have been a part of the sample since 2009, and beginning in 2015, prepaid cell phones have been oversampled to ensure the data represent the Minnesota population.
Consistent with national trends, the MNHA response rates have decreased over time, with a response rate of 28.8 percent in 2017. The cooperation rate of 89.4 percent has been stable over time. Each year, interviews are conducted in English and Spanish; in addition, when resources allowed, interviews were conducted in Hmong (2001 and 2004) and Somali (2001).
As in previous years, statistical weights were used to ensure that survey results are representative of the state’s population. The 2017 data were weighted to be representative of the state’s population distribution based on age, race/ethnicity, education, region, home-ownership, nativity and household size. Additionally, the data were weighted to represent what is known to date about the prevalence of cell phone households and the distribution of telephone usage by service type.
Estimates presented here for previous survey years may differ slightly from previously published results, as historical data may have been reweighted to ensure comparability over time.
Endnotes
1 Minnesota Department of Health, Health Economics Program. (2018, February). Minnesota's Uninsured in 2017: Rates and Characteristics. Retrieved from http://www.health.state.mn.us/divs/hpsc/hep/publications/mnha2017unins.pdf. 2 Unless noted otherwise, all reference to change in this issue brief are statistically significant at 95 percent confidence level. 3 Cooper, P., Davis, K., & Miller, G. E. (2017, February). Trends in enrollment, offers, eligibility and take-up for employer-sponsored insurance: Private sector, by state Medicaid expansion status, 2008-2015 (Statistical Brief No. 499). Retrieved from Agency for Healthcare Research and Quality (AHRQ) website: https://meps.ahrq.gov/data_files/publications/st499/stat499.pdf 4 Lukanen, E., Schwehr, N., & Hest, R. (2017, September). State-level trends in employer-sponsored health insurance, 2012–2016 (Chartbook). Retrieved from University of Minnesota, State Health Access Data Assistance Center (SHADAC) website: http://www.shadac.org/sites/default/files/publications/ESI_2017_Slide%20Deck_FINAL_9.8.2017.pdf. 5 Cooper, P., Davis, K., & Miller, G. E. (2017, February). Trends in enrollment, offers, eligibility and take-up for employer-sponsored insurance: Private sector, by state Medicaid expansion status, 2008-2015 (Statistical Brief No. 499). Retrieved from Agency for Healthcare Research and Quality (AHRQ) website: https://meps.ahrq.gov/data_files/publications/st499/stat499.pdf.
6 This is consistent with national surveys. There was 3 percentage point decline in firms offering health benefits from 2016 to 2017 (56 to 53 percent), though not statistically significant. Source: The Kaiser Family Foundation and Health Research & Educational Trust. (2017, September). Employer health benefits 2017 annual survey. Retrieved from https://www.kff.org/health-costs/report/2017-employer-health-benefits-survey/.
R E S U L T S F R O M T H E 2 0 1 7 M I N N E S O T A H E A L T H A C C E S S S U R V E Y
12
7 Minnesota Department of Health, Health Economics Program. (2016, December). Employment-based health insurance (Chartbook No. 3). Retrieved from http://www.health.state.mn.us/divs/hpsc/hep/chartbook/section3.pdf. 8 The Kaiser Family Foundation and Health Research & Educational Trust. (2017, September). Employer health benefits 2017 annual survey. Retrieved from https://www.kff.org/health-costs/report/2017-employer-health-benefits-survey/.
9 Katz, L. F., & Krueger, A. B. (2016, September). The rise and nature of alternative work arrangements in the United States, 1995–2015 (Working Paper No 22667). Retrieved from National Bureau of Economic Research (NBER) website: http://www.nber.org/papers/w22667.
10 Noguchi, Y. (2018, January 23). Will work for no benefits: The challenges of being in the new contract workforce. National Public Radio. Retrieved from https://www.npr.org/2018/01/23/579720874/will-work-for-no-benefits-the-challenges-of-being-in-the-new-contract-workforce.
11 Minnesota State Demographic Center. (2013, December). In the shadow of the Boomers: Minnesota’s labor force outlook. Retrieved from https://mn.gov/bms-stat/assets/in-the-shadow-of-the-boomers-labor-force-outlook-msdc-dec2013.pdf. 12 Minnesota Department of Health, Health Economics Program. (2016, December). Employment-based health insurance (Chartbook No. 3). Retrieved from http://www.health.state.mn.us/divs/hpsc/hep/chartbook/section3.pdf. 13 Centers for Medicare and Medicaid Services. (2017). National health expenditures 2016 highlights. Retrieved from https://www.cms.gov/Research-Statistics-Data-and-Systems/Statistics-Trends-and-Reports/NationalHealthExpendData/downloads/highlights.pdf. 14 Abelson, R. (2016, April 4). Despite fears, Affordable Care Act has not uprooted employer coverage. The New York Times. Retrieved from https://www.nytimes.com/2016/04/05/business/employers-keep-health-insurance-despite-affordable-care-act.html. 15 Capacity limits (also called enrollment caps) were put in place to help ensure risk was spread throughout the individual insurance market and that provider networks could be managed. Medica initially hit its 2017 enrollment cap in November of 2016, but in January, 2017 added 7,000 additional slots (see Snowbeck, C. (2017, January 31). Medica’s return to individual market means second option for 62 Minnesota counties. Star Tribune. Retrieved from: http://www.startribune.com/medica-returns-to-individual-market-bringing-a-second-insurance-option-to-60-minnesota-counties/412282333/). A good summary of enrollment caps is available from MNsure: https://www.mnsure.org/shop-compare/about-plans/caps/index.jsp. 16 On January 30, 2017 the Minnesota Legislature passed, and the Governor signed, a bill that provided a 25% premium rebate for all individual market enrollees who were not receiving federal subsidies. 2017 Minnesota Sessions Laws Chapter 2, Article 1. Due to the timing of this action, the majority of Minnesotans made their coverage decisions before the rebate was passed; the rebate was provided directly by health insurance companies, who were reimbursed by the state of Minnesota. 17 Minnesota Department of Health, Health Economics Program. (2018, January). Evaluating the stability of Minnesota’s individual insurance market. Retrieved from http://www.health.state.mn.us/divs/hpsc/hep/individualmarket.pdf. 18 The zip code approximation for Rural-Urban Commuting Areas (RUCAs) was used to define four primary geography areas: Urban, Large Town, Small Town and Isolated Rural. RUCA codes were developed to better characterize urban/rural status by recognizing their relationship with work and commuting patterns, and independent of county boundaries. This takes into account counties which may be rural in nature but encompass a city, in turn labeling the county as urban. An example is the city of Duluth, which could skew St. Louis county in appearing to be urban. Further discussion, and a map, is available at: Minnesota State Demographic Center (2017, Janary). Greater Minnesota Refined & Revisited. Retrieved from: https://www.leg.state.mn.us/docs/2017/mandated/170097.pdf. 19 Minnesota Department of Health, Health Economics Program. (2015, February). Health insurance coverage in Minnesota: Results from the 2015 Minnesota Health Access Survey. Retrieved from http://www.health.state.mn.us/divs/hpsc/hep/publications/coverage/healthinscovmnhas2015brief.pdf 20 Potential eligibility for tax credits is based on family income and eligibility for employer sponsored health insurance coverage (group coverage). 21 Call, K. T., Lukanen, E., Spencer, D., Alarcón, G., Pintor, J. K., Simon, A. B., & Gildemeister, S. (2015). Coverage gains after the Affordable Care Act among the uninsured in Minnesota. American Journal of Public Health, 105(Suppl 5): S658-S664. doi: 10.2105/AJPH.2015.302837. Retrieved from https://www.ncbi.nlm.nih.gov/pmc/articles/PMC4627514/. 22 Minnesota Department of Health, Health Economics Program (2014, February). Health care access in Minnesota, baseline analysis for assessing the impact of health reform in the state. Retrieved from http://www.health.state.mn.us/divs/hpsc/hep/publications/coverage/acaissuebrief0214.pdf. 23 Collins, S. R., Gunja, M. Z., & Doty, M. M. (2017, September) Following the ACA repeal-and-replace effort, where does the U.S. stand on insurance coverage. Retrieved from The Commonwealth Fund website: http://www.commonwealthfund.org/~/media/files/publications/issue-brief/2017/sep/collins_2017_aca_tracking_survey_ib_v2.pdf.
R E S U L T S F R O M T H E 2 0 1 7 M I N N E S O T A H E A L T H A C C E S S S U R V E Y
13
24 The Kaiser Family Foundation. (2017, November). Kaiser health tracking poll – November 2017: The role of health care in the Republican tax plan. Retrieved from http://files.kff.org/attachment/Topline-Kaiser-Health-Tracking-Poll-November-2017 25 Collins, S. R., Gunja, M. Z., & Doty, M. M. (2017, September) Following the ACA repeal-and-replace effort, where does the U.S. stand on insurance coverage. Retrieved from The Commonwealth Fund website: http://www.commonwealthfund.org/~/media/files/publications/issue-brief/2017/sep/collins_2017_aca_tracking_survey_ib_v2.pdf.
26 The Kaiser Family Foundation and Health Research & Educational Trust. (2017, September). Employer health benefits 2017 annual survey. Retrieved from https://www.kff.org/health-costs/report/2017-employer-health-benefits-survey/.
27 The ACA created three programs (often called “the 3 Rs”) to help stabilize the individual health insurance market: Risk Adjustment, Reinsurance and Risk Corridors. Risk Adjustment is a permanent program, while the Reinsurance and Risk Corridor Program were three-year programs that ended after 2016. Congress did not appropriate funds for the Risk Corridor program. MDH estimates that Minnesota health plans are still owed more than $52.8 million of the $62.9 million Risk Corridor payments from 2014, and have received no payments for 2015 or 2016. Cost Sharing Reduction (CSR) payments were designed as an additional subsidy to limit cost sharing (e.g. deductibles, co-payments) for enrollees in the individual market with incomes below 250 percent FPG. Funds have not been appropriated by Congress, but were being payed by the federal government until September 2017, when the administration decided to stop making payments. 28 As mentioned previously, most people who have individual health insurance coverage and are eligible for subsidies are receiving them. This is the number of people who do not have health insurance coverage, but based on their income and access to employer coverage, they would likely be eligible for a subsidy if they enrolled in individual health insurance coverage through MNsure. 29 Minnesota Department of Health, Health Economics Program. (2013, November). Utilization of Health Care by Insurance Status. Retrieved from http://www.health.state.mn.us/divs/hpsc/hep/publications/utilization/utilofhealthcareinsstatus.pdf; Minnesota Department of Health, Health Economics Program (2014, February). Health care access in Minnesota, baseline analysis for assessing the impact of health reform in the state. Retrieved from http://www.health.state.mn.us/divs/hpsc/hep/publications/coverage/acaissuebrief0214.pdf; and The Kaiser Family Foundation (2017 November). Key Facts about the Uninsured Population. Retrieved from http://files.kff.org/attachment/Fact-Sheet-Key-Facts-about-the-Uninsured-Population. 30 Minnesota Department of Health, Health Economics Program. (2018, January). Evaluating the stability of Minnesota’s individual insurance market. Retrieved from http://www.health.state.mn.us/divs/hpsc/hep/individualmarket.pdf.
Minnesota Department of Health Health Economics Program PO Box 64882 St. Paul, MN 55164-0882 651-201-3550 [email protected] www.health.state.mn.us/healtheconomics
02/20/2018
To obtain this information in a different format, call: 651-201-3550. Printed on recycled paper.