minnesota slip qa project plan table of contents
TRANSCRIPT


Minnesota Slip QA Project Plan Table of Contents
Revision No.: 0 01/03/00
Page ii
TABLE OF CONTENTS
Section Page
List of Tables...........................................................................................................................viiList of Figures ........................................................................................................................viiiList of Abbreviations and Acronyms ....................................................................................... ix
A PROJECT MANAGEMENT ....................................................................................... 11 Project/Task Organization................................................................................. 1
1.1 Purpose/Background ............................................................................. 11.2 Roles and Responsibilities .................................................................... 1
1.2.1 MPCA Personnel....................................................................... 11.2.2 GLNPO Personnel..................................................................... 61.2.3 Contract Laboratories................................................................ 7
2 Problem Definition/Background ..................................................................... 122.1 Purpose/Background ........................................................................... 122.2 Problem Statement and Background ................................................... 20
2.2.1 Introduction ............................................................................. 202.2.2 Site Description ....................................................................... 202.2.3 Past Data Collection Activities ............................................... 262.2.4 Intended Data Usages.............................................................. 28
3 Project/Task Description and Schedule........................................................... 283.1 Purpose/Background ........................................................................... 283.2 Description of the Work to be Performed ........................................... 29
4 Quality Objectives and Criteria for Measurement Data.................................. 334.1 Purpose/Background ........................................................................... 334.2 Specifying Quality Objectives ............................................................ 334.3 Specifying Measurement Performance Criteria .................................. 39
4.3.1 Precision .................................................................................. 394.3.2 Bias.......................................................................................... 414.3.3 Accuracy.................................................................................. 414.3.4 Representativeness .................................................................. 424.3.5 Comparability.......................................................................... 424.3.6 Completeness .......................................................................... 43
5 Special Training Requirements/Certification.................................................. 445.1 Purpose/Background ........................................................................... 445.2 Training ............................................................................................... 445.3 Certification......................................................................................... 44

Minnesota Slip QA Project Plan Table of Contents
Revision No.: 0 01/03/00 Page iii
TABLE OF CONTENTS
Section Page
6 Documentation and Records ........................................................................... 446.1 Purpose/Background ........................................................................... 446.2 Information Included in the Reporting Packages................................ 45
6.2.1 Field Operation Records.......................................................... 456.2.2 Laboratory Records ................................................................. 456.2.3 Data Handling Records ........................................................... 46
6.3 Data Reporting Package Format and Documentation Control............ 466.4 Data Reporting Package Archiving and Retrieval .............................. 48
B MEASUREMENT/DATA ACQUISITION ............................................................... 491 Sampling Process Design (Experimental Design) .......................................... 49
1.1 Purpose/Background ........................................................................... 491.2 Scheduled Project Activities, Including Measurement
Activities ............................................................................................. 491.3 Rationale for the Design...................................................................... 491.4 Design Assumptions............................................................................ 501.5 Procedures for Locating and Selecting Environmental Samples ........ 501.6 Classification of Measurements as Critical or Noncritical.................. 571.7 Validation of any Nonstandard Methods ............................................ 57
2 Sampling Methods Requirements ................................................................... 572.1 Purpose/Background ........................................................................... 572.2 Sample Collection, Preparation, and Decontamination
Procedures ........................................................................................... 572.2.1 Sampling Methods................................................................... 572.2.2 Sampling Method Requirements............................................. 582.2.3 Decontamination Procedures................................................... 59
2.3 Support Facilities for Sampling Methods............................................ 602.4 Sampling/Measurement System Failure Response and
Corrective Action Process................................................................... 602.4.1 Correction Action Process....................................................... 602.4.2 Field Corrective Action........................................................... 61
2.5 Sampling Equipment, Preservation, and Holding TimeRequirements....................................................................................... 62
3 Sample Handling and Custody Requirements................................................. 623.1 Purpose/Background ........................................................................... 623.2 Sample Custody Procedure ................................................................. 62

Minnesota Slip QA Project Plan Table of Contents
Revision No.: 0 01/03/00
Page iv
TABLE OF CONTENTS
Section Page
4 Analytical Methods Requirements .................................................................. 704.1 Purpose/Background ........................................................................... 704.2 Subsampling........................................................................................ 704.3 Preparation of the Samples.................................................................. 704.4 Analytical Methods ............................................................................. 704.5 Toxicity Testing Methods ................................................................... 70
5 Quality Control Requirements ........................................................................ 735.1 Purpose/Background ........................................................................... 735.2 QC Procedures..................................................................................... 73
6 Instrument/Equipment Testing, Inspection, and MaintenanceRequirements................................................................................................... 826.1 Purpose/Background ........................................................................... 826.2 Testing, Inspection, and Maintenance................................................. 82
6.2.1 Field Activities ........................................................................ 826.2.2 Laboratory Activities............................................................... 84
7 Instrument Calibration and Frequency............................................................ 857.1 Purpose/Background ........................................................................... 857.2 Instrumentation Requiring Calibration................................................ 857.3 Calibration Methods that will be Used for Each Instrument............... 85
7.3.1 Field Instrument Calibration ................................................... 857.3.2 Laboratory Instrument Calibration.......................................... 85
7.4 Calibration Apparatus ......................................................................... 877.5 Calibration Standards .......................................................................... 877.6 Calibration Frequency......................................................................... 87
8 Inspection/Acceptance Requirements for Supplies and Consumables ........... 888.1 Purpose ................................................................................................ 888.2 Identification of Critical Supplies and Consumables.......................... 888.3 Establishing Acceptance Criteria ........................................................ 888.4 Inspection of Acceptance Testing Requirements and Procedures ...... 888.5 Tracking and Quality Verification of Supplies and Consumables...... 88
9 Data Acquisition Requirements (Non-Direct Measurements) ........................ 899.1 Purpose/Background ........................................................................... 899.2 Acquisition of Non-Direct Measurement Data ................................... 89
10 Data Management ........................................................................................... 8910.1 Purpose/Background ........................................................................... 8910.2 Data Recording.................................................................................... 90
10.2.1 Field Data Recording .............................................................. 90

Minnesota Slip QA Project Plan Table of Contents
Revision No.: 0 01/03/00
Page v
TABLE OF CONTENTS
Section Page
10.2.2 Laboratory Data Recording..................................................... 9010.3 Data Validation ................................................................................... 9110.4 Data Transformation ........................................................................... 9110.5 Data Transmittal.................................................................................. 9110.6 Data Reduction.................................................................................... 9110.7 Data Analysis ...................................................................................... 9210.8 Data Tracking...................................................................................... 9210.9 Data Storage and Retrieval.................................................................. 92
C ASSESSMENT/OVERSIGHT.................................................................................... 931 Assessment ...................................................................................................... 93
1.1 Purpose/Background ........................................................................... 931.2 Assessment Activities and Project Planning ....................................... 93
1.2.1 Assessment of the Subsidiary Organizations .......................... 931.2.2 Assessment of Project Activities............................................. 93
1.3 Documentation of Assessments .......................................................... 941.3.1 Number, Frequency, and Types of Assessments..................... 941.3.2 Assessment Personnel ............................................................. 941.3.3 Schedule of Assessment Activities ......................................... 941.3.4 Reporting and Resolution of Issues......................................... 94
2 Reports to Management .................................................................................. 962.1 Purpose/Background ........................................................................... 962.2 Frequency, Content, and Distribution of Reports ............................... 962.3 Identify Responsible Organizations .................................................... 96
D DATA VALIDATION AND USABILITY ................................................................ 981 Data Review, Validation, and Verification Requirements.............................. 98
1.1 Purpose/Background ........................................................................... 981.2 Sampling Design ................................................................................. 981.3 Sample Collection Procedures ............................................................ 981.4 Sample Handling ................................................................................. 981.5 Analytical Procedures ......................................................................... 991.6 Quality Control.................................................................................... 991.7 Calibration........................................................................................... 991.8 Data Reduction and Processing......................................................... 100

Minnesota Slip QA Project Plan Table of Contents
Revision No.: 0 01/03/00
Page vi
TABLE OF CONTENTS
Section Page
2 Validation and Verification Methods............................................................ 1002.1 Purpose/Background ......................................................................... 1002.2 Process for Validating and Verifying Data ....................................... 100
2.2.1 Procedures Used to Validate Field Data .............................. 1002.2.2 Procedures Used to Validate Laboratory Data .................... 100
3 Reconciliation with Data Quality Objectives................................................ 1013.1 Purpose/Background ......................................................................... 1013.2 Reconciling Results with DQOs ....................................................... 101
E REFERENCES..…………………………………………………………………….102
APPENDIX A: Documented Storm Water Discharges to Minnesota SlipAPPENDIX B: Contingency Tables (MacDonald et al., 1998)APPENDIX C: GLNPO’s SOP for Operating the VibrocorerAPPENDIX D: GLNPO’s Field Safety Plan for Minnesota SlipAPPENDIX E: MPCA’s Equipment Decontamination SOPAPPENDIX F: Analytical SOPsAPPENDIX G: Toxicity Testing SOPsAPPENDIX H: ENSR’S QA ManualAPPENDIX I: MDH’S QA ManualAPPENDIX J: En Chem, Inc.’s Statement of Qualifications-------------------------------------------------------------------------------------------------DISTRIBUTION LIST
Lanny Peissig, MPCA (Supervisor)Judy Crane, MPCA (Principal Investigator) Harold Wiegner, MPCA (Field Team Leader) Kim Sandrock, MPCA (QA Coordinator) Keith Lodge, University of Minnesota—Duluth (Laboratory Activities)Greg Graf, En Chem, Inc. (QA Officer)Tod Noltemeyer, En Chem, Inc. (Laboratory Activities)Cheryl Scholten, Minnesota Department of Health (MDH) (QA Officer)Paul Swedenborg, MDH (Laboratory Activities)Keith Peacock, MDH (Laboratory Activities)Anita Rehner, ENSR (QA Coordinator)David Pillard, ENSR (Laboratory Activities)Scott Cieniawski, Great Lakes National Program Office (GLNPO) (Project Officer)Louis Blume, GLNPO (QA Officer) Joe Bonem, Deep Ocean Navigation (Field Activities)

Minnesota Slip QA Project Plan Table of Contents
Revision No.: 0 01/03/00 Page vii
LIST OF TABLES
Table Page
A-1 Contaminated Sediment Studies Conducted in the St. Louis RiverAOC since 1992 .................................................................................................15
A-2 Inventory of Historical Land Uses Around Minnesota Slip...............................25A-3 Ranges of Contaminant Concentrations in Minnesota Slip ...............................27A-4 Chemical and Physical Parameters to be Measured in Minnesota Slip .............31A-5 Schedule of Major Milestones............................................................................32A-6 Summary of Analytical Data Quality Indicators for Sediment Samples ...........40B-1 Sediment Sampling Scheme for Sectioning Sediment Cores and
Collecting Field Replicates from Minnesota Slip ..............................................56B-2 Sediment Sample Volume, Container, Preservation, and Holding
Time Requirements ............................................................................................63B-3 MPCA Environmental Outcomes Division Sample Tracking/Test
Request Form .....................................................................................................65B-4 ENSR’s Chain-of-Custody Record Form...........................................................66B-5 Front Page of MPCA’s Sediment MDH Lab Sheet ...........................................67B-6 Back Page of MPCA’s Sediment MDH Lab Sheet............................................68B-7 Summary of Analytical Methods for Sediment Samples ...................................71B-8 Recommended Test Conditions for Conducting a 10-day Sediment
Toxicity Test with Chironomus tentans .............................................................74B-9 Test Acceptability Requirements for a 10-day Sediment Toxicity
Test with Chironomus tentans ..........................................................................75B-10 Test Conditions for Conducting a 42-day Sediment Toxicity Test
with Hyalella azteca...........................................................................................76B-11 General Activity Schedule for Conducting a 42-day Sediment
Toxicity Test with Hyalella azteca ....................................................................77B-12 Test Acceptability Requirements for a 42-day Sediment Toxicity
Test with Hyalella azteca...................................................................................78B-13 Summary of Analytical Quality Control Checks for Critical
Measurements.....................................................................................................81B-14 Summary of Calibration Methods for Analytes in Sediment and
Toxicity Testing Water Column Samples ..........................................................86
Minnesota Slip QA Project Plan Table of Contents
Revision No.: 0 01/03/00 Page viii
LIST OF FIGURES
Figure Page
A-1 General project organization chart .......................................................................2A-2 Project organization chart for ENSR....................................................................3A-3 Project organization chart for En Chem, Inc........................................................4A-4 Project organization chart for MDH.....................................................................5A-5 Map of the St. Louis River Area of Concern .....................................................14A-6 Location of known contaminated areas in the Duluth-Superior Harbor ............19A-7 Location of Minnesota Slip in the Duluth Harbor..............................................21A-8 Aerial photograph of Minnesota Slip .................................................................22A-9 Map of the Duluth Harbor facilities in 1887......................................................24B-1 Proposed sediment sampling sites for the Minnesota Slip sediment
remediation scoping project ...............................................................................51B-2 Location of a sediment sampling site in Minnesota Slip as part of
a 1993 sediment survey in the Duluth-Superior Harbor ....................................52B-3 Location of a sediment sampling location in Minnesota Slip as part
of the 1995 R-EMAP sampling effort ................................................................53B-4 Location of sediment stations sampled in Minnesota Slip during
August 1998 .......................................................................................................54B-5 Location of sediment sampling stations used in Minnesota Slip for
a sediment bioaccumulation study .....................................................................55B-6 Examples of sample labels to be used for this study..........................................69

Minnesota Slip QA Project Plan Table of Contents
Revision No.: 0 01/03/00
Page ix
LIST OF ABBREVIATIONS AND ACRONYMS
AA Atomic Absorption SpectroscopyADQ Audit of Data QualityAFDW Ash Free Dry WeightAOC Area of ConcernAs ArsenicASTM American Society for Testing and MaterialsAVS Acid Volatile SulfideBMP Best Management PracticeBTEX Benzene, Toluene, Ethylbenzene, and XyleneCAC Citizen’s Action CommitteeCd CadmiumCDF Confined Disposal Facilitycm CentimeterCO ColoradoCOD Chemical Oxygen DemandCPR Cardiopulmonary ResuscitationCr ChromiumCs CesiumCu CopperDECC Duluth Entertainment and Convention CenterDO Dissolved OxygenDQA Data Quality AssessmentDQI Data Quality IndicatorDQO Data Quality ObjectiveDRO Diesel Range OrganicsEPA Environmental Protection Agencyg GramGC/ECD Gas Chromatography/Electron Capture DetectionGC/MS Gas Chromatography/Mass SpectrometryGC/MS-SIM Gas Chromatography/Mass Spectrometry Selective Ion MethodologyGFAA Graphite Furnace Atomic Absorption SpectroscopyGLNPO Great Lakes National Program OfficeGPS Global Positioning SystemHa Alternative HypothesisHo Null HypothesisHCl Hydrochloric AcidHg MercuryICP Inductively Coupled Plasma Emission SpectroscopyIJC International Joint CommissionIL Illinois

Minnesota Slip QA Project Plan Table of Contents
Revision No.: 0 01/03/00
Page x
LIST OF ABBREVIATIONS AND ACRONYMS
KCl Potassium Chloridekg KilogramL LiterL:D Hours of Light and DarkLOQ Limit of Quantificationm MeterMDH Minnesota Department of HealthMDL Method Detection Limitmg MilligramMI MichiganmL Millilitermm MillimeterMN MinnesotaMNS Minnesota Slip Code Name for Sediment Samples Collected in 1994MPCA Minnesota Pollution Control AgencyMS/MSD Matrix Spike/Matrix Spike DuplicateMSR Management Systems ReviewN/A Not ApplicableNaCl Sodium ChlorideNBS National Bureau of Standardsng NanogramNi NickelNRRI Natural Resources Research InstitutePAHs Polycyclic Aromatic HydrocarbonsPb LeadPCBs Polychlorinated BiphenylsPE Performance EvaluationPEC Probable Effect ConcentrationPQL Practical Quantitation LimitQA Quality AssuranceQAPP Quality Assurance Project PlanQA/QC Quality Assurance/Quality ControlQC Quality ControlRAP Remedial Action PlanR-EMAP Regional Environmental Monitoring and Assessment ProgramRFP Request for ProposalRPD Relative Percent DifferenceRSD Relative Standard Deviation

Minnesota Slip QA Project Plan Table of Contents
Revision No.: 0 01/03/00
Page xi
LIST OF ABBREVIATIONS AND ACRONYMS
R/V Research VesselSe SeleniumSEH Short Elliot HendricksonSEM Simultaneously Extractable MetalsSETAC Society of Environmental Toxicology and ChemistrySOP Standard Operating ProcedureSRM Standard Reference MaterialTCDD Tetrachlorodibenzo-p-dioxinTCDF Tetrachlorodibenzo-p-furanTDL Target Detection LimitTEC Threshold Effect ConcentrationTOC Total Organic CarbonTSA Technical Systems Auditµg MicrogramUMD University of Minnesota--DuluthU.S. United StatesUSACOE U.S. Army Corps of EngineersUSEPA U.S. Environmental Protection AgencyWDNR Wisconsin Department of Natural ResourcesWI WisconsinZn Zinc

Minnesota Slip QA Project Plan Section A
Revision No.: 0 01/03/00
Page 1
A PROJECT MANAGEMENT
A1 PROJECT/TASK ORGANIZATION
A1.1 Purpose/Background
The Great Lakes National Program Office (GLNPO) has funded a study by the MinnesotaPollution Control Agency (MPCA) to conduct a sediment remediation scoping project inMinnesota Slip, Duluth Harbor. In order to ensure that high quality data are collected, it isessential that quality assurance/quality control (QA/QC) steps be adhered to while collecting,handling, and analyzing sediment samples. This document provides the Quality AssuranceProject Plan (QAPP) which will be followed during this investigation. As part of the QAPP, adetailed work plan is given in Section B for the field sampling component of this study.
The MPCA Principal Investigator will have overall responsibility for all phases of this project.The various quality assurance and management responsibilities of key project personnel aredefined in the following section.
A1.2 Roles and Responsibilities
The overall lines of authority for this specific project can be found in Figure A-1. Figures A-2through A-4 provide the specific lines of authority for contractual laboratories at ENSR, EnChem, Inc., and Minnesota Department of Health (MDH), respectively. These charts include allof the individuals discussed in the following subsections.
A1.2.1 MPCA Personnel
The MPCA staff associated with this project can be reached at the following address:Environmental Outcomes DivisionMinnesota Pollution Control Agency520 Lafayette RoadSt. Paul, MN 55155-4194General Phone: 1-800-657-3864Fax: 651-297-7790
Person: Responsibilities:
Lanny Peissig, Supervisor Supervise Principal InvestigatorStandards Development & Application Unit Approve contracts for technical servicesEnvironmental Research & Reporting Section Approve QAPPPhone: 651-297-1781Email: [email protected]

Minnesota Slip QA Project Plan Section A
Revision No.: 0 01/03/00
Page 2
Figure A-1. General project organization chart.
Deep Ocean NavigationP. Brooks, Field CrewJ. Bonem, R/V Mudpuppy
Captain
GLNPO Project OfficerS. Cieniawski
GLNPO QA ManagerL. Blume
CommunicationOnly
MPCA Field Team LeaderH. Wiegner
MPCA Principal InvestigatorJ. Crane
CommunicationOnly
MPCA QA CoordinatorK. Sandrock
En Chem Project ManagerT. Noltemeyer
ENSR Project ManagerD. Pillard
MDH Section ManagerJ. Kahilainen
UMD Project ManagerK. Lodge

Minnesota Slip QA Project Plan Section A
Revision No.: 0 01/03/00
Page 3
Figure A-2. Project organization chart for ENSR.
ENSR Project ManagerD. Pillard
ENSR QA OfficerA. Rehner
Lead TechniciansJ. May & D. DuFresne
TechniciansG. Stern, S. Burnett, K. Byrn,T. Golba, S. Salazar, & N. Cummings

Minnesota Slip QA Project Plan Section A
Revision No.: 0 01/03/00
Page 4
Figure A-3. Project organization chart for En Chem, Inc.
En Chem Project ManagerT. Noltemeyer
En Chem QA OfficerG. Graf
Semivolatile Organics Group LeaderD. Rude
Inorganics Group LeaderJ. Gordon
AnalystR. Osmundson
Semivolatile OrganicAnalyst
B. Rubio
Metals AnalystT. Gramling

Minnesota Slip QA Project Plan Section A
Revision No.: 0 01/03/00
Page 5
Figure A-4. Project organization chart for MDH.
MDH Section ManagerJ. Kahilainen
MDH QA OfficerC. Scholten
Organics Section SupervisorP. Swedenborg BactiChem Supervisor
K. Peacock
Metals SupervisorK. Peacock
Environmental Analyst 1R. Lind P. Bergh, Environmental Analyst 3
orL. Dankert, Environmental Analyst 2
R. Furbur, Environmental Analyst 2R. Class, Environmental Analyst 1D. VanHorn, Environmental Analyst 1

Minnesota Slip QA Project Plan Section A
Revision No.: 0 01/03/00
Page 6
Person: Responsibilities:
Judy Crane, Principal Investigator Develop request for proposals (RFPs)Standards Development & Application Unit Review responder proposalsEnvironmental Research & Reporting Section Contract out toxicology and analytical workPhone: 651-297-4068 Develop work plan and QAPPEmail: [email protected] Order supplies
Conduct field workAnalyze data and write reportPerform project and grant management tasks
Harold Wiegner, Field Team Leader Assemble suppliesGround Water & Toxics Unit Coordinate field samplingEnvironmental Monitoring & Analysis Section Coordinate sending samples to contractPhone: 651-296-9315 laboratoriesEmail: [email protected]
Kim Sandrock, QA Coordinator Review and approve QAPPBiological Monitoring Unit Conduct field and laboratory audits, asEnvironmental Monitoring & Analysis Section neededPhone: 651-296-7387 Respond to QA/QC questionsEmail: [email protected]
A1.2.2 GLNPO Personnel
The GLNPO staff and other contractors associated with this project are as follows:
Person: Responsibilities:
Scott Cieniawski, Project Officer Coordinate grant requestsU.S. EPA GLNPO Review work plan and QAPP17G Provide technical assistance, as needed77 West Jackson Boulevard Prepare GLNPO field safety planChicago, IL 60604 Coordinate use of R/V Mudpuppy for fieldPhone: 312-353-9184 samplingFax: 312-353-2018 Assist with field samplingEmail: [email protected] Review quarterly progress reports Review draft and final reports

Minnesota Slip QA Project Plan Section A
Revision No.: 0 01/03/00
Page 7
Person: Responsibilities:
Louis Blume, QA Officer Review and approve QAPPSame address as S. Cieniawski Conduct field and lab audits, as neededPhone: 312-353-2317 Provide technical assistance for QA/QCFax: 312-353-2018 questionsEmail: [email protected]
Joe Bonem, R/V Mudpuppy Captain Help transport and set-up R/V MudpuppyDeep Ocean Navigation at sitec/o EPA Warehouse Operate the R/V Mudpuppy during field102 9th St. samplingBay City, MI 48708Phone: 517-895-6182Fax: 517-895-6183
Polly Brooks, Field Crew Help transport and set-up R/V MudpuppyDeep Ocean Navigation at site(same address, phone, fax as J. Bonem) Assist with field sampling of sediments
A1.2.3 Contract Laboratories
Three different analytical laboratories will be used to analyze chemical and physical propertiesof sediment samples, whereas ENSR will be used to conduct toxicological studies of selectedsediment samples. Each laboratory will have their own provision for conducting an internalQA/QC review of the data before it is released to the MPCA. The Laboratory Project Managerwill contact the MPCA Principal Investigator with any data concerns.
QA/QC information will be included in the data packages and/or reports submitted to the MPCA.Corrective actions will be reported to the MPCA. Corrective actions will be reported to theMPCA Principal Investigator with the QA/QC section. The contract laboratories may becontacted by the MPCA Principal Investigator, GLNPO Project Officer, GLNPO QA Officer, orMPCA QA Coordinator at any time to discuss QA/QC concerns.
ENSR Staff
Staff from ENSR will be responsible for conducting two kinds of sediment toxicity tests: 10-daysediment toxicity tests using the midge, Chironomus tentans, and 42-day toxicity tests using theamphipod, Hyalella azteca. The ENSR staff associated with this project (Figure A-2) can bereached at the following address:

Minnesota Slip QA Project Plan Section A
Revision No.: 0 01/03/00
Page 8
ENSR4303 West LaPorte AvenueFort Collins, CO 80521Phone: 970-416-0916Fax: 970-493-8935
Person: Responsibilities:
David Pillard, Project Manager Ensure the tests are conducted according toEmail: [email protected] the applicable test guidelines and
appropriate Standard Operating Procedures (SOPs)Coordinate statistical analysis of dataCoordinate preparations and review of toxicity test reports
Anita Rehner, QA/QC Coordinator Review study protocols prior to study initiationConduct phase audits of the laboratoryEnsure proper implementation of applicable SOPsReview and validate laboratory dataReview toxicity test reports
Jeff May and Doree DuFresne, Lead the set-up, maintenance and tear-downLead Technicians of sediment toxicity tests
Coordinate the performance of other project tasks by other techniciansConduct routine monitoring of physico- chemical conditions during the testsConduct statistical comparisons of sample results with the negative controlOversee data review and preparation of toxicity testing sections of report
Gina Stern, Susan Burnett, Kerry Clean glassware and test vesselsByrn, Tim Golba, Sandy Salazar, Feed organisms and maintain culturesand Nicole Cummings Conduct routine monitoring of physico-Technicians chemical conditions during the tests
Perform other tasks as assigned by the Principal Technicians or Project Manager

Minnesota Slip QA Project Plan Section A
Revision No.: 0 01/03/00
Page 9
En Chem, Inc. Staff
Staff from En Chem, Inc. will be responsible for measuring the following analytes in sedimentsamples: acid volatile sulfides (AVS), simultaneously extractable metals (SEM), andpolychlorinated biphenyl (PCB) congeners. The En Chem staff associated with this project(Figure A-3) can be reached at the following address:
En Chem, Inc.525 Science DriveMadison, WI 53711Phone: 608-232-3300Fax: 608-233-0502
Person: Responsibilities:
Tod Noltemeyer, Project Manager Manage client projects to ensure that thePhone: 608-232-3310 analytical objectives of the project are metEmail: [email protected] by the laboratory staff
Schedule sample analysis and assign resourcesCommunicate issues/questions between the client and analytical staffOversee the preparation of data packagesRespond to the clients technical questions
Greg Graf, QA Officer Provide oversight of laboratory QA programPrepare and distribute SOPs and quality documentsProvide resolution of out-of-control eventsMaintain laboratory certifications and agency approvals
Daniel Rude, Semivolatile Organics Supervise the Semivolatile Organics GroupGroup Leader Schedule analyses
Monitor status of projectsMaintain semivolatile organic section SOPsMonitor EPA methods for updatesDevelop new methodologies based on regulatory demands

Minnesota Slip QA Project Plan Section A
Revision No.: 0 01/03/00 Page 10
Person: Responsibilities:
Robert Osmundson, Analyst Conduct PCB analyses of sediment samples including: sample tracking, sample preparation, analysis by electron capture gas chromatography (GC), interpretation, and data package formationMaintain GC and computer systems
Barbara Rubio, Semivolatile Organics Responsible for all BNA analyses byAnalyst GC/mass spectrometry (MS)
Develop and implement BNA methodsUpdate SOPs and QC limits, as needed
Jeffrey Gordon, Inorganics Group Leader Supervise the Inorganics groupSchedule analysesMonitor status of projectsMaintain inorganic section SOPsMonitor EPA methods for updatesDevelop new methodologies based on regulatory demands
Timothy Gramling, Metals Perform AVS and SEM analysesAnalyst Maintain standards
MDH Staff
Staff from the Minnesota Department of Health (MDH) will be responsible for measuring thefollowing analytes in sediment samples: polycyclic aromatic hydrocarbons (PAHs), mercury(Hg), cadmium (Cd), chromium (Cr), copper (Cu), lead (Pb), nickel (Ni), selenium (Se), Zinc(Zn), ammonia, total organic carbon (TOC), and percent moisture. The MDH staff associatedwith this project (Figure A-4) can be reached at the following address:
Minnesota Department of HealthPublic Health Laboratory DivisionChemical Laboratory717 Delaware Street SoutheastMinneapolis, MN 55414Phone: 612-623-5200Fax: 612-676-5514

Minnesota Slip QA Project Plan Section A
Revision No.: 0 01/03/00 Page 11
Person: Responsibilities:
Jean Kahilainen, Section Manager Manager of Chemical LaboratoryPhone: 612-676-5300 Ensure laboratory resources are availableEmail: [email protected] on an as required basis
Overview final analytical reports
Cheryl Scholten, QA Officer Provide oversight of laboratory QA programPhone: 612-676-5127 Prepare and distribute SOPs and qualityEmail: [email protected] documents
Provide resolution of out-of-control eventsMaintain laboratory certifications and agency approvals
Paul Swedenborg, Supervisor Supervisor of Organics SectionPhone: 612-676-5452 Schedule analysesEmail: [email protected] Monitor status of projects
Oversee data review and preparation of analytical reports
Robert Lind, Environmental Analyst 1 Conduct PAH analyses of sediment samples,Phone: 612-676-5452 including: sample preparation, analysis byEmail: [email protected] GC/MS-Selective Ion Monitoring (SIM),
Interpretation, and data package formationMaintain GC/MS and GC/MS-SIM
Keith Peacock, Supervisor Supervisor of BactiChem and MetalsPhone: 612-676-5305 SectionsEmail: [email protected] Schedule analyses
Monitor status of projectsConduct TOC analysesOversee data review and preparation of analytical reports
Robert Furbur, Environmental Analyst 2 Conduct mercury analysesReport results
Robert Class, Environmental Analyst 1 or Conduct metal analysesDaniel Van Horn, Environmental Analyst 1 Report results

Minnesota Slip QA Project Plan Section A
Revision No.: 0 01/03/00 Page 12
Person: Responsibilities:
Paul Bergh, Environmental Analyst 3 or Conduct ammonia analysesLisa Dankert, Environmental Analyst 2 Report results
Daniel Van Horn, Environmental Analyst 1 Conduct metal digestions and percent moisture analysesCoordinate transfer of samples to other Analysts
UMD Staff
The University of Minnesota-Duluth (UMD) Trace Organic Analytical Laboratory will beresponsible for the particle size analysis of sediment samples into sand, silt, and clay fractions.The UMD staff associated with this project can be reached at the following address:
Chemical EngineeringUniversity of Minnesota-Duluth10 University DriveDuluth, MN 55812-2496Phone: 218-726-6164Fax: 218-726-6585 or 6907
Person: Responsibilities:
Keith Lodge, Associate Professor Supervisor of Trace Organic AnalyticalEmail: [email protected] Laboratory
Provide technical assistance with particle size method developmentProvide QA review of data and prepare analytical report
Student Worker (to be determined) Conduct particle size analysesPrepare electronic spreadsheet of results
A2 PROBLEM DEFINITION/BACKGROUND
A2.1 Purpose/Background
The Duluth-Superior Harbor is one of the busiest ports in the Great Lakes area. However, thisvital harbor has seen a degree of environmental degradation. Historic and ongoing land use andwater-related activities have contributed a variety of pollutants to the St. Louis River, includingthe harbor. This contamination has led to several impaired uses including: fish consumption

Minnesota Slip QA Project Plan Section A
Revision No.: 0 01/03/00 Page 13
advisories, restrictions on dredging, and habitat impairments. In 1987, concerns overenvironmental quality conditions prompted the designation of the lower St. Louis River as one of43 Great Lakes Areas of Concern (AOCs) (IJC, 1989). This includes the area from Cloquet, MNto its entrance to Lake Superior (Figure A-5).
The International Joint Commission (IJC) is in charge of reviewing Remedial Action Plans(RAPs) for each AOC. The RAPs are being prepared in a staged approach to: 1) assess theseverity and extent of contamination, 2) to develop and implement a plan for restoring beneficialuses, and 3) to evaluate the success of any remedial (i.e., clean up) measures that are conducted.Importantly, the RAP process includes substantial citizen participation. The St. Louis RiverCitizen’s Action Committee (CAC) is working to restore and protect the St. Louis River bymoving the RAP process forward (MPCA/WDNR, 1992; 1995).
The Sediment Contamination Work Group of the St. Louis River CAC has recommended athree-phase sediment strategy to reduce impairments associated with sediment contamination(MPCA/WDNR, 1995). This strategy consists of: 1) assessment studies to locate sediment hotspots, 2) development of hot spot management plans, and 3) implementation of remediation (i.e.,clean up) actions. This strategy provides an incentive to remediate upstream sites first so thatdownstream sites will not be recontaminated.
Since 1992, the Minnesota Pollution Control Agency (MPCA) has conducted several sedimentinvestigations in the St. Louis River AOC to implement the RAP sediment strategy (Schubauer-Berigan and Crane, 1996, 1997; Crane et al., 1997; Crane 1999a, Breneman et al., In review).These projects have been conducted with the cooperation and financial assistance of either theU.S. Environmental Protection Agency (EPA) or the EPA’s Great Lakes National ProgramOffice (GLNPO). The MPCA has also worked with interested stakeholders [e.g., WisconsinDepartment of Natural Resources, CAC work groups, industry, consultants, laboratorycontractors, and collaborators (e.g., Natural Resources Research Institute)]. Thus, an ecosystem-based management approach is being used to involve all stakeholders in the decision-makingprocess of how contaminated sediment sites are assessed, managed, and remediated (MacDonaldand Crane, 1999).
The sediment data assembled to support Stage I of the RAP, and collected thereafter (Table A-1),indicate that several areas in the St. Louis River AOC are contaminated by a variety of toxic andbioaccumulative substances. Sediment assessment projects in the reservoirs downstream ofCloquet, MN, and in the lower estuary, have been conducted to determine the spatial extent ofcontamination and to assess impacts to benthic biota and fish. The weight-of-evidence data thathave been collected to date show a range of biological and chemical impacts in the reservoirs andlower estuary of the St. Louis River AOC. The primary surficial contaminant of concern in the


Minnesota Slip QA Project Plan Section A
Revision No.: 0 01/03/00 Page 15
Table A-1. Contaminated Sediment Studies Conducted in the St. Louis River AOC since 1992
Location SamplingYear(s)
Toxicity Tests Sediment Chemistry BenthicData
Reference
Thomson, Forbay, Fond du Lac 1992, 1993 Amphipod Hg, PCBs, TCDD, Cs-137 No Schubauer-Berigan & Crane (1996) Reservoirs
Duluth-Superior Harbor 1993 Amphipod, Midge, Metals, Hg, PAHs, PCBs, No Schubauer-Berigan & Crane (1997)Microtox, Mutatox TCDDs, TCDFs, Pesticides,
Ammonia, TOC, Cs-137
USX Superfund Site 1993 Amphipod, Midge, Metals, Hg, PAHs, Ammonia, No MPCA (unpublished data)Microtox, Mutatox Cyanide, Oil & Grease, TOC,
Phenol
Newton Creek/Hog Island 1993, 1994 Amphipod, Midge, Metals, Hg, DROs, PAHs, Yes Redman & Janisch (1995) Inlet Cladoceran, Oil & Grease, Ammonia,
Fathead Minnow Cyanide, TOC, Particle Size
Duluth-Superior Harbor 1994 Amphipod, Midge SEM Metals, AVS, As, Pb, Hg, Yes Crane et al. (1997)TCDDs, TCDFs, Pesticides,
PAHs, PCBs, Ammonia, TOC,Tributyltin, Particle Size
Lakehead Pipe Line 1995 Amphipod, Midge, Metals, Hg, DROs, PAHs, No Wenck Associates (1995) (North of Hog Island Inlet) Cladoceran Oil & Grease, Ammonia,
TOC, Particle Size

Minnesota Slip QA Project Plan Section A
Revision No.: 0 01/03/00 Page 16
Table A-1. Continued
Location SamplingYear(s)
Toxicity Tests Sediment Chemistry BenthicData
Reference
Upper St. Louis River; 1995 No Hg, methyl Hg, grain size No ENSR (1996) Thomson and Forbay Reservoirs
Knife Falls, Potlatch, Scanlon, 1995, 1996 No Hg Yes Glass et al. (1998) Thomson, Forbay, and Fond du Lac Reservoirs
St. Louis River AOC 1995, 1996 Amphipod, Midge, SEM Metals, AVS, Hg, PAHs, Yes Breneman et al. (In review)Microtox TOC, Particle Size and USEPA (In prep.)
Duluth-Superior Harbor 1995, 1996 Amphipod, Midge, Metals, Hg, Ammonia No TMA (1996)Cladoceran, Phosphorus, Cyanide, COD,
Fathead Minnow, TOC, Oil & Grease, PCBs,Lumbriculus PAHs, Pesticides,
Bioaccumulation Particle Size
Vicinity of WLSSD, 1996 No Toxaphene No MPCA (unpublished data) Duluth Harbor
Interlake/Duluth Tar Superfund 1996 Amphipod, Midge, SEM Metals, AVS, PAHs, TOC, Yes IT Corporation (1997) Site Microtox Metals, Hg, Ammonia, Cyanide,
BTEX, Particle Size
Slip C, Duluth Harbor 1997 No Hg, Pb, PAHs, PCBs, TOC, No Crane (1999a)Particle Size

Minnesota Slip QA Project Plan Section A
Revision No.: 0 01/03/00 Page 17
Table A-1. Continued
Location SamplingYear(s)
Toxicity Tests Sediment Chemistry BenthicData
Reference
Minnesota Slip, Duluth Harbor 1998 No Hg, Pb, PAHs, TOC No MPCA (unpublished data)
Duluth-Superior Harbor 1999 Lumbriculus Hg, PAHs, PCBs, TOC No Crane (1999b)Screening,
Bioaccumulation
Dakota Pier, Duluth Harbor 1999 No Metals, Hg, PAHs, Ammonia, No MPCA (unpublished data)Cyanide, Sulfate, TOC
Minnesota Slip, Duluth Harbor 1999 Amphipod, Midge Metals, Hg, PAHs, PCBs, No Crane (1999c)AVS, SEM, TOC,
Particle Size
Lower St. Louis River Estuary 1999 No Toxaphene, Cs-137 No King (1999)Pb-210, TOC
Sediment Chemistry: As = arsenic; Cs = cesium; Hg = mercury; Pb = lead; PAHs = polycyclic aromatic hydrocarbons;PCBs = polychlorinated biphenyls; TCDDs and TCDFs = tetrachlorodibenzo-p-dioxins and - furans;DROs = diesel range organics; SEM = simultaneously extractable metals; AVS = acid volatile sulfides;BTEX = benzene, toluene, ethylbenzene, and xylene; TOC = total organic carbon; COD = chemical oxygendemand.

Minnesota Slip QA Project Plan Section A
Revision No.: 0 01/03/00 Page 18
Thomson, Forbay, and Fond du Lac Reservoir sediments is mercury (Glass et al., 1990, 1998;Schubauer-Berigan and Crane, 1996), while historical sources of PCBs and 2,3,7,8-TCDD(dioxin) have contaminated deeper sediments in these reservoirs (Schubauer-Berigan and Crane,1996).
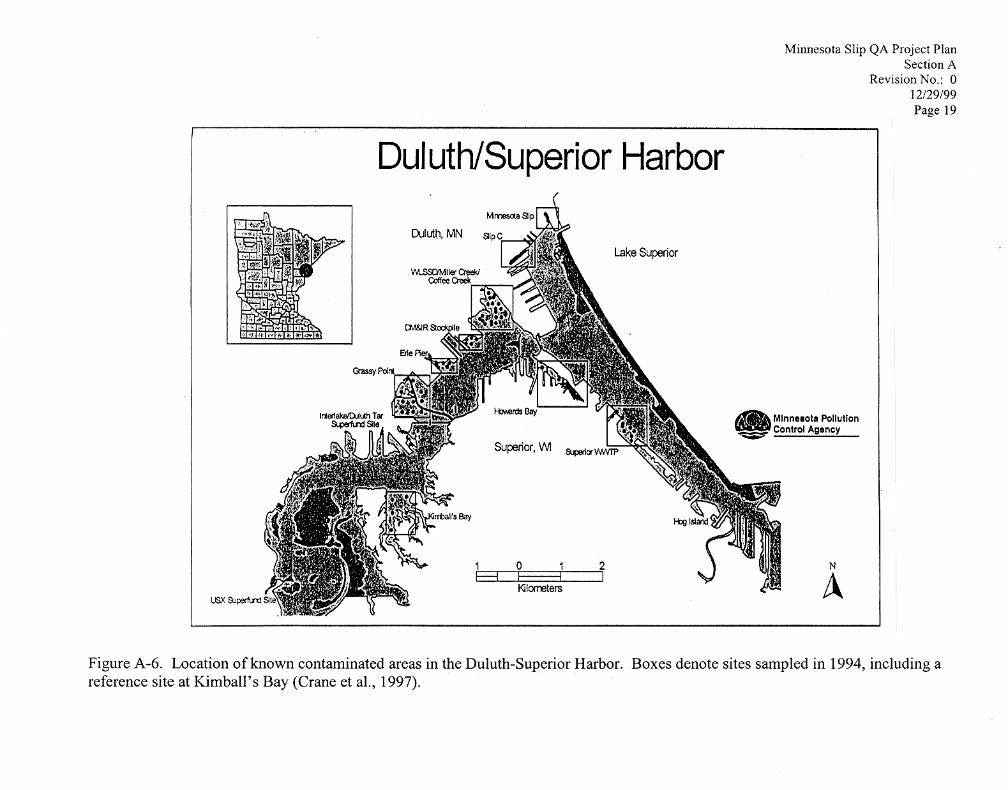
Mercury and PAHs are widespread contaminants of concern in depositional areas of the lowerSt. Louis River estuary, whereas metals, PCBs, dioxins and furans, organochlorine pesticides,tributyltin, and diesel range organics (DROs) tend to be more localized contaminants of concern(MPCA/WDNR, 1992; Redman and Janisch, 1995; Schubauer-Berigan and Crane, 1997; Craneet al., 1997; Crane, 1999a; Breneman et al., In review). The most highly contaminated sedimentsoccur within two Superfund sites (i.e., USX and Interlake/Duluth Tar) in the inner Duluth Harbor(Schubauer-Berigan and Crane, 1997; IT Corporation, 1997). Other contaminated areas in theDuluth-Superior Harbor include: Hog Island Inlet/Newton Creek in Superior, WI (Redman andJanisch, 1995), as well as several boat slips (e.g., Slip C, Minnesota Slip), areas adjacent towastewater treatment plants, and other areas with historical sources of contamination (Figure A-6) (Schubauer-Berigan and Crane, 1997; Crane et al., 1997; Crane, 1999a). The data from thesesediment studies will be included in the next update of the U.S. EPA’s National SedimentInventory; this inventory will provide comparisons of the national incidence and severity ofsediment contamination (USEPA, 1997).
Sediments from several hot spot sites in the AOC have been shown to be toxic to sediment-dwelling organisms and/or associated with alterations of benthic invertebrate communitystructure (Prater and Anderson, 1977; Redman and Janisch, 1995; Crane et al., 1997; Schubauer-Berigan and Crane, 1996, 1997; Breneman et al., In review; USEPA, In prep.). Furthermore,fish consumption advisories are in effect for selected fish species in the St. Louis River AOCbecause of mercury contamination. Most of these advisories limit fish consumption to one mealper week for the protection of human health (MDH, 1999); more restrictive advisories are ineffect for women of child bearing age and young children. In addition, health advisories are alsoin effect for the consumption of carp and lake sturgeon due to PCB contamination (MDH, 1999).
Action is currently being taken to implement source control measures and remediatecontaminated sediments at the most contaminated areas in the Duluth-Superior Harbor.Remediation options such as natural recovery, in situ treatment, capping, incineration, and/orconfined disposal of dredged materials are being considered at both Superfund sites. At the HogIsland Inlet/Newton Creek site, some sediments have already been dredged and disposed of in adesignated landfill as the first phase of the clean-up efforts. A remediation scoping project atSlip C, in the Duluth Harbor, has been completed to further delineate the extent of contaminationand to develop a short-list of potential remediation options (Crane, 1999a).
The results of some of these recent sediment investigations have shown that several areas withinthe St. Louis River AOC are relatively clean. For example, the areas located in the estuary
Minnesota Slip QA Project Plan Section A
Revision No.: 0 01/03/00 Page 20
upstream of the USX Superfund site in Morgan Park, MN and Allouez Bay in Superior, WI,have low concentrations of contaminants (MPCA and WDNR, 1992; Schubauer-Berigan andCrane, 1997; Breneman et al., In review). These areas provide important fisheries and wildlifehabitat. These clean sites also represent reference areas for determining background levels ofanthropogenic contaminants in the lower estuary. In addition, the Duluth-Superior Harborshipping channels contain substantial quantities of relatively clean materials. These dredgedmaterials are washed at the Erie Pier confined disposal facility (CDF) in Duluth, and the sand-sized particles are re-used for beach nourishment, habitat development, highway construction,and other beneficial uses (USACOE, 1997).
A2.2 Problem Statement and Background
A2.2.1 Introduction
Minnesota Slip is located in the northern section of the Duluth Harbor basin between Canal Parkand the Duluth Entertainment and Convention Center (DECC) (Figure A-7). Previous sedimentassessment studies have shown that portions of the slip are contaminated with moderately highlevels of bioaccumulative contaminants (e.g., PAHs, PCBs, and mercury) and other contaminants(e.g., metals) (Schubauer-Berigan and Crane, 1997; Crane et al., 1997; unpublished R-EMAPand MPCA data; AScI Corporation, 1999). This contamination is of additional concern becauseof the close proximity of Minnesota Slip to the Duluth entry of Lake Superior.
Past studies of the Duluth-Superior Harbor have not allowed the opportunity to examine the fullextent of contamination, and associated bioeffects, in Minnesota Slip. This is partly due to thegreat expense associated with carrying out these investigations. In order to fully quantify thedegree of contamination, and potential for toxicity, the MPCA will be conducting a sedimentremediation scoping project in Minnesota Slip.
A2.2.2 Site Description
The present day land use around Minnesota Slip is geared toward tourism. The northeast side ofthe slip is bounded by a parking lot and commercial businesses in Canal Park (e.g., restaurantsand small retail stores), whereas the southwest side of the slip is bounded by Harbor Avenue andthe DECC. The slip itself is used to permanently dock the SS William A. Irvin, a formerflagship of U.S. Steel’s fleet of ore carriers. Since 1986, it has been used as a floating museumadministered by the DECC. The Irvin takes up about one-third of the slip as shown in Figure A-8. The rest of the slip houses a marina for commercial and private boat owners. In addition, oneof the Vista fleet boats is docked in the outer part of the slip; the Vista fleet boats offer harborand dinner cruises. Entry into the slip is restricted by a drawbridge. The bridge acts as a waveretention wall that decreases washout of the slip.


Minnesota Slip QA Project Plan Section A
Revision No.: 0 01/03/00 Page 23
Four known storm sewers, and one unknown storm sewer, drain into Minnesota Slip. Two otherstorm sewers discharge from the breakwall immediately outside of the slip. The City of Duluth,Department of Public Works--Sewer Division, has provided the MPCA with a map of the knownstorm water drainage into Minnesota Slip (Appendix A). Most of the drainage area borders thedowntown business area of Duluth and adjacent residential neighborhoods; this area extendsfrom 2nd Avenue West to 1st Avenue East up to 14th Street. Storm sewers that drain Canal Parkand Commerce Street also discharge into the slip.
Local charter boat operators have called the U.S. Coast Guard on several occasions to report oilslicks on the water after rainstorm events. Oil and grease, as well as garbage, appear to beflushed into the slip primarily from the most inland storm sewers. The city of Duluth has createda Storm Water Utility that will seek out funding to update the maps of the storm water systemand make improvements to the system. This would include the implementation of bestmanagement practices (BMPs) such as the use of sediment traps, retention ponds and filters. Apre-proposal submitted to GLNPO last year, by the city of Duluth, was unsuccessful in obtainingfunding for a contaminant loading study in Minnesota Slip. This type of study would havehelped to determine the direction and types of emphasis required for the selection of BMPs.
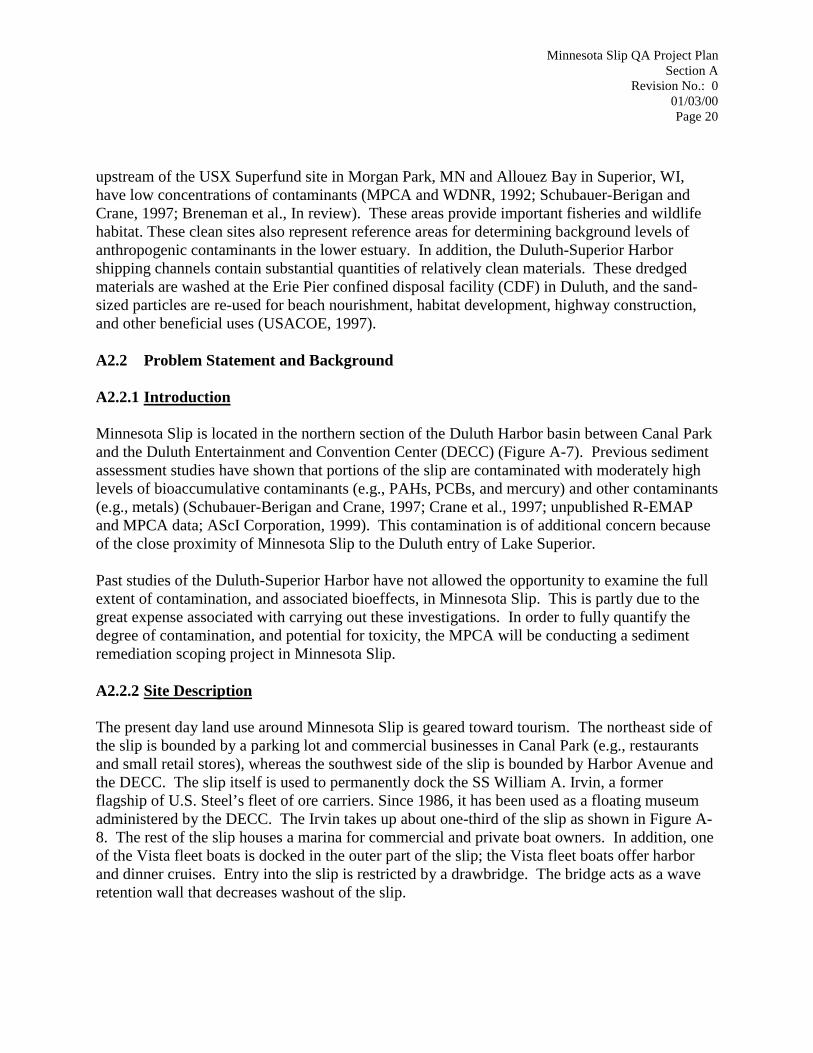
Historically, Minnesota Slip has undergone several physical modifications since Europeansettlement of the area. The area encompassing the northern section of the Duluth Harbor wasinitially swampland. Modern development of the harbor began after 1861 (Walker and Hall,1976). Construction of the Duluth Ship Canal was started in 1870, thereby providing a Duluthentry into the harbor from Lake Superior. A map of the harbor, circa 1887, shows that some ofthe current slip had already been formed through dredging operations (Figure A-9). The slipused to be called the Marshall Wells slip, and there was a Marshall Wells building adjacent to it;part of this building is now called the Meyerhoff building.
Several historical photos of the slip are retained at the Corps of Engineers Maritime Museum inDuluth. A photo taken in 1904 shows a coal yard just south of Minnesota Slip that waseventually replaced by a scrap yard. The slip used to also have a double train freight shed justwest of the slip. A May 1, 1929 photo of the slip shows a pile of material to the north of the slipthat appears to be coal. Another historical photo shows workers dumping wheelbarrows full ofmaterial into the slip, approximately half-way down the northeast side of the slip. As of 1931,there was another slip just southwest of Minnesota Slip; this area is now filled in. Over time,parts of Minnesota Slip have been dredged out and filled in. Additional historical informationabout surrounding land uses in the vicinity of Minnesota Slip is given in Table A-2 (D. Kellner,Duluth, personal communication, August, 1999).

Minnesota Slip QA Project Plan Section A
Revision No.: 0 01/03/00 Page 25
Table A-2. Inventory of Historical Land Uses around Minnesota Slip
Date of Beginning EndingDevelop- Date of Date of
Property Name ment Operation Operation AddressA.H. Thompson Planing Mill (Geo. Lautenschlager) 1872 1872 1890 7610 - 7614 Lake Ave.Gowan-Lenning Brown Co. Grocery Wharf 1878 1935 525 S. Lake Ave.Crowley-Brown Sandstone Wharf 1878 1895N. Grigon Shipyard, Shipbuilding and Repair Wharf 1880 1880 1895Northern Pacific No. 5 & No. 6 1883 1883 1950 Industrial Slip (E side) and Minnesota Slip (W side)Scott & Holston Planing Mill c. 1880 1884 1501 - 1520 Lake Ave.St. Paul & Duluth Railroad Cos. Warehouse 1884 2nd Ave. W. & Waterfront (west side of Minnesota Slip)Marquis De Mares- Cold Storage House 1884 1884 7607 Lake AvenueStone & Ordean Wholesale Grocery Warehouses 1884 1884 1940 1604 Lake Ave.; later 525 Lake Ave. S.C. H. Graves & Co. Salt Lime Cement & Plaster Warehouses 1884 1924 1604-1706 Lake Ave.Asa Dailey's Lumber Yard c. 1885 1885 1890Marshall Wells Hardware Company and Dock 1889 1889 1950 301 or 325 Lake Ave. S.Booth Fisheries Co. Fish & Merchandise Wharf 1894 1894 1940 20 W. MorseWhitney Materials Co. Sand & Gravel Wharf 1895 1895 1940 15 BuchananStandard Salt & Cement Co. Wharf 1895 1960 237-245 Lake Ave.White Line Transportation Co. Freight & Passenger Wharf 1895 1940Christiansen & Sons, Inc. Fish Wharf 1905 1935 20 W. MorseScandia Fish Co. Wharf 1908 1920City of Duluth Public Wharf 1910 1940Rust-Parker Co. Grocery Wharf 1911 1940 217-219 Lake Ave. S.City of Duluth Public Wharf 1915 1940Christiansen & Sons 1927 20 W. MorseJohnson, Sam & Sons, Fisheries 1927 19. W MorseUnited States & Doninin Trans. Co. 1930 20 W MorseDuluth Ice & Fuel Co. 1935 102 BuchananMacAskill-Monaghan Co. 1950 1960 227 Lake Ave. S.Stone & Ordean Building 1884 1950 1960 1604 Lake Ave.; later 525 Lake Ave. S.Jeno's Inc. 1884 1970 1970 1604 Lake Ave.; later 525 Lake Ave. S.

Minnesota Slip QA Project Plan Section A
Revision No.: 0 01/03/00 Page 26
A2.2.3 Past Data Collection Activities
Minnesota Slip has been included in the following MPCA sediment assessment studies for theSt. Louis River AOC:
• Survey of sediment quality in the Duluth-Superior Harbor: 1993 sampling results(Schubauer-Berigan and Crane, 1997) (one core site in Minnesota Slip).
• Sediment assessment of hot spot areas in the Duluth-Superior Harbor (Crane et al., 1997)
(five core sites in Minnesota Slip). • Regional Environmental Monitoring and Assessment Program (R-EMAP) surveying,
sampling and testing: 1995 and 1996 sampling [one surficial (0-5cm) site sampled in 1995and resampled in 1996 in Minnesota Slip].
• Minnesota Slip sampling to assess PAH analytical techniques (unpublished MPCA data
1998) (two core sites and three surficial sites) • Bioaccumulation of contaminants in the Duluth-Superior Harbor (AScI Corporation, 1999)
(four surficial sites). The aforementioned studies have provided bits of information about sediment quality conditionsin Minnesota Slip. Taken together, these bits of information provide a “weight-of-evidence”about: contaminants of concern, potential for short-term and long-term toxicity to bottomfeeding (i.e., benthic) organisms living in the sediments, potential for changes in the communitystructure of naturally occurring benthic organisms, and potential for bioaccumulation of certaincontaminants (like mercury) in the base of the aquatic food chain. These studies have given rise to concerns of extensive contamination in Minnesota Slipsediments. The most contaminated sediments are located in the inner part of the slip. Some sitesare contaminated with oil to as deep as 1.6 m. Contaminants of concern include: PAHs, PCBs,mercury, cadmium, chromium, copper, lead, nickel, zinc, acid volatile sulfides (AVS),simultaneously extractable metals (SEM), toxaphene, p,p’-DDD and o,p’-DDT, and KCI-extractable ammonia (Schubauer-Berigan and Crane, 1997; Crane et al., 1997; unpublished R-EMAP and MPCA data; AScI Corporation, 1999). The concentration ranges of contaminants ofconcern, and other parameters, are given in Table A-3. A limited number of 10-day toxicity tests, with Hyalella azteca and Chironomus tentans, havenot revealed significant acute toxicity to the sediments, although sediments from the mostcontaminated area of the slip have not been tested (Schubauer-Berigan and Crane, 1997; Crane et

Minnesota Slip QA Project Plan Section A
Revision No.: 0 01/03/00 Page 27
Table A-3. Ranges of Contaminant Concentrations in Minnesota Slip (Schubauer-Berigan andCrane, 1997; Crane et al., 1997; unpublished R-EMAP and MPCA data) Contaminant
Concentration
Total PAHs 5.7-320 mg/kg PCBs 7.8-612 µg/kg Mercury 0.075-1.6 mg/kg Lead 31-280 mg/kg Cadmium 2.6 mg/kg Chromium 49.8 mg/kg Copper 83.2 mg/kg Nickel 30.7 mg/kg Zinc 214 mg/kg AVS 1.43-1.54 µmol/g SEM 5.36-7.59 µmol/g Toxaphene 147-204 µg/kg p,p’-DDD & o,p’-DDT 10 µg/kg KCI-extractable ammonia 10.2-138 mg/kg Other Parameters TOC 0.67-8.3% Particle Size Sand 48.2-96.9% Silt 2.0-40%

Minnesota Slip QA Project Plan Section A
Revision No.: 0 01/03/00 Page 28
al., 1997). The surficial sediments are populated primarily with pollutant tolerant worms (i.e.,oligochaetes) (Crane et al., 1997). The results of some bioaccumulation studies indicated thatbenthic worms accumulated PAH compounds in their tissues, but little PCBs or mercury wereaccumulated (AScI Corporation, 1999). Thus, this slip has been designated as a hot spot area ofelevated contamination where there is the potential for biological impairments to the benthiccommunity. A2.2.4 Intended Data Usages The MPCA anticipates using the results of this project to determine the spatial extent ofcontaminants of concern, as well as the potential toxicity of the sediments to benthicinvertebrates through short-term and long-term toxicity tests. Intended data usages are toprovide information to assist in the development of possible remediation options for MinnesotaSlip, including natural recovery. The decisions to be applied from this project will encompasssediment management activities at Minnesota Slip. These activities could include:implementation of point/nonpoint source controls, sediment remediation, and/or dredgedmaterial management. The MPCA’s Remediation Unit in the North District will be responsiblefor taking over this site for the implementation of any remediation options. Other expected data users are the members of the St. Louis River CAC and CAC SedimentContamination Work Group in developing recommendations for sediment managementalternatives. The city of Duluth Sewer Division, university researchers, local planning agencies,and environmental groups may also use these sediment data. The data will be added toGLNPO’s sediment database for the St. Louis River AOC, as well as to the Corps of Engineer’ssediment database for the Duluth-Superior Harbor. A3 PROJECT/TASK DESCRIPTION AND SCHEDULE A3.1 Purpose/Background In order to conduct a sediment remediation scoping project in Minnesota Slip, the followingproject objectives will be met: • Delineate the extent and depth of selected sediment contaminants in Minnesota Slip. • Determine the acute and chronic toxicity of surficial sediments to selected benthic
invertebrates. • Estimate the volume of contaminated sediments in the inner 75% of the slip. • Develop a short list of sediment remediation options for further consideration.

Minnesota Slip QA Project Plan Section A
Revision No.: 0 01/03/00 Page 29
The following section will describe the work tasks to be conducted and the associated QA/QCgoals, procedures, and timetables for collecting the measurements. A3.2 Description of the Work to be Performed Specific work tasks (and responsible organizations for completing tasks) include the following: • Inform the Minnesota Department of Health that the MPCA will use them for PAH, mercury,
cadmium, chromium, copper, lead, nickel, selenium, zinc, ammonia, TOC, and percentmoisture analyses (no contract required). (MPCA)
• Prepare contracts, per MPCA requirements, for other analytical and toxicity testing services,
including:
• Develop and distribute Request for Proposals (RFPs) for soliciting toxicity testinglaboratory and analytical laboratory bids for work exceeding $10,000. Reviewresponder proposals and select the laboratories (En Chem, Inc. and ENSR). Puttogether MPCA contracts with laboratories. (MPCA)
• Prepare letter contracts for work under $5,000. This will include separate letter
contracts for the University of Minnesota-Duluth (UMD) for particle size analysesand for Short Elliot Hendrickson (SEH) Inc. to map sediment contaminant isoplethsfor similar core segments. (MPCA)
• Obtain information on historical and current sources of contamination to Minnesota Slip, as
well as historical and current land use patterns for the area surrounding the slip. Informationfrom Sanborn Insurance maps that date back to the late 1800s will be accessed frommicrofiche copies at the MPCA. Information on past commercial/industrial operations willbe available from the Sanborn maps. Land use patterns will also be determined fromhistorical photos of the slip maintained by the Corps of Engineers Maritime Museum inDuluth. Information will also be obtained from the St. Louis River CAC for a project theyare conducting to develop a historical reconstruction of land uses in the lower St. Louis River(Karen Plass, St. Louis River CAC, personal communication, 1998). (MPCA)
• Develop a detailed work plan and quality assurance project plan (QAPP) to delineate the
horizontal and vertical profile of contaminants of concern in Minnesota Slip, as well asassess sediment toxicity to benthic invertebrates. (MPCA)
• Collect sediment samples in Minnesota Slip using GLNPO’s assistance with the R/V
Mudpuppy and Vibrocoring system. Ship samples to the appropriate toxicity testing andanalytical laboratories. (MPCA and GLNPO)

Minnesota Slip QA Project Plan Section A
Revision No.: 0 01/03/00 Page 30
• Conduct 28-day sediment toxicity tests with Hyalella azteca, followed by a 14-day exposureperiod in clean water to further assess reproduction. The endpoints for these tests will besurvival, reproduction, and growth (e.g., dry weight). In addition, 10-day tests withChironomus tentans will be conducted to assess survival and growth (i.e., weight).Overlying water quality measurements of alkalinity, hardness, pH, dissolved oxygen,conductivity, and unionized ammonia will be made. Prepare toxicity test reports and submitto MPCA. (ENSR)
• Analyze sediment samples for the parameters listed in Table A-4 and report results to
MPCA. (En Chem, Inc., MDH, UMD) • Interpolate the contaminant data in similar core segments using sediment kriging. The
volume of contaminants in selected core segments will be estimated by combining allavailable contaminant data for the slip from previous sediment investigations. (SEH)
• Compare the surficial sediment data to background contaminant levels in the St. Louis River
AOC (as determined by the R-EMAP project). The data will also be compared tobiologically-based Sediment Quality Objective values (Ingersoll and MacDonald, 1998).(MPCA)
• Present the results at a national conference (e.g., SETAC) and through other public forums.
(MPCA) • Develop a short-list of possible remediation scenarios (e.g., natural recovery, capping, in situ
treatment, sediment removal) for future consideration. (MPCA) • Prepare a draft and final manuscript for peer-review publication. (MPCA) Sediment samples will be collected from Minnesota Slip during September 21-23, 1999 and fromSeptember 28 to October 1, 1999. The GLNPO R/V Mudpuppy and crew will be used to assistMPCA staff with this effort during the last week of September. A schedule of the majormilestones for this project are given in Table A-5.

Minnesota Slip QA Project Plan Section A
Revision No.: 0 01/03/00 Page 31
Table A-4. Chemical and Physical Parameters to be Measured in Minnesota Slip Parameter PCBs: 107 congeners [same group as measured in Slip C (Crane 1999a)] PAH compounds: acenaphthene, acenaphthylene, anthracene, benzo[a]anthracene,
benzo[a]pyrene, benzo[b & j]fluoranthene, benzo[e]pyrene, benzo[g, h,i]perylene, benzo[k]fluoranthene, chrysene, dibenzo[a, h]anthracene,fluoranthene, fluorene, indeno[1, 2, 3-cd]pyrene, 2-methylnaphthalene,naphthalene, phenanthrene, and pyrene
Mercury Metals: cadmium, chromium, copper, lead, nickel, selenium, zinc Acid Volatile Sulfides Simultaneously Extractable Metals: cadmium, copper, mercury, lead, nickel, zinc Ammonia TOC Particle Size: percent of sand and gravel (>53 µm), coarse silt (53-20 µm), medium silt
(20-5 µm), fine silt (5-2 µm), coarse clay (2-0.2 µm), medium clay (0.2-0.08 µm),and fine clay (<0.08 µm)
Percent Moisture


Minnesota Slip QA Project Plan Section A
Revision No.: 0 01/03/00 Page 33
A4 QUALITY OBJECTIVES AND CRITERIA FOR MEASUREMENT DATA A4.1 Purpose/Background The purpose of this section is to document the Data Quality Objectives (DQOs) of the project. Inaddition, performance criteria will be established for the planning process and measurementsystem that will be employed in generating the data. A4.2 Specifying Quality Objectives The DQO Process is a series of planning steps based on the Scientific Method that is designed toensure that the type, quality, and quantity of environmental data used in decision making areappropriate for the intended application. DQOs are qualitative and quantitative statementsderived from outputs of each step of the DQO Process that: • Clarify the intended use of the data• Define the type of data needed to support the decision• Identify the conditions under which the data should be collected• Specify tolerable limits on the probablility of making a decision error due to uncertainty in
the data. The DQO process consists of the following seven steps: 1. State the problem 2. Identify the decision 3. Identify inputs to the decision 4. Define the study boundaries 5. Develop a decision rule 6. Specify limits on decision errors 7. Optimize the design for obtaining data. Data Quality Indicators (DQIs) can be evolved from DQOs for a sampling activity through theuse of the DQO process (USEPA, 1998). For this project, the individual steps of the DQO process are listed below. 1. State the Problem
• The members of the project team were previously described in Section A1.2.• The primary decision maker for this project is the MPCA Principal Investigator,
who will solicit input from expected data users.

Minnesota Slip QA Project Plan Section A
Revision No.: 0 01/03/00 Page 34
• The description of contamination problems in Minnesota Slip were identified inSection A2.2
• The financial resources available to carry-out this project include GLNPOgrant number GL985004-01 for $128,600 plus a state match of $6,770. Inaddition, staff support from the MPCA and GLNPO will be available forsampling and other project assistance. The timeline for meeting majorproject deliverables is provided in Table A-5. The entire project will becompleted by September 30, 2000.
2. Identify the Decision
• The principal study question is based on using a weight-of-evidence approach todetermine: what is the spatial extent of contamination in Minnesota Slip and doacute and/or chronic effects result from benthic organisms exposed to thesediments?
• Alternative actions that could result from resolution of the principal studyquestion include:
• Implementation of a storm water loading study to quantitate contaminantloads entering the slip and to develop Best Management Practices toreduce contaminant inputs to the slip.
• Evaluation of groundwater inputs of contaminants to the slip.• Implementation of a human health and/or ecological risk assessment for
Minnesota Slip.• Implementation of a feasibility study to better quantitate remediation
options for this study.• No action.
• A decision statement for this site would be to ensure all possible source controlmeasures are taken before any potential sediment remediation options are carriedout.
• Multiple decisions about source control measures may be necessary to addresssediment contamination problems in Minnesota Slip. However, this will be basedon the availability of funding opportunities to pay for this work.
3. Identify Inputs to the Decision
• To resolve the decision statement, measurements of the chemical and physicalparameters given in Table A-4 need to be made. Selenium was added to the listbecause it has not been measured in the slip before, and it has been found to be acontaminant of concern in nearby soil sites along the waterfront. This listexcludes the previously determined contaminants of concern of toxaphene and

Minnesota Slip QA Project Plan Section A
Revision No.: 0 01/03/00 Page 35
p,p’-DDD and o,p’-DDT (Schubauer-Berigan and Crane, 1997). Thesecontaminants were excluded because of their high analytical costs, and becausePAHs are the greatest contaminant of concern at this site (Schubauer-Berigan andCrane, 1997; Crane et al., 1997). Any remediation actions taken at this site toreduce PAH contamination will most likely take care of most of the othercontaminants of concern. In addition to chemical measurements, an assessmentof acute and chronic sediment toxicity needs to be made to provide another pieceof information in the weight-of-evidence approach. The results of a recentbioaccumulation study (GL985604-01), in which two sites were sampled inMinnesota Slip for 28-day bioaccumulation tests with Lumbriculus variegatus(AScI Corporation, 1999) will also be used to resolve the decision statement. Abenthological survey will not be conducted, as part of the weight-of-evidenceapproach, because a previous survey showed the slip is consistently dominatedwith pollutant-tolerant oligochaetes (e.g., Tubificids and naidid oligochaetes)(Crane et al., 1997).
• To determine the sources for each item of information identified above, thesediment will be analyzed for chemical and physical parameters as detailed inSection B. In addition, acute and chronic toxicity tests, with representativebenthic organism, will be conducted according to EPA protocols. Previoussediment investigations provided information about the limited spatial distributionof some contaminants and potential for acute toxicity (Schubauer-Berigan andCrane, 1997; Crane et al., 1997; unpublished R-EMAP and MPCA data; AScICorporation, 1999), but these studies did not provide enough information toresolve the decision statement.
• For contaminated sediments, the MPCA has not established specific informationneeds that must be acquired to establish action levels. Instead, a weight-of-evidence approach will be used to establish next steps for Minnesota Slip.
• The appropriate measurement methods exist to provide the necessary datafor this project. Last year, a small number of Minnesota Slip sedimentsamples were submitted to MDH in order to refine their PAH methods forthese samples. Due to the moderately high levels of PAHs in the samples,it was determined that the less expensive GC/MS (rather than GC/MS-SIM) method could be used with a minimal loss of information aboutcertain PAH compounds that comprised less than 2% of the total PAHs (P.Swedenborg, MDH, personal communication, 1998). For the toxicitytests, the 42-day Hyallela azteca test is a fairly new method. The contractlaboratory will run one negative control with each sample as an extrameasure to ensure the success of these tests.

Minnesota Slip QA Project Plan Section A
Revision No.: 0 01/03/00 Page 36
4. Define the Boundaries of the Study
• The characteristics that define the population of interest are the chemical andphysical parameters listed in Table A-4, and the acute and chronic endpoints ofthe sediment toxicity tests. The endpoint for the acute, 10-day Chironomustentans toxicity tests is survival; growth (i.e., weight) will be measured as achronic endpoint. The chronic endpoints for the 42-day Hyalella azteca tests aresurvival (after 28, 35, and 42 days), reproduction, and growth (28 and 42 days asdry weight).
• The spatial boundary of the decision statement will be limited to:• The geographic area of Minnesota Slip down to a maximum depth of
1.5 m.• Consistent sediment core sections will be obtained to allow comparisons
within subsets of data and to determine if the surficial sediments are lesscontaminated than deeper sections. This will involve the collection ofsediments in the biologically active layer (i.e., 0-5 cm) to be compositedand split for sediment chemistry and toxicity tests. In addition, thefollowing core sections will be obtained for various chemical and physicalparameters: 0-15 cm, 15-30 cm, 30-45 cm, 45-60 cm, 60-75 cm, 75-90cm, 60-90 cm (one site), 90-120 cm, and 120-150 cm. Due to the highcost of the analytical measurements, more data will be collected with lessexpensive parameters like lead, zinc, and mercury. As done at Slip C(Crane, 1999a), regression relationships between these less expensiveparameters and PAHs will be sought that may lead to extrapolations ofPAH concentrations in deeper core segments. A suite of other metals willbe measured in only the 0-5 cm core segments to allow additionalvalidation of recently developed sediment quality objectives for the St.Louis River Area of Concern (GL985604-01), with the sediment toxicitytesting results.
• The temporal boundary of the problem will be limited to a distinct periodof time from September 21-23, 1999 to September 28-October 1, 1999.The data will be used to reflect the sediment quality conditions fromwhich a decision can be made concerning future management actions atMinnesota Slip. The data is being collected at the end of Septemberbecause it will be less disruptive to the charter boat operators in MinnesotaSlip at that time. In addition, more private boats may be pulled out of themarina by that time which will make sampling easier.
• The scale of decision making will be based on the analytical results fromall core segments to enable volume estimates of PAHs, mercury, lead, and

Minnesota Slip QA Project Plan Section A
Revision No.: 0 01/03/00 Page 37
zinc to be made. The surficial analytical data (i.e., 0-5 cm and 0-15 cm)will be compared to sediment quality objectives to determine ifexceedances of threshold effect concentrations (TECs) and probable effectconcentrations (PECs) occur. In addition, a weight-of-evidence approachwill be used to assess the chemical and bioeffects data available from this,and previous studies, for the surficial sediments.
• Potential practical constraints on data collection include the following: weatherconditions such as severe weather or snow, inability to gain access to pre-determined sampling sites because of physical obstructions (e.g., other boats) ornon-cohesive sediments (i.e., high sand content), equipment failure, orunavailability of personnel, time, or equipment.
5. Develop a Decision Rule
• The statistical parameter that characterizes the populations of interest are the truemean contaminant concentrations for each sediment section and the true meantoxicological endpoints.
• Since action levels have not been set for contaminated sediment sites inMinnesota, all of the available chemical and bioeffects data will be evaluatedusing a weight-of-evidence approach.
• If...then statements for the decision rule will follow the sediment assessmentframework and contingency table of MacDonald et al. (1998) (Appendix B).
6. Specify Tolerable Limits on Decision Errors
• From previous sediment investigations, the possible range of most of the chemicalparameters is given in Table A-3. In some instances, not enough data have beencollected to determine appropriate ranges of certain heavy metals.
• The decision errors and null hypothesis are as follows:• The two decision errors are (i) deciding the weight-of-evidence data
indicates the sediments are contaminated enough to warrant remediationwhen it truly does not, and (ii) deciding the weight-of- evidence dataindicates the sediments are not contaminated enough to warrantremediation when it truly does.
- The true state of nature for decision error (i) is that the slip does not need remediation. - The true state of nature for decision error (ii) is that the slip
needs to be remediated.

Minnesota Slip QA Project Plan Section A
Revision No.: 0 01/03/00 Page 38
• The potential consequences of each decision error are:
- The consequences of deciding that Minnesota Slip warrantsremediation, when it truly does not, will be that the MPCA willhave to spend additional fiscal and personnel resources to assessthe human health and ecological risks at the site, as well as toconduct a feasibility study of possible remediation scenarios. Inaddition, the involvement of various stakeholders would bewasted and may lead to mistrust of MPCA actions at this andother St. Louis River AOC hot spot sites.
- The consequences of deciding that Minnesota Slip does notwarrant remediation, when it truly does, will be that aquaticbiota, and possibly humans, may be exposed to unacceptablerisks at this site. In addition, it would make it more difficult forthe city of Duluth to solicit funds to implement BMPs for thestormwater outfalls draining into Minnesota Slip.
• Decision error (ii) has more severe consequences since that risk ofjeopardizing human health and ecological stability outweighs theconsequence of having to devote more staff and fiscal resources toevaluating remediation options.
• The null hypothesis (baseline condition) and the alternative hypothesis areas follows:
- The baseline condition, or null hypothesis (Ho), is that theweight-of-evidence of available data indicates the sedimentsrequire remediation.
- The alternative hypothesis (Ha) is that the weight-of-evidence ofavailable data indicates the sediments do not requireremediation.
• The false positive decision error occurs when the null hypothesis isrejected when it is true. The false negative decision error occurs when thenull hypothesis is not rejected when it is false.
• The range of possible values of the parameter of interest, where the consequencesof decision errors are relatively minor (gray region) must be specified on a case-by-case basis.
7. Optimize the Design
• Guidance on “Statistical Techniques Applied to Sediment Sampling (STATSS)”(Lubin et al., 1995) will be used to optimize the experimental design.

Minnesota Slip QA Project Plan Section A
Revision No.: 0 01/03/00 Page 39
• Additional consideration will be made to optimize the use of sediment kriging todevelop isopleths of chemical contaminants for different core segments. Thesamples need to be collected in a triangulation pattern to make the kriging mosteffective.
A4.3 Specifying Measurement Performance Criteria An important feature of the QAPP is that it links the data user’s quality objectives to verifiablemeasurement performance criteria. Once these measurement performance criteria have beenestablished, sampling and analytical methods criteria can be specified in Section B. Data Quality Indicators (DQIs) are qualitative and quantitative descriptors used in interpretingthe degree of acceptability or utility of data. The principal DQIs are precision, bias,representativeness, comparability, and completeness. Establishing acceptance criteria for theDQIs sets quantitative goals for the quality of data generated in the analytical measurementprocess. A4.3.1 Precision Precision is a measure of agreement among replicate measurements of the same property, underprescribed similar conditions. This agreement is calculated as either the range (R) or as thestandard deviation (s). It may also be expressed as a percentage of the mean of themeasurements, such as relative percent difference (RPD) or relative standard deviation (RSD)(for three or more replicates). Field precision is assessed through the collection and measurement of field replicates at a rate ofone replicate per ten analytical samples. This allows intralaboratory precision information to beobtained on sample acquisition, handling, shipping, storage, preparation, and analysis. Bothsamples can be carried through the steps in the measurement process together to provide anestimate of short-term precision. An estimate of long-term precision can be obtained byseparating the two samples and processing them at different times or by different people and/oranalyzed using different instruments. Precision control limits are given in Table A-6. For duplicate measurements, relative percent difference (RPD) is calculated as follows: RPD = D1 – D2 x 100% (D1 + D2)/2 RPD = relative percent difference D1 = sample value D2 = duplicate sample value

Minnesota Slip QA Project Plan Section A
Revision No.: 0 01/03/00 Page 40
Table A-6. Summary of Analytical Data Quality Indicators for Sediment Samples
Analyte Precision (% RPD)
Accuracy (%)
Completeness (%)
PCB Congeners <50 40-150 95 Individual PAHs <50 50-130 95 Mercury <20 70-130 95 Metals (Cd, Cr, Cu,Ni, Pb, Zn)
<10 85-115 95
Selenium
<10 80-120 95
AVS <20 65-125 95 SEM <20 80-120 95 Ammonia <20 80-120 95 Particle Size <50 N/A 95 TOC <20 80-120 95 Percent Moisture
<20
80-120
95
N/A = Not Applicable RPD = Relative Percent Difference

Minnesota Slip QA Project Plan Section A
Revision No.: 0 01/03/00 Page 41
For three or more replicates: RSD = (s/x) x 100 RSD = relative standard deviation s = standard deviation of three or more results x = mean of three or more results Standard deviation is defined as follows: s = ((�(yi – mean y)2 x 1/(n-1)))0.5
s = standard deviation yi = measured value of the ith replicate mean y = mean of replicate measurements n = number of replicates A4.3.2 Bias Bias is the systematic or persistent distortion of a measurement process that causes errors in onedirection. Bias assessments for environmental measurements are made using personnel,equipment, and spiking materials or reference materials as independent as possible from thoseused in the calibration of the measurement system. When possible, bias assessments should bebased on analysis of spiked samples rather than reference materials so that the effect of thematrix on recovery is incorporated into the assessment. A documented spiking protocol andconsistency in following that protocol are important to obtaining meaningful data qualityestimates. Spikes should be added at different concentration levels to cover the range ofexpected sample concentrations. The use of spiked surrogate compounds for GC and GC/MSprocedures for PCB congeners and PAH compounds, respectively, will be used to assess for bias. A4.3.3 Accuracy Accuracy is a measure of the closeness of an individual measurement of the average of a numberof measurements to the true value. Accuracy includes a combination of random error (precision)and systematic error (bias) components that result from sampling and analytical operations. Accuracy in the field is assessed through the adherence to all sample handling, preservation, andholding times. In order to assure the accuracy of the analytical procedures, an environmentalsample will be randomly selected from each sample shipment received at the laboratory, andspiked with a known amount of the analytes to be evaluated. In general, a sample spike will beincluded in every set of 20 samples tested on each instrument. The spike sample will then beanalyzed. The increase in concentration of the analyte observed in the spiked sample, due to theaddition of a known quantity of the analyte, compared to the reported value of the same analyte

Minnesota Slip QA Project Plan Section A
Revision No.: 0 01/03/00 Page 42
in the unspiked sample determines the percent recovery. The percent recovery for a spikedsample is calculated according to the following formula: %R = 100% x (S-U)/Csa %R = percent recovery S = measured concentration in spiked sample U = measured concentration in unspiked sample Csa = actual concentration of spike added For situations where a standard reference material is used in addition to a matrix spike: %R = 100% x Cm/Csrm %R = percent recovery Cm = measured concentration of SRM Csrm = actual concentration of SRM The analytical DQIs for accuracy are given in Table A-6. A4.3.4 Representativeness Representativeness expresses the degree to which data accurately and precisely represent acharacteristic of a population, parameter variations at a sampling point, a process condition, or anenvironmental condition. Representativeness is a qualitative term that should be evaluated todetermine whether in situ and other measurements are made and physical samples collected insuch a manner that the resulting data appropriately reflect the media and phenomenon measuredor studied. For field data, representativeness is dependent upon the proper design of the sampling programand will be satisfied by ensuring that the field sampling plan is followed and that propersampling techniques are used. The sampling design of this project is representative ofmoderately contaminated sediments in Minnesota Slip. Representativeness in the laboratory is ensured by using the proper analytical and toxicity testingprocedures; meeting sample holding times; and analyzing and assessing laboratory duplicates forthe chemistry samples. A4.3.5 Comparability Comparability is the qualitative term that expresses the confidence that two data sets cancontribute to a common analysis and interpolation. Comparability must be carefully evaluated toestablish whether two data sets can be considered equivalent in regard to the measurement of a

Minnesota Slip QA Project Plan Section A
Revision No.: 0 01/03/00 Page 43
specific variable or groups of variables. In a laboratory analysis, the term comparability focuseson method type comparison, holding times, stability issues, and aspects of overall analyticalquantitation. There are a number of issues that can make two data sets comparable, and the presence of eachof the following items enhances their comparability:
• Two data sets should contain the same set of variables of interest• Units in which these variables were measured should be convertible to a common
metric• Similar analytical procedures and quality assurance should be used to collect data for
both data sets• Time measurements of certain characteristics (variables) should be similar for both
data sets• Measuring devices used for both data sets should have approximately similar
detection levels• Rules for excluding certain types of observations from both samples should be similar• Samples within data sets should be selected in a similar manner• Sampling frames from which the samples were selected should be similar• Number of observations in both data sets should be of the same order or magnitude.
These characteristics vary in importance depending on the final use of the data. The closer twodata sets are with regard to these characteristics, the more appropriate it will be to compare them.Large differences between characteristics may be of only minor importance, depending on thedecision that is to be made from the data. For this investigation, comparability will be satisfied by ensuring that the field sampling plan isfollowed and that proper sampling techniques are used. The analytical data obtained from thisstudy will be as comparable, as possible, to data collected from recent sampling efforts inMinnesota Slip. A4.3.6 Completeness Completeness is a measure of the amount of valid data obtained from a measurement systemcompared to the amount that was expected to be obtained under normal conditions. Fieldcompleteness is a measure of the amount of valid measurements obtained from all themeasurements taken in the project. Field completeness for this project will be greater than 90%.Laboratory completeness is a measure of the amount of valid measurements obtained from all themeasurements taken in the project. Laboratory completeness for this project will be greater than95% of the total number of samples submitted to the analytical laboratories (Table A-6).

Minnesota Slip QA Project Plan Section A
Revision No.: 0 01/03/00 Page 44
The calculation for percent completeness is as follows: %C = 100% x (V/n) %C = percent completeness V = number of valid measurements n = number of measurements planned A5 SPECIAL TRAINING REQUIREMENTS/CERTIFICATION A5.1 Purpose/Background The purpose of this section is to ensure that any specialized training requirements necessary tocomplete this project are known and described below. In addition, the procedures are describedin enough detail to ensure that specific training skills can be verified, documented, and updatedas necessary. A5.2 Training Training, as described here, is limited to field sampling activities. Each of the contractlaboratories will have their own training requirements for their staff. The MPCA PrincipalInvestigator and Field Team Leader have both had boat and water safety training, as well asright-to-know training for working with hazardous substances. In addition, the MPCA FieldTeam Leader has had 40-hour OSHA Hazardous Waste Training and subsequent refreshercourses. GLNPO field staff, and their contractors, must take a 40-hour OSHA required (29 CFR1910.120) health and safety course for hazardous waste workers, plus an annual refresher course.In addition, they are required to be fitted to a respirator and to have annual or bi-annual medicalmonitoring. A5.3 Certification GLNPO field staff, and their contractors, must be certified in first aid and CPR. The captain ofthe R/V Mudpuppy is required to have a 100-ton marine mariners license. A6 DOCUMENTATION AND RECORDS A6.1 Purpose/Background This section defines which records are critical to the project and what information needs to beincluded in the reports. In addition, the data reporting format and the document controlprocedures to be used are described.

Minnesota Slip QA Project Plan Section A
Revision No.: 0 01/03/00 Page 45
A6.2 Information Included in the Reporting Packages A6.2.1 Field Operation Records The information contained in these records document overall field operations and generallyconsist of the following:
• Sample collection records. A bound, water proof field notebook will be used torecord raw data and to make references to prescribed procedures and changes inplanned activities. This notebook includes pre-numbered pages with date andsignature lines. The information recorded in this notebook show that proper samplingprotocols were performed in the field. This documentation will include the names ofthe field crew, date, time, weather conditions, sample site code, water depth, sedimentsounding, core slice descriptions, equipment/method used, maps and diagrams, andunusual observations.
• Sample tracking records. Legal chain-of-custody records will not be required for this
investigation. Instead, sample tracking forms will document the progression ofsamples as they travel from the original sampling location to the various contractlaboratories.
• QC sample records. These records will be documented in the field notebook for field
sample replicates and for recording which samples should be used for analyticalduplicates and matrix spikes. Each contract laboratory will record its own QCsamples, and this should include information on the frequency, conditions, level ofstandards, and instrument calibration history. The contract laboratories will alsoinclude documentation on sample integrity and preservation, as well as includedocumentation on the calibration and standards’ traceability.
• General field procedures. General field procedures on how the data were collected
will be recorded in the field notebook.
• Corrective action reports. Corrective action reports show what methods were used incases where general field practices or other standard procedures were violated andinclude the methods used to resolve noncompliance.
A6.2.2 Laboratory Records The following laboratory-specific records should be compiled if available and appropriate:
• Sample Data. These records contain the times that samples were analyzed to verifythat they met holding times prescribed in the analytical methods. Included should bethe overall number of samples, sample location information, any deviations from the

Minnesota Slip QA Project Plan Section A
Revision No.: 0 01/03/00 Page 46
SOPs, time of day, and date. Corrective action procedures to replace samplesviolating the protocol also should be noted.
• Sample Management Records. Sample management records document sample
receipt, handling and storage, and scheduling of analyses. The records verify thatsample tracking and proper preservation were maintained, reflect any anomalies inthe samples (such as receipt of damaged samples), note proper log-in of samples intothe laboratory, and address procedures used to ensure that holding time requirementswere met.
• Test Methods. Unless analyses are performed exactly as prescribed by SOPs, this
documentation will describe how the analyses were carried out in the laboratory.This includes sample preparation and analysis, instrument standardization, detectionand reporting limits, and test-specific QC criteria. Documentation demonstratinglaboratory proficiency with each method used could be included.
• QA/QC Reports. These reports will include the general QC records, such as initial
demonstration of capability, instrument calibration, routine monitoring of analyticalperformance, calibration verification, etc. Project-specific information from theQA/QC checks such as blanks (e.g., reagent, method), spikes (e.g., matrix, matrixspike duplicate, surrogate spike), calibration check samples (e.g., zero check, spancheck, and mid-range check), replicates, and so on should be included in these reportsto facilitate data quality analysis.
A6.2.3 Data Handling Records These records document protocols used in data reduction, verification, and validation. Datareduction addresses data transformation operations such as converting raw data into reportablequantities and units, use of significant figures, recording of extreme values, blank corrections,etc. Data verification ensures the accuracy of data transcription and calculations, if necessary, bychecking a set of computer calculations manually. Data validation ensures that QC criteria havebeen met. A6.3 Data Reporting Package Format and Documentation Control The format of all data reporting packages must be consistent with the requirements andprocedures used for data validation and data assessment described in Sections B, C, and D of theQAPP. The MPCA Principal Investigator will ensure that data are being recorded appropriatelyon the sample labels, sample tracking forms, and in the field notebook. All entries will be madeusing permanent ink, signed, and dated, and no erasures will be made. If an incorrect entry ismade, the information will be crossed out with a single strike mark that is signed and dated bythe sampler. A similar data entry process will be followed by the contract laboratories.

Minnesota Slip QA Project Plan Section A
Revision No.: 0 01/03/00 Page 47
The analytical laboratories will be expected to provide a data package with the followingcomponents: • Case Narrative:
• Date of issuance• Laboratory analyses performed• Any deviations from intended analytical strategy• Laboratory batch number• Numbers of samples and respective matrices• Quality control procedures utilized and also references to the acceptance criteria• Laboratory report contents• Project name and number• Condition of samples “as received”• Discussion of whether or not sample holding times were met• Discussion of technical problems or other observations which may have created
analytical difficulties• Discussion of any laboratory QC checks which failed to meet project criteria• Signature of the Laboratory QA Manager.
• Chemistry Data Package:• Case narrative for each analyzed batch of samples• Summary page indicating dates of analyses for samples and laboratory quality control
checks• Cross referencing of laboratory sample to project sample identification numbers• Descriptions of data qualifiers• Sample preparation and analyses for samples• Sample and laboratory quality control results• Results of (dated) initial and continuing calibration checks• Matrix spike and matrix spike duplicate recoveries, laboratory control samples,
method blank results, calibration check compounds, and system performance checkcompound results
• Results of tentatively identified compounds.
An electronic copy of the analytical data will be submitted in a format compatible with theMPCA’s software (e.g., Excel 5.0 or Excel ‘97).
The toxicity testing laboratory (ENSR) will be required to submit toxicity test reports, whichcontain the following components:
• Introduction (brief)• Sample collection and handling• Methods, including:

Minnesota Slip QA Project Plan Section A
Revision No.: 0 01/03/00 Page 48
• exposure system• test organisms• test performance• water chemistry• data analysis procedures• reference toxicity testing
• Results, including:• toxicity tests• reference toxicant tests
• References• Appendices, including:
• laboratory data sheets and any associated quality assurance/quality control (QA/QC)review
• statistical printouts• reference toxicant control chart(s).
The toxicity testing laboratory will not be expected to interpret the toxicity data; this will be doneby the MPCA. An electronic copy of the toxicity test report and associated data files will besubmitted in a format compatible with the MPCA’s software (e.g., Word 6.0, Word ’97, orWordPerfect 6.1; Excel 5.0 or Excel ‘97). The Laboratory QA Officers at each contact laboratory must perform a final review of the reportto determine whether it meets project requirements. The Project Managers, or their delegatedstaff, would make any necessary changes to the reports. The Laboratory QA Officers will havethe final authority for implementing corrections and/or revisions to their respective QAmanagement plans and SOPs. The MPCA Principal Investigator will have final authority formaking revisions to the draft project report, after soliciting review comments from GLNPO andinterested stakeholders. A6.4 Data Reporting Package Archiving and Retrieval Each contract laboratory has their own policy for the storage of, access to, and final disposal ofall records. It is anticipated that all necessary records will be provided to the MPCA with thelaboratory data package/report. The MPCA will retain the data for five years after which time itwill be sent to the Minnesota Records Center for 30 years. When that time period is up, theCenter will contact the MPCA to check if they want to retain the information. If not, the fileswill be turned over to the Minnesota Historical Society. They will retain the files they areinterested in and dispose of the other files.

Minnesota Slip QA Project Plan Section B
Revision No.: 0 01/03/00 Page 49
B MEASUREMENT/DATA ACQUISITION B1 SAMPLING PROCESS DESIGN (EXPERIMENTAL DESIGN) B1.1 Purpose/Background The purpose of this section is to describe all relevant components of the experimental design;define the key parameters to be estimated; indicate the number and type of samples expected;and describe where, when, and how samples are to be taken from Minnesota Slip. B1.2 Scheduled Project Activities, Including Measurement Activities Sediment sampling will take place during September 21-23, 1999 (MPCA staff only) andSeptember 28 - October 1, 1999 (MPCA, GLNPO, Deep Ocean Navigation staff). It isanticipated that the MPCA will ship all of the sediment samples to the contract laboratories byOctober 5, 1999. ENSR will initiate all toxicity tests within two weeks of sample receipt. ENSR’s standard turnaround time for producing final, quality assured toxicity reports is four weeks followingcompletion of the toxicity tests. En Chem, Inc. anticipates having a four week turn around timefor AVS/SEM and six weeks for the PCB congener work. MDH will have a longer turn aroundtime for reporting their analytical results as they will be working with the MPCA to put the datain an electronic format compatible with GLNPO’s sediment database. UMD will also have alonger turn around time with reporting the results of the particle size analyses due to the long (sixmonth) holding time that will be allowed for these samples. A bar chart showing the time ofvarious QAPP milestones was provided in Table A-5. B1.3 Rationale for the Design The U.S. EPA Region 5 document on “Statistical Techniques Applied to Sediment Sampling(STATSS)” (Lubin et al., 1995) was referred to when designing this study. Based on the budgetavailable for this project, a nonrandom sampling plan was used to select sites to delineate thevertical and horizontal distribution of selected contaminants in the inner 75% of the slip.Sediment sampling of the outer 25% of the slip will be done to confirm the sediments have lowcontamination. Synoptic sediment toxicity tests will be used to assess acute and chronic effectsto benthic invertebrates for six sites. The field design of this project will meet the problem statement given in Section A2.2 and theproject objectives described in Section A3.1.

Minnesota Slip QA Project Plan Section B
Revision No.: 0 01/03/00 Page 50
B1.4 Design Assumptions The design assumptions for this study are the following: • Problems will potentially be encountered with sampling the designated sample sites
due to non-cohesive sediments or obstructions/litter in the sediments. •••• Problems will potentially be encountered with taking GPS measurements in
Minnesota Slip, due to interference caused by the SS William A. Irvin. •••• Marina obstructions may prevent field sampling or change the order of sample
collection. •••• Weather conditions may prevent field sampling from occurring. • Sediment samples may be very heterogeneous. These assumptions are based on previous sediment investigations in Minnesota Slip in whichproblems were encountered, especially due to the sandy, noncohesive nature of the sediments insome locations. It is anticipated that flexibility will be needed in the field sampling plan in casesome sites cannot be sampled. Landmark observations of sampling sites will be made to anaerial photograph of Minnesota Slip. This aerial photograph shows the placement of all boatdocks in the marina and of the Irvin. B1.5 Procedures for Locating and Selecting Environmental Samples For this study, eighteen sites will be sampled in a triangulation pattern in Minnesota Slip (FigureB-1). The triangulation pattern will maximize the use of sediment kriging to generate isoplethsof chemical contaminants at various depth intervals. More samples will be collected in the inner75% area of the slip, based on the results of previous investigations (Schubauer-Berigan andCrane, 1997; Crane et al., 1997; unpublished R-EMAP and MPCA data; AScI Corporation,1999). Maps of the sampling sites from these previous investigations are given in Figures A-7and B-2 to B-5. Not all of these sites had similar depth intervals sampled for chemicalparameters, as will be done in this investigation. The sediment sampling will occur over a two-week period from September 21 to October 1,1999. Surficial (0-5cm) samples will be collected at six sites for concurrent sediment chemistryand toxicity testing analyses (Figure B-1); one of these sites will be used as a field replicate foranalytical parameters. Sediment cores will also be collected at all eighteen sites. The cores willbe sliced into increments as shown in Table B-1. One long core will be obtained at the bow ofthe Irvin, and in the vicinity of two stormwater outfalls, for detailed sectioning of the core forPAHs, PCBs, mercury, lead, zinc, TOC, and particle size. This will be done to give an effectivevertical profile of these contaminants at one area of the slip that is known to be contaminated.The budget of this project will not support doing this detailed of a core assessment for all these


Minnesota Slip QA Project Plan Section B
Revision No.: 0 01/03/00 Page 56
Table B-1. Sediment Sampling Scheme for Sectioning Sediment Cores and Collecting Field Replicates from Minnesota Slip
Number of Samples to be Analyzed for Chemical/Physical Parameters Particle Other
Core Section (cm) PAHs PCBs TOC Size Lead Zinc Digestion % Moisture Mercury Metals* Ammonia AVS/SEM
0-5 6 6 6 6 6 6 6 6 6 6 6 6 field replicate 1 1 1 1 1 1 1 1 1 1 1 1 0-15 18 18 18 18 18 18 18 18 18 field replicate 2 2 2 2 2 2 2 2 2 15-30 14 1 14 14 18 18 18 18 18 field replicate 2 2 2 2 2 2 2 2 30-45 10 1 10 10 18 18 18 18 18 field replicate 1 1 1 2 2 2 2 2 45-60 6 1 6 6 14 14 14 14 14 field replicate 1 1 1 2 2 2 2 2 60-75 14 14 14 14 10 field replicate 2 2 2 2 1 75-90 10 10 10 10 1 field replicate 1 1 1 1 60-90 1 1 1 1 90-120 1 1 1 1 10 10 10 10 1 field replicate 1 1 1 1 1 120-150 1 1 1 1 10 10 10 10 1 field replicate 1 1 1 1 1 TOTAL NUMBER OF SAMPLES 64 33 64 66 132 132 132 132 97 7 7 7
*Cadmium, Chromium, Copper, Nickel, and Selenium

Minnesota Slip QA Project Plan Section B
Revision No.: 0 01/03/00 Page 57
parameters at other locations in the harbor. Radioisotope dating will not be done on any of thecore segments because this slip has a history of being filled in with dredged material, and thesediments would likely give a smeared dating profile. In case prescribed locations turn out to be inaccessible during field sampling, professionaljudgment will be used to select a new site near the original site. Any deviations from thesampling plan will be recorded in the field notebook. B1.6 Classification of Measurements as Critical or Noncritical The following measurements will be critical to this study: PAHs, PCB congeners, mercury, lead,zinc, TOC, and particle size. The following measurements are noncritical to this study but willprovide a useful data set that can be used to verify sediment quality objectives for the St. LouisRiver AOC: cadmium, chromium, copper, nickel, selenium, and ammonia. The two types ofsediment toxicity tests being used in this study are also critical measurements. It was previouslydecided that conducting a benthological community survey was a noncritical measurement thatcould be excluded from this study. B1.7 Validation of any Nonstandard Methods No nonstandard sampling, analytical, or toxicological methods will be used in this study. The42-day Hyalella azteca test has had less usage of the other tests; as a conservative measure, onenegative control sample will be run with each sample. B2 SAMPLING METHODS REQUIREMENTS B2.1 Purpose/Background This section will describe the procedures for collecting samples and identifying the samplingmethods and equipment. In addition, the process for preparing and decontaminating samplingequipment, including disposing of decontamination by-products; selecting and preparing samplecontainers, sample volumes, preservation methods, and maximum holding times for samplingand/or analysis will be described. Finally, corrective action procedures will be described. B2.2 Sample Collection, Preparation, and Decontamination Procedures B2.2.1 Sampling Methods Sediment samples will be collected from Minnesota Slip using three different methods. Grabsamples of surficial sediments (0-5 cm) will be collected using a Shipek grab sampler on theMPCA’s R/V Naiad. This sampler was recently used for another GLNPO-sponsored sediment

Minnesota Slip QA Project Plan Section B
Revision No.: 0 01/03/00 Page 58
investigation in the Duluth Harbor (Crane, 1999b). Short sediment cores will be collectedbetween the slip wall and the Irvine using a Livingston corer. This coring device has been usedin other MPCA investigations in the Duluth Harbor (Crane et al., 1994; unpublished MPCA data,1998). Long sediment cores will be collected in other parts of the slip using GLNPO’sVibrocorer on the R/V Mudpuppy. GLNPO’s SOP for use of the Vibrocorer is contained inAppendix C. GLNPO’s Field Safety Plan is located in Appendix D. The depth of the soft sediments at each site will be measured by using sediment sounding poles(WDNR, 1995). These poles will also be used to determine the depth of the water column ateach site. A global positioning system (GPS) will be used on-board both the MPCA and GLNPO vesselsduring the field sampling. Operation of the GPS units will be per the manufacturing instructionmanuals for both instruments. B2.2.2 Sampling Method Requirements The planned sampling locations for this study are shown in Figure B-1. The Shipek grabsampler will be used to collect composite grab samples of surficial sediments; each compositedsample will be split for synoptic sediment chemistry and toxicity testing analyses. For each site,multiple grab samples will be collected from a relatively homogeneous sediment deposit (i.e., allgrabs should be of similar sand/silt content). Each grab sample will be collected from anundisturbed area of sediment. From the R/V Naiad, a winch (with a rotating arm) will be used tolower and raise the Shipek grab sampler out of the water. Since this sampler is very heavy, itwill be lowered into a “cradle” onboard the boat prior to opening it to reveal the sediments.Although some slumping of the sediments may occur, the MPCA Principal Investigator andField Team Leader have determined that this sampler works better than a Ponar grab sampler interms of collecting a more cohesive sample. The approximate upper 5 cm layer of sediment willbe removed using a Teflon -lined spatula. The sample will be placed into a 4-L acid andsolvent-rinsed Pyrex measuring cup. Any large objects such as twigs, wood chunks, or stoneswill be removed, and observations about the sediments (e.g., color, odor, appearance of oilsheens, sand/silt/clay content) will be recorded. The sediments will be briefly mixed andtransferred into pre-cleaned sample jars. The Livingston corer will be used from shore to sample the sediments in the approximate onemeter band of water between the south wall of Minnesota Slip and the SS William A Irvin;approximately four sediment cores will be collected in this area. As cohesive sediment coresections are extruded from the core, the outer 1-2 mm of sediment will be scraped off, using aTeflon -lined spatula. The outer layer of sediment will be disposed of in the water. The samplewill be transferred into a 4-L acid and solvent-rinsed Pyrex measuring cup, observations will be

Minnesota Slip QA Project Plan Section B
Revision No.: 0 01/03/00 Page 59
made, and the sediments will be mixed. The sample will then be split between pre-cleanedanalytical jars for various parameters. Smith et al. (1993) provided a detailed description of the R/V Mudpuppy and its operation,positioning and sampling procedures. The Vibrocorer system on the R/V Mudpuppy will beused at 14 sampling sites in Minnesota Slip. Although the Vibrocorer is designed to collectcores of up to 6 m in depth (Smith et al., 1993), the practical limit of this sampler in the Duluth-Superior Harbor is approximately 2 m (Schubauer-Berigan and Crane, 1997; Crane et al., 1997).GLNPO staff will pre-cut the core tubes to 1.6 m for use in this investigation. Cores will beprocessed on-board the R/V Mudpuppy immediately after collection. The core will be sectionedby sawing off the top section (0-15 cm) and subsequent sections according to the samplingscheme given in Table B-1. After sectioning the cores, the Vibrocorer samples will be decontaminated by scraping the outer1-2 mm of sediment from the core section with an acid- and solvent-rinsed spatula, anddiscarding it prior to sample homogenization. Samples will be placed into a 4-L acid andsolvent-rinsed Pyrex® measuring cup and homogenized by stirring. Homogenized samples willbe apportioned into pre-cleaned sample jars for delivery to the appropriate analytical lab. B2.2.3 Decontamination Procedures All field sampling personnel will be required to wear steel-toed shoes and gloves; this shouldprotect most staff against contamination of their extremities. Tyvex suits will be worn by thefield crew working on the deck of the R/V Mudpuppy. Equipment (e.g., Pyrex mixing bowls, spatulas, spoons) will be decontaminated by using slipwater to rinse off gross amounts of sediments. Next, the equipment will be scrubbed withphosphate-free soap. Finally, the equipment will be rinsed with 10% HCl, hexane, acetone, anddistilled water. This procedure follows the general Equipment Decontamination SOP given inAppendix E. This SOP was obtained from U.S. EPA (1995) and has not been adopted as anofficial MPCA SOP yet. Metal equipment will not be rinsed with 10% HCl. Acid rinsate willbe stored in a one gallon screw top empty solvent jug held in a Nalgene plastic safety bottlecarrier. At the end of each sample day, the acid and solvent wastes will be transferred to similarcontainment in the MPCA vehicle. The waste will be transported to the MPCA office in St. Paulfor disposal. One deviation from the Equipment Decontamination SOP is that equipment blankswill not be collected for this study. The sounding poles will not need to be decontaminated, except for a water rinse to remove grossamounts of sediment. These poles will only be used to measure the depth to refusal in thesediments, and thus constitute a physical measurement.

Minnesota Slip QA Project Plan Section B
Revision No.: 0 01/03/00 Page 60
The Shipek grab sampler and Livingston corer will be decontaminated by rinsing them in the slipwater to remove gross amounts of sediments. Next, each sampler will be scrubbed withphosphate-free soap, followed by a rinse of distilled water. Next, the Shipek sampler will berinsed with hexane, acetone, and distilled water. This full procedure will be done between sites.Within each site, only gross amounts of sediment will be removed from the Shipek grab samplerafter each composite sample is collected. For the Vibrocorer, a new lexan core tube will be used for each sediment core. Thus, a detaileddecontamination procedure will not be necessary. B2.3 Support Facilities for Sampling Methods The capabilities of the analytical laboratories and toxicology laboratory for this project arecommensurate with the requirements of the sampling plan. B2.4 Sampling/Measurement System Failure Response and Corrective Action
Process B2.4.1 Corrective Action Process Corrective action is the process of identifying, recommending, approving, and implementingmeasures to counter unacceptable procedures or out of quality control performance which canaffect data quality. Corrective action can occur during field activities, laboratory analyses, datavalidation, and data assessment. All corrective actions proposed and implemented will bedocumented in the regular quality assurance reports to management. Corrective actions shouldonly be implemented after approval by the MPCA Principal Investigator, or her designee, theField Team Leader. If immediate corrective action is required, approvals secured by telephonefrom the MPCA Principal Investigator should be documented in an additional memorandum. For noncompliance problems, a formal corrective action program will be determined andimplemented at the time the problem is identified. The person who identifies the problem will beresponsible for notifying the MPCA Principal Investigator, who in turn will notify the GLNPOProject Officer. Implementation of corrective actions will be confirmed in writing through thesame channels. Any noncompliance with the established quality control procedures in the QAPP will beidentified and corrected in accordance with the QAPP. The GLNPO Project Officer, or herdesignee, will issue a nonconformance report for each nonconformance condition.

Minnesota Slip QA Project Plan Section B
Revision No.: 0 01/03/00 Page 61
B2.4.2 Field Corrective Action Corrective action in the field may be needed when the sample network is changed (i.e., more/lesssamples, sampling locations other than those specified in the QAPP, etc.), or when samplingprocedures and/or field analytical procedures require modification due to unexpected conditions.Technical staff and project personnel will be responsible for reporting all suspected technical orQA nonconformances, or suspected deficiencies of any activity or issued document, by reportingthe situation to the Field Team Leader or designee. This person will be responsible for assessingthe suspected problems, in consultation with the MPCA Principal Investigator, and making adecision based on the potential for the situation to impact the quality of the data. If it isdetermined that the situation warrants a reportable nonconformance requiring corrective action,then a nonconformance report will be initiated by the MPCA Principal Investigator. The MPCA Principal Investigator will be responsible for ensuring that corrective actions fornonconformances are initiated by: • Evaluating all reported nonconformances• Controlling additional work on nonconforming items• Determining disposition or action to be taken• Maintaining a log of nonconformances• Reviewing nonconformance reports and corrective actions taken• Ensuring nonconformance reports are included in the final report files. If appropriate, the Field Team Leader will ensure that no additional work, that is dependent onthe nonconforming activity, is performed until the corrective actions are completed. Correctiveactions for field measurements may include: • Repeat the measurement to check the error• Re-calibration• Replace the instrument or measurement device• Stop work (if necessary). The Field Team Leader, or his designee, is responsible for all field work activities. In case thesampling program changes, the Field Team Leader will implement the changes after obtainingapproval from the MPCA Principal Investigator. Corrective actions resulting from internal field audits will be implemented immediately if datamay be adversely affected due to unapproved or improper use of approved methods. The MPCAQA Officer will identify deficiencies and recommend corrective actions to the MPCA PrincipalInvestigator. Implementation of corrective actions will be performed by the Field Team Leader.

Minnesota Slip QA Project Plan Section B
Revision No.: 0 01/03/00 Page 62
Corrective actions will be documented in quality assurance reports to the entire projectmanagement. Corrective actions will be implemented and documented in the field notebook. No staff memberwill initiate corrective actions without prior communication of findings through the properchannels. If corrective actions are insufficient, work may be stopped by the GLNPO ProjectOfficer. B2.5 Sampling Equipment, Preservation, and Holding Time Requirements The procedures to prevent sample contamination were described in section B2.2.2. Compositedsediment samples from each site will be split for various chemical and physical analyses. Inaddition, applicable composite samples will be split for toxicity testing. The sample containers for organics will be 250-mL solvent rinsed glass jars with Teflon -linedlids. En Chem, Inc. will use one such jar for PCB congeners, AVS, and SEM determinations foreach sample. Mercury, metals, TOC, ammonia, and percent moisture will all be run on the samesample jars at MDH; this will be a half-filled 250-mL pre-cleaned polyethylene jar. Sedimentsfor particle size analysis will be collected in 60-mL pre-cleaned glass jars with Teflon -linedlids. The sediment samples for toxicity testing will be collected in pre-cleaned 4-L high densitypolyethylene bottles with Teflon -lined lids. The sample integrity will be preserved by keepingthe samples cold at 4 °C; organic samples will be kept in the dark. The maximum holding timesgiven in Table B-2 will be used as a general guideline for sediment samples. B3 SAMPLE HANDLING AND CUSTODY REQUIREMENTS B3.1 Purpose/Background This section of the QAPP will describe all procedures that are necessary for ensuring that: • Samples are collected, transferred, stored, and analyzed by authorized personnel.• Sampling integrity is maintained during all phases of sample handling and analyses.• An accurate written record is maintained of sample handling and treatment from the time of
its collection through laboratory procedures to disposal.
B3.2 Sample Custody Procedure
Sample tracking will be an important component of this project to ensure that samples are notmisplaced or lost during field collection and transport to the contract laboratories. Legal chain-of-custody procedures will not be followed for this project because the data will not be used for

Minnesota Slip QA Project Plan Section B
Revision No.: 0 01/03/00 Page 63
Table B-2. Sediment Sample Volume, Container, Preservation, and Holding Time Requirements
Analyte*
Amount Requiredfor SampleAnalysis (g)
Size/Type ofJar Preservation Holding Time
PAHs 100 250 mL, glass Cool/dark, 4 °C 42 days
PCBs 100 250 mL, glass Cool/dark, 4 °C 42 days
Mercury 5 250 mL,plastic
Cool, 4 °C 30 days
Metals (Cd, Cr,Cu, Ni, Pb, Se,Zn)
5 250 mL,plastic
Cool, 4 °C 30 days
AVS 30 250 mL,glass
Cool, 4 °C 14 days
SEM Sample extractof AVS
250 mL,glass
Cool, 4 °C 30 days
Ammonia 20 250 mL,plastic
Cool, 4 °C 30 days
Particle Size 20 60 mL, glass Cool, 4 °C 6 months
TOC 0.2 250 mL,plastic
Cool, 4 °C 40 days
Percent Moisture 40 250 mL,plastic
Cool, 4 °C 40 days
* Note: Sediment samples for PCBs, AVS, and SEM will be collected in the same jar. Also,sediment samples for mercury, metals, ammonia, TOC, and percent moisture will be collectedin the same container.

Minnesota Slip QA Project Plan Section B
Revision No.: 0 01/03/00 Page 64
enforcement purposes. A sampling tracking system will be in place using modified chain-of-custody procedures and associated paperwork (Table B-3). ENSR’s chain-of-custody forms willbe used for samples sent to them (Table B-4). For sediment samples sent to MDH, the MPCA’sSediment MDH Lab Sheet (Tables B-5 and B-6) will be used. This form contains a chain-of-custody record which will not be legally binding. The use of different tracking forms will help toseparate the samples being sent to different contract laboratories.
All samples will be assigned a unique identifying code that identifies the project sample site(MNS), year of sampling (1999), and sample number (01 through 18). Since all of the sampleswill be of a sediment matrix, a matrix identifier will not be included in the sample code. Also,since sampling will occur during one temporal time period, the entire date will not be included inthe code. In order to facilitate the ease with which the sample identifiers are written on the jarlabels, the codes will be as such: MNS-99-01 through MNS-99-18. In addition, the core depthinterval will be recorded on the jar label under the sample name. An example label is given inFigure B-6. Sample labels are to be completed for each sample using waterproof ink unlessprohibited by weather conditions. For example, a logbook notation would explain that a pencilwas used to fill out the sample label because the pen would not function.
During each field sampling day, samples will be stored on ice in a cooler. The samples will bestored in a refrigerator at the MPCA’s Duluth Regional Office at the end of each day. TheMPCA Principal Investigator will be personally responsible for the care and custody of thesamples until they are transferred or properly dispatched. As few people as possible will handlethe samples.
After field sampling is completed on September 23 and October 1, 1999, the particle sizesamples will be hand delivered to Keith Lodge (UMD) by MPCA staff. The rest of the sedimentsamples will be transported, in coolers, by MPCA staff to the Field Operations Center in St. Paul.Ed Norwig, MPCA, will be responsible for transporting the MDH samples to the MDHlaboratory in Minneapolis.
Both En Chem and ENSR will provide the MPCA with sample kits, including sample bottles,coolers, packaging materials, and chain-of-custody forms. The MPCA Principal Investigatorwill ensure the samples are packaged properly by keeping them cold (i.e., through use of blue icepacks) and are immobilized with packing material (e.g., bubble-pack) to reduce the risk ofbreakage. A copy of the chain-of-custody form will be placed in a zip-loc bag and taped to theinside lid of the cooler. The outside of the container will be shut using fiberglass tape. Thelaboratory name and address, as well as the return name and address, will be clearly labeled onthe outside of the container. The labels “Environmental Samples” and “This End Up” will beclearly printed on the top of the shipping cooler. The samples are not anticipated to be classifiedas hazardous waste; therefore, Department of Transportation regulations will not apply forshipment. These samples will be sent to the contract laboratories by a common courier.


Minnesota Slip QA Project Plan Section B
Revision No.: 0 01/03/00 Page 70
When the contract laboratories (except UMD) are done using the sediments, they will dispose ofthe sediments per their in-house requirements. UMD will return the sample jars to the MPCAfor disposal.
B4 ANALYTICAL METHODS REQUIREMENTS
B4.1 Purpose/Background
The purpose of this section is to identify the analytical methods and equipment required,including sub-sampling or extraction methods, laboratory decontamination procedures, wastedisposal requirements, and specific performance requirements. In addition, corrective actions forlaboratory operations will be discussed.
B4.2 Subsampling
Some of the sediment sample jars will be used for more than one analysis. This will require thatthe sample be homogenized so that a representative subsample can be obtained. This will applyto the analytes that En Chem will analyze for (i.e., PCB congeners, AVS/SEM), and for theinorganic parameters, TOC, and ammonia that will be analyzed by MDH.
B4.3 Preparation of the Samples
Information on the sampling containers, methods of preservation, holding times, holdingconditions, and names of laboratories was given in Table B-2. The number of field replicateswas given in Table A-2. The preparation of the samples, prior to analysis, is given in thecontract laboratories SOPs for analytical (Appendix F) and toxicological procedures (AppendixG).
B4.4 Analytical Methods
Table B-7 summarizes the methods used to measure PAH compounds, PCB congeners, mercury,metals (cadmium, chromium, copper, lead, nickel, selenium, zinc), AVS, SEM, TOC, ammonia,particle size, and percent moisture. Each laboratory will implement the project required SOPs(Appendices F and G). These SOPs provide sufficient details for sample preparation, cleanup,and analysis applicable to this investigation. ENSR’s QA Manual, MDH’s QA Manual, and EnChem’s Statement of Qualifications are provided in Appendices H, I, and J, respectively.
B4.5 Toxicity Testing Methods
The 10-day sediment toxicity tests with Chironomus tentans will be conducted to assess survivaland growth (i.e., weight) according to U.S. EPA (1994). The 28-day sediment toxicity tests with
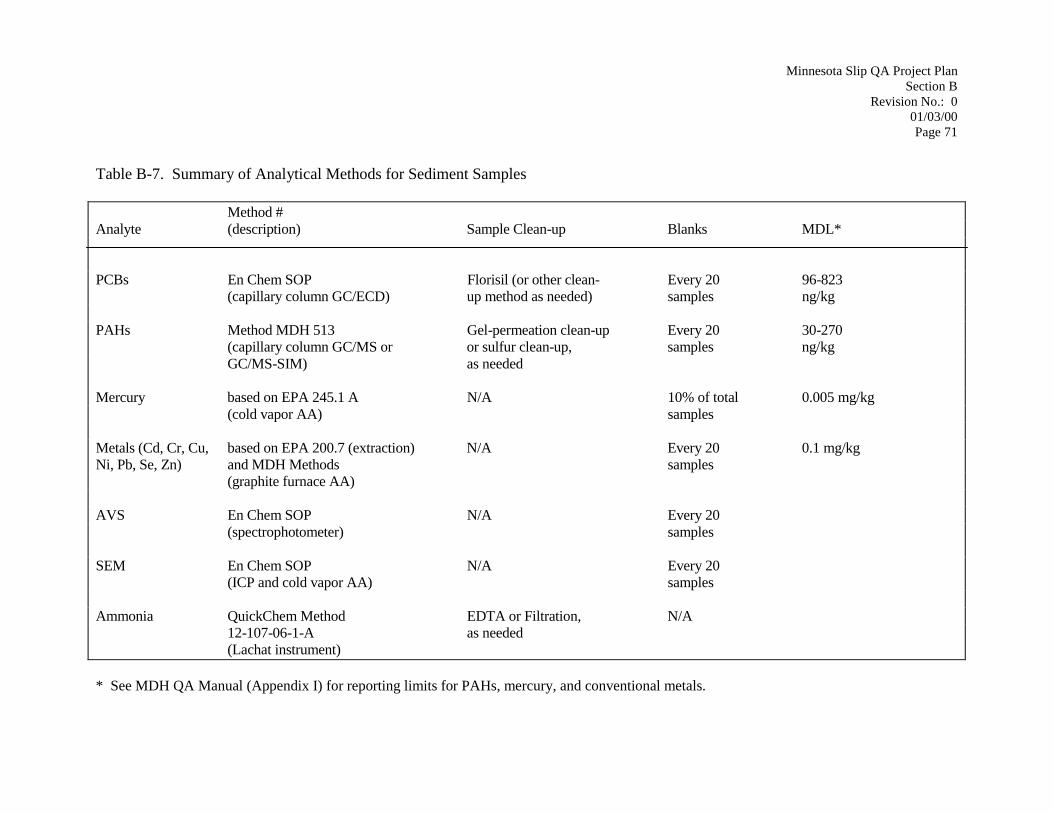
Minnesota Slip QA Project Plan Section B
Revision No.: 0 01/03/00 Page 71
Table B-7. Summary of Analytical Methods for Sediment Samples
Method # Analyte (description) Sample Clean-up Blanks MDL*
PCBs En Chem SOP Florisil (or other clean- Every 20 96-823(capillary column GC/ECD) up method as needed) samples ng/kg
PAHs Method MDH 513 Gel-permeation clean-up Every 20 30-270(capillary column GC/MS or or sulfur clean-up, samples ng/kgGC/MS-SIM) as needed
Mercury based on EPA 245.1 A N/A 10% of total 0.005 mg/kg(cold vapor AA) samples
Metals (Cd, Cr, Cu, based on EPA 200.7 (extraction) N/A Every 20 0.1 mg/kgNi, Pb, Se, Zn) and MDH Methods samples
(graphite furnace AA)
AVS En Chem SOP N/A Every 20(spectrophotometer) samples
SEM En Chem SOP N/A Every 20(ICP and cold vapor AA) samples
Ammonia QuickChem Method EDTA or Filtration, N/A12-107-06-1-A as needed(Lachat instrument)
* See MDH QA Manual (Appendix I) for reporting limits for PAHs, mercury, and conventional metals.

Minnesota Slip QA Project Plan Section B
Revision No.: 0 01/03/00 Page 72
Table B-7. Continued
Method # Analyte (description) Sample Clean-up Blanks MDL
TOC MDH Sample Ignition Method N/A Every 20 0.1%(Dohrmann DC-80 TOC analyzer) samples
Particle Size UMD SOP N/A N/A N/A(Horiba LA-900 Analyzer)
Percent Moisture MDH Method based on Standard N/A N/A N/AMethod 208G(gravimetric technique)

Minnesota Slip QA Project Plan Section B
Revision No.: 0 01/03/00 Page 73
Hyalella azteca will be conducted according to Ingersoll et al. (1998); this publication will beincluded as a revision to the U.S. EPA (1994) sediment toxicity testing methods and the revisionto ASTM E1706. Table B-8 summaries the recommended test conditions for conducting the 10-day Chironomus tentans toxicity test, whereas Table B-9 provides the test acceptabilityrequirements for this test. The test conditions, general activity schedule, and test acceptabilityrequirements for the 42-day Hyalella azteca toxicity test are provided in Tables B-10 through B-12, respectively.
B5 QUALITY CONTROL REQUIREMENTS
B5.1 Purpose/Background
The purpose of this section is to identify required measurement QC checks for both the field andthe laboratory. QC is “the overall system of technical activities that measures the attributes andperformance of a process item, or service against defined standards to verify that they meet thestated requirements established by the customer” (USEPA, 1998). QC is both corrective andproactive in establishing techniques to prevent the generation of unacceptable data. Thus, thepolicy for corrective action will be discussed.
B5.2 QC Procedures
Most of the QC procedures for this project were defined in Section A4.3. Other elements of theQAPP that contained related sampling and analytical QC requirements included:
• Sampling Process Design (B1), which identified the planned field QC samples, as well asprocedures for QC sample preparation and handling.
• Sampling Method Requirements (B2), which included requirements for determining if the
collected samples accurately represented the population of interest. • Sample Handling and Custody Requirements (B3), which discussed any QC devices
employed to ensure samples will not be tampered with (e.g., custody seals) or subjected toother unacceptable conditions during transport.
• Analytical Methods Requirements (B4), which included information on the subsampling
methods and information on the preparation of QC samples in the sample matrix (e.g., spikes,replicates).
• Instrument Calibration and Frequency (B7), which defined prescribed criteria for
triggering recalibration (e.g., failed calibration checks).

Minnesota Slip QA Project Plan Section B
Revision No.: 0 01/03/00 Page 74
Table B-8. Recommended Test Conditions for Conducting a 10-day Sediment Toxicity Testwith Chironomus tentans ___________________________________________________________________________________________ Parameter Conditions________________________________________________________________________________________________________
1. Test type: Whole-sediment toxicity test with renewal ofoverlying water
2. Temperature: 23 ± 1°C
3. Light quality: Wide-spectrum fluorescent lights
4. Illuminance: About 500 to 1000 lux
5. Photoperiod: 16L:8D
6. Test chamber: 300-mL high-form lipless beaker
7. Sediment volume: 100 mL
8. Overlying water volume: 175 mL
9. Renewal of overlying water: 2 volume additions/day; continuous or intermittent(e.g., one volume addition every 12 hours)
10. Age of organisms: Second- to third-instar larvae (All organisms must bethird instar or younger with at least 50% of theorganisms at third instar)
11. Number of organisms/chamber: 10
12. Number of replicate chambers/treatment: Depends on the objective of the test. Eight replicatesare recommended for routine testing
13. Feeding: Tetrafin goldfish food, fed 1.5 mL daily to each testchamber (1.5 mL contains 6.0 mg of dry solids)
14. Aeration: None, unless dissolved oxygen in overlying waterdrops below 2.5 mg/L.
15. Overlying water: Culture water, well water, surface water, site water,or reconstituted water
16. Test chamber cleaning: If screens become clogged during a test; gently brushthe outside of the screen
17. Overlying water quality: Hardness, alkalinity, conductivity, pH, and ammoniaat the beginning and end of a test. Temperature anddissolved oxygen daily
18. Test duration: 10 days
19. Endpoints: Survival and growth (ash-free dry weight; AFDW)
20. Test acceptability: Minimum mean control survival must be 70% withminimum mean weight per surviving controlorganism of 0.48 mg AFDW.

Minnesota Slip QA Project Plan Section B
Revision No.: 0 01/03/00 Page 75
Table B-9. Test Acceptability Requirements for a 10-day Sediment Toxicity Test withChironomus tentans __________________________________________________________________________________________
A. It is recommended for conducting a 10-day test with C. tentans that the following performance criteria be met:
1. Tests must be started with second- to third-instar larvae (about 10-day-old larvae). At least 50% of the larvaemust be in the third instar at the start of the test.
2. Average survival of C. tentans in the control sediment must be greater than or equal to 70% at the end of thetest.
3. Average size of C. tentans in the control sediment must be at least 0.48 mg AFDW at the end of the test.
4. Hardness, alkalinity, and ammonia in the overlying water typically should not vary by more than 50% duringthe test, and dissolved oxygen should be maintained above 2.5 mg/L in the overlying water.
B. Performance-based criteria for culturing C. tentans include the following
1. It may be desirable for laboratories to periodically perform 96-h water-only reference-toxicity tests to assessthe sensitivity of culture organisms. Data from these reference toxicity tests could be used to assess geneticstrain or life-stage sensitivity of test organisms to select chemicals.
2. The commercial supplier providing organisms to the laboratories should keep a record of time to firstemergence for each culture and record this information using control charts. Records should also be kept onthe frequency of restarting cultures.
3. The commercial supplier should record the following water-quality characteristics of the cultures at leastquarterly: pH, hardness, alkalinity, and ammonia. Dissolved oxygen in the cultures should be measuredweekly. Temperature in the cultures should be recorded daily. If static cultures are used, it may be desirableto measure water quality more frequently.
4. The commercial supplier should characterize and monitor background contamination and nutrient quality offood if problems are observed in culturing or testing organisms.
5. Physiological measurements such as lipid content might provide useful information regarding the health ofthe cultures.
C. Additional requirements:
1. All organisms in a test must be from the same source.
2. Storage of sediments collected from the field should follow ASTM guidance.
3. All test chambers (and compartments) should be identical and should contain the same amount of sedimentand overlying water.
4. Negative-control sediment and appropriate solvent controls must be included in a test. The concentration ofsolvent used must not adversely affect test organisms.
5. Test organisms must be cultured and tested at 23°C (+1 °C).
6. The daily mean test temperature must be within ±1°C of 23°C. The instantaneous temperature must alwaysbe within ±3°C of 23°C.
7. Natural physico-chemical characteristics of test sediment collected from the field should be within thetolerance limits of the test organisms.

Minnesota Slip QA Project Plan Section B
Revision No.: 0 01/03/00 Page 76
Table B-10. Test Conditions for Conducting a 42-day Sediment Toxicity Test with Hyalellaazteca ____________________________________________________________________________________________ Parameter Conditions_________________________________________________________________________________________________________
1. Test type: Whole-sediment toxicity test with renewal ofoverlying water
2. Temperature: 23 ± 1°C 3. Light quality: Wide-spectrum fluorescent lights 4. Illuminance: About 500 to 1000 lux 5. Photoperiod: 16L:8D 6. Test chamber: 300-mL high-form lipless beaker 7. Sediment volume: 100 mL 8. Overlying water volume: 175 mL in the sediment exposure from Day 0 to Day
28 (175 to 275 mL in the water-only exposure fromDay 28 to Day 42)
9. Renewal of overlying water: 2 volume additions/day; continuous or intermittent(e.g., one volume addition every 12 hours)
10. Age of organisms: 7- to 8-day old at the start of the test 11. Number of organisms/chamber: 10
12. Number of replicate chambers/treatment: 12 (4 for 28-day survival and growth and 8 for 35-and 42-day survival, growth, and reproduction).Reproduction is more variable than growth orsurvival; hence, more replicates might be needed toestablish statistical differences among treatments.
13. Feeding: YCT food, fed 1.0 mL (1800 mg/L stock) daily toeach test chamber
14. Aeration: None, unless dissolved oxygen in overlying waterdrops below 2.5 mg/L.
15. Overlying water: Culture water, well water, surface water or site water.Use of reconstituted water is not recommended.
16. Test chamber cleaning: If screens become clogged during a test; gently brushthe outside of the screen
17. Overlying water quality: Hardness, alkalinity, conductivity, and ammonia atthe beginning and end of a sediment exposure (Day 0and 28). Temperature daily. Conductivity weekly.Dissolved oxygen (DO) and pH three times/week.Concentrations of DO should be measured moreoften if DO drops more than 1 mg/L since theprevious measurement.
18. Test duration: 42 days 19. Endpoints: 28-day survival and growth; 35- and 42-day survival,
growth, reproduction, and number of adult males andfemales on Day 42.
20. Test acceptability: Minimum mean control survival of 80% on Day 28.

Minnesota Slip QA Project Plan Section B
Revision No.: 0 01/03/00 Page 77
Table B-11. General Activity Schedule for Conducting a 42-day Sediment Toxicity Test withHyalella azteca _________________________________________________________________________________________
Day Activity_________________________________________________________________________________________________________Pre-Test
-8 Separate known-age amphipods from the cultures and place in holding chambers. Begin preparing foodfor the test. The <24-hour amphipods are fed 10 mL of YCT (1800 mg/L stock solution) and 10 mL ofSelenastrum capricornutum (about 3.0 x 10⁷ cells/mL) on the first day of isolation and 5 mL of bothYCT and S. capricornutum on the 3rd and 5th day after isolation.
-7 Remove adults and isolate <24-hour old amphipods.
-6 to -2 Feed and observe isolated amphipods, monitor water quality (e.g., temperature and dissolved oxygen).
-1 Feed and observe isolated amphipods, monitor water quality. Add sediment into each test chamber,place chambers into exposure system, and start renewing overlying water.
Sediment Test
0 Measure total water quality (pH, temperature, dissolved oxygen, hardness, alkalinity, conductivity,ammonia). Transfer ten 7- to 8-day old amphipods into each test chamber. Release organisms underthe surface of the water. Add 1.0 mL of YCT (1800 mg/L stock) into each test chamber. Archive 20test organisms for length determination or archive 80 amphipods for dry weight determination.Observe behavior of test organisms.
1 to 27 Add 1.0 mL of YCT to each test beaker. Measure temperature daily, conductivity weekly, anddissolved oxygen (DO) and pH three times/week. Observe behavior of test organisms.
28 Measure temperature, dissolved oxygen, pH, hardness, alkalinity, conductivity and ammonia. End thesediment-exposure portion of the test by collecting the amphipods with a #40 mesh sieve (425-µmmesh; U.S. standard size sieve). Use four replicates for growth measurements: count survivors andpreserve organisms in sugar formalin for growth measurements. Eight replicates for reproductionmeasurements: place survivors in individual replicate water-only beakers and add 1.0 mL of YCT toeach test beaker/day and 2 volume additions/day of overlying water.
Reproduction Phase
29 to 35 Feed daily. Measure temperature daily, conductivity weekly, DO, and pH three times a week.Measure hardness and alkalinity weekly. Observe behavior of test organisms.
35 Record the number of surviving adults and remove offspring. Return adults to their original individualbeakers and add food.
36 to 41 Feed daily. Measure temperature daily, conductivity weekly, DO, and pH three times a week.Measure hardness and alkalinity weekly. Observe behavior of test organisms.
42 Same as Day 1. Measure total water quality (pH, temperature, dissolved oxygen, hardness, alkalinity,conductivity, ammonia). Record the number of surviving adults and offspring. Surviving adultamphipods on Day 42 are preserved in sugar formalin solution. The number of adult males in eachbeaker is determined from this archived sample. This information is used to calculate the number ofyoung produced per female per replicate from Day 28 to day 42.

Minnesota Slip QA Project Plan Section B
Revision No.: 0 01/03/00 Page 78
Table B-12. Test Acceptability Requirements for a 42-day Sediment Toxicity Test with Hyalellaazteca ____________________________________________________________________________________________
A. It is recommended for conducting the 42-day test with H. azteca that the following performance criteria be met:
1. Age of H. azteca at the start of the test should be 7- to 8-days old. Starting a test with substantially younger orolder organisms may compromise the reproductive endpoint.
2. Average survival of H. azteca in the control sediment on Day 28 should be greater than or equal to 80%.
3. Laboratories participating in round-robin testing reported after 28-day sediment exposures in a controlsediment (West Bearskin), survival >80% for >88% of the laboratories; length >3.2 mm/individual for >92%of the laboratories; and dry weight >0.15 mg/individual for 72% of the laboratories. Reproduction from Day28 to Day 42 was >2 young/female for 63% of the laboratories participating in the round-robin testing.Reproduction was more variable within and among laboratories; hence, more replicates might be needed toestablish statistical differences among treatments with this endpoint.
4. Hardness, alkalinity, and ammonia in the overlying water typically should not vary by more than 50% duringthe sediment exposure, and dissolved oxygen should be maintained above 2.5 mg/L in the overlying water.
B. Performance-based criteria for culturing H. azteca include the following
1. It may be desirable for laboratories to periodically perform 96-hour water-only reference-toxicity tests toassess the sensitivity of culture organisms. Data from these reference toxicity tests could be used to assessgenetic strain or life-stage sensitivity of test organisms to select chemicals.
2. The commercial supplier providing organisms to the laboratories should track parental survival in the culturesand record this information using control charts if known-age cultures are maintained. Records should alsobe kept on the frequency of restarting cultures and the age of brood organisms.
3. The commercial supplier should record the following water-quality characteristics of the cultures at leastquarterly: pH, hardness, alkalinity, and ammonia. Dissolved oxygen in the cultures should be measuredweekly. Temperature in the cultures should be recorded daily. If static cultures are used, it may be desirableto measure water quality more frequently.
4. The commercial supplier should characterize and monitor background contamination and nutrient quality offood if problems are observed in culturing or testing organisms.
5. Physiological measurements such as lipid content might provide useful information regarding the health ofthe cultures.
C. Additional requirements:
1. All organisms in a test must be from the same source.
2. Storage of sediments collected from the field should follow ASTM guidance.
3. All test chambers (and compartments) should be identical and should contain the same amount of sedimentand overlying water.
4. Negative-control sediment and appropriate solvent controls must be included in a test. The concentration ofsolvent used must not adversely affect test organisms.
5. Test organisms must be cultured and tested at 23°C (+1 °C).

Minnesota Slip QA Project Plan Section B
Revision No.: 0 01/03/00 Page 79
Table B-12. Continued
C. Additional requirements:
6. The mean of the daily test temperature must be within ±1°C of 23°C. The instantaneous temperature mustalways be within ±3°C of 23°C.
7. Natural physico-chemical characteristics of test sediment collected from the field should be within thetolerance limits of the test organisms.

Minnesota Slip QA Project Plan Section B
Revision No.: 0 01/03/00 Page 80
For the toxicity tests, QC procedures will include using several replicates for each sedimentsample, setting up negative controls with the toxicity tests, and running reference toxicant tests tocheck on the health of the organisms. Control charts for the reference toxicant tests will be oneway to document the toxicological QC results. For the field quality control checks, the only field measurements planned for this project arethose related to positioning the boat (i.e., GPS unit). Attainable precision is approximately 1-10 m. To verify this precision, the “marking” method can be used to find known geographicallocations (e.g., benchmarks) using only the tracking capabilities of the GPS unit. The Vibrocorer will be lined with 6 mil polyethylene, which will be removed with each coresample and replaced. The sediment core samples will be decontaminated by removing the outer2-4 mm of sample prior to homogenization. This will serve as a quality control check to reducecontamination of the core from the liner. For the laboratory quality control checks, each of the laboratories identified in this QAPP have aQC program they use to ensure the reliability and validity of the analyses performed at thelaboratory. All analytical procedures are documented in writing as SOPs and each SOP includesQC information which addresses the minimum QC requirements for the procedure. The internalquality control checks might differ slightly for each individual procedure, but in general, the QCrequirements include the following: • Method blanks• Reagent/preparation blanks (applicable to inorganic analysis)• Instrument blanks• Matrix spikes/matrix spike duplicates (for organic analysis)• Surrogate spikes• Analytical spikes (graphite furnace)• Field replicates• Laboratory duplicates• Laboratory control standards• Internal standard areas for GC/MS or GC/ECD analysis; control limits. Table B-13 summarizes the internal quality control checks used for each of the critical analyses.Details on the use of each QC check are provided in the analytical SOPs provided for eachmeasurement (see Appendix F). Method detection limits will be calculated for each analyte. The analyses for PCBs and PAHs use a method blank (consisting of an extracted matrix orsolvent phase sample with “zero” known concentration of the analytes), and a matrix spike (acontrol uncontaminated sediment spiked with known analyte concentration), which are subjectedto analyses identical to the samples. Analytical duplicate samples will be run after every 20

Minnesota Slip QA Project Plan Section B
Revision No.: 0 01/03/00 Page 81
Table B-13. Summary of Analytical Quality Control Checks for Critical Measurements Analyte
Number of FieldReplicates
Spikes
Blanks
Analytical Duplicates
Standards
PCBs 3 Matrix Solvent, Method Every 20 samples see SOP PAHs 7 Matrix Solvent, Method Every 20 samples see SOP Mercury 10 N/A Method Every 10 samples see SOP Metals
14 (Pb, Zn) 1 (other metals)
Fortified Sample Matrix
Method Every 10 samples see SOP
AVS 1 Matrix Method Every 20 samples see SOP SEM 1 N/A N/A N/A N/A Ammonia 1 N/A N/A Every 10 samples see SOP TOC 7 N/A Method Every 10 samples see SOP Percent Moisture 14 N/A N/A Every 10 samples N/A Particle Size 9 N/A N/A Every 12 samples N/A

Minnesota Slip QA Project Plan Section B
Revision No.: 0 01/03/00 Page 82
samples. These analyses will also include measurement of a surrogate internal standard.Acceptance criteria for these internal QC checks are: a “clean” procedural blank, recoverieswithin the control limits specified in the SOPs for both blank and matrix spike recovery, as wellas for the surrogate standard recoveries (Appendix F). Relative error for duplicate samples mustbe less than 50% relative percent difference (RPD) (Table A-6). Internal QC checks for metals include the use of blanks, a measured standard NBS referencematerial (for metals) or NIST standard (for Hg). Analytical duplicate measurements will bemade after at least every 10 samples to measure precision. Acceptable precision and accuracylimits for mercury and the metals are given in Table A-6. In addition, the precision and accuracylimits for other parameters (AVS, SEM, ammonia, particle size, TOC, and percent moisture) aregiven in Table A-6. All data obtained will be properly recorded. The data package will include a full deliverablepackage capable of allowing the recipient to reconstruct QC information and compare it to QCcriteria. Any samples analyzed in nonconformance with the QC criteria will be reanalyzed bythe laboratory if sufficient volume is available. It is expected that sufficient volumes/weights ofsamples will be collected to allow for reanalysis when necessary. B6 INSTRUMENT/EQUIPMENT TESTING, INSPECTION, AND MAINTENANCE REQUIREMENTS B6.1 Purpose/Background The purpose of this section is to discuss the procedures used to verify that all instruments andequipment are maintained in sound operating condition and are capable of operating atacceptable performance levels. B6.2 Testing, Inspection, and Maintenance The success of this project is dependent on well functioning field, analytical, and toxicologicalequipment. Preventative maintenance of this equipment is the key to reduce possible projectdelays due to faulty equipment. B6.2.1 Field Activities The field equipment for this project includes the GPS units (MPCA/GLNPO), Shipek grabsampler (MPCA), Livingston corer (MPCA), modified drop corer (MPCA), Vibrocorer(GLNPO), and sediment sounding poles. In addition, two different research vessels will beutilized for sediment sampling: the MPCA’s R/V Naiad and GLNPO’s R/V Mudpuppy.Preventative maintenance procedures for MPCA equipment will follow the professionaljudgment of the MPCA Field Team Leader. GLNPO’s preventative maintenance procedures

Minnesota Slip QA Project Plan Section B
Revision No.: 0 01/03/00 Page 83
will be followed for their equipment. The sounding poles are metal rods which do not requireany preventative maintenance. Corrective action in the field may be needed when the sample network is changed (i.e., more/lesssamples, sampling locations other than those specified in the QAPP, etc.), or when samplingprocedures and/or field analytical procedures require modification due to unexpected conditions.Technical staff and project personnel will be responsible for reporting all suspected technical orQA nonconformances, or suspected deficiencies of any activity or issued document, by reportingthe situation to the Field Team Leader or designee. This person will be responsible for assessingthe suspected problems, in consultation with the MPCA Principal Investigator, and making adecision based on the potential for the situation to impact the quality of the data. If it isdetermined that the situation warrants a reportable nonconformance requiring corrective action,then a nonconformance report will be initiated by the MPCA Principal Investigator. The MPCA Principal Investigator will be responsible for ensuring that corrective actions fornonconformances are initiated by: • Evaluating all reported nonconformances• Controlling additional work on nonconforming items• Determining disposition or action to be taken• Maintaining a log of nonconformances• Reviewing nonconformance reports and corrective actions taken• Ensuring nonconformance reports are included in the final report files. If appropriate, the Field Team Leader will ensure that no additional work, that is dependent onthe nonconforming activity, is performed until the corrective actions are completed. Correctiveactions for field measurements may include: • Repeat the measurement to check the error• Re-calibration• Replace the instrument or measurement device• Stop work (if necessary). The Field Team Leader, or his designee, is responsible for leading all field work activities. Incase the sampling program changes, the Field Team Leader will implement the changes afterobtaining approval from the MPCA Principal Investigator. Corrective actions resulting from internal field audits will be implemented immediately if datamay be adversely affected due to unapproved or improper use of approved methods. The MPCAQA Officer will identify deficiencies and recommend corrective actions to the MPCA PrincipalInvestigator. Implementation of corrective actions will be performed by the Field Team Leader.

Minnesota Slip QA Project Plan Section B
Revision No.: 0 01/03/00 Page 84
Corrective actions will be documented in quality assurance reports to the entire projectmanagement. Corrective actions will be implemented and documented in the field notebook. No staff memberwill initiate corrective actions without prior communication of findings through the properchannels. If corrective actions are insufficient, work may be stopped by the GLNPO ProjectOfficer. B6.2.2 Laboratory Activities As part of each contract laboratories QA/QC program, a routine preventative maintenanceprogram will be conducted by them to minimize the occurrence of instrument failure and othersystem malfunctions. All laboratory instruments are maintained in accordance withmanufacturer’s specifications and the requirements of the specific method employed. Thismaintenance is carried out on a regular, scheduled basis and is documented in the laboratoryinstrument service logbook for each instrument. Corrective actions in the laboratory may occur prior to, during, and after initial analysis. Anumber of conditions such as broken sample containers, multiple phases, and potentially highconcentration samples may be identified during sample log-in or just prior to analysis.Following consultation with laboratory analysts and section leaders, it may be necessary for theLaboratory QA Manager to approve the implementation of corrective actions. The submittedSOPs specify some conditions during or after analysis that may automatically trigger correctiveactions of samples, including additional sample extract cleanup and automaticreinjection/reanalysis when certain quality control criteria are not met (Appendix F). Corrective actions are required whenever an out-of-control event or potential out-of-controlevent is noted. The investigative action taken is somewhat dependent on the analysis and theevent. Laboratory personnel are alerted that corrective actions may be necessary if: • QC data are outside the warning or acceptable windows for precision and accuracy• Blanks contain target analytes above acceptable levels• Undesirable trends are detected in spike recoveries or RPD between duplicates• There are unusual changes in detection limits• QC limits for sediment toxicity tests are not met• Deficiencies are detected by the Laboratory, MPCA, and/or GLNPO QA Officer(s) during
any internal or external audits or from the results of performance evaluation samples• Inquires concerning data quality are received. Corrective action procedures are often handled at the bench level by the analyst, who reviews thepreparation or extraction procedure for possible errors, checks the instrument calibration, spike

Minnesota Slip QA Project Plan Section B
Revision No.: 0 01/03/00 Page 85
and calibration mixes, instrument sensitivity, experimental set-up for toxicity tests, and so on. Ifthe problem persists or cannot be identified, the matter is referred to the Laboratory Managerand/or Laboratory QA Officer for further investigation. Once resolved, full documentation ofthe corrective action procedure will be filed with the Laboratory QA Officer. These corrective actions are performed prior to release of the data from the laboratory. Thecorrective actions will be documented in both the laboratories corrective action log and thenarrative data report sent from the laboratory to the MPCA Principal Investigator. If correctiveaction does not rectify the situation, the laboratory will contact the MPCA Principal Investigator. B7 INSTRUMENT CALIBRATION AND FREQUENCY B7.1 Purpose/Background This section concerns the calibration procedures that will be used for instrumental analyticalmethods and other measurement methods that are used in environmental measurements.Calibration is defined as checking physical measurements against accepted standards. B7.2 Instrumentation Requiring Calibration The only field instruments that will require calibration are the GPS units owned by the MPCAand GLNPO. All of the equipment used to analyze the sediment samples will require calibration,as will the water quality equipment used to monitor overlying water quality parameters in thesediment toxicity tests. B7.3 Calibration Methods that will be Used for Each Instrument B7.3.1 Field Instrument Calibration A SOP for the calibration and use of the MPCA GPS unit is not available. Instead, the operatingmanual for the GPS Pathfinder Basic™ Receivers will be used to calibrate the GPS unit (TrimbleNavigation, 1992). Calibration and use of GLNPO’s GPS units will be per their procedures. B7.3.2 Laboratory Instrument Calibration Calibration of analytical instruments is essential because it is the means by which the instrumentresponses are properly translated into chemical concentrations. Instrument calibration isperformed before sample analysis begins and is continued during sample analysis at the intervalsspecified in Table B-14 to ensure that the data quality objectives are met. Initial calibration is

Minnesota Slip QA Project Plan Section B
Revision No.: 0 01/03/00 Page 86
Table B-14. Summary of Calibration Methods for Analytes in Sediment Samples and ToxicityTesting Water Column Samples Matrix
Analyte
Initial Calibration
Ongoing Calibration
Sediment PCBs 5 pt. curve of 11 congeners Every 5 samples Sediment PAHs 6 pt. curve Every 12 hours Sediment Mercury 4 pt. curve Every 20 samples Sediment Metals 4 pt. curve (GFAA) Every 10 samples Sediment AVS 9 pt. curve Every 20 samples Sediment SEM 2 pt. curve (ICP) Every 20 samples Sediment Ammonia 7 pt. curve Every 20 samples Sediment TOC single pt. Every 20 samples Water Ammonia 3 pt. curve Daily Water Conductivity 2 calibration standards Daily Water DO saturated oxygen reading Daily Water pH standard pH 7.0 and 10.0
buffers Every 3 hours with apH 7.0 buffer

Minnesota Slip QA Project Plan Section B
Revision No.: 0 01/03/00 Page 87
performed prior to sample analysis to determine whether the response of the instrument is linearacross a range of target analyte concentrations (i.e., the working linear range). For this study, instrument calibration procedures are described in Table B-14 and in theanalytical SOPs (Appendix F). All ongoing calibration measurements must be within 20% of theinitial calibration measurement to be considered adequate. B7.4 Calibration Apparatus None of the analytical instruments will be calibrated using a calibration apparatus. B7.5 Calibration Standards The working linear range of an instrument should be established prior to performing sampleanalyses. A minimum of five calibration standards for the analysis of organic compounds, andthree calibration standards for the analysis of inorganic compounds, should be used whenestablishing the working linear range for all target analytes of concern. Generally, the workinglinear range of an instrument for a specific analysis should bracket the expected concentrationsof the target analyte in the samples to be analyzed. The calibration standards used to establishthe working linear range should encompass a factor of 20 (i.e., 1 to 20, with the lowestconcentration equal to 1 and the highest concentration equal to 20 times the concentration of thelowest concentration used). B7.6 Calibration Frequency It is critical that the stability of the instrument response be verified during the course of ongoingsample analyses. The verification of instrument stability is assessed by analyzing continuingcalibration standards at regular intervals during the period that sample analyses are performed. Itis recommended that, at a minimum, calibration standards be analyzed at the beginning of eachanalytical sequence, after every tenth sample, and at the end of the analytical sequence for allorganic and inorganic compound analyses performed. The concentration of the continuingcalibration standard should be equivalent to the concentration of the midpoint established duringinitial calibration of the working linear range of the instrument. Equipment logbooks will be maintained at each contract laboratory, in which will be recordedthe usage, maintenance, calibration, and repair of instrumentation. These logbooks will beavailable to the MPCA or GLNPO during any audits that may be conducted.

Minnesota Slip QA Project Plan Section B
Revision No.: 0 01/03/00 Page 88
B8 INSPECTION/ACCEPTANCE REQUIREMENTS FOR SUPPLIES AND CONSUMABLES
B8.1 Purpose The purpose of this section is to establish and document a system for inspecting and accepting allsupplies and consumables that may directly or indirectly affect the quality of the project or task. B8.2 Identification of Critical Supplies and Consumables Critical supplies and consumables include sample bottles, calibration gases, reagents, hoses,materials for decontamination activities, deionized water, and Milli-Q water. Only pre-cleanedsample bottles will be used for this investigation as obtained by En Chem, Inc., ENSR, andMDH. Sample jars (60 mL) for particle-size analysis were purchased from VWR and werecertified clean to EPA standards. Each of the contract laboratories will utilize high quality supplies and consumables to reduce thechances of contaminating the samples. All water supply systems are tested on a regular basis, fornecessary procedures, to ensure it is acceptable for use. Solvent blanks are run to verify thepurity of solvents used in the organic analyses. The contract laboratories may also incorporateother measures, such as the dedicated use of glassware for certain analyses (e.g., inorganics,organics) or toxicity tests. In addition, En Chem, Inc. has a specially designed air handlingsystem and temperature controls to protect against contamination of samples and to keepinstruments functioning at their highest performance levels. B8.3 Establishing Acceptance Criteria Acceptance criteria must be consistent with overall project technical and quality criteria. Each ofthe contract laboratories should utilize their own acceptance criteria for normal operations withanalyzing and/or testing contaminated sediments. B8.4 Inspection of Acceptance Testing Requirements and Procedures Each contract laboratory should document inspections of acceptance testing, includingprocedures to be followed, individuals responsible, and frequency of evaluation. In addition,handling and storage conditions for supplies and consumables should be documented. B8.5 Tracking and Quality Verification of Supplies and Consumables Procedures should be established to ensure that inspections or acceptance testing of supplies andconsumables are adequately documented by permanent, dated, and signed records or logs thatuniquely identify the critical supplies or consumables, the date received, the date tested, the dateto be retested (if applicable), and the expiration date. These records should be kept by the

Minnesota Slip QA Project Plan Section B
Revision No.: 0 01/03/00 Page 89
responsible individual(s) at each contract laboratory. In order to track supplies and consumables,labels with the information on receipt and testing should be used. These or similar procedures should be established to enable project personnel to: 1) verify, priorto use, that critical supplies and consumables meet the project objectives; and 2) ensure thatsupplies and consumables that have not been tested, have expired, or do not meet acceptancecriteria are not used for the project. B9 DATA ACQUISITION REQUIREMENTS (NON-DIRECT MEASUREMENTS) B9.1 Purpose/Background Data collected from other MPCA investigations involving Minnesota Slip will be utilized in thisstudy. These previously collected data will include the results of various sediment chemistry andparticle size analyses, sediment toxicity tests, benthological community surveys, and sedimentbioaccumulation tests (Schubauer-Berigan and Crane, 1997; Crane et al., 1997; unpublished R-EMAP and MPCA data; AScI Corporation, 1999). These data will be utilized in a weight-of-evidence approach, with the data collected from this study, to make recommendations for furtheractions (e.g., remediation) at Minnesota Slip. Past data collection efforts in which the depth intervals of sediment chemistry analyses weresimilar to this study will be combined in the analysis of the data through sediment kriging. Thecomputer-generated kriging will result in color isopleths of contaminant concentrations forvarious depth intervals in the sediment. B9.2 Acquisition of Non-Direct Measurement Data The use of non-direct measurement data will be such that it is representative of newly acquireddata from Minnesota Slip, is not biased, and meets the precision specifications for this study.The non-direct measurement data will also be checked for any qualifiers. Since these previouslycollected data have been summarized in reports by the MPCA, the data summarization process isconsistent with the goals of this project. B10 DATA MANAGEMENT B10.1 Purpose/Background This section will present an overview of all mathematical operations and analyses performed onraw data to change their form of expression, location, quantity, or dimensionality. Theseoperations include data recording, validation, transformation, transmittal, reduction, analysis,management, storage, and retrieval.

Minnesota Slip QA Project Plan Section B
Revision No.: 0 01/03/00 Page 90
B10.2 Data Recording B10.2.1 Field Data Recording Field logbooks will be used to record data collection activities. As such, entries will bedescribed in as much detail as possible. The field logbooks will be bound notebooks withwaterproof paper. For this survey, one field notebook will be sufficient. The notebook will beassigned to the MPCA Principal Investigator and will be used by both her and the Field CrewLeader to record information. The title page of the filed notebook will contain the followinginformation: • Person to whom the notebook is assigned• Project name• Project start date and end date. Entries into the notebook will contain a variety of information. At the beginning of each entry,the date, start time, weather, names of all sampling team members present, level of personalprotection being used, and the signature of the person making the entry will be entered. Thenames of visitors to the site will also be recorded in the field notebook. The types of measurements made (e.g., GPS coordinates) and samples collected will be recorded.All entries will be made using permanent black ink, signed, and dated, and no erasures will bemade. If an incorrect entry is made, the information will be crossed out with a single strike markthat is signed and dated by the sampler. Whenever a sample is collected, or a measurement ismade, a detailed description of the location of the station, which includes GPS coordinates, willbe recorded. The number of photographs taken of the station, if any, will also be noted. Allequipment used to make measurements will be identified. A site-specific identification number(e.g., MNS-99-01) will be assigned to sampling sites prior to sample collection. B10.2.2 Laboratory Data Recording All raw analytical and toxicity data will be recorded in numerically identified laboratorynotebooks or data sheets. The data will be promptly recorded in black ink on appropriate formsthat are initialed and dated by the person collecting the data. Changes to recorded data are madein black ink, with a single line cross-out, initials, and date. No “whiteout” will be allowed. If a laboratory has the capability to directly enter or download the data into a computerized datalogger, then this is preferable. Sample data are recorded along with other pertinent information,such as the sample identification number. Other details which will also be recorded include: theanalytical method used (SOP #), name of analyst, the date of analysis or toxicity test, matrixsampled, reagent concentrations, instrument settings, and the raw data. Each page of thenotebook or data sheet will be signed and dated by the analyst. Copies of any strip chartprintouts (such as gas chromatograms) will be maintained on file. Periodic review of these

Minnesota Slip QA Project Plan Section B
Revision No.: 0 01/03/00 Page 91
notebooks by the Laboratory QA Officer will take place prior to final data reporting. Records ofnotebook entry inspections are maintained by the Laboratory QA Officer. B10.3 Data Validation This section addresses how the method, instrument, or system performs the function it isintended to consistently, reliably, and accurately in generating the data. This type of datavalidation would be shown by meeting acceptable QC limits for analytical parameters andsediment toxicity tests. In addition, the application of preventative maintenance activities andinternal QA/QC auditing will ensure that field and laboratory generated data will be valid. Quality control data (e.g., laboratory duplicates, matrix spikes, matrix spike duplicates, andperformance of negative controls) will be compared to the method acceptance criteria. Dataconsidered to be acceptable will be entered into the laboratory computer system. Datasummaries will be sent to the Laboratory QA Officer for review. If approved, data are loggedinto the project database format. Unacceptable data will be appropriately qualified in the projectreport. B10.4 Data Transformation Data transformations result from calculations based on instrument output, readings, or responses.The procedures for converting calibration readings into an equation that will be applied tomeasurement readings are given in the SOPs for analytical parameters (Appendix F). B10.5 Data Transmittal Data transmittal occurs when data are transferred from one person or location to another or whendata are copied from one form to another. Some examples of data transmittal are copying rawdata from a notebook onto a data entry form for keying into a computer file and electronictransfer of data over a computer network. The transmittal of field data will be double-checkedby the MPCA Principal Investigator. The transmittal of laboratory data will be checked by theindividual analyst with periodic checks by the Laboratory Project Manager and/or QA Officer. B10.6 Data Reduction Data reduction includes all processes that change the number of data items. Each contractlaboratory has their own data reduction techniques, as is usually documented in their QA Manual(Appendices H and I). For the toxicity tests, data reduction will involve taking the arithmeticmean of replicate data (e.g., number of surviving organisms). For the analytical results, datareduction will involve calculating the arithmetic mean and standard deviation of field andlaboratory replicates.

Minnesota Slip QA Project Plan Section B
Revision No.: 0 01/03/00 Page 92
B10.7 Data Analysis Data analysis will involve comparing the surficial contaminant concentrations to consensus-based sediment quality guidelines (Ingersoll and MacDonald, 1998) to look for exceedances ofthreshold effect concentrations (TECs) and probable effect concentrations (PECs). SigmaPlot®will be used to examine possible regression relationships between contaminant concentrationsand TOC and/or particle size. In addition, other chemical regression relationships, as done inCrane (1999a), will be investigated. The chemical data from this study will be merged withanalogous chemical data from previous sediment investigations in Minnesota Slip to allowsediment kriging to be done. The kriging relies on a triangulation of data points to generatecontaminant isopleths for similar depth intervals. The sediment toxicity data will be analyzed statistically, by ENSR, to evaluate whethersignificant, adverse effects to biotic endpoints (e.g., survival, growth, reproduction) occur whenthe test organisms are exposed to Minnesota Slip sediments. The statistical analysis techniquesare documented in the individual toxicity test SOPs (Appendix G). B10.8 Data Tracking Data management includes tracking the status of data as they are collected, transmitted, andprocessed. Each contract laboratory will have their own data tracking system in place. B10.9 Data Storage and Retrieval Each contract laboratory will have their own data storage and retrieval protocols. For example,data storage procedures at ENSR are documented in Section 8.4 of their QA Manual (AppendixH). The MPCA will retain all the analytical data packages and toxicity test reports in the projectfiles for this study. The time period for storage of MPCA files was given in Section A6.4. Inaddition, the sediment contaminant data will be added to GLNPO’s contaminated sedimentdatabase. This will allow for several retrieval options of the database.

Minnesota Slip QA Project Plan Section C
Revision No.: 0 01/03/00 Page 93
C ASSESSMENT/OVERSIGHT C1 ASSESSMENT C1.1 Purpose/Background During the planning process, many options for sampling design, sample handling, samplecleanup and analysis, and data reduction are evaluated and chosen for the project. In order toensure that the data collection is conducted as planned, a process of evaluation and validation isnecessary. This section of the QAPP describes the internal and external checks necessary toensure that: • All elements of the QAPP are correctly implemented as prescribed.• The quality of the data generated by implementation of the QAPP is adequate.• Corrective actions, when needed, are implemented in a timely manner and their effectiveness
is confirmed. The most important part of this section is documenting all planned internal assessments.Generally, internal assessments are initiated or performed by the Laboratory QA Officer. C1.2 Assessment Activities and Project Planning C1.2.1 Assessment of the Subsidiary Organizations Two types of assessments of the subsidiary organizations can be performed as described below. • Management Systems Review (MSR). A form of management assessment, this process is a
qualitative assessment of a data collection operation or organization to establish whether theprevailing quality management structure, policies, practices, and procedures are adequate forensuring that the type and quality of data needed are obtained. The MSR is used to ensurethat sufficient management controls are in place and carried out by the organization toadequately plan, implement, and assess the results of the project.
• Readiness Reviews. A readiness review is a technical check to determine if all componentsof the project are in place so that work can commence on a specific phase.
It is anticipated that a readiness review by each contract laboratory project manager will besufficient for this project. C1.2.2 Assessment of Project Activities Assessment of project activities can involve the following tasks: • Surveillance

Minnesota Slip QA Project Plan Section C
Revision No.: 0 01/03/00 Page 94
• Technical Systems Audit (TSA)• Performance Evaluation (PE)• Audit of Data Quality (ADQ)• Peer Review• Data Quality Assessment. It is anticipated that surveillance will be the primary assessment technique of project activities.This will most readily occur by the Project Manager and QA Officer of each contract laboratory. C1.3 Documentation of Assessments C1.3.1 Number, Frequency, and Types of Assessments Due to the short-term nature of this project for the contract laboratories, no types of assessmentsare planned other than general surveillance. Section 10.0 of ENSR’s QA Manual (Appendix H)and Section 13 of MDH’s QA Manual (Appendix I) provide more information about theperformance and systems audits they do on an internal basis. En Chem, Inc. also performsregular internal audits (Appendix J). C1.3.2 Assessment Personnel Internal audits of the contract laboratories are regularly performed by their respective QAOfficers, except for UMD which is a small laboratory. MDH, En Chem, Inc., and ENSR have allundergone certification programs, as detailed in their QA Manuals or Statement of Qualifications(Appendices H - J), which has involved external auditing. C1.3.3 Schedule of Assessment Activities No external audits, by the MPCA, will be conducted for this project. External audits, by theGLNPO QA Officer, is up to his discretion. The scheduling of regular internal audits at MDH,En Chem, Inc., and ENSR is at the discretion of the respective QA Officers. However, a specialaudit will not be needed for this project. C1.3.4 Reporting and Resolution of Issues Any audits or other assessments that reveal findings of practice or procedure that do not conformto the written QAPP need to be corrected as soon as possible. The Laboratory Project Managerand QA Officer need to be informed immediately of critical deviations that compromise theacceptability of the test. For noncritical deviations, they need to be informed by the nextbusiness day. Corrective actions should only be implemented after approval by the MPCA PrincipalInvestigator, or her designee, the Field Team Leader. If immediate corrective action is required,

Minnesota Slip QA Project Plan Section C
Revision No.: 0 01/03/00 Page 95
approvals secured by telephone from the MPCA Principal Investigator should be documented inan additional memorandum. For noncompliance problems, a formal corrective action program will be determined andimplemented at the time the problem is identified. The person who identifies the problem will beresponsible for notifying the MPCA Principal Investigator, who in turn will notify the GLNPOProject Officer. Implementation of corrective actions will be confirmed in writing through thesame channels. Any nonconformance with the established quality control procedures in the QAPP will beidentified and corrected in accordance with the QAPP. The GLNPO Project Officer, or hisdesignee, will issue a nonconformance report for each nonconformance condition. Corrective actions in the laboratory may occur prior to, during, and after initial analysis. Anumber of conditions, such as broken sample containers, multiple phases, and potentially highconcentration samples may be identified during sample log-in or just prior to analysis.Following consultation with laboratory analysts and section leaders, it may be necessary for theLaboratory QA Officer to approve the implementation of corrective actions. The submittedSOPs specify some conditions during or after analysis that may automatically trigger correctiveactions of samples, including additional sample extract cleanup and automaticreinjection/reanalysis when certain quality control criteria are not met (Appendix F). Corrective actions are required whenever an out-of-control event or potential out-of-controlevent is noted. The investigative action taken is somewhat dependent on the analysis and theevent. Laboratory personnel are alerted that corrective actions may be necessary if: • QC data are outside the warning or acceptable windows for precision and accuracy• Blanks contain target analytes above acceptable levels• Undesirable trends are detected in spike recoveries or RPD between duplicates• There are unusual changes in detection limits• QC limits for sediment toxicity tests are not met• Deficiencies are detected by the Laboratory, MPCA, and/or GLNPO QA Officer(s) during
any internal or external audits or from the results of performance evaluation samples• Inquires concerning data quality are received. Corrective action procedures are often handled at the bench level by the analyst, who reviews thepreparation or extraction procedure for possible errors, checks the instrument calibration, spikeand calibration mixes, instrument sensitivity, experimental set-up for toxicity tests, and so on. Ifthe problem persists or cannot be identified, the matter is referred to the Laboratory ProjectManager and/or Laboratory QA Officer for further investigation. Once resolved, fulldocumentation of the corrective action procedure is filed with the Laboratory QA Officer.

Minnesota Slip QA Project Plan Section C
Revision No.: 0 01/03/00 Page 96
These corrective actions are performed prior to release of the data from the laboratory. Thecorrective actions will be documented in both the laboratories corrective action log and thenarrative data report sent from the laboratory to the MPCA Principal Investigator. If correctiveaction does not rectify the situation, the laboratory will contact the MPCA Principal Investigator. C2 REPORTS TO MANAGEMENT C2.1 Purpose/Background This section will identify the frequency and distribution of reports issued to inform managementof the status of the project, including QA/QC issues. C2.2 Frequency, Content, and Distribution of Reports The MPCA Principal Investigator will submit quarterly reports to the GLNPO Project Officer forthe quarters ending on September 30, December 31, March 31, and June 30. Each of the contractlaboratory Project Managers will need to submit a short project update to the MPCA PrincipalInvestigator by December 31, 1999; March 31, 2000; and June 30, 2000. The project updatescan be sent via email and need to document how many samples have been analyzed for variousparameters or how many toxicity tests have been run. In addition, any problems encounteredshould be documented, and plans for the next quarter need to be mentioned. C2.3 Identify Responsible Organizations Written QC reports will be provided to the MPCA Principal Investigator, by the personsidentified in Section A1.2, whenever sample measurements are reported. These reports willsummarize QA/QC programs, give detailed results of analysis of QC samples, and provideinformation on the precision, accuracy, and completeness for each sample run. These writtenreports will note any significant QA/QC problems encountered during sample analyses, as wellas state the corrective actions taken. Any serious QA problems needing immediate decisionswill be discussed orally between MPCA personnel and contract staff, with such discussionsdenoted in writing; these problems will be noted in the quarterly reports to the GLNPO ProjectOfficer. MPCA will provide summary QA/QC information in the final written report to GLNPO. Thisreport will include information on adherence of measurements to the QA objectives. The finalreport will contain detailed discussions of QA/QC issues, including any changes in the QAPP, asummary of the contract laboratories QA/QC reports, results of any internal performance audits,

Minnesota Slip QA Project Plan Section C
Revision No.: 0 01/03/00 Page 97
any significant QA/QC problems, detailed information on how well the QA objectives were met,and their ultimate impact on decision making. The following is a list of items to be included inthe final project report: • Changes in the QAPP• Results of any internal system audits• Significant QA/QC problems, recommended solutions, and results of corrective actions• Data quality assessment in terms of precision, accuracy, representativeness, completeness,
and sensitivity• Indication of fulfillment of QA objectives• Limitations on the use of the measurement data.

Minnesota Slip QA Project Plan Section D
Revision No.: 0 01/03/00 Page 98
D DATA VALIDATION AND USABILITY D1 DATA REVIEW, VALIDATION, AND VERIFICATION REQUIREMENTS D1.1 Purpose/Background The purpose of this section is to state the criteria for deciding the degree to which each data itemhas met its quality specifications as described in Section B. The potential effect that eachdeviation from a QAPP may have on the usability of the associated data item, its contribution tothe quality of the reduced and analyzed data, and its effect on the decision should be estimated. D1.2 Sampling Design How closely a measurement represents the actual environment at a given time and location is acomplex issue that is considered during development of Section B1. Acceptable tolerances foreach critical sample coordinate and the action to be taken if the tolerances are exceeded shouldbe specified in Section B1. Each sample should be checked for conformity to the specifications, including type and location(spatial and temporal). By noting the deviations in sufficient detail, subsequent data users willbe able to determine the data’s usability under scenarios different from those included in projectplanning. D1.3 Sample Collection Procedures Details of how a sample is separated from its native time/space location are important forproperly interpreting the measurement results. Section B2 provided these details, which includedsampling and ancillary equipment and procedures (including equipment decontamination).Acceptable departures (for example, alternative equipment) from the QAPP, and the action if therequirements cannot be satisfied, should be specified for each critical aspect. Validationactivities should note potentially unacceptable departures from the QAPP. Comments from fieldsurveillance on deviations from written sampling plans also should be noted. D1.4 Sample Handling Details of how a sample is physically treated and handled during relocation from its original siteto the actual measurement site are extremely important. Correct interpretation of the subsequentmeasurement results requires that deviations from Section B3 of the QAPP and the actions takento minimize or control the changes, be detailed. Data collection activities should indicate eventsthat occur during sampling handling that may affect the integrity of the samples. The MPCA Principal Investigator has evaluated the sample containers and the preservationmethods to be used and has ensured that they are appropriate to the nature of this project.

Minnesota Slip QA Project Plan Section D
Revision No.: 0 01/03/00 Page 99
Checks on the identity of the sample (e.g., proper labeling and chain-of-custody records), as wellas proper physical storage conditions (e.g., chain-of-custody and storage records) will be made toensure that the sample continues to be representative of its native environment as it movesthrough the analytical process. D1.5 Analytical Procedures Each sample will be verified to ensure that the procedures used to generate the data (as identifiedin Section B4 of the QAPP) were implemented as specified. Acceptance criteria will bedeveloped for important components of the procedures, along with suitable codes forcharacterizing each sample’s deviation from the procedure. Data validation activities shoulddetermine how seriously a sample deviated beyond the acceptable limit so that the potentialeffects of the deviation can be evaluated during DQA. D1.6 Quality Control Section B5 of the QAPP specified the QC checks that are to be performed during samplecollection, handling, and analysis. These include analysis of check standards, blanks, spikes, andreplicates, which provide indications of the quality of data being produced by specifiedcomponents of the measurement process. For each specified QC check, the procedure,acceptance criteria, and corrective action (and changes) should be specified. Data validationshould document the corrective actions that were taken, which samples were affected, and thepotential effect of the actions on the validity of the data. D1.7 Calibration Section B7 addressed the calibration of instruments and equipment and the information thatshould be presented to ensure that the calibrations: • Were performed within an acceptable time prior to generation of measurement data• Were performed in the proper sequence• Included the proper number of calibration points• Were performed using standards that “bracketed” the range of reported measurement results
(otherwise, results falling outside the calibration range are flagged as such)• Had acceptable linearity checks and other checks to ensure that the measurement system was
stable when the calibration was performed. When calibration problems are identified, any data produced between the suspect calibrationevent and any subsequent recalibration should be flagged to alert data users.

Minnesota Slip QA Project Plan Section D
Revision No.: 0 01/03/00 Page 100
D1.8 Data Reduction and Processing Checks on data integrity evaluate the accuracy of “raw” data and include the comparison ofimportant events and the duplicate rekeying of data to identify data entry errors. Data reduction is an irreversible process that involves a loss of detail in the data and, for thisproject, will involve averaging across space (e.g., compositing results from field replicates). Forthis project, all contract laboratory calculations will be checked by the Laboratory ProjectManager. Errors will be noted and corrected by crossing out the original notations. Analyticalresults for sediment samples will be calculated and reported on a dry weight basis. Any manipulations of the data (e.g., normalization of organic data to TOC, comparisons tosediment quality objectives resulting in the calculation of relative contamination factors, orsummary statistics of chemical parameters for different depth intervals) will be double-checkedthat the formulas were set up correctly in the Excel spreadsheets. In addition, sediment krigingfigures, that will be generated in color, will be double-checked that the contaminant isopleths arerepresentative of the sampling point data. Various tables and charts will be used to synthesize the project results in the draft report. TheMPCA Principal Investigator will be responsible for double-checking the information containedin these tables and figures. D2 VALIDATION AND VERIFICATION METHODS D2.1 Purpose/Background The purpose of this section is to describe, in detail, the process for validating (determining if datasatisfy QAPP-defined user requirements) and verifying (ensuring that conclusions can becorrectly drawn) project data. The amount of data validated is directly related to the DQOsdeveloped for the project. D2.2 Process for Validating and Verifying Data D2.2.1 Procedures Used to Validate Field Data Procedures to evaluate field data for this project primarily include checking for transcriptionerrors and reviewing field notebooks. This task will be the responsibility of the MPCA PrincipalInvestigator. D2.2.2 Procedures Used to Validate Laboratory Data The respective Laboratory QA Officer will conduct a systematic review of the analytical data forcompliance with the established QC criteria based on the spike, duplicate, and blank results

Minnesota Slip QA Project Plan Section D
Revision No.: 0 01/03/00 Page 101
provided by the laboratory. All technical holding times will be reviewed, the GC/MS andGC/ECD instrument performance check sample results will be evaluated, and results of initialand continuing calibration will be reviewed and evaluated. The ENSR Laboratory QA Officerwill conduct a similar systematic review of the toxicity data to ensure the test acceptabilityrequirements listed in Table B-9 and B-12 have been met. One hundred percent of the analyticaland toxicity data will be validated. The data review will identify any out-of-control data points and data omissions, and theLaboratory QA Officer will interact with the laboratory to correct data deficiencies. Decisions torepeat sample collection and analysis may be made by the MPCA Principal Investigator based onthe extent of the deficiencies and their importance in the overall context of the project. D3 RECONCILIATION WITH DATA QUALITY OBJECTIVES D3.1 Purpose/Background The purpose of this section is to outline and specify, if possible, the acceptable methods forevaluating the results obtained from the project. This section includes scientific and statisticalevaluations of data to determine if the data are of the right type, quantity, and quality to supporttheir intended use. D3.2 Reconciling Results with DQOs Data quality assessment (DQA) follows the data validation and verification steps. As such, DQAdetermines how well the validated data can support their intended use. The MPCA PrincipalInvestigator will evaluate the data to determine if it will meet the data quality objectivesspecified in Section A4.

Minnesota Slip QA Project Plan Section E
Revision No.: 0 01/03/00 Page 102
E REFERENCES AScI Corporation. 1999. Summary of test results determining potential mercury, PAH and PCB
bioaccumulation by Lumbriculus variegatus exposed to St. Louis Bay sediment samples.AScI Corporation, Duluth, MN.
Breneman, D., Richards, C. and Lozano, C. In Press. Environmental influences on benthic
community structure in a Great Lakes embayment. (accepted for publication in J. GreatLakes Res.)
Crane, J. L. 1999a. Assessment of contaminated sediments in Slip C, Duluth Harbor,
Minnesota. U.S. Environmental Protection Agency, Great Lakes National ProgramOffice, Chicago, IL. EPA-905-R-99-007.
Crane, J. L. 1999b. Quality assurance project plan (QAPP): Bioaccumulation of contaminants
in the Duluth/Superior Harbor. Revision: 0. Environmental Outcomes Division,Minnesota Pollution Control Agency, St. Paul, MN.
Crane, J. L. 1999c. Quality assurance project plan (QAPP): Sediment remediation scoping
project for Minnesota Slip, Duluth Harbor. Revision: 0. Environmental OutcomesDivision, Minnesota Pollution Control Agency, St. Paul, MN.
Crane, J. L., Schubauer-Berigan, M., and Schmude, K. 1997. Sediment assessment of hotspot
areas in the Duluth/Superior Harbor. U.S. Environmental Protection Agency, GreatLakes National Program Office, Chicago, IL. EPA-905-R97-020.
ENSR. 1996. St. Louis River July 1995 field investigation. ENSR Consulting and Engineering,
St. Louis Park, MN. Document Number 5480-005-400. Glass, G. E., Sorensen, J. A., Schmidt, K. W., and Rapp, Jr., G. R. 1990. New source
identification of mercury contamination in the Great Lakes. Environ. Sci. Technol.24:1059-1069.
Glass, G. E., Sorensen, J. A., Rapp, Jr., G. R., Balcer, M., and Schwarzkopf, L. 1998. Mercury
sub-surface maxima in sediments: A diagnostic for anthropogenic origins. In: Mercurycontaminated sites: Characterization, risk, and remediation, eds. Ebinghaus, Turner,Lacerda, Vasiliev, and Solomons, pp. 467-486. Springer-Verlag Heidelberg.
IJC (International Joint Commission). 1989. Great Lakes water quality agreement of 1978 (as
amended by Protocol signed November 18, 1987). International Joint Commission,Windsor, ON.

Minnesota Slip QA Project Plan Section E
Revision No.: 0 01/03/00 Page 103
Ingersoll, C. G. and MacDonald, D. D. 1998. An assessment of sediment injury in the WestBranch of the Grand Calumet River. Volume I. Columbia Environmental ResearchCenter, United States Geological Survey, Columbia, MO and MacDonald EnvironmentalSciences Ltd., Ladysmith, BC.
Ingersoll, C. G., Brunson, E. L., Dwyer, F. J., Hardesty, D. K., and Kemble, N. E. 1998. Use of
sublethal endpoints in sediment toxicity tests with the amphipod Hyalella azteca.Environ. Toxicol. Chem. 17:1508-1523.
IT Corporation. 1997. Remedial investigation data report, sediment operable unit, St. Louis
River/Interlake/Duluth Tar site, Duluth, Minnesota. Volume I of V. IT Corporation, St.Paul, MN.
King, P. 1999. Quality assurance project plan (QAPP): Analysis of sediment cores to assess
toxaphene in the St. Louis River. Revision: 0. Environmental Outcomes Division,Minnesota Pollution Control Agency, St. Paul, MN.
Lubin, A. N., Williams, M. H., and Lin, J. C. 1995. Statistical techniques applied to sediment
sampling. U.S. Environmental Protection Agency, Region 5, Chicago, IL. MacDonald, D. D. and Crane, J. L. 1999. Development of an ecosystem-based approach to the
assessment and management of contaminated sediments in the St. Louis River Area ofConcern. (In review at J. Great Lakes Res.)
MacDonald, D., Ingersoll, C., and Crane, J. 1998. An ecoysystem-based framework for
assessing sediment quality in the Great Lakes basin. In: A Short Course on Collection,Analysis, and Interpretation of Sediment Quality Data: Applications of Sediment QualityGuidelines (SQGs) and Various Companion Tools, November 3-4, 1998, Chicago, IL.
MPCA and WDNR (Minnesota Pollution Control Agency and Wisconsin Department of Natural
Resources). 1992. The St. Louis River system remedial action plan. Stage One.Minnesota Pollution Control Agency, St. Paul, MN and Wisconsin Department of NaturalResources, Madison, WI.
MPCA and WDNR. 1995. The St. Louis River system remedial action plan. Progress report.
Minnesota Pollution Control Agency, St. Paul, MN and Wisconsin Department of NaturalResources, Madison, WI.
Prater, B. and Anderson, M. 1977. A 96-hour sediment bioassay of Duluth and Superior Harbor
basins (Minnesota) using Hexagenia limbata, Asellus communis, Daphnia magna, andPimephales promelas as test organisms. Bull. Environ. Contam. Toxicol. 18:159-169.
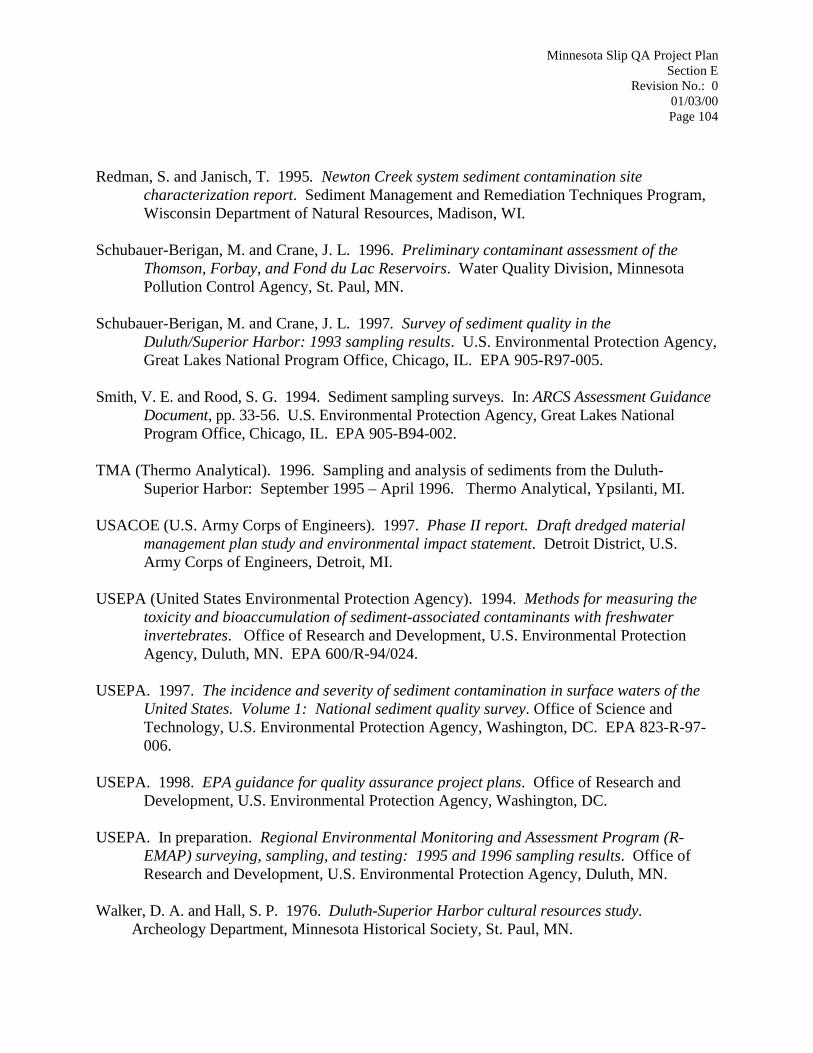
Minnesota Slip QA Project Plan Section E
Revision No.: 0 01/03/00 Page 104
Redman, S. and Janisch, T. 1995. Newton Creek system sediment contamination sitecharacterization report. Sediment Management and Remediation Techniques Program,Wisconsin Department of Natural Resources, Madison, WI.
Schubauer-Berigan, M. and Crane, J. L. 1996. Preliminary contaminant assessment of the
Thomson, Forbay, and Fond du Lac Reservoirs. Water Quality Division, MinnesotaPollution Control Agency, St. Paul, MN.
Schubauer-Berigan, M. and Crane, J. L. 1997. Survey of sediment quality in the
Duluth/Superior Harbor: 1993 sampling results. U.S. Environmental Protection Agency,Great Lakes National Program Office, Chicago, IL. EPA 905-R97-005.
Smith, V. E. and Rood, S. G. 1994. Sediment sampling surveys. In: ARCS Assessment Guidance
Document, pp. 33-56. U.S. Environmental Protection Agency, Great Lakes NationalProgram Office, Chicago, IL. EPA 905-B94-002.
TMA (Thermo Analytical). 1996. Sampling and analysis of sediments from the Duluth-
Superior Harbor: September 1995 – April 1996. Thermo Analytical, Ypsilanti, MI. USACOE (U.S. Army Corps of Engineers). 1997. Phase II report. Draft dredged material
management plan study and environmental impact statement. Detroit District, U.S.Army Corps of Engineers, Detroit, MI.
USEPA (United States Environmental Protection Agency). 1994. Methods for measuring the
toxicity and bioaccumulation of sediment-associated contaminants with freshwaterinvertebrates. Office of Research and Development, U.S. Environmental ProtectionAgency, Duluth, MN. EPA 600/R-94/024.
USEPA. 1997. The incidence and severity of sediment contamination in surface waters of theUnited States. Volume 1: National sediment quality survey. Office of Science andTechnology, U.S. Environmental Protection Agency, Washington, DC. EPA 823-R-97-006.
USEPA. 1998. EPA guidance for quality assurance project plans. Office of Research and
Development, U.S. Environmental Protection Agency, Washington, DC. USEPA. In preparation. Regional Environmental Monitoring and Assessment Program (R-
EMAP) surveying, sampling, and testing: 1995 and 1996 sampling results. Office ofResearch and Development, U.S. Environmental Protection Agency, Duluth, MN.
Walker, D. A. and Hall, S. P. 1976. Duluth-Superior Harbor cultural resources study.
Archeology Department, Minnesota Historical Society, St. Paul, MN.

Minnesota Slip QA Project Plan Section E
Revision No.: 0 01/03/00 Page 105
WDNR (Wisconsin Department of Natural Resources). 1995. Guidance for sedimentassessment in the state of Wisconsin. Wisconsin Department of Natural Resources, Bureauof Water Resources, Madison, WI.
Wenck Associates. 1995. Harbor sediment sampling documentation report. Wenck Associates,
Inc., Maple Plain, MN. Wenck File #0057-28.

Minnesota Slip QA Project Plan Appendix A
Revision No.: 0 01/03/00 Page A-1
APPENDIX A
DOCUMENTED STORM WATER DISCHARGES TO MINNESOTA SLIP

Minnesota Slip QA Project Plan Appendix B
Revision No.: 0 01/03/00 Page B-1
APPENDIX B
CONTINGENCY TABLES (MACDONALD ET AL., 1998)

Minnesota Slip QA Project Plan Appendix C
Revision No.: 0 01/03/00 Page C-1
APPENDIX C
GLNPO’s SOP FOR OPERATING THE VIBROCORER

Minnesota Slip QA Project Plan Appendix D
Revision No.: 0 01/03/00 Page D-1
APPENDIX D
GLNPO’s FIELD SAFETY PLAN FOR MINNESOTA SLIP

Minnesota Slip QA Project Plan Appendix E
Revision No.: 0 01/03/00 Page E-1
APPENDIX E
MPCA EQUIPMENT DECONTAMINATION SOP

Minnesota Slip QA Project Plan Appendix E
Revision No.: 0 01/03/00 Page E-2
Minnesota Pollution Control Agency’s Decontamination SOP The purpose of this standard operating procedure (SOP) is to define decontamination proceduresfor field equipment used for collecting soil, sediment, and water samples. Techniques forridding equipment of both metals and organic contaminants are discussed. Sampling equipmentis decontaminated between each sampling event to avoid cross contamination of samples and tohelp maintain a healthy working environment. Protective clothing is worn by all fieldtechnicians during sampling and decontamination as described in the health and safety plan. It is the responsibility of the field sampling coordinator to assure that proper decontaminationprocedures are followed and that all waste materials produced by decontamination are properlymanaged. It is the responsibility of the project safety officer to draft and enforce safetymeasures that provide the best protection for all person involved directly with sampling ordecontamination. All subcontractors (e.g., drilling contractors) are required to follow thedecontamination procedures specified in the contract, the health and safety plan, and this SOP. Individuals involved in sampling and /or decontamination are responsible for maintaining a cleanworking environment and ensuring that contaminants are not introduced to the environment All equipment will be decontaminated using a series of washes and rinses designed to removematerials of interest without leaving residues that will in any way interfere with analysis of thesamples taken with that equipment. In addition, the decontamination site will be set up at alocation separate from the sampling area in order to isolate these two activities. Field equipment blanks will be taken at a frequency of 5 percent of samples and sent to thelaboratory(s) for analysis along with regular samples. These blanks will serve as a qualityassurance indicator of possible cross contamination of samples. When feasible, samples to betaken with the same equipment will be taken in order from lowest to highest suspectedcontaminant levels to minimize the chances of cross contamination. The following is a list of materials that are required on site to support decontamination. Thequantity and actual use of each item will be dependent on the overall size and nature of thesampling effort. • Cleaning liquids and dispensers: soap and/or phosphate free detergent solutions, tap water,
methanol, 10 percent nitric acid, distilled/deionized water • Personal safety gear as defined in the project health and safety plan • Chemical-free paper towels and/or tissues • Powder-free disposable latex gloves

Minnesota Slip QA Project Plan Appendix E
Revision No.: 0 01/03/00 Page E-3
• Waste storage containers: drums, boxes, plastic bags • Plastic ground cloth on which to lay clean equipment • Cleaning containers: plastic and/or galvanized steel tubs and buckets • Cleaning brushes with non-contaminating stiff bristles • Steam cleaning apparatus (supplied by drilling contractor).
The materials used in decontamination activities are located a minimum of 15-30 feet downwindof the sampling site as designated by the task leader. Decontamination will be carried out beforemoving to the next sampling site to avoid transporting contaminants.
PROCEDURES
Regardless of the type of contamination that requires removal, the basic steps involved are thesame. Procedures unique to organic, metal, and organic/metal combined contamination arediscussed in their respective sections that follow.
Step 1: Gross Removal of Material
Steam Cleaning
Depending on the availability of apparatus (e.g., drilling operations), steam cleaning combinedwith brushing is the preferred method of initial material removal. Using steam alone introduceslittle further contamination, and is a very efficient way of removing materials. Equipment suchas spatulas, split spoons, and drill flights are placed in and/or suspended over tubs that catchcontaminated wash waters for proper disposal.
Detergent Wash
In cases where steam apparatus is not available, a phosphate free detergent wash and tap waterrinse may be used. A detergent bath is formulated in a tub large enough to hold the equipment tobe washed leaving enough volume to hold the tap water rinses. All material is brushed from theequipment into the tub. The equipment is rinsed with tap water while suspended over the washtub. Because detergents can contain low levels of interfering contaminants for both organic andmetals analysis, the thoroughness of the final rinse in this step is of utmost importance. Whenthe analyte levels in the samples to be taken by the decontaminated equipment are suspected tobe very low (e.g., background level), it is recommended that the detergent wash be replaced by adistilled water wash or steam cleaning when available, followed by a decontamination equipmentblank as described below.

Minnesota Slip QA Project Plan Appendix E
Revision No.: 0 01/03/00 Page E-4
Step 2: Specific Contaminant Removal
Organic Contaminants
For removal of general organic contaminants, the solvent of choice is methanol because a) itdissolves all contaminants of concern and b) it is miscible with water which means it can beremoved with a water rinse. The equipment is suspended over a tub and rinsed from the topdown with high purity methanol delivered by peristaltic pump for large pieces, or a squirt bottlefor smaller pieces. Rinse wastes are disposed of according to the project health and safety plan.
Metal Contaminants
Metals require acid solvents for efficient removal. Nitric acid is the acid of choice because of itsability to dissolve all of the metals of concern. The equipment is suspended over a tub andrinsed from the top down with 10 percent nitric acid delivered by peristaltic pump for largepieces, or a squirt bottle for smaller pieces. Rinse wastes are disposed of according to the projecthealth and safety plan.
Combined Organic/Metals Contaminants
When equipment will be used to take samples that will be analyzed for both metal and organicconstituents, the acid rinse is performed followed by the methanol rinse, each as describedabove. Due to the difficulty in obtaining organics free acids, and the ease of obtaining metalsfree methanol, the order of the two rinses must not be reversed.
Step 3: Final Distilled/Deionized Water Rinse
A final rinse with distilled/deionized water is carried out last to remove the contaminant specificsolvents (i.e., nitric acid and/or methanol). Because these solvents may themselves interfere withsample analyses, this step is very important and must be carried out thoroughly. The equipmentis suspended over a waste tub, and rinsed from the top down with distilled/deionized waterdelivered by pump of squirt bottle, depending on equipment size. In the case of metalsdecontamination, a simple pH monitoring technique (e.g., pH paper) may be used to monitorrinse water in determining rinse completion.
Step 4: Air Dry
Before an equipment blank is taken, the equipment is laid out on a clean plastic ground cloth andallowed to dry. The equipment should be protected from gross contamination during the dryingprocess.

Minnesota Slip QA Project Plan Appendix E
Revision No.: 0 01/03/00 Page E-5
Equipment Blanks
Equipment Blanks are taken between selected samplings as described in the sampling andAnalysis Plan. Equipment is rinsed with distilled water that is subsequently collected in asample container. The rinsate sample is then labeled and shipped as a blind sample to thelaboratory(s) with regular samples. One blank is created in this way for each analysis to beperformed on samples taken with this equipment unless otherwise stated in the quality assuranceplan. The equipment should be protected from contamination between the time the blank istaken and the time the next sample is collected.

Minnesota Slip QA Project Plan Appendix F
Revision No.: 0 01/03/00 Page F-1
APPENDIX F
ANALYTICAL SOPs

Minnesota Slip QA Project Plan Appendix G
Revision No.: 0 01/03/00 Page G-1
APPENDIX G
TOXICITY TESTING SOPS

Minnesota Slip QA Project Plan Appendix H
Revision No.: 0 01/03/00 Page H-1
APPENDIX H
ENSR’S QA MANUAL

Minnesota Slip QA Project Plan Appendix I
Revision No.: 0 01/03/00 Page I-1
APPENDIX I
MDH’S QA MANUAL

Minnesota Slip QA Project Plan Appendix J
Revision No.: 0 01/03/00 Page J-1
APPENDIX J
EN CHEM, INC.’s STATEMENT OF QUALIFICATIONS